
Relationship between Dietary Patterns and Subjectively Measured Physical Activity in Japanese Individuals 85 Years and Older: A Cross-Sectional Study

 , ,
, ,
Abstract
:1. Introduction
2. Methods
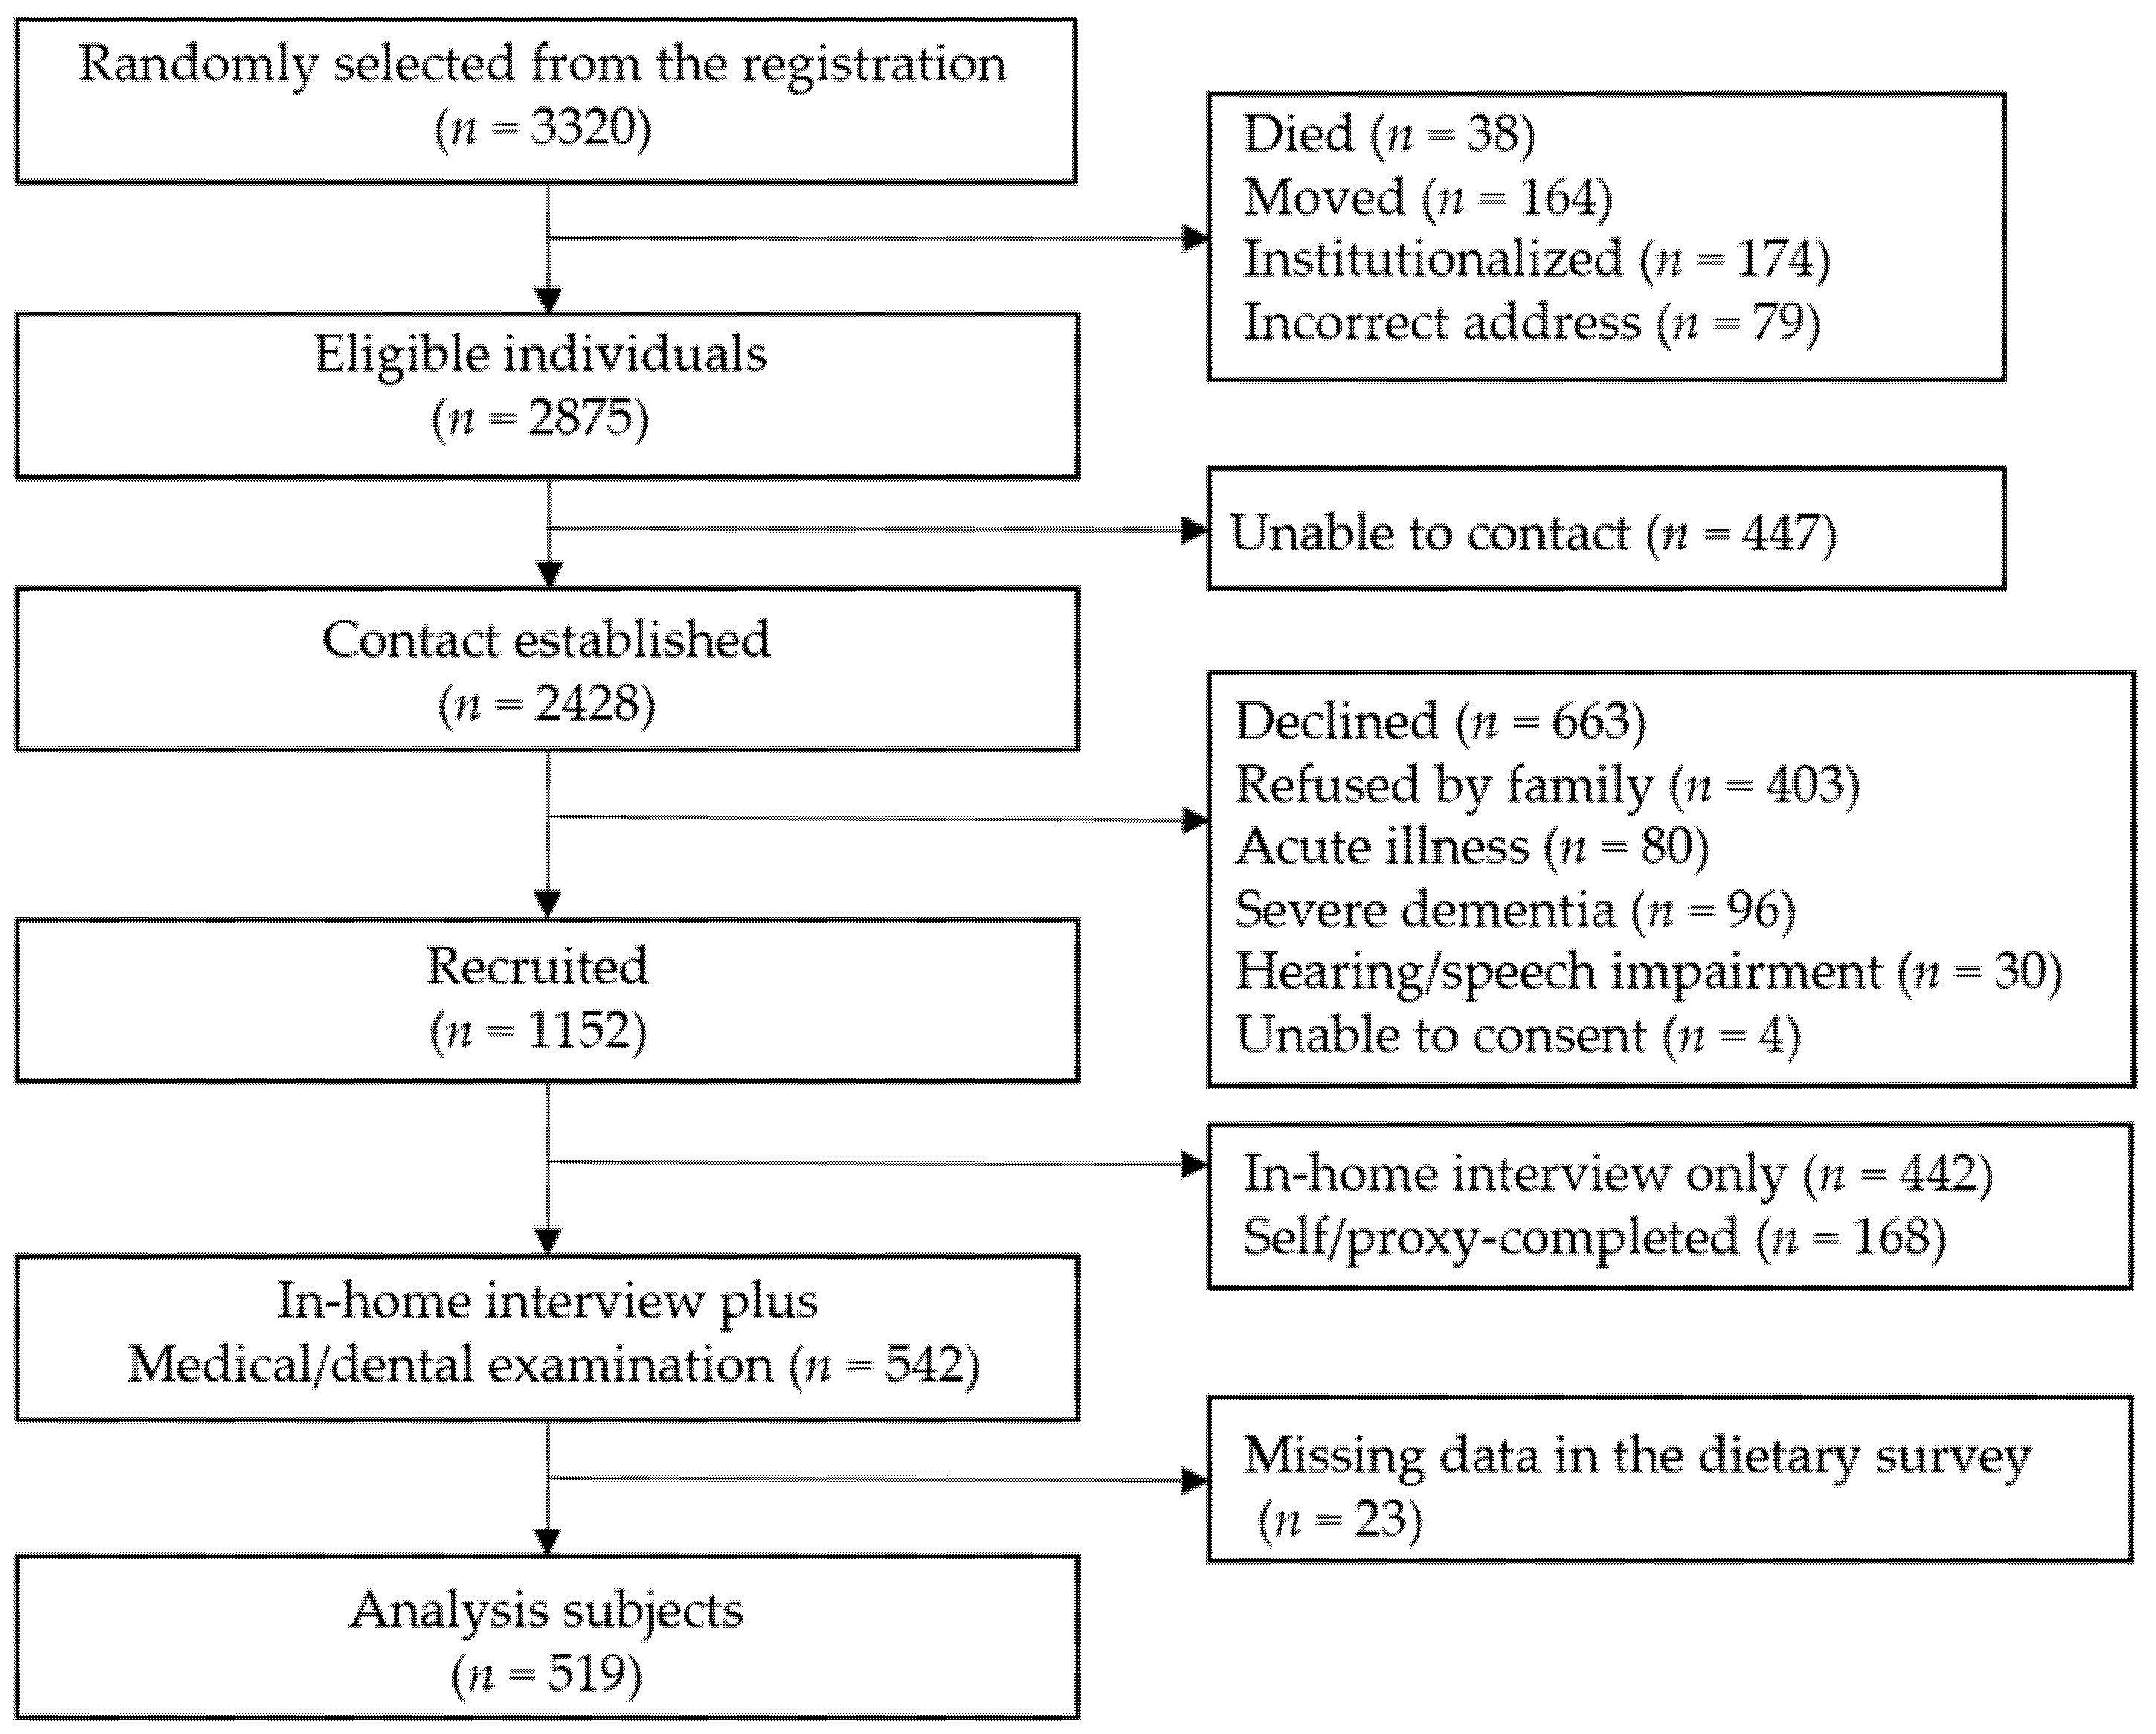
2.1. Study Population
2.2. Diet Survey and Identification of Dietary Patterns
2.3. Physical Activity
2.4. Assessment of Covariates
2.5. Statistical Analysis
3. Results
4. Discussion
Study Strengths and Limitations
5. Conclusions
Supplementary Materials
Author Contributions
Funding
Institutional Review Board Statement
Informed Consent Statement
Data Availability Statement
Acknowledgments
Conflicts of Interest
References
- Kremers, S.P.; Visscher, T.L.; Seidell, J.C.; van Mechelen, W.; Brug, J. Cognitive determinants of energy balance-related behaviours: Measurement issues. Sports Med. 2005, 35, 923–933. [Google Scholar] [CrossRef] [PubMed]
- Whitehead, B.R. Health behaviors in older adults: Considering age, affect, and attitudes. J. Health Psychol. 2017, 22, 1652–1657. [Google Scholar] [CrossRef] [PubMed]
- Borda, M.G.; Pérez-Zepeda, M.U.; Samper-Ternent, R.; Gómez, R.C.; Avila-Funes, J.A.; Cano-Gutierrez, C.A. The Influence of Lifestyle Behaviors on the Incidence of Frailty. J. Frailty Aging 2020, 9, 144–149. [Google Scholar] [CrossRef] [PubMed]
- Phulkerd, S.; Thapsuwan, S.; Chamratrithirong, A.; Gray, R.S. Influence of healthy lifestyle behaviors on life satisfaction in the aging population of Thailand: A national population-based survey. BMC Public Health 2021, 21, 43. [Google Scholar] [CrossRef]
- Puterman, E.; Lin, J.; Krauss, J.; Blackburn, E.H.; Epel, E.S. Determinants of telomere attrition over 1 year in healthy older women: Stress and health behaviors matter. Mol. Psychiatry 2015, 20, 529–535. [Google Scholar] [CrossRef] [PubMed]
- Lyu, J.; Lee, S.H.; Kim, H.Y. Associations between healthy lifestyles and health outcomes among older Koreans. Geriatr. Gerontol. Int. 2016, 16, 663–669. [Google Scholar] [CrossRef]
- Hotta, R.; Makizako, H.; Doi, T.; Tsutsumimoto, K.; Nakakubo, S.; Makino, K.; Suzuki, T.; Shimada, H. Healthy Behaviors and Incidence of Disability in Community-Dwelling Elderly. Am. J. Health Behav. 2018, 42, 51–58. [Google Scholar] [CrossRef]
- Abe, T.; Nofuji, Y.; Seino, S.; Murayama, H.; Yoshida, Y.; Tanigaki, T.; Yokoyama, Y.; Narita, M.; Nishi, M.; Kitamura, A.; et al. Healthy lifestyle behaviors and transitions in frailty status among independent community-dwelling older adults: The Yabu cohort study. Maturitas 2020, 136, 54–59. [Google Scholar] [CrossRef]
- Seino, S.; Nofuji, Y.; Yokoyama, Y.; Abe, T.; Nishi, M.; Yamashita, M.; Narita, M.; Hata, T.; Shinkai, S.; Kitamura, A.; et al. Combined Impacts of Physical Activity, Dietary Variety, and Social Interaction on Incident Functional Disability in Older Japanese Adults. J. Epidemiol. 2021; ahead of print. [Google Scholar]
- Allès, B.; Samieri, C.; Féart, C.; Jutand, M.A.; Laurin, D.; Barberger-Gateau, P. Dietary patterns: A novel approach to examine the link between nutrition and cognitive function in older individuals. Nutr. Res. Rev. 2012, 25, 207–222. [Google Scholar] [CrossRef] [Green Version]
- Dominguez, L.J.; Veronese, N.; Baiamonte, E.; Guarrera, M.; Parisi, A.; Ruffolo, C.; Tagliaferri, F.; Barbagallo, M. Healthy Aging and Dietary Patterns. Nutrients 2022, 14, 889. [Google Scholar] [CrossRef]
- Murakami, K.; Shinozaki, N.; Fujiwara, A.; Yuan, X.; Hashimoto, A.; Fujihashi, H.; Wang, H.C.; Livingstone, M.B.E.; Sasaki, S. A Systematic Review of Principal Component Analysis-Derived Dietary Patterns in Japanese Adults: Are Major Dietary Patterns Reproducible Within a Country? Adv. Nutr. 2019, 10, 237–249. [Google Scholar] [CrossRef] [PubMed]
- Bloom, I.; Shand, C.; Cooper, C.; Robinson, S.; Baird, J. Diet Quality and Sarcopenia in Older Adults: A Systematic Review. Nutrients 2018, 10, 308. [Google Scholar] [CrossRef] [PubMed] [Green Version]
- Posadzki, P.; Pieper, D.; Bajpai, R.; Makaruk, H.; Könsgen, N.; Neuhaus, A.L.; Semwal, M. Exercise/physical activity and health outcomes: An overview of Cochrane systematic reviews. BMC Public Health 2020, 20, 1724. [Google Scholar] [CrossRef] [PubMed]
- Reiner, M.; Niermann, C.; Jekauc, D.; Woll, A. Long-term health benefits of physical activity—A systematic review of longitudinal studies. BMC Public Health 2013, 13, 813. [Google Scholar] [CrossRef] [Green Version]
- Bull, F.C.; Al-Ansari, S.S.; Biddle, S.; Borodulin, K.; Buman, M.P.; Cardon, G.; Carty, C.; Chaput, J.P.; Chastin, S.; Chou, R.; et al. World Health Organization 2020 guidelines on physical activity and sedentary behaviour. Br. J. Sports Med. 2020, 54, 1451–1462. [Google Scholar] [CrossRef]
- Leal-Martín, J.; Muñoz-Muñoz, M.; Keadle, S.K.; Amaro-Gahete, F.; Alegre, L.M.; Mañas, A.; Ara, I. Resting Oxygen Uptake Value of 1 Metabolic Equivalent of Task in Older Adults: A Systematic Review and Descriptive Analysis. Sports Med. 2022, 52, 331–348. [Google Scholar] [CrossRef]
- Geidl, W.; Schlesinger, S.; Mino, E.; Miranda, L.; Pfeifer, K. Dose-response relationship between physical activity and mortality in adults with noncommunicable diseases: A systematic review and meta-analysis of prospective observational studies. Int. J. Behav. Nutr. Phys. Act. 2020, 17, 109. [Google Scholar] [CrossRef]
- Gebreslassie, M.; Sampaio, F.; Nystrand, C.; Ssegonja, R.; Feldman, I. Economic evaluations of public health interventions for physical activity and healthy diet: A systematic review. Prev. Med. 2020, 136, 106100. [Google Scholar] [CrossRef]
- Arai, Y.; Iinuma, T.; Takayama, M.; Takayama, M.; Abe, Y.; Fukuda, R.; Ando, J.; Ohta, K.; Hanabusa, H.; Asakura, K.; et al. The Tokyo Oldest Old survey on Total Health (TOOTH): A longitudinal cohort study of multidimensional components of health and well-being. BMC Geriatr. 2010, 10, 35. [Google Scholar] [CrossRef] [Green Version]
- Kobayashi, S.; Yuan, X.; Sasaki, S.; Osawa, Y.; Hirata, T.; Abe, Y.; Takayama, M.; Arai, Y.; Masui, Y.; Ishizaki, T. Relative validity of brief-type self-administered diet history questionnaire among very old Japanese aged 80 years or older. Public Health Nutr. 2019, 22, 212–222. [Google Scholar] [CrossRef]
- Coelho-Júnior, H.J.; Trichopoulou, A.; Panza, F. Cross-sectional and longitudinal associations between adherence to Mediterranean diet with physical performance and cognitive function in older adults: A systematic review and meta-analysis. Ageing Res. Rev. 2021, 70, 101395. [Google Scholar] [CrossRef] [PubMed]
- Kurotani, K.; Akter, S.; Kashino, I.; Goto, A.; Mizoue, T.; Noda, M.; Sasazuki, S.; Sawada, N.; Tsugane, S. Quality of diet and mortality among Japanese men and women: Japan Public Health Center based prospective study. BMJ 2016, 352, i1209. [Google Scholar] [CrossRef] [PubMed] [Green Version]
- Oguma, Y.; Osawa, Y.; Takayama, M.; Abe, Y.; Tanaka, S.; Lee, I.M.; Arai, Y. Validation of Questionnaire-Assessed Physical Activity in Comparison with Objective Measures Using Accelerometers and Physical Performance Measures Among Community-Dwelling Adults Aged ≥85 Years in Tokyo, Japan. J. Phys. Act. Health 2017, 14, 245–252. [Google Scholar] [CrossRef] [PubMed]
- Okubo, H.; Inagaki, H.; Gondo, Y.; Kamide, K.; Ikebe, K.; Masui, Y.; Arai, Y.; Ishizaki, T.; Sasaki, S.; Nakagawa, T.; et al. Association between dietary patterns and cognitive function among 70-year-old Japanese elderly: A cross-sectional analysis of the SONIC study. Nutr. J. 2017, 16, 56. [Google Scholar] [CrossRef] [Green Version]
- Hsueh, M.C.; Rutherford, R.; Huang, Y.H.; Chang Chien, H.Y.; Chang, C.H.; Park, J.H.; Liao, Y. Are Older Adults without a Healthy Diet Less Physically Active and More Sedentary? Nutrients 2019, 11, 1119. [Google Scholar] [CrossRef] [Green Version]
- Södergren, M.; McNaughton, S.A.; Salmon, J.; Ball, K.; Crawford, D.A. Associations between fruit and vegetable intake, leisure-time physical activity, sitting time and self-rated health among older adults: Cross-sectional data from the WELL study. BMC Public Health 2012, 12, 551. [Google Scholar] [CrossRef] [Green Version]
- van der Avoort, C.M.T.; Ten Haaf, D.S.M.; de Vries, J.H.M.; Verdijk, L.B.; van Loon, L.J.C.; Eijsvogels, T.M.H.; Hopman, M.T.E. Higher Levels of Physical Activity Are Associated with Greater Fruit and Vegetable intake in Older Adults. J. Nutr. Health Aging 2021, 25, 230–241. [Google Scholar] [CrossRef]
- Štefan, L.; Petrinović, L.; Sporiš, G.; Vrgoč, G. Frequency of Dietary Intake and Physical Activity in Older Adults: A Cross-Sectional Study. Nutrients 2018, 10, 1960. [Google Scholar] [CrossRef] [Green Version]
- Tavares, A.I. Physical activity and healthy diet: Determinants and implicit relationship. Public Health 2014, 128, 568–575. [Google Scholar] [CrossRef]
- Granic, A.; Davies, K.; Adamson, A.; Kirkwood, T.; Hill, T.R.; Siervo, M.; Mathers, J.C.; Jagger, C. Dietary Patterns and Socioeconomic Status in the Very Old: The Newcastle 85+ Study. PLoS ONE 2015, 10, e0139713. [Google Scholar] [CrossRef]
- Chen, M.; Creger, T.; Howard, V.; Judd, S.E.; Harrington, K.F.; Fontaine, K.R. Geospatial analysis of Mediterranean diet adherence in the United States. Public Health Nutr. 2021, 24, 2920–2928. [Google Scholar] [CrossRef] [PubMed]
- Harris, J.L.; Bargh, J.A.; Brownell, K.D. Priming effects of television food advertising on eating behavior. Health Psychol. 2009, 28, 404–413. [Google Scholar] [CrossRef] [PubMed]
- Clegg, A.; Young, J. The frailty syndrome. Clin. Med. 2011, 11, 72–75. [Google Scholar] [CrossRef] [PubMed]
- Ghoreishy, S.M.; Asoudeh, F.; Jayedi, A.; Mohammadi, H. Fruit and vegetable intake and risk of frailty: A systematic review and dose response meta-analysis. Ageing Res. Rev. 2021, 71, 101460. [Google Scholar] [CrossRef]
- Lorenzo-López, L.; Maseda, A.; de Labra, C.; Regueiro-Folgueira, L.; Rodríguez-Villamil, J.L.; Millán-Calenti, J.C. Nutritional determinants of frailty in older adults: A systematic review. BMC Geriatr. 2017, 17, 108. [Google Scholar] [CrossRef] [Green Version]
- Son, B.K.; Akishita, M.; Yamanaka, T.; Toyoshima, K.; Tanaka, T.; Suthutvoravut, U.; Iijima, K. Association between inflammatory potential of the diet and sarcopenia/its components in community-dwelling older Japanese men. Arch. Gerontol. Geriatr. 2021, 97, 104481. [Google Scholar] [CrossRef]
- Marcos-Pérez, D.; Sánchez-Flores, M.; Proietti, S.; Bonassi, S.; Costa, S.; Teixeira, J.P.; Fernández-Tajes, J.; Pásaro, E.; Laffon, B.; Valdiglesias, V. Association of inflammatory mediators with frailty status in older adults: Results from a systematic review and meta-analysis. Geroscience 2020, 42, 1451–1473. [Google Scholar] [CrossRef]
- Cesari, M.; Pahor, M.; Bartali, B.; Cherubini, A.; Penninx, B.W.; Williams, G.R.; Atkinson, H.; Martin, A.; Guralnik, J.M.; Ferrucci, L. Antioxidants and physical performance in elderly persons: The Invecchiare in Chianti (InCHIANTI) study. Am. J. Clin. Nutr. 2004, 79, 289–294. [Google Scholar] [CrossRef] [Green Version]
- Sanchis-Gomar, F.; Lavie, C.J.; Marín, J.; Perez-Quilis, C.; Eijsvogels, T.M.H.; O’Keefe, J.H.; Perez, M.V.; Blair, S.N. Exercise Effects on Cardiovascular Disease: From Basic Aspects to Clinical Evidence. Cardiovasc. Res. 2021. [CrossRef]


| DP1 Various Plant Foods | DP2 Fish and Mushrooms | DP3 Cooked Rice and Miso Soup | ||||||||
|---|---|---|---|---|---|---|---|---|---|---|
| All Participants (n = 519) | Low Trend Group (n = 260) | High Trend Group (n = 259) | p-Value | Low Trend Group (n = 260) | High Trend Group (n = 259) | p-Value | Low Trend Group (n = 259) | High Trend Group (n = 260) | p-Value | |
| Sex | ||||||||||
| Men | 219 (42.2) | 125 (48.1) | 94 (36.3) | 0.01 | 128 (49.2) | 91 (35.1) | <0.001 | 104 (40.2) | 115 (44.2) | 0.37 |
| Women | 300 (57.8) | 135 (51.9) | 165 (63.7) | 132 (50.8) | 168 (64.9) | 155 (59.9) | 145 (55.8) | |||
| Age | 87.3 (86.2–88.8) | 87.3 (86.1–88.7) | 87.4 (86.3–88.9) | 0.73 | 87.3 (86.2–88.6) | 87.4 (86.4–89.0) | 0.23 | 87.3 (86.1–88.7) | 87.3 (86.4–88.8) | 0.42 |
| Body Mass Index (n = 517) | 21.4 (19.4–23.6) | 21.3 (19.4–23.5) | 21.4 (19.3–23.7) | 0.97 | 21.5 (19.4–23.7) | 21.2 (19.2–23.3) | 0.44 | 21.6 (19.4–23.7) | 21.1 (19.3–23.3) | 0.27 |
| Mini-Mental State Examination (n = 510) | 27 (25–29) | 27 (24–29) | 27 (25–29) | 0.26 | 28 (25–29) | 27 (24–29) | 0.03 | 27 (25–29) | 27 (24–29) | 0.62 |
| Activities of daily living (n = 511) | 100 (95–100) | 100 (95–100) | 100 (100–100) | 0.02 | 100 (95–100) | 100 (95–100) | 0.66 | 100 (95–100) | 100 (100–100) | 0.21 |
| Year of education (n = 497) | 11 (9–13) | 11 (8–13) | 11 (9–13) | 0.44 | 11 (10–14) | 11 (8–13) | <0.01 | 11 (10–14) | 11 (8–13) | <0.01 |
| Living alone (n = 505) | 171 (33.9) | 91 (36.0) | 80 (31.7) | 0.35 | 83 (32.7) | 88 (35.1) | 0.57 | 90 (36.2) | 81 (31.5) | 0.26 |
| Smoking habit (n = 502) | ||||||||||
| Smoker | 35 (7.0) | 17 (6.8) | 18 (7.1) | 0.24 | 26 (10.3) | 9 (3.6) | <0.001 | 18 (7.2) | 17 (6.7) | 0.91 |
| Ex-smoker | 161 (32.1) | 89 (35.6) | 72 (28.6) | 91 (36.1) | 70 (28.0) | 78 (31.2) | 83 (32.9) | |||
| Non-smoker | 306 (61.0) | 144 (57.6) | 162 (64.3) | 135 (53.6) | 171 (68.4) | 154 (61.6) | 152 (60.3) | |||
| Economic status (n = 499) | ||||||||||
| Very good/Good | 363 (72.8) | 184 (73.9) | 179 (71.6) | 0.22 | 181 (72.1) | 182 (73.4) | 0.52 | 181 (72.4) | 182 (73.1) | 0.87 |
| Neither | 78 (15.6) | 42 (16.9) | 36 (14.4) | 37 (14.7) | 41 (16.5) | 41 (16.4) | 37 (14.9) | |||
| bad/Very bad | 58 (11.6) | 23 (9.2) | 35 (14.0) | 33 (13.1) | 25 (10.1) | 28 (11.2) | 30 (12.0) | |||
| Working (n = 498) | 94 (18.9) | 37 (15.2) | 57 (22.4) | 0.04 | 51 (20.3) | 43 (17.4) | 0.43 | 45 (18.1) | 49 (19.7) | 0.73 |
| No disease history (n = 485) | 101 (20.8) | 58 (23.6) | 43 (18.0) | 0.22 | 55 (22.2) | 46 (19.4) | 0.64 | 49 (20.9) | 52 (20.8) | 0.34 |
| PAI, METs*h/week | 7.0 (2.0–14.7) | 6.3 (1.5–12.0) | 8.8 (3.3–17.0) | <0.001 | 7.0 (1.7–14.5) | 7.1 (2.7–14.7) | 0.15 | 7.0 (1.9–14.0) | 7.0 (2.3–15.1) | 0.79 |
| Walking, METs*h/week | 4.2 (1.5–10.5) | 3.5 (1.0–9.8) | 4.9 (2.0–11.2) | <0.01 | 4.2 (1.4–10.5) | 4.5 (1.8–10.5) | 0.56 | 4.2 (1.5–9.8) | 4.7 (1.5–10.5) | 0.58 |
| Exercise, METs*h/week | 0.0 (0.0–4.0) | 0.0 (0.0–2.9) | 0.0 (0.0–4.5) | <0.01 | 0.0 (0.0–3.0) | 0.0 (0.0–4.1) | 0.01 | 0.0 (0.0–4.1) | 0.0 (0.0–3.5) | 0.97 |
| Food Item | DP1 Various Plant Foods | DP2 Fish and Mushrooms | DP3 Cooked Rice and Miso Soup |
|---|---|---|---|
| Cooked rice | −0.43 | 0.68 | |
| Noodles | |||
| Bread | −0.54 | ||
| Miso soup | −0.24 | 0.58 | |
| High-fat milk | |||
| Low-fat milk | |||
| Red meats | |||
| Chicken | 0.25 | ||
| Processed meats | −0.23 | ||
| Fish | 0.57 | ||
| Shellfish | 0.32 | ||
| Seafood | 0.27 | ||
| Egg | |||
| Potatoes | 0.23 | 0.35 | |
| Soy products | 0.25 | 0.29 | 0.35 |
| Green and dark yellow vegetables | 0.70 | 0.24 | |
| Other vegetables | 0.80 | ||
| Pickled vegetables | 0.44 | 0.29 | |
| Salad vegetables | 0.67 | ||
| Mushrooms | 0.46 | 0.48 | |
| Seaweeds | 0.31 | 0.38 | |
| Fruit | 0.21 | ||
| Confectioneries | −0.28 | −0.52 | |
| Ice cream | −0.24 | ||
| Sugar | 0.31 | −0.57 | |
| Fats and oils | 0.75 | 0.03 | |
| Alcoholic beverages | |||
| Green tea | 0.41 | ||
| Black and Oolong tea | −0.35 | ||
| Coffee | 0.21 | −0.59 | |
| Soft drinks | −0.30 | ||
| Fruit and vegetable juice | −0.32 | ||
| Seasonings | 0.56 | 0.41 | |
| Total | 4.09 | 2.37 | 1.85 |
| Initial eigenvalues % of Variance | 12.41 | 7.17 | 5.60 |
| Cumulative % | 12.41 | 19.58 | 25.17 |
| PAI, METs*h/week | Walking, METs*h/week | Exercise, METs*h/week | ||||||||||||||||
|---|---|---|---|---|---|---|---|---|---|---|---|---|---|---|---|---|---|---|
| Model 1 | Model 2 | Model 1 | Model 2 | Model 1 | Model 2 | |||||||||||||
| B | 95% CI | p-Value | B | 95% CI | p-Value | B | 95% CI | p-Value | B | 95% CI | p-Value | B | 95% CI | p-Value | B | 95% CI | p-Value | |
| DP1 Various plant foods (n = 435) | 1.17 | 0.08–2.25 | 0.04 | 1.41 | 0.33–2.48 | 0.01 | 0.59 | −0.21–1.39 | 0.15 | 0.78 | −0.03–1.57 | 0.06 | 0.57 | −0.04–1.19 | 0.07 | 0.64 | 0.02–1.25 | 0.04 |
| DP2 Fish and mushrooms (n = 435) | 0.54 | −0.54–1.61 | 0.33 | 0.49 | −0.59–1.57 | 0.37 | 0.17 | −0.63–0.96 | 0.68 | 0.19 | −0.61–0.99 | 0.64 | 0.37 | −0.24–0.98 | 0.24 | 0.30 | −0.32–0.92 | 0.34 |
| DP3 Cooked rice and miso soup (n = 435) | 0.09 | −0.99–1.17 | 0.87 | −0.01 | −1.08–1.07 | 0.99 | 0.21 | −0.59–1.00 | 0.61 | 0.14 | −0.66–0.93 | 0.74 | −0.12 | −0.73–0.49 | 0.71 | −0.14 | −0.76–0.48 | 0.66 |
Publisher’s Note: MDPI stays neutral with regard to jurisdictional claims in published maps and institutional affiliations. |
© 2022 by the authors. Licensee MDPI, Basel, Switzerland. This article is an open access article distributed under the terms and conditions of the Creative Commons Attribution (CC BY) license (https://creativecommons.org/licenses/by/4.0/).
Share and Cite
Yu, T.; Oguma, Y.; Asakura, K.; Takayama, M.; Abe, Y.; Arai, Y. Relationship between Dietary Patterns and Subjectively Measured Physical Activity in Japanese Individuals 85 Years and Older: A Cross-Sectional Study. Nutrients 2022, 14, 2924. https://doi.org/10.3390/nu14142924
Yu T, Oguma Y, Asakura K, Takayama M, Abe Y, Arai Y. Relationship between Dietary Patterns and Subjectively Measured Physical Activity in Japanese Individuals 85 Years and Older: A Cross-Sectional Study. Nutrients. 2022; 14(14):2924. https://doi.org/10.3390/nu14142924
Chicago/Turabian StyleYu, Tao, Yuko Oguma, Keiko Asakura, Michiyo Takayama, Yukiko Abe, and Yasumichi Arai. 2022. "Relationship between Dietary Patterns and Subjectively Measured Physical Activity in Japanese Individuals 85 Years and Older: A Cross-Sectional Study" Nutrients 14, no. 14: 2924. https://doi.org/10.3390/nu14142924