
Analysis of Sodium Content in 4082 Kinds of Commercial Foods in China


Abstract
:1. Introduction
2. Materials and Methods
2.1. Date Source and Collection
2.1.1. Pre-Packaged Foods with Nutrition Labels
2.1.2. Determination of Sodium Content in Artisanal Foods
2.2. Categorization of Commercial Foods
2.3. Sodium Content Classification
2.4. Statistical Analysis
3. Results
3.1. Descriptive Analysis
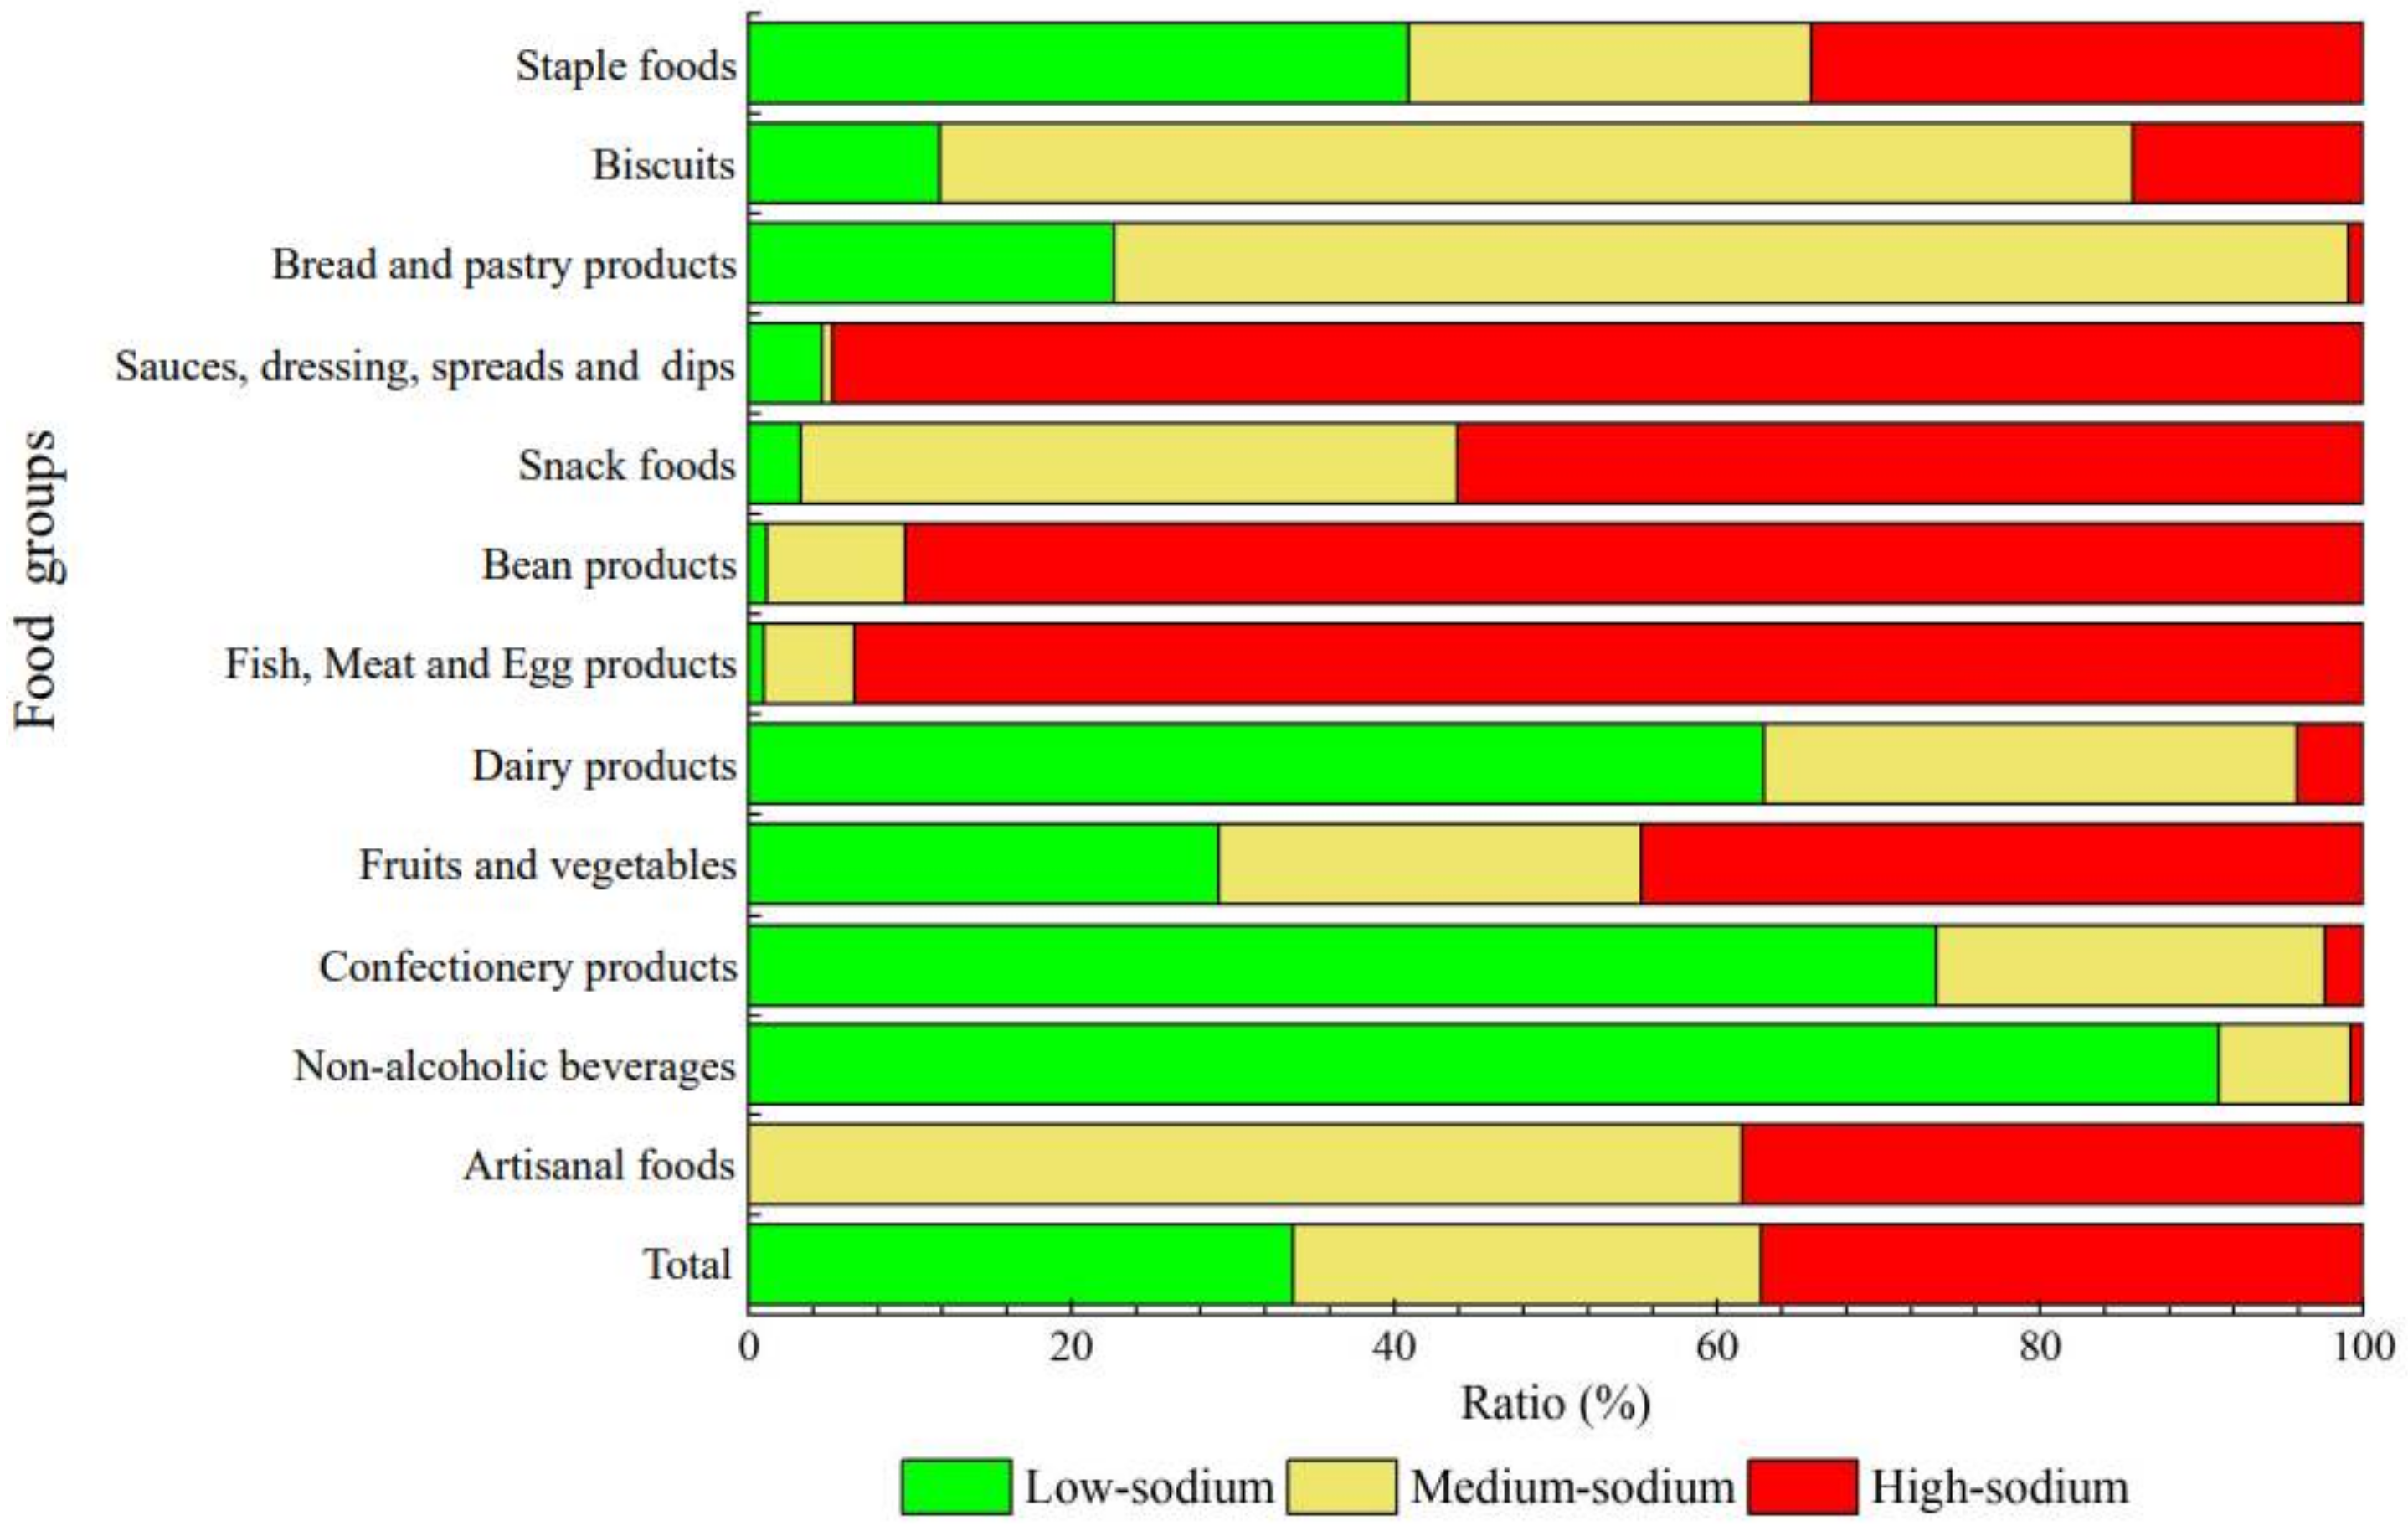
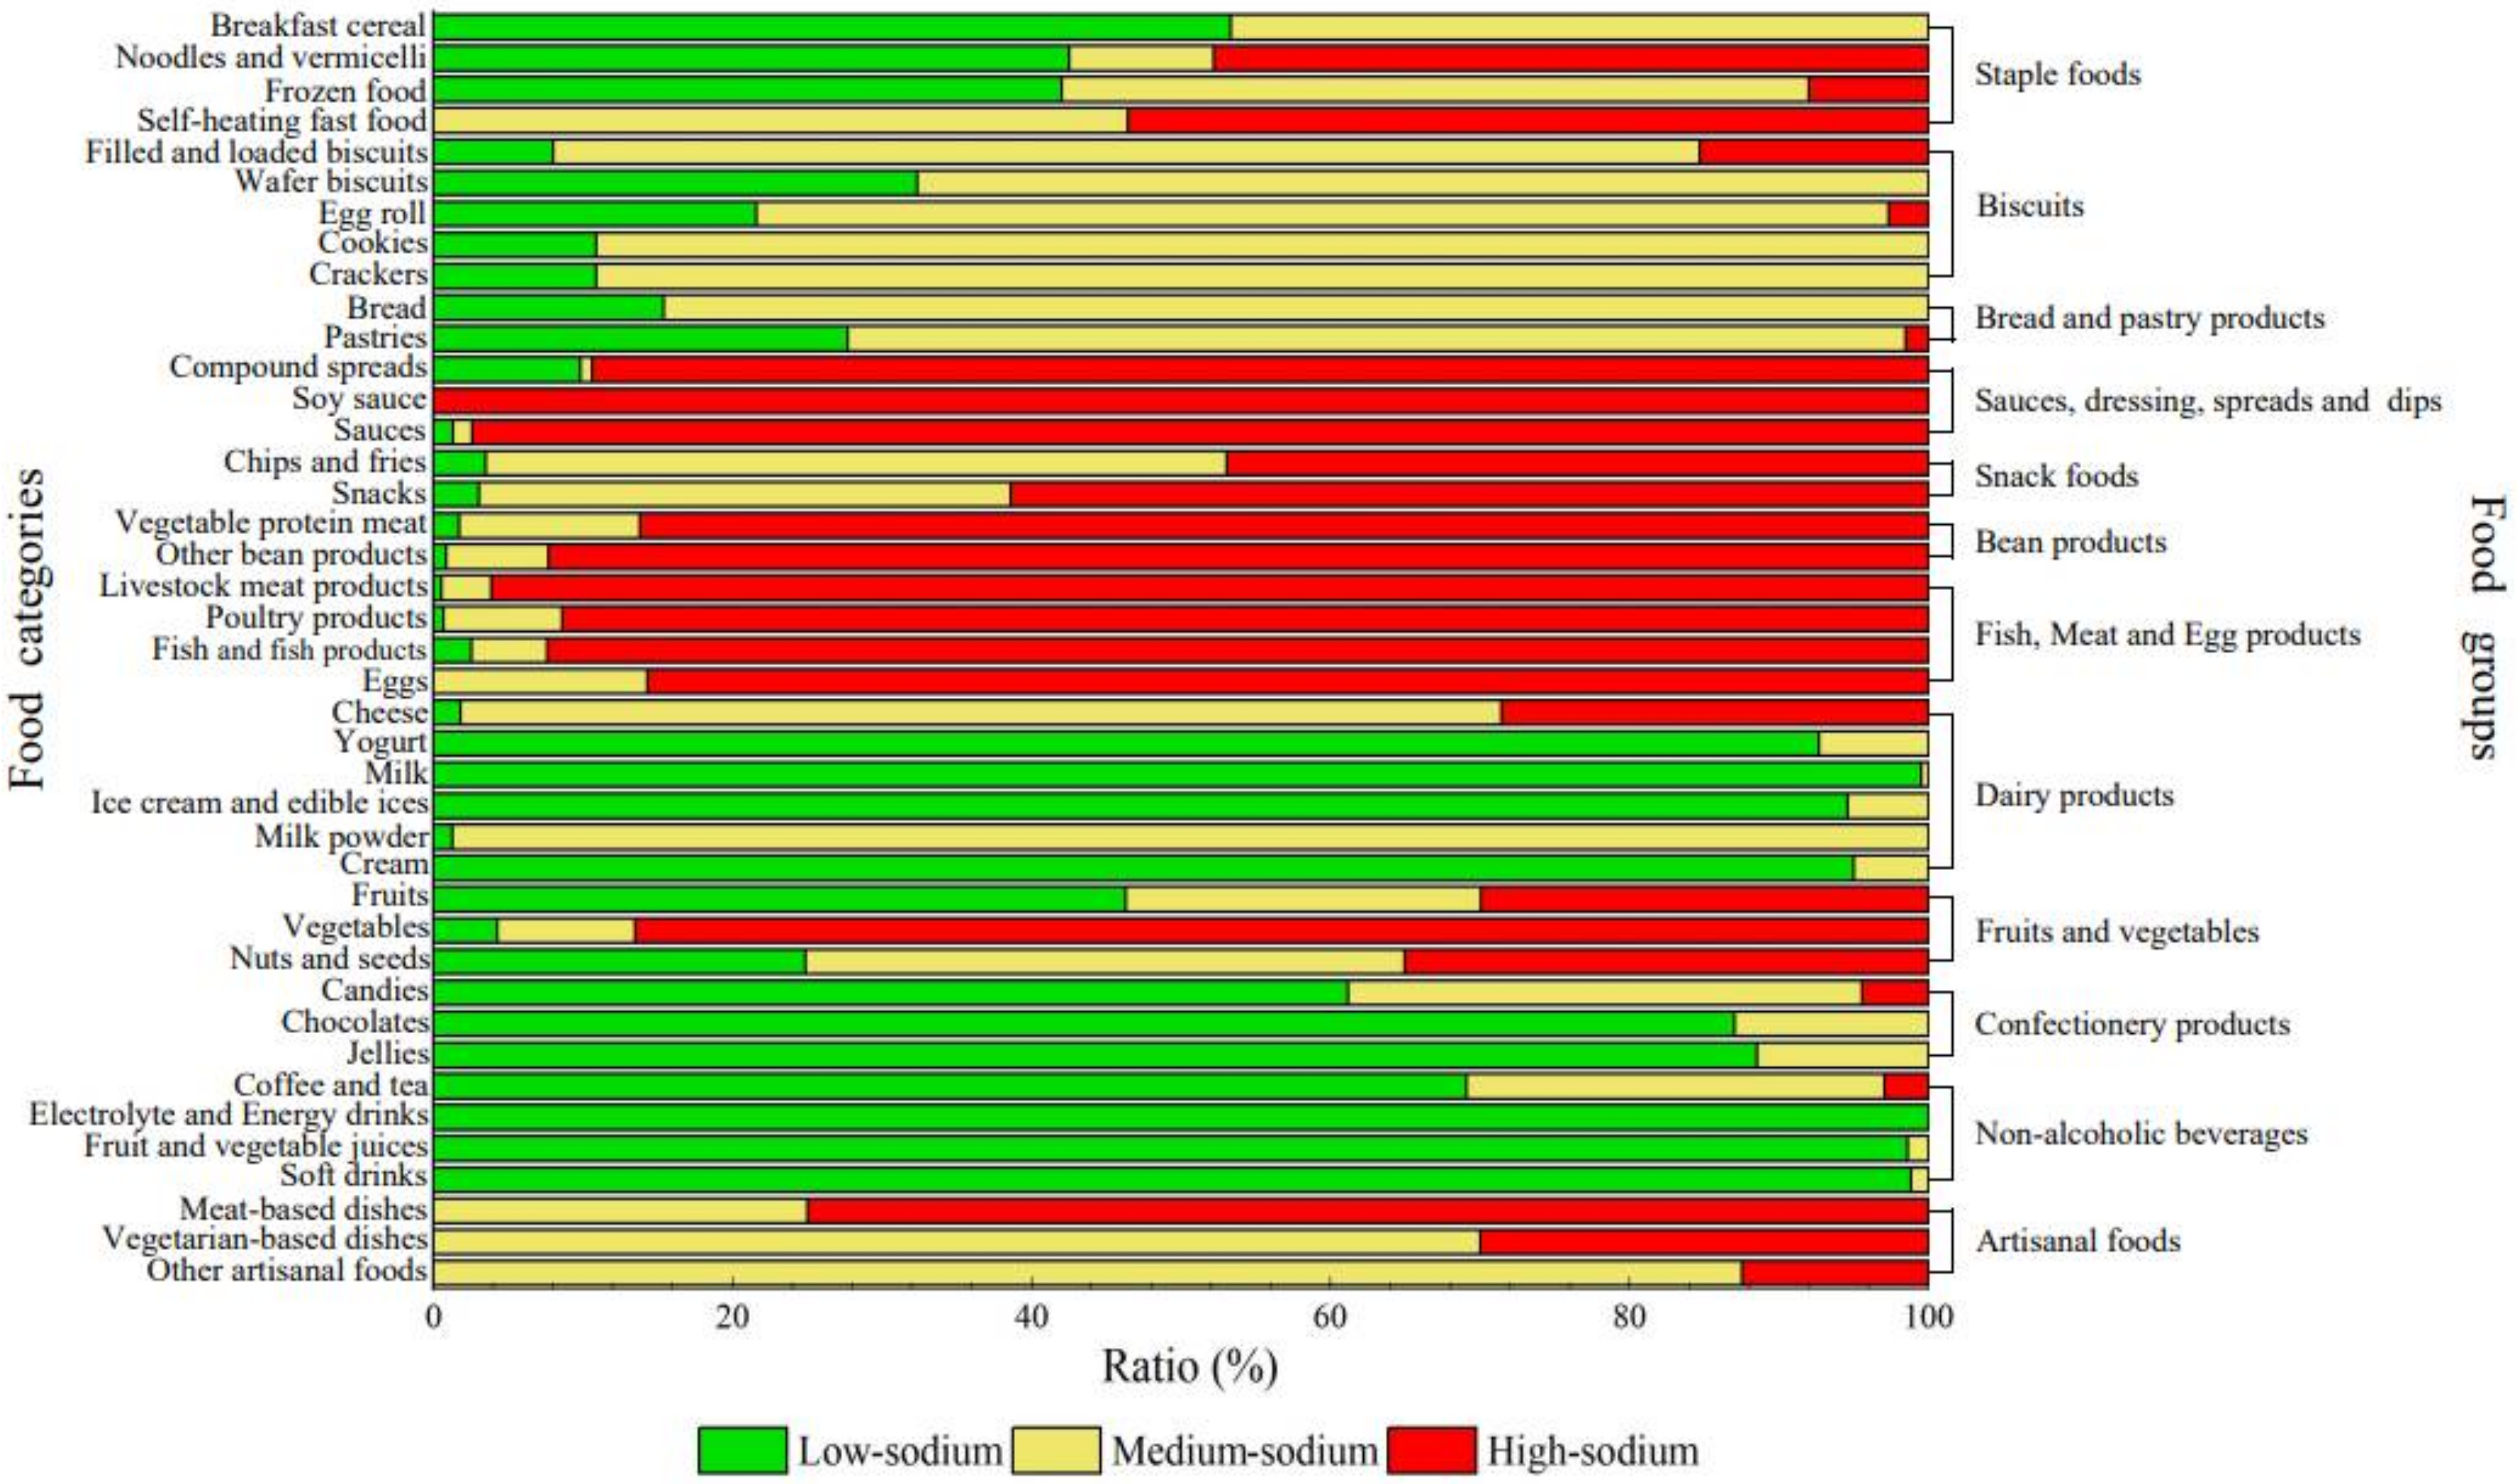
3.2. Comparison of Low-, Medium-, and High-Sodium Foods
3.3. Sodium Content in Different Brands of Soy Sauce and Bread Products
3.4. Comparison between Non-Salt-Reduced and Salt-Reduced Products
4. Discussion
5. Conclusions
Supplementary Materials
Author Contributions
Funding
Institutional Review Board Statement
Informed Consent Statement
Data Availability Statement
Conflicts of Interest
References
- Mariutti, L.R.B.; Bragagnolo, N. Influence of salt on lipid oxidation in meat and seafood products: A review. Food Res. Int. 2017, 94, 90–100. [Google Scholar] [CrossRef] [PubMed]
- Harring, T.R.; Deal, N.S.; Kuo, D.C. Disorders of sodium and water balance. Emerg. Med. Clin. N. Am. 2014, 32, 379–401. [Google Scholar] [CrossRef]
- Kaplan, N.M. The dietary guideline for sodium: Should we shake it up? No. Am. J. Clin. Nutr. 2000, 71, 1020–1026. [Google Scholar] [CrossRef] [PubMed]
- Aoi, W.; Zou, X.; Xiao, J.B.; Marunaka, Y. Body fluid pH balance in metabolic health and possible benefits of dietary alkalin foods. Efood 2020, 1, 12–23. [Google Scholar] [CrossRef] [Green Version]
- Aljuraiban, G.S.; Jose, A.P.; Gupta, P.; Shridhar, K.; Prabhakaran, D. Sodium intake, health implications, and the role of population-level strategies. Nutr. Rev. 2021, 79, 351–359. [Google Scholar] [CrossRef] [PubMed]
- Wu, B.; Yang, D.H.; Yang, S.H.; Zhang, G.Z. Dietary Salt Intake and Gastric Cancer Risk: A Systematic Review and Meta-Analysis. Front. Nutr. 2021, 8, 801228. [Google Scholar] [CrossRef] [PubMed]
- Mishra, S.; Ingole, S.; Jain, R. Salt sensitivity and its implication in clinical practice. Indian Heart J. 2018, 4, 556–564. [Google Scholar] [CrossRef]
- Partearroyo, T.; Samaniego-Vaesken, M.L.; Ruiz, E.; Aranceta-Bartrina, J.; Gil, A.; González-Gross, M.; Ortega, R.M.; Serra-Majem, L.; Varela-Moreiras, G. Sodium intake from foods exceeds recommended limits in the Spanish population: The ANIBES study. Nutrients 2019, 11, 2451. [Google Scholar] [CrossRef] [Green Version]
- Mattes, R.D.; Donnelly, D. Relative contributions of dietary sodium source. J. Am. Coll. Nutr. 1991, 10, 383–393. [Google Scholar] [CrossRef]
- World Health Organization (WHO). Salt Reduction. Key Facts; WHO: Geneva, Switzerland, 2020. [Google Scholar]
- World Health Organization (WHO). Guideline: Sodium Intake for Adults and Children; WHO: Geneva, Switzerland, 2012. [Google Scholar]
- Mente, A.; O’Donnell, M.; Rangarajan, S.; McQueen, M.; Dagenais, G.; Wielgosz, A.; Lear, S.; Ah, S.T.L.; Wei, L.; Diaz, R.; et al. Urinary sodium excretion, blood pressure, cardiovascular disease, and mortality: A community-level prospective epidemiological cohort study. Lancet 2018, 392, 496–506. [Google Scholar] [CrossRef]
- World Health Organization (WHO). Global Targets 2025; WHO: Geneva, Switzerland, 2020. [Google Scholar]
- Wang, M.; Moran, A.E.; Liu, J.; Qi, Y.; Xie, W.; Tzong, K.; Zhao, D. A Meta-Analysis of Effect of Dietary Salt Restriction on Blood Pressure in Chinese Adults. Global Heart 2015, 10, 291–299. [Google Scholar] [CrossRef] [PubMed] [Green Version]
- Zhou, M.G.; Wang, H.D.; Zeng, X.Y.; Yin, P.; Zhu, J.; Chen, W.Q.; Li, X.H.; Wang, L.J.; Wang, L.M.; Liu, J.M. Mortality, morbidity, and risk factors in China and its provinces, 1990-2017: A systematic analysis for the Global Burden of Disease Study 2017. Lancet 2019, 394, 1145–1158. [Google Scholar] [CrossRef] [Green Version]
- Kypridemos, C.; Guzman-Castillo, M.; Hyseni, L.; Hickey, G.L.; Bandosz, P.; Buchan, I.; Capewell, S.; O’Flaherty, M. Estimated reductions in cardiovascular and gastric cancer disease burden through salt policies in England: An IMPACT NCD microsimulation study. BMJ Open 2017, 7, e013791. [Google Scholar] [CrossRef] [PubMed] [Green Version]
- Ndanuko, R.N.; Shahid, M.; Jones, A.; Harris, T.; Maboreke, J.; Walker, A.; Raubenheimer, D.; Simpson, S.; Neal, B.; Wu, J.H.Y. Projected effects on salt purchases following implementation of a national salt reduction policy in South Africa. Public Health Nutr. 2021, 24, 4614–4621. [Google Scholar] [CrossRef]
- Mhurchu, C.N.; Eyles, H.; Jiang, Y.N.; Blakely, T. Do nutrition labels influence healthier food choices? Analysis of label viewing behaviour and subsequent food purchases in a labelling intervention trial. Appetite 2018, 121, 360–365. [Google Scholar] [CrossRef]
- He, Y.; Huang, L.P.; Yan, S.J.; Li, Y.; Lu, L.X.; Wang, H.B.; Niu, W.Y.; Zhang, P.H. Awareness, understanding and use of sodium information labelled on pre-packaged food in Beijing: A cross-sectional study. BMC Public Health 2018, 18, 509. [Google Scholar] [CrossRef] [Green Version]
- Liu, R.D.; Hoefkens, C.; Verbeke, W. Chinese consumers’ understanding and use of a food nutrition label and their determinants. Food Qual. Prefer. 2015, 41, 103–111. [Google Scholar] [CrossRef]
- Ogundijio, D.A.; Tas, A.A.; Onarinde, B.A. An assessment of nutrition information on front of pack labels and healthiness of foods in the United Kingdom retail market. BMC Public Health 2021, 21, 220. [Google Scholar] [CrossRef]
- GB 28050-2011. National Standards of People’s Republic of China. National Food Safety Standard: Standard for Nutrition Labelling of Pre-Packaged Foods. Available online: http://down.foodmate.net/standard/yulan.php?itemid=28488 (accessed on 3 October 2021).
- Fitzpatrick, L.; Arcand, J.; L’Abbe, M.; Deng, M.Y.; Duhaney, N.T.; Campbell, N. Accuracy of Canadian food labels for sodium content of food. Nutrients 2014, 6, 3326–3335. [Google Scholar] [CrossRef]
- Huang, L.; Neal, B.; Dunford, E.; Ma, G.; Wu, J.H.; Crino, M.; Trevena, H. Completeness of nutrient declarations and the average nutritional composition of pre-packaged foods in Beijing, China. Prev. Med. Rep. 2016, 4, 397–403. [Google Scholar] [CrossRef] [Green Version]
- Liang, L.; Zhou, C.C.; Zhang, Y.Y.; Sun, B.G. Effect of Welsh Onion on Taste Components and Sensory Characteristics of Porcine Bone Soup. Foods 2021, 10, 2968. [Google Scholar] [CrossRef] [PubMed]
- Ministry of Commerce of the People’s Republic of China. Classification Specification of Supermarket Goods; Ministry of Commerce of the People’s Republic of China: Beijing, China, 2012.
- Dunford, E.; Webster, J.; Metzler, A.B.; Czernichow, S.; Mhurchu, C.N.; Wolmarans, P.; Snowdon, W.; L’Abbe, M.; Li, N.; Maulik, P.K. International collaborative project to compare and monitor the nutritional composition of processed foods. Eur. J. Prev. Cardiol. 2012, 19, 1326–1332. [Google Scholar] [CrossRef]
- GB/T 23789-2009; National Standards of People’s Republic of China. Foods with Low-Sodium Content. General Administration of Quality Supervision. Inspection and Quarantine of the People’s Republic of China, Standardization Administration of The People’s Republic of China: Beijing, China, 2009.
- Wong, A.S.C.; Coyle, D.H.; Wu, J.H.Y.; Louie, J.C.Y. Sodium concentration of pre-packaged foods sold in Hong Kong. Public Health Nutr. 2020, 23, 2804–2810. [Google Scholar] [CrossRef] [PubMed]
- Sun, C.; Zhou, X.; Hu, Z.; Lu, W.; Fang, Y. Food and salt structure design for salt reducing. Innov. Food Sci. Emerg. Technol. 2021, 67, 102570. [Google Scholar] [CrossRef]
- Martin, K.; Tan, S.J.; Toussaint, N.D. Today body sodium balance in chronic kidney disease. Int. J. Nephrol. 2021, 2021, 7662357. [Google Scholar] [CrossRef]
- Arcand, J.; Au, J.T.C.; Schermel, A.; L’Abbe, M.R. A comprehensive analysis of sodium levels in the Canadian packaged food supply. Am. J. Prev. Med. 2014, 46, 633–642. [Google Scholar] [CrossRef] [PubMed] [Green Version]
- Johnson, C.; Thout, S.R.; Mohan, S.; Dunford, E.; Farrand, C.; Wu, J.H.Y.; He, F.J.; Shivashankar, R.; Webster, J.; Krishnan, A. Labelling completeness and sodium content of packaged foods in India. Public Health Nutr. 2017, 20, 2839–2846. [Google Scholar] [CrossRef] [PubMed] [Green Version]
- Eyles, H.; Webster, J.; Jebb, S.; Capelin, C.; Neal, B.; Mhurchu, C.N. Impact of the UK voluntary sodium reduction targets on the sodium content of processed foods from 2006 to 2011: Analysis of household consumer panel data. Prev. Med. 2013, 57, 555–560. [Google Scholar] [CrossRef]
- Inguglia, E.S.; Zhang, Z.H.; Tiwari, B.K.; Kerry, J.P.; Burgess, C.M. Salt reduction strategies in processed meat products-A review. Trends Food Sci. Tech. 2017, 59, 70–78. [Google Scholar] [CrossRef]
- Gardini, F.; Martuscelli, M.; Caruso, M.C.; Galgano, F.; Crudele, M.A.; Favati, F.; Guerzoni, M.E.; Suzzi, G. Effects of pH, temperature and NaCl concentration on the growth kinetics, proteolytic activity and biogenic amine production of Enterococcus faecalis. Int. J. Food Microbiol. 2001, 64, 105–117. [Google Scholar] [CrossRef]
- Brinsden, H.C.; He, F.J.; Jenner, K.H.; Macgregor, G.A. Surveys of the salt content in UK bread: Progress made and further reductions possible. BMJ Open 2013, 3, e002936. [Google Scholar] [CrossRef] [PubMed] [Green Version]
- Belc, N.; Smeu, I.; Macri, A.; Vallauri, D.; Flynn, K. Reformulating foods to meet current scientific knowledge about salt, sugar and fats. Trends Food Sci. Tech. 2019, 84, 25–28. [Google Scholar] [CrossRef]
- Patel, S.M.; Gunn, J.P.; Tong, X.; Cogswell, M.E. Consumer sentiment on actions reducing sodium in processed and restaurant foods, ConsumerStyles 2010. Am. J. Prev. Med. 2014, 46, 516–524. [Google Scholar] [CrossRef]
- Shen, D.Y.; Song, H.L.; Zou, T.T.; Raze, A.; Li, P.; Li, K.; Xiong, J. Reduction of sodium chloride: A review. J. Sci. Food Agr. 2022, 102, 3931–3939. [Google Scholar] [CrossRef] [PubMed]
- Liang, L.; Zhou, C.C.; Zhang, J.C.; Huang, Y.; Zhang, Y.Y.; Sun, B.G. Characteristics of Umami Peptides Identified from Porcine Bone Soup and Molecular Docking to the Taste Receptor T1R1/T1R3. Food Chem. 2022, 387, 132870. [Google Scholar] [CrossRef] [PubMed]
- Rocha, R.A.R.; Ribeiro, M.N.; Silva, G.A.L.; Rocha, C.R.; Pinheiro, A.C.M.; Nunes, C.A.; Carneiro, J.D.S. Temporal profile of flavor enhancers MAG, MSG, GMP, and IMP, and their ability to enhance salty taste, in different reductions of sodium chloride. J. Food Sci. 2020, 85, 1565–1575. [Google Scholar] [CrossRef] [PubMed]
- Liang, L.; Duan, W.; Zhang, J.C.; Huang, Y.; Zhao, J.; Sun, B.G.; Zhang, Y.Y. Characterization and molecular docking study of taste peptides from chicken soup by sensory analysis combined with nano-LC-Q-TOF-MS/MS. Food Chem. 2022, 383, 132455. [Google Scholar] [CrossRef]
- Emrich, T.E.; Qi, Y.; Lou, W.D.Y.; L’Abbe, M.R. Traffic-light labels could reduce population intakes of calories, total fat, saturated fat, and sodium. PLoS ONE 2017, 12, e0171188. [Google Scholar] [CrossRef]
- Ma, G.J.; Zhuang, X.L. Nutrition label processing in the past 10 years: Contributions from eye tracking approach. Appetite 2021, 156, 104859. [Google Scholar] [CrossRef]
- Du, W.W.; Wang, H.J.; Zhao, J.G.; Zhang, X.F.; Wei, N.; Li, Y.; Tan, M.; Zhang, P.H.; He, F.J. Sodium content of restaurant dishes in China: A cross-sectional survey. Nutr. J. 2022, 21, 10. [Google Scholar] [CrossRef]
- Calliope, S.R.; Samman, N.C. Sodium content in commonly consumed foods and its contribution to the daily intake. Nutrients 2019, 12, 34. [Google Scholar] [CrossRef] [PubMed] [Green Version]
- Rathee, R.; Rajain, P. Online shopping environments and consumer’s need for touch. J. Adv. Manag. Res. 2019, 16, 814–826. [Google Scholar] [CrossRef]


| Food Group | n | Proportion | Sodium Content (mg/100 g) | ||
|---|---|---|---|---|---|
| (%) | IQR | Range | Average | ||
| Staple foods | 345 | 8.45 | 50.0–659.0 | 0–4150.0 | 517.9 |
| Biscuits | 295 | 7.23 | 197.0–466.0 | 14.0–935.0 | 343.1 |
| Bread and pastry products | 221 | 5.41 | 149.0–311.0 | 10.0–782.0 | 236.5 |
| Sauces, dressings, spreads and dips | 309 | 7.57 | 359.01–7986.7 | 6.0–31,319.0 | 6888.6 |
| Snack foods | 312 | 7.64 | 470.0–803.2 | 45.0–1786.0 | 644.8 |
| Bean products | 175 | 4.29 | 860.5–1570.0 | 11.0–6428.0 | 1326.1 |
| Fish, meat and egg products | 426 | 10.44 | 900.0–1594.0 | 11.0–6428.0 | 1302.1 |
| Dairy products | 779 | 19.08 | 60.0–200.0 | 20.0–1490.0 | 164.1 |
| Fruits and vegetables | 615 | 15.07 | 71.0–1152.5 | 0–13,440.0 | 839.1 |
| Confectionery products | 295 | 7.23 | 20.0–135.0 | 0–1300.0 | 111.8 |
| Non-alcoholic beverages | 258 | 6.32 | 8.0–38.3 | 0–990.9 | 49.7 |
| Artisanal foods | 52 | 1.27 | 341.9–477.5 | 169.3–3201.0 | 668.6 |
| Total | 4082 | 100 | 64.0–917.3 | 0–31,319.0 | 1023.1 |
| Food Group | Food Category | n | Proportion | Sodium Content (mg/100 g) | ||
|---|---|---|---|---|---|---|
| (%) | IQR | Range | Average | |||
| Staple foods | Breakfast cereal | 60 | 1.49 | 35.8–168.5 | 0–561.0 | 122.7 |
| Noodles and vermicelli | 207 | 5.14 | 50.0–800.0 | 0–3616.0 | 627.2 | |
| Frozen food | 50 | 1.24 | 36.3–380.5 | 0–2420.0 | 288.7 | |
| Self-heating fast food | 28 | 0.69 | 360.5–1376.4 | 283.0–4150.0 | 966.3 | |
| Biscuits | Filled and loaded biscuits | 137 | 3.4 | 255.6–499.0 | 14.0–935.0 | 387.3 |
| Wafer biscuits | 34 | 0.84 | 114.0–219.9 | 80.0–542.0 | 196.7 | |
| Egg roll | 37 | 0.92 | 129.0–240.0 | 32.0–673.0 | 194.3 | |
| Cookies | 46 | 1.14 | 160.5–333.3 | 24.0–536.0 | 245.7 | |
| Crackers | 41 | 1.02 | 455.0–645.0 | 176.0–734.0 | 548 | |
| Bread and pastry products | Bread | 91 | 2.26 | 191.0–273.0 | 50.0–548.0 | 239.6 |
| Pastries | 134 | 3.33 | 100.5–332.3 | 10.0–782.0 | 234.3 | |
| Sauces, dressings, spreads and dips | Compound spreads | 132 | 3.28 | 4377.5–13,632.3 | 6.0–31,319.0 | 9584.1 |
| Soy sauce | 100 | 2.48 | 5668.3–7361.7 | 3060–9273.3 | 6397.9 | |
| Sauces | 77 | 1.91 | 1570.0–4300.0 | 68.0–8200.0 | 2905.2 | |
| Snack foods | chips and fries | 115 | 2.85 | 393.3–722.5 | 83.3–1123.0 | 561.9 |
| Snacks | 197 | 4.89 | 494.0–850.0 | 45.0–1786.0 | 693.2 | |
| Bean products | Vegetable protein meat | 58 | 1.44 | 802.8–1196.5 | 60.0–2771.0 | 1071.7 |
| Other bean products | 117 | 2.9 | 863.0–1500.0 | 28.0–3300.0 | 1322.7 | |
| Fish, meat and egg products | Livestock meat products | 182 | 4.52 | 860.5–1570.0 | 11.0–6428.0 | 1326.1 |
| Poultry products | 151 | 3.75 | 924.5–1661.5 | 106.0–3318.0 | 1329.7 | |
| Fish and fish products | 79 | 1.96 | 906.0–1626.0 | 35.0–2596.0 | 1238.6 | |
| Eggs | 14 | 0.35 | 766.8–1216.8 | 35.0–2596.0 | 1048.7 | |
| Dairy products | Cheese | 112 | 2.78 | 280.0–662.5 | 30.0–1490.0 | 484.4 |
| Yogurt | 204 | 5.06 | 53.0–70.0 | 20.0–208.0 | 68.9 | |
| Milk | 209 | 5.19 | 50.0–65.0 | 35.0–213.0 | 59.1 | |
| Ice cream and edible ices | 74 | 1.84 | 44.6–80.0 | 20.0–169.0 | 66.3 | |
| Milk powder | 160 | 3.97 | 150.0–340.0 | 111.4–550.0 | 256.2 | |
| Cream | 20 | 0.5 | 30.0–66.5 | 20.0–169.0 | 63.3 | |
| Fruits and vegetables | Fruits | 257 | 6.38 | 35.0–923.0 | 0–13,440.0 | 742.9 |
| Vegetables | 141 | 3.5 | 746.0–1820.0 | 0–12,300.0 | 1525 | |
| Nuts and seeds | 217 | 5.38 | 136.0–794.0 | 0–1578.0 | 507.4 | |
| Confectionery products | Candies | 157 | 3.9 | 24.0–213.0 | 0–1300.0 | 154.8 |
| Chocolates | 77 | 1.91 | 18.0–88.0 | 0–392.0 | 68.2 | |
| Jellies | 61 | 1.51 | 30.0–70.0 | 9.0–145.0 | 56.1 | |
| Non-alcoholic beverages | Coffee and tea | 68 | 1.69 | 20.0–182.2 | 0–990.9 | 130.1 |
| Electrolyte and Energy drinks | 35 | 0.87 | 14.5–47.0 | 0–118.0 | 34.1 | |
| Fruit and vegetable juices | 71 | 1.76 | 0–29.0 | 0–123.0 | 22 | |
| Soft drinks | 84 | 2.08 | 6.0–16.0 | 0–139.0 | 14.6 | |
| Artisanal foods | meat-based dishes | 16 | 0.39 | 595.2–798.5 | 365.5–1686.0 | 829.9 |
| Vegetarian-based dishes | 20 | 0.49 | 325.2–710.4 | 222.2–3201.0 | 766 | |
| other artisanal foods | 16 | 0.39 | 235.9–346.0 | 169.3–802.2 | 385.5 | |
| Brand | n | Average Sodium Content (mg/100 g) | SD (mg/100 g) | Range of Sodium Content (mg/100 g) |
|---|---|---|---|---|
| 1 | 6 | 6446.7 | 587.3 | 5810–7200 |
| 2 | 11 | 6829.1 | 1044.3 | 4813.3–7860 |
| 3 | 14 | 6498.1 | 1023.6 | 4600–7986.7 |
| 4 | 13 | 4626.4 | 1040.7 | 3060–6666.7 |
| 5 | 11 | 7481.2 | 1193.6 | 5000–9273.3 |
| 6 | 6 | 5040.0 | 793.0 | 4520–6620 |
| 7 | 10 | 7672.0 | 818.0 | 5633.3–8440 |
| 8 | 6 | 5850.0 | 1055.7 | 3753.3–6500 |
| 9 | 5 | 6881.3 | 1133.9 | 5906.7–8640 |
| 10 | 3 | 6664.4 | 348.4 | 6466.7–7066.7 |
| 11 | 8 | 6648.3 | 158.7 | 6533.3–6840 |
| Brand | n | Average Sodium Content (mg/100 g) | SD (mg/100 g) | Range of Sodium Content (mg/100 g) |
|---|---|---|---|---|
| 12 | 4 | 302.8 | 164.5 | 208–508 |
| 13 | 3 | 238.7 | 11.9 | 225–246 |
| 14 | 4 | 303.0 | 175.6 | 68–492 |
| 15 | 11 | 301.1 | 73.4 | 243–466 |
| 16 | 4 | 256.0 | 19.8 | 239–276 |
| 17 | 6 | 244.0 | 93.4 | 100–393 |
| 18 | 9 | 205.0 | 72.8 | 97–325 |
| 19 | 5 | 134.2 | 87.3 | 70–288 |
| 20 | 5 | 222.6 | 85.2 | 175–372 |
| 21 | 4 | 249.3 | 14.5 | 230–265 |
| 22 | 3 | 237.3 | 50.2 | 209–295 |
Publisher’s Note: MDPI stays neutral with regard to jurisdictional claims in published maps and institutional affiliations. |
© 2022 by the authors. Licensee MDPI, Basel, Switzerland. This article is an open access article distributed under the terms and conditions of the Creative Commons Attribution (CC BY) license (https://creativecommons.org/licenses/by/4.0/).
Share and Cite
Hao, Z.; Liang, L.; Pu, D.; Zhang, Y. Analysis of Sodium Content in 4082 Kinds of Commercial Foods in China. Nutrients 2022, 14, 2908. https://doi.org/10.3390/nu14142908
Hao Z, Liang L, Pu D, Zhang Y. Analysis of Sodium Content in 4082 Kinds of Commercial Foods in China. Nutrients. 2022; 14(14):2908. https://doi.org/10.3390/nu14142908
Chicago/Turabian StyleHao, Zhilin, Li Liang, Dandan Pu, and Yuyu Zhang. 2022. "Analysis of Sodium Content in 4082 Kinds of Commercial Foods in China" Nutrients 14, no. 14: 2908. https://doi.org/10.3390/nu14142908
APA StyleHao, Z., Liang, L., Pu, D., & Zhang, Y. (2022). Analysis of Sodium Content in 4082 Kinds of Commercial Foods in China. Nutrients, 14(14), 2908. https://doi.org/10.3390/nu14142908