
Sarcopenia, Obesity, Sarcopenic Obesity and Risk of Poor Nutritional Status in Polish Community-Dwelling Older People Aged 60 Years and Over

 , , ,
, , ,
Abstract
:1. Introduction
2. Materials and Methods
2.1. Study Design and Participants
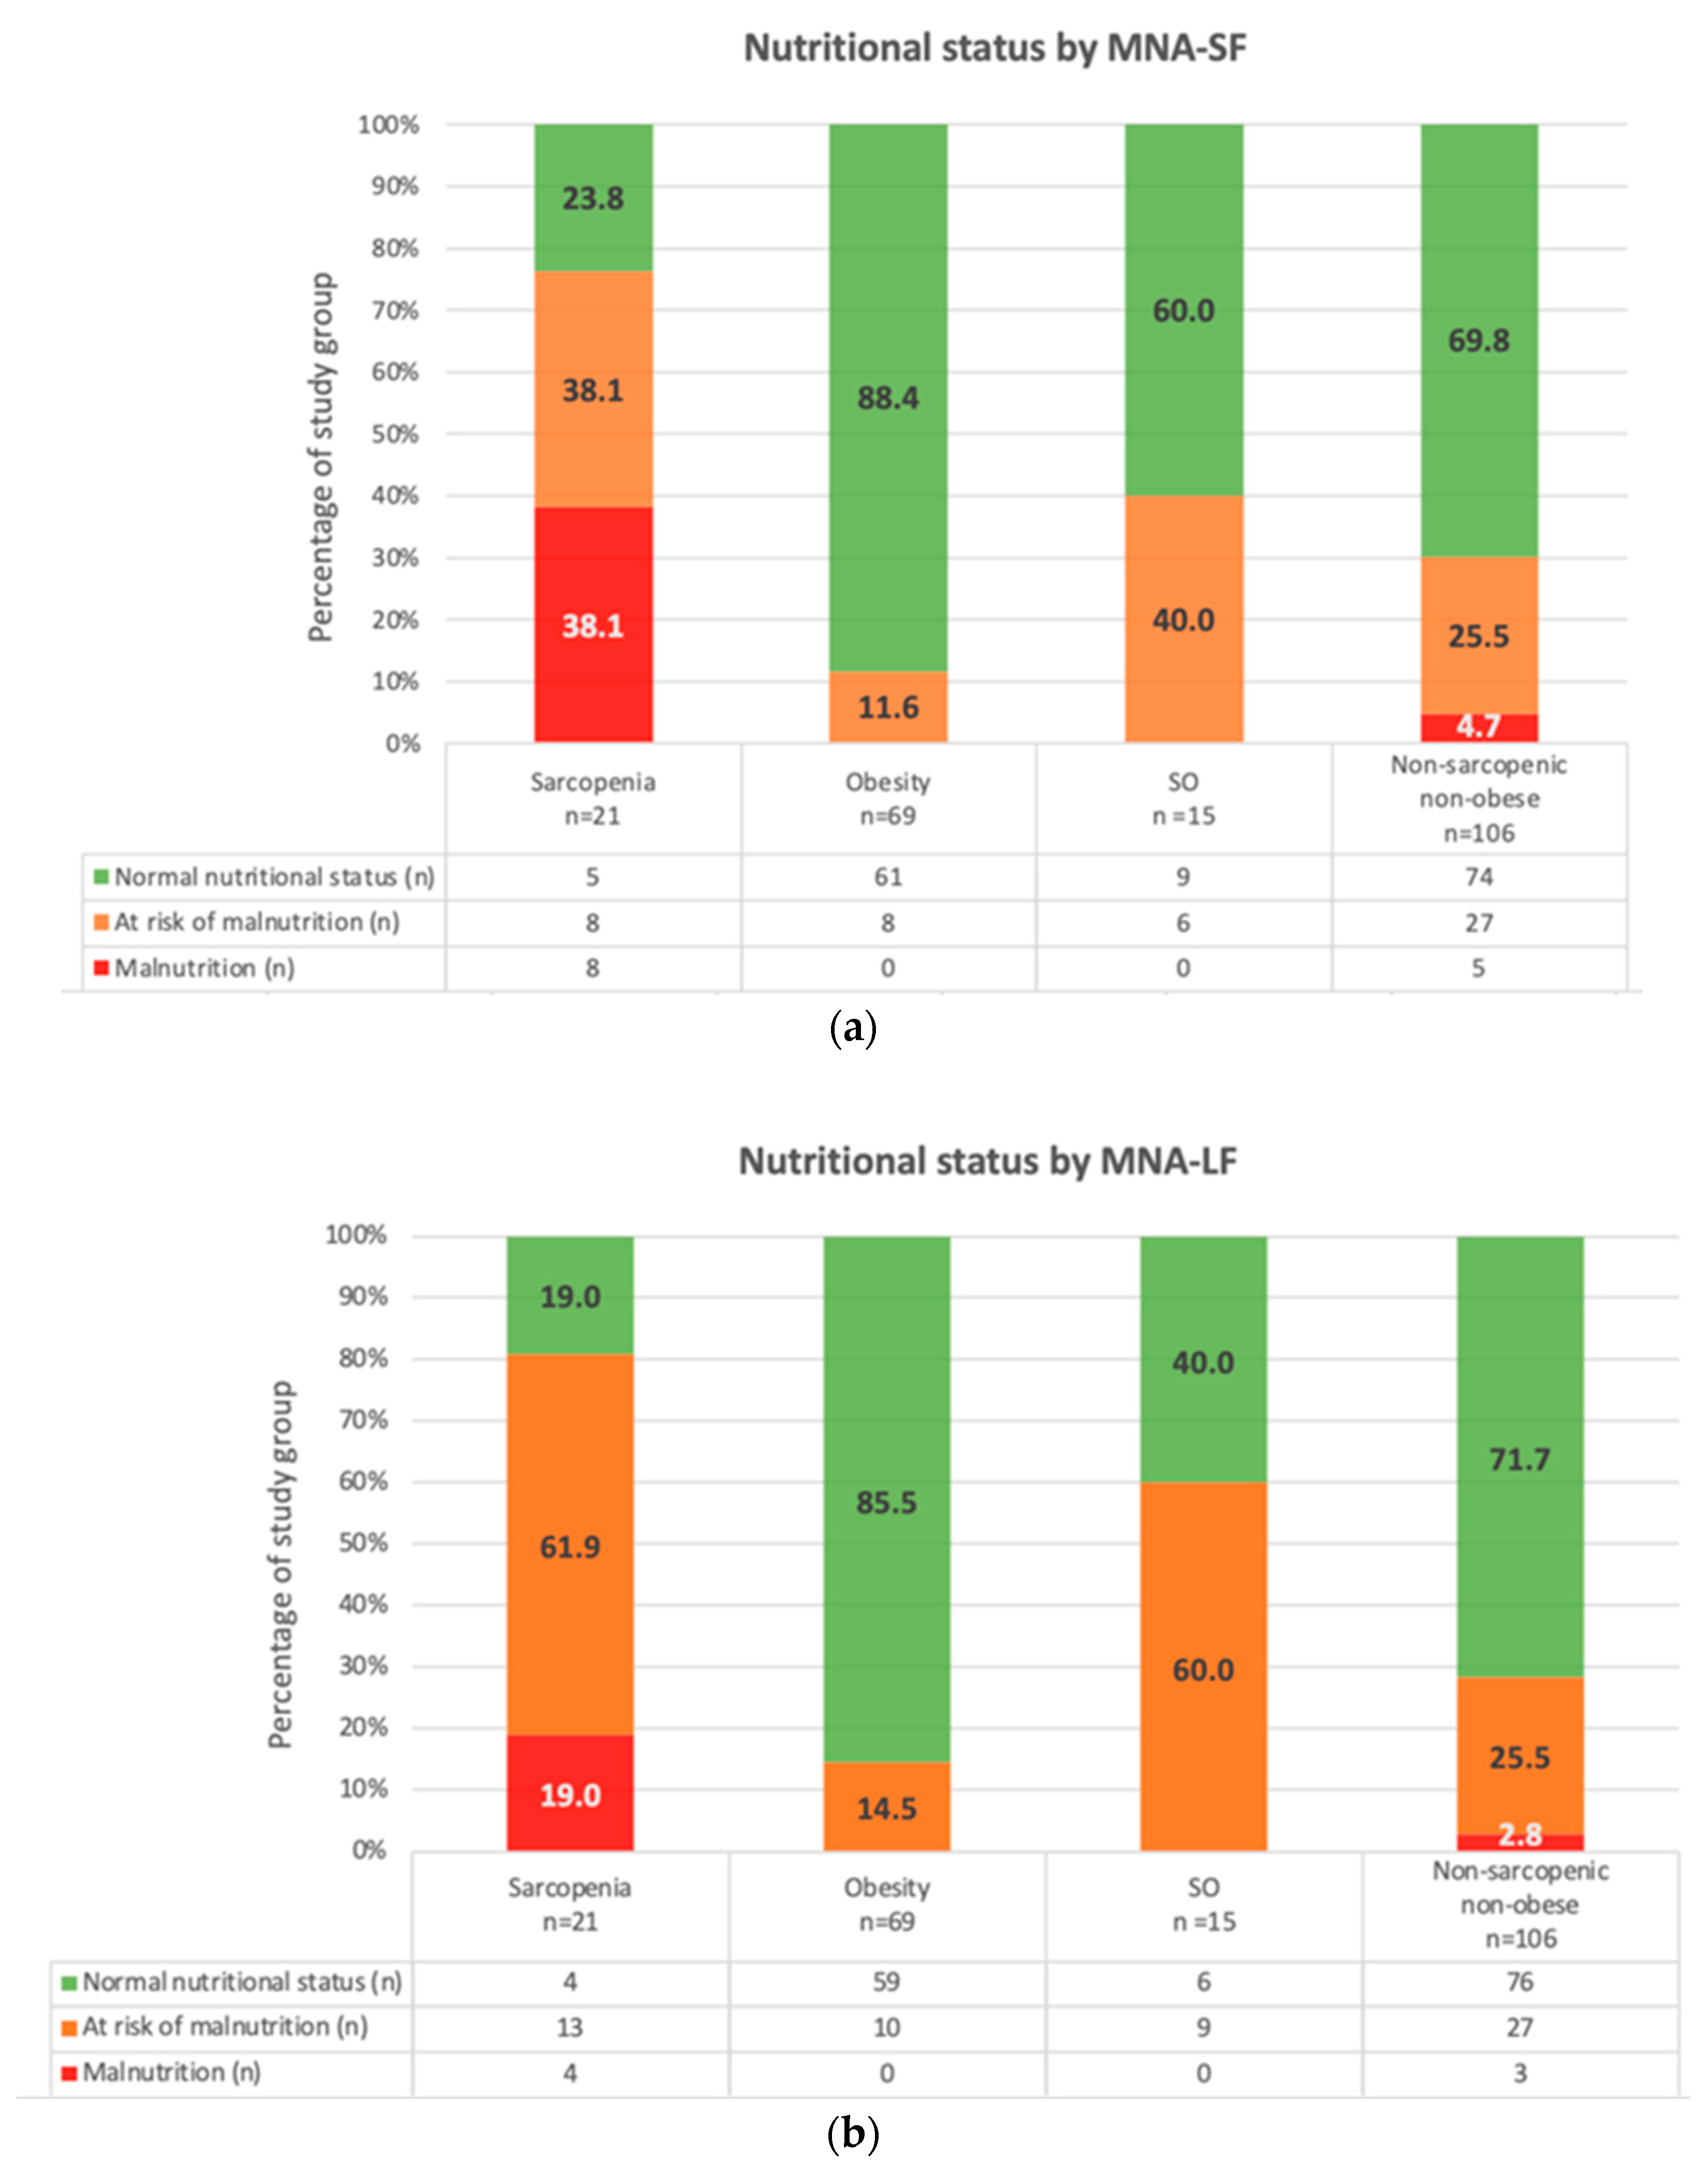
2.2. Nutritional Status Assessment
2.3. Body Composition Analysis
2.4. Sarcopenia Phenotype
2.5. Obesity Phenotype
2.6. Sarcopenic Obesity Phenotype
- Reduced muscle strength in lower and/or upper limbs to assess the upper limb muscle strength subjects performed HGS twice with each hand; the cut-off points were <16 kg in women and <27 kg in men; the lower limb strength was assessed with 5STS, with a cut-off point of >15 s [42];
- Reduced muscle mass based on the ALM/BMI index and cut-off points of <0.512 in women and <0.789 in men [47].
2.7. Covariates
2.8. Statistical Analysis
3. Results
3.1. Characteristics of the Study Population
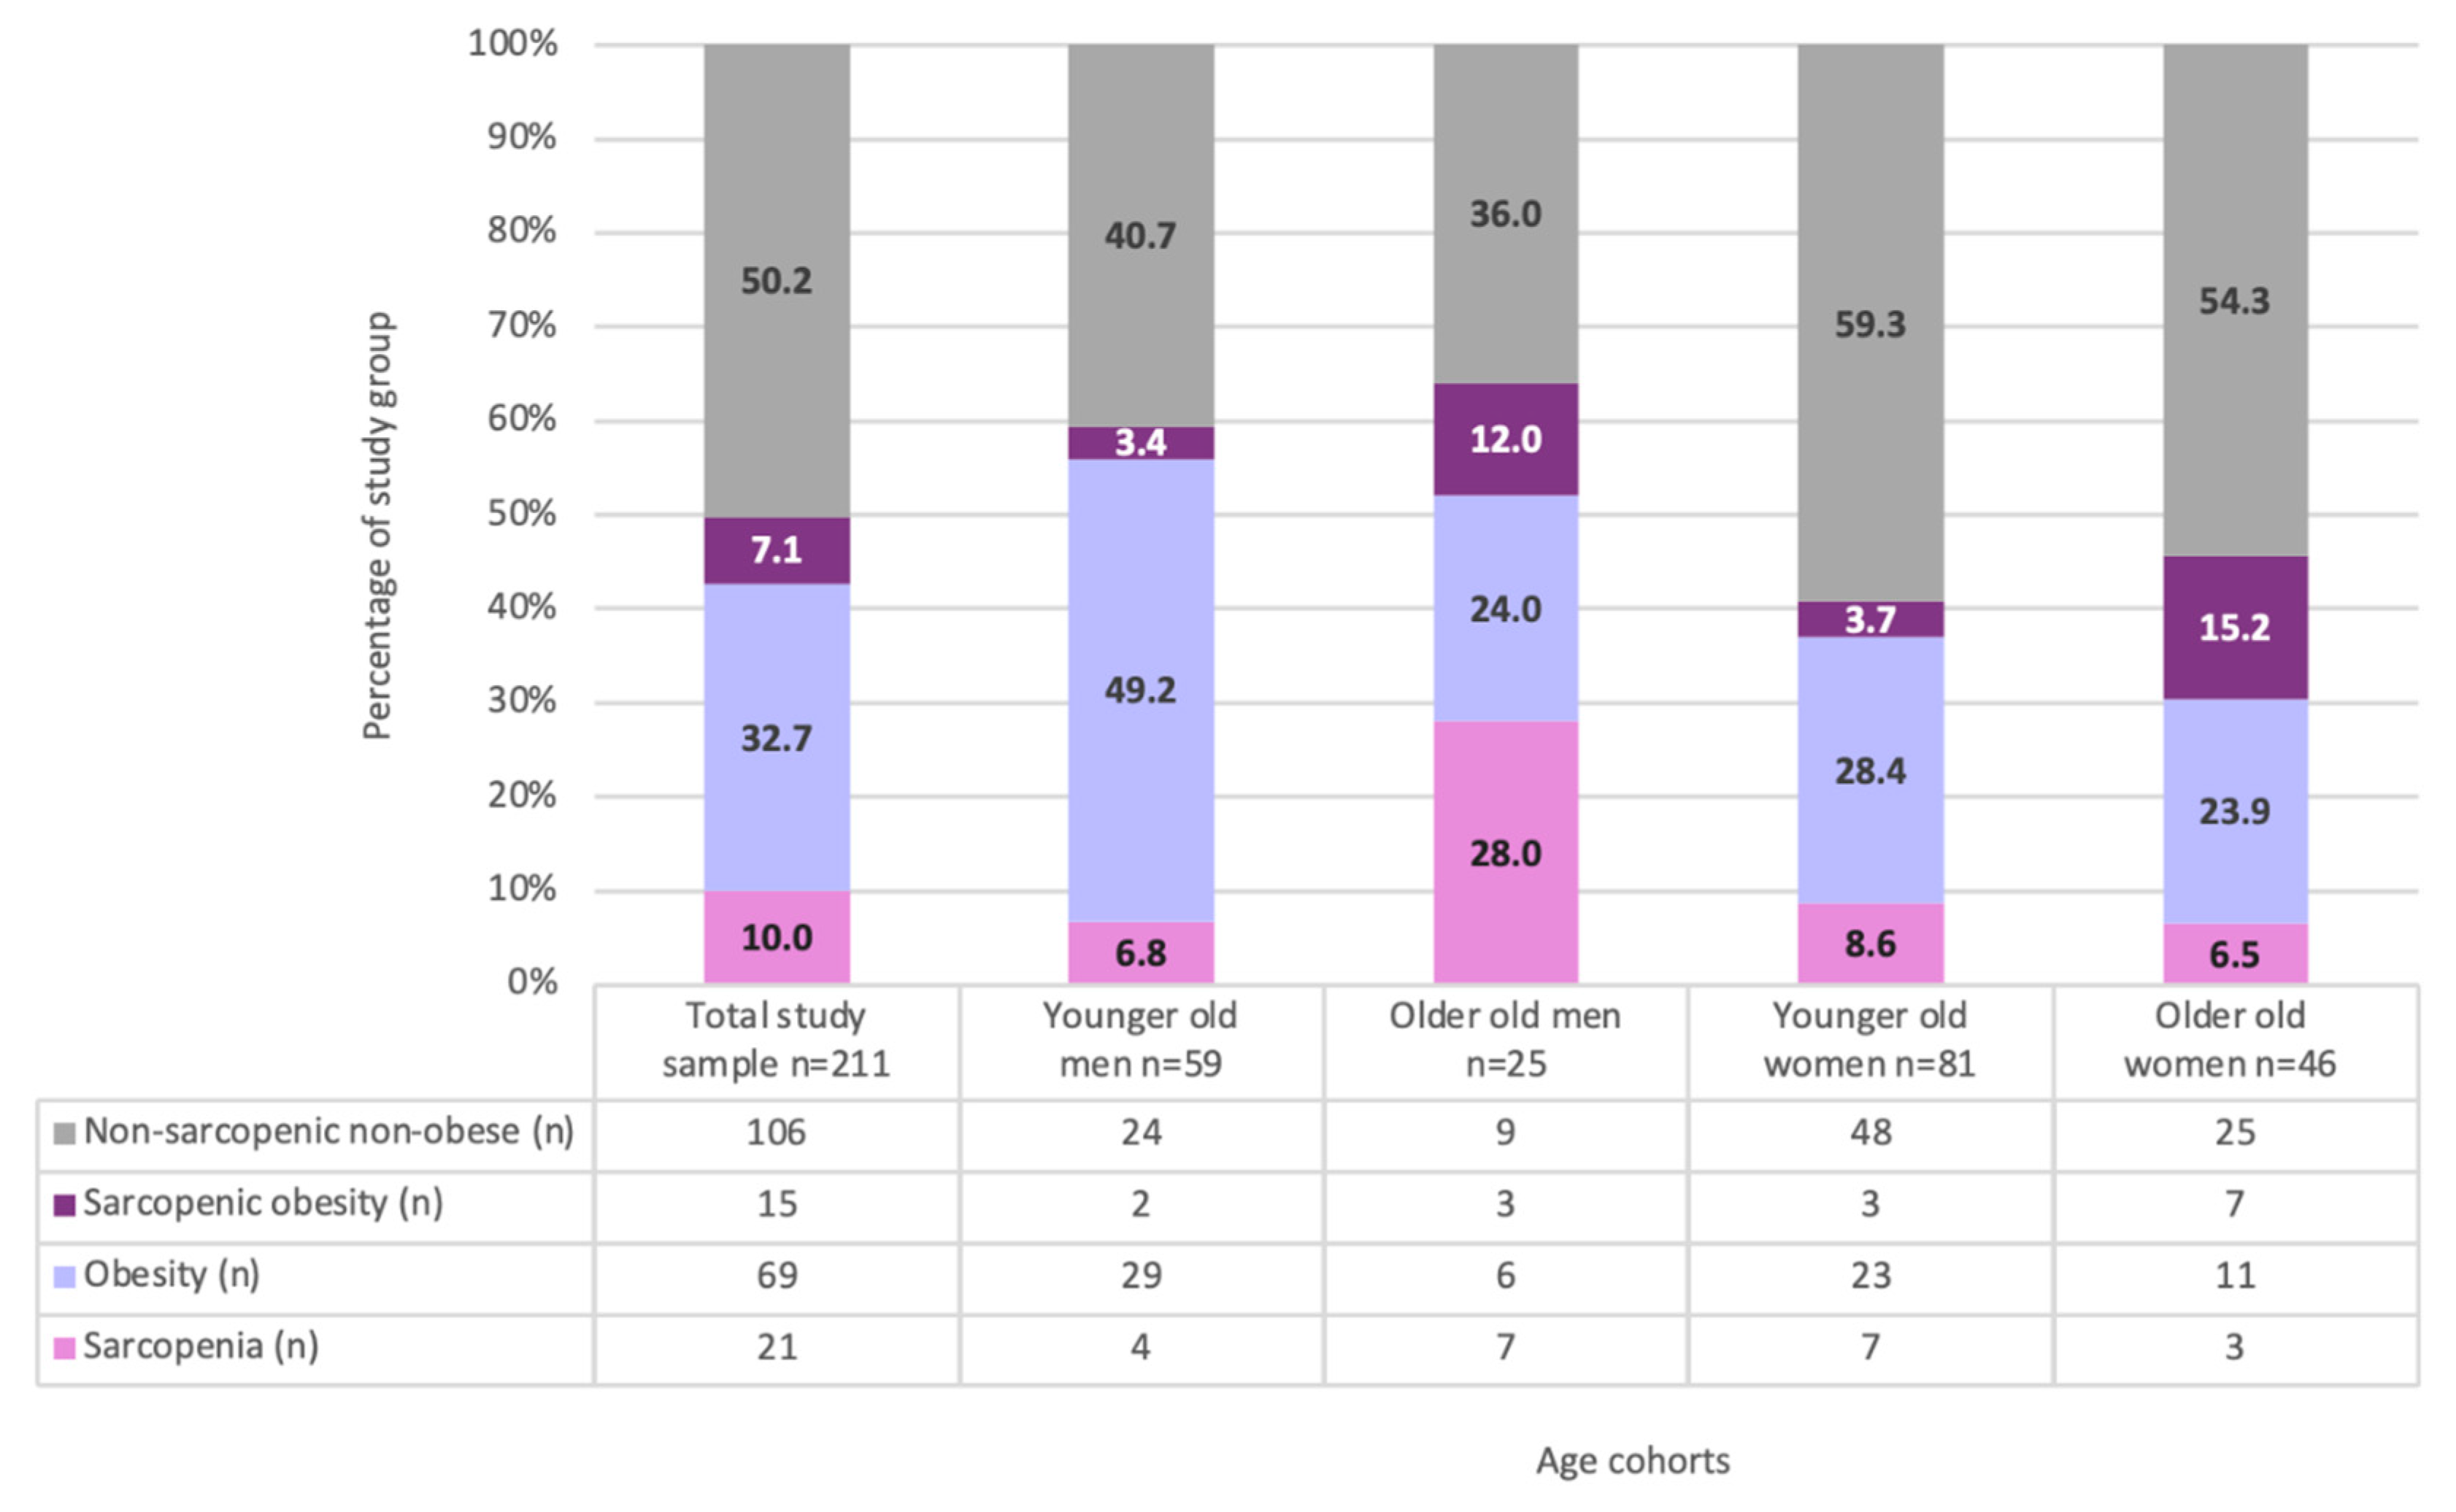
3.2. Body Composition Phenotypes
3.2.1. Sarcopenia Phenotype
3.2.2. Obesity Phenotype
3.2.3. Sarcopenic Obesity Phenotype
3.2.4. ‘Normal’ Phenotype (Non-Sarcopenic, Non-Obese)
4. Discussion
5. Conclusions
Supplementary Materials
Author Contributions
Funding
Institutional Review Board Statement
Informed Consent Statement
Data Availability Statement
Conflicts of Interest
References
- Mitchell, W.K.; Williams, J.; Atherton, P.; Larvin, M.; Lund, J.; Narici, M. Sarcopenia, dynapenia, and the impact of advancing age on human skeletal muscle size and strength; a quantitative review. Front. Physiol. 2012, 3, 260. [Google Scholar] [CrossRef] [PubMed] [Green Version]
- Kuk, J.L.; Saunders, T.J.; Davidson, L.E.; Ross, R. Age-related changes in total and regional fat distribution. Ageing Res. Rev. 2009, 8, 339–348. [Google Scholar] [CrossRef] [PubMed]
- Batsis, J.A.; Villareal, D.T. Sarcopenic obesity in older adults: Aetiology, epidemiology and treatment strategies. Nat. Rev. Endocrinol. 2018, 14, 513–537. [Google Scholar] [CrossRef] [PubMed]
- Wannamethee, S.; Atkins, J. Muscle loss and obesity: The health implications of sarcopenia and sarcopenic obesity. Proc. Nutr. Soc. 2015, 74, 405–412. [Google Scholar] [CrossRef]
- Morgan, P.T.; Smeuninx, B.; Breen, L. Exploring the Impact of Obesity on Skeletal Muscle Function in Older Age. Front. Nutr. 2020, 7, 569904. [Google Scholar] [CrossRef]
- Inzitari, M.; Doets, E.; Bartali, B.; Benetou, V.; Di Bari, M.; Visser, M.; Volpato, S.; Gambassi, G.; Topinkova, E.; De Groot, L.; et al. Nutrition in the age-related disablement process. J. Nutr. Health Aging 2011, 15, 599–604. [Google Scholar] [CrossRef] [Green Version]
- JafariNasabian, P.; Inglis, J.E.; Reilly, W.; Kelly, O.J.; Ilich, J.Z. Aging human body: Changes in bone, muscle and body fat with consequent changes in nutrient intake. J. Endocrinol. 2017, 234, 37–51. [Google Scholar] [CrossRef] [Green Version]
- Mau, T.; Yung, R. Adipose tissue inflammation in aging. Exp. Gerontol. 2018, 105, 27–31. [Google Scholar] [CrossRef]
- Ou, M.Y.; Zhang, H.; Tan, P.C.; Zhou, S.B.; Li, Q.F. Adipose tissue aging: Mechanisms and therapeutic implications. Cell Death Dis. 2022, 13, 300. [Google Scholar] [CrossRef]
- Correa-de-Araujo, R.; Addison, O.; Miljkovic, I.; Goodpaster, B.H.; Bergman, B.C.; Clark, R.V.; Elena, J.W.; Esser, K.A.; Ferrucci, L.; Harris-Love, M.O.; et al. Myosteatosis in the Context of Skeletal Muscle Function Deficit: An Interdisciplinary Workshop at the National Institute on Aging. Front. Physiol. 2020, 11, 963. [Google Scholar] [CrossRef]
- Ahn, H.; Kim, D.W.; Ko, Y.; Ha, J.; Shin, Y.B.; Lee, J.; Sung, Y.S.; Kim, K.W. Updated systematic review and meta-analysis on diagnostic issues and the prognostic impact of myosteatosis: A new paradigm beyond sarcopenia. Ageing Res. Rev. 2021, 70, 101398. [Google Scholar] [CrossRef] [PubMed]
- Kim, H.K.; Kim, C.H. Quality Matters as Much as Quantity of Skeletal Muscle: Clinical Implications of Myosteatosis in Cardiometabolic Health. Endocrinol. Metab. 2021, 36, 1161–1174. [Google Scholar] [CrossRef]
- Krzymińska-Siemaszko, R.; Deskur-Śmielecka, E.; Kaluźniak-Szymanowska, A.; Kaczmarek, B.; Kujawska-Danecka, H.; Klich-Rączka, A.; Mossakowska, M.; Małgorzewicz, S.; Dworak, L.B.; Kostka, T.; et al. Socioeconomic Risk Factors of Poor Nutritional Status in Polish Elderly Population: The Results of PolSenior2 Study. Nutrients 2021, 13, 4388. [Google Scholar] [CrossRef] [PubMed]
- Krzymińska-Siemaszko, R.; Mossakowska, M.; Skalska, A.; Klich-Rączka, A.; Tobis, S.; Szybalska, A.; Cylkowska-Nowak, M.; Olszanecka-Glinianowicz, M.; Chudek, J.; Wieczorowska-Tobis, K. Social and economic correlates of malnutrition in Polish elderly population: The results of PolSenior study. J. Nutr. Health Aging 2015, 19, 397–402. [Google Scholar] [CrossRef] [PubMed]
- Norman, K.; Haß, U.; Pirlich, M. Malnutrition in Older Adults-Recent Advances and Remaining Challenges. Nutrients 2021, 13, 2764. [Google Scholar] [CrossRef]
- Shiota, A.; Nakayama, N.; Saito, Y.; Maeda, T.; Maeda, Y.; Nakayama, K. Prevalence and Associated Factors of Malnutrition and Sarcopenia in a Daycare Facility: A Cross-Sectional Study. Healthcare 2020, 4, 576. [Google Scholar] [CrossRef]
- Sieber, C.C. Malnutrition and sarcopenia. Aging Clin. Exp. Res. 2019, 6, 793–798. [Google Scholar] [CrossRef]
- Vandewoude, M.F.; Alish, C.J.; Sauer, A.C.; Hegazi, R.A. Malnutrition-sarcopenia syndrome: Is this the future of nutrition screening and assessment for older adults? J. Aging Res. 2012, 2012, 651570. [Google Scholar] [CrossRef]
- Beaudet, C.; Zakaria, M.; Pasleau, F.; Reginster, J.Y.; Bruyère, O. Health Outcomes of Sarcopenia: A Systematic Review and Meta-Analysis. PLoS ONE 2017, 12, e0169548. [Google Scholar] [CrossRef] [Green Version]
- Yeung, S.S.Y.; Reijnierse, E.M.; Pham, V.K.; Trappenburg, M.C.; Lim, W.K.; Meskers, C.G.M.; Maier, A.B. Sarcopenia and its association with falls and fractures in older adults: A systematic review and meta-analysis. J. Cachexia Sarcopenia Muscle 2019, 10, 485–500. [Google Scholar] [CrossRef] [Green Version]
- Shafiee, G.; Keshtkar, A.; Soltani, A.; Ahadi, Z.; Larijani, B.; Heshmat, R. Prevalence of sarcopenia in the world: A systematic review and meta-analysis of general population studies. J. Diabetes Metab. Disord. 2017, 16, 16–21. [Google Scholar] [CrossRef] [PubMed] [Green Version]
- Eurostat. Overweight and Obesity—BMI Statistics. Available online: https://ec.europa.eu/eurostat/statistics-explained/index.php?title=Overweight_and_obesity_-_BMI_statistics (accessed on 2 March 2022).
- Zamboni, M.; Mazzali, G. Obesity in the elderly: An emerging health issue. Int. J. Obes. 2012, 36, 1151–1152. [Google Scholar] [CrossRef] [PubMed] [Green Version]
- Mathus-Vliegen, E. Obesity and the Elderly. J. Clin. Gastroenterol. 2012, 46, 533–544. [Google Scholar] [CrossRef] [Green Version]
- Kohara, K. Sarcopenic obesity in aging population: Current status and future directions for research. Endocrine 2014, 45, 15–25. [Google Scholar] [CrossRef] [PubMed]
- Xie, W.Q.; Xiao, G.L.; Fan, Y.B.; He, M.; Lv, S.; Li, Y.S. Sarcopenic obesity: Research advances in pathogenesis and diagnostic criteria. Aging Clin. Exp. Res. 2021, 33, 247–252. [Google Scholar] [CrossRef] [PubMed]
- Polyzos, S.A.; Margioris, A.N. Sarcopenic obesity. Hormones 2018, 17, 321–331. [Google Scholar] [CrossRef] [PubMed]
- Stenholm, S.; Harris, T.B.; Rantanen, T.; Visser, M.; Kritchevsky, S.B.; Ferrucci, L. Sarcopenic obesity: Definition, cause and consequences. Curr. Opin. Clin. Nutr. Metab. Care 2008, 11, 693–700. [Google Scholar] [CrossRef] [Green Version]
- Atkins, J.L.; Wannamathee, S.G. Sarcopenic obesity in ageing: Cardiovascular outcomes and mortality. Br. J. Nutr. 2020, 124, 1102–1113. [Google Scholar] [CrossRef]
- Roh, E.; Choi, K.M. Health Consequences of Sarcopenic Obesity: A Narrative Review. Front. Endocrinol. 2020, 11, 332. [Google Scholar] [CrossRef]
- Gao, Q.; Mei, F.; Shang, Y.; Hu, K.; Chen, F.; Zhao, L.; Ma, B. Global prevalence of sarcopenic obesity in older adults: A systematic review and meta-analysis. Clin. Nutr. 2021, 40, 4633–4641. [Google Scholar] [CrossRef]
- Ethgen, O.; Beaudart, C.; Buckinx, F.; Bruyère, O.; Reginster, J.Y. The Future Prevalence of Sarcopenia in Europe: A Claim for Public Health Action. Calcif. Tissue Int. 2017, 100, 229–234. [Google Scholar] [CrossRef] [PubMed] [Green Version]
- Bruyère, O.; Beaudart, C.; Ethgen, O.; Reginster, J.Y.; Locquet, M. The health economics burden of sarcopenia: A systematic review. Maturitas 2019, 119, 61–69. [Google Scholar] [CrossRef] [PubMed] [Green Version]
- Tremmel, M.; Gerdtham, U.G.; Nilsson, P.M.; Saha, S. Economic Burden of Obesity: A Systematic Literature Review. Int. J. Environ. Res. Public Health 2017, 14, 435. [Google Scholar] [CrossRef] [PubMed]
- Haigis, D.; Matting, L.; Wagner, S.; Sudeck, G.; Frahsa, A.; Thiel, A.; Eschweiler, G.; Nieß, A.M. Identification of Sarcopenic Obesity in German Nursing Home Residents-The Role of Body Composition and Malnutrition in the BaSAlt Cohort-Study. Nutrients 2021, 13, 3791. [Google Scholar] [CrossRef]
- Liu, X.; Hao, Q.; Yue, J.; Hou, L.; Xia, X.; Zhao, W.; Zhang, Y.; Ge, M.; Ge, N.; Dong, B. Sarcopenia, Obesity and Sarcopenia Obesity in Comparison: Prevalence, Metabolic Profile, and Key Differences: Results from WCHAT Study. J. Nutr. Health Aging 2020, 24, 429–437. [Google Scholar] [CrossRef]
- Öztürk, Z.A.; Türkbeyler, İ.H.; Abiyev, A.; Kul, S.; Edizer, B.; Yakaryılmaz, F.D.; Soylu, G. Health-related quality of life and fall risk associated with age-related body composition changes; sarcopenia, obesity and sarcopenic obesity. Intern. Med. J. 2018, 48, 973–981. [Google Scholar] [CrossRef]
- Wang, H.; Hai, S.; Liu, Y.X.; Cao, L.; Liu, Y.; Liu, P.; Yang, Y.; Dong, B.R. Associations between Sarcopenic Obesity and Cognitive Impairment in Elderly Chinese Community-Dwelling Individuals. J. Nutr. Health Aging 2019, 23, 14–20. [Google Scholar] [CrossRef]
- Demirdağ, F.; Kolbaşı, E.N.; Aykut, G.B.; Güler, K.Y.; Murat, S.; Oztürk, G.B.; Oğuz, A. Nutritional status as a mediator between the age-related muscle loss and frailty in community-dwelling older adults. Arch. Gerontol. Geriatr. 2022, 98, 104569. [Google Scholar] [CrossRef]
- Jitapunkul, S.; Pillay, I.; Ebrahim, S. The Abbreviated Mental Test: Its Use and Validity. Age Ageing 1991, 20, 332–336. [Google Scholar] [CrossRef]
- Cederholm, T.; Barazzoni, R.; Austin, P.; Ballmer, P.; Biolo, G.; Bischoff, S.C.; Compher, C.; Correia, I.; Higashiguchi, T.; Holst, M.; et al. ESPEN guidelines on definitions and terminology of clinical nutrition. Clin. Nutr. 2017, 36, 49–64. [Google Scholar] [CrossRef]
- Cruz-Jentoft, A.J.; Bahat, G.; Bauer, J.; Boirie, Y.; Bruyère, O.; Cederholm, T.; Cooper, C.; Landi, F.; Rolland, Y.; Sayer, A.A.; et al. Writing Group for the European Working Group on Sarcopenia in Older People 2 (EWGSOP2), and the Extended Group for EWGSOP2. Sarcopenia: Revised European consensus on definition and diagnosis. Age Ageing 2019, 48, 16–31. [Google Scholar] [CrossRef] [PubMed] [Green Version]
- Krzymińska-Siemaszko, R.; Fryzowicz, A.; Czepulis, N.; Kaluźniak-Szymanowska, A.; Dworak, L.B.; Wieczorowska-Tobis, K. The impact of the age range of young healthy reference population on the cut-off points for low muscle mass necessary for the diagnosis of sarcopenia. Eur. Rev. Med. Pharmacol. Sci. 2019, 23, 4321–4332. [Google Scholar] [CrossRef] [PubMed]
- von Berens, A.; Obling, S.R.; Nydahl, M.; Koochek, A.; Lissner, L.; Skoog, I.; Frändin, K.; Skoglund, E.; Rothenberg, E.; Cederholm, T. Sarcopenic obesity and associations with mortality in older women and men—A prospective observational study. BMC Geriatr. 2020, 20, 199. [Google Scholar] [CrossRef] [PubMed]
- Gallagher, D.; Heymsfield, S.B.; Heo, M.; Jebb, S.A.; Murgatroyd, P.R.; Sakamoto, Y. Healthy percentage body fat ranges: An approach for developing guidelines based on body mass index. Am. J. Clin. Nutr. 2000, 72, 694–701. [Google Scholar] [CrossRef] [PubMed]
- Donini, L.M.; Busetto, L.; Bischoff, S.C.; Cederholm, T.; Ballesteros-Pomar, M.D.; Batsis, J.A.; Bauer, J.M.; Boirie, Y.; Cruz-Jentoft, A.J.; Dicker, D.; et al. Definition and Diagnostic Criteria for Sarcopenic Obesity: ESPEN and EASO Consensus Statement. Obes. Facts 2022, 23, 321–335. [Google Scholar] [CrossRef]
- Studenski, S.A.; Peters, K.W.; Alley, D.E.; Cawthon, P.M.; McLean, R.R.; Harris, T.B.; Ferrucci, L.; Guralnik, J.M.; Fragala, M.S.; Kenny, A.M.; et al. The FNIH sarcopenia project: Rationale, study description, conference recommendations, and final estimates. J. Gerontol. A Biol. Sci. Med. Sci. 2014, 69, 547–558. [Google Scholar] [CrossRef]
- Mayhew, A.J.; Among, K.; Phillips, S.; Parise, G.; McNicholas, P.D.; de Souza, R.J.; Thabane, L.; Raina, P. The prevalence of sarcopenia in community-dwelling older adults, an exploration of differences between studies and within definitions: A systematic review and meta-analyses. Age Ageing 2019, 48, 48–56. [Google Scholar] [CrossRef] [Green Version]
- Donini, L.M.; Busetto, L.; Bauer, J.M.; Bischoff, S.; Boirie, Y.; Cederholm, T.; Cruz-Jentoft, A.J.; Dicker, D.; Frühbeck, G.; Giustina, A.; et al. Critical appraisal of definitions and diagnostic criteria for sarcopenic obesity based on a systematic review. Clin. Nutr. 2020, 39, 2368–2388. [Google Scholar] [CrossRef]
- Khor, E.Q.; Lim, J.P.; Tay, L.; Yeo, A.; Yew, S.; Ding, Y.Y.; Lim, W.S. Obesity Definitions in Sarcopenic Obesity: Differences in Prevalence, Agreement and Association with Muscle Function. J. Frailty Aging 2020, 9, 37–43. [Google Scholar] [CrossRef]
- Purcell, S.A.; Mackenzie, M.; Barbosa-Silva, T.G.; Dionne, I.J.; Ghosh, S.; Siervo, M.; Ye, M.; Prado, C.M. Prevalence of Sarcopenic Obesity Using Different Definitions and the Relationship With Strength and Physical Performance in the Canadian Longitudinal Study of Aging. Front. Physiol. 2021, 21, 11–583825. [Google Scholar] [CrossRef]
- Khanal, P.; Williams, A.G.; He, L.; Stebbings, G.K.; Onambele-Pearson, G.L.; Thomis, M.; Degens, H.; Morse, C.I. Sarcopenia, Obesity, and Sarcopenic Obesity: Relationship with Skeletal Muscle Phenotypes and Single Nucleotide Polymorphisms. J. Clin. Med. 2021, 10, 4933. [Google Scholar] [CrossRef] [PubMed]
- Bahat, G.; Kilic, C.; Ozkok, S.; Ozturk, S.; Karan, M.A. Associations of sarcopenic obesity versus sarcopenia alone with functionality. Clin. Nutr. 2021, 40, 2851–2859. [Google Scholar] [CrossRef]
- Tyrovolas, S.; Koyanagi, A.; Olaya, B.; Ayuso-Mateos, J.L.; Miret, M.; Chatterji, S.; Tobiasz-Adamczyk, B.; Koskinen, S.; Leonardi, M.; Haro, J.M. The role of muscle mass and body fat on disability among older adults: A cross-national analysis. Exp. Gerontol. 2015, 69, 27–35. [Google Scholar] [CrossRef]
- Sui, S.X.; Holloway-Kew, K.L.; Hyde, N.K.; Williams, L.J.; Tembo, M.C.; Leach, S.; Pasco, J.A. Prevalence of Sarcopenia Employing Population-Specific Cut-Points: Cross-Sectional Data from the Geelong Osteoporosis Study, Australia. J. Clin. Med. 2021, 10, 343. [Google Scholar] [CrossRef]
- Batsis, J.A.; Mackenzie, T.A.; Jones, J.D.; Lopez-Jimenez, F.; Bartels, S.J. Sarcopenia, sarcopenic obesity and inflammation: Results from the 1999-2004 National Health and Nutrition Examination Survey. Clin. Nutr. 2016, 35, 1472–1483. [Google Scholar] [CrossRef]
- Lee, D.C.; Shook, R.P.; Drenowatz, C.; Blair, S.N. Physical activity and sarcopenic obesity: Definition, assessment, prevalence and mechanism. Future Sci. OA 2016, 2, FSO127. [Google Scholar] [CrossRef] [Green Version]
- Kim, Y.S.; Lee, Y.; Chung, Y.S.; Lee, D.J.; Joo, N.S.; Hong, D.; Song, G.; Kim, H.J.; Choi, Y.J.; Kim, K.M. Prevalence of sarcopenia and sarcopenic obesity in the Korean population based on the Fourth Korean National Health and Nutritional Examination Surveys. J. Gerontol. A Biol. Sci. Med. Sci. 2012, 67, 1107–1113. [Google Scholar] [CrossRef] [PubMed]
- Batsis, J.A.; Mackenzie, T.A.; Bartels, S.J.; Sahakyan, K.R.; Somers, V.K.; Lopez-Jimenez, F. Diagnostic accuracy of body mass index to identify obesity in older adults: NHANES 1999-2004. Int. J. Obes. 2016, 40, 761–767. [Google Scholar] [CrossRef] [PubMed] [Green Version]
- Merchant, R.A.; Seetharaman, S.; Au, L.; Wong, M.W.K.; Wong, B.L.L.; Tan, L.F.; Chen, M.Z.; Ng, S.E.; Soong, J.T.Y.; Hui, R.J.Y.; et al. Relationship of Fat Mass Index and Fat Free Mass Index With Body Mass Index and Association With Function, Cognition and Sarcopenia in Pre-Frail Older Adults. Front. Endocrinol. 2021, 12, 765415. [Google Scholar] [CrossRef]
- Zhang, Y.J.; Fu, S.H.; Wang, X.J.; Zhao, X.; Zeng, Q.; Li, X.Y. Predictive value of percentage body fat in aging people with low muscle mass: A 2.2-year longitudinal study. Arch. Gerontol. Geriatr. 2019, 82, 167–171. [Google Scholar] [CrossRef]
- Lührmann, P.M.; Bender, R.; Edelmann-Schäfer, B.; Neuhäuser-Berthold, M. Longitudinal changes in energy expenditure in an elderly German population: A 12-year follow-up. Eur. J. Clin. Nutr. 2009, 63, 986–992. [Google Scholar] [CrossRef] [PubMed]
- Pes, G.M.; Loriga, S.; Errigo, A.; Tedde, P.; Dore, M.P. Is mini-nutritional assessment a reliable tool in detecting malnutrition in elderly with body weight excess? Eat. Weight Disord. 2020, 25, 1425–1435. [Google Scholar] [CrossRef] [PubMed]
- Cederholm, T.; Jensen, G.L.; Correia, M.I.T.D.; Gonzalez, M.C.; Fukushima, R.; Higashiguchi, T.; Baptista, G.; Barazzoni, R.; Blaauw, R.; Coats, A.; et al. GLIM Core Leadership Committee; GLIM Working Group. GLIM criteria for the diagnosis of malnutrition—A consensus report from the global clinical nutrition community. Clin. Nutr. 2019, 38, 207–217. [Google Scholar] [CrossRef] [PubMed] [Green Version]
- Barazzoni, R.; Cappellari, G. Double burden of malnutrition in persons with obesity. Rev. Endocr. Metab. Disord. 2020, 21, 307–313. [Google Scholar] [CrossRef] [PubMed]
- Sato, P.H.R.; Ferreira, A.A.; Rosado, E.L. The prevalence and risk factors for sarcopenia in older adults and long-living older adults. Arch. Gerontol. Great. 2020, 89, 104089. [Google Scholar] [CrossRef]
- Batsis, J.A.; Barre, L.K.; Mackenzie, T.A.; Pratt, S.I.; Lopez-Jimenez, F.; Bartels, S.J. Variation in the prevalence of sarcopenia and sarcopenic obesity in older adults associated with different research definitions: Dual-energy X-ray absorptiometry data from the National Health and Nutrition Examination Survey 1999–2004. J. Am. Geriatr. 2013, 61, 974–980. [Google Scholar] [CrossRef]
- Chang, C.S.; Chang, Y.F.; Liu, P.Y.; Wu, S.J.; Chiu, C.J.; Chen, C.Y.; Wu, C.H. Interaction of central obesity and sarcopenia on nutritional status in the community-dwelling older people. Arch. Gerontol. Geriatr. 2020, 87, 104003. [Google Scholar] [CrossRef]


| Variable | Total Study Sample (n = 211) | Men (n = 84) | Women (n = 127) | ||||
|---|---|---|---|---|---|---|---|
| Younger Old (n = 59) | Older Old (n = 25) | p | Younger Old (n = 81) | Older Old (n = 46) | p | ||
| Mean (SD) | Mean (SD) | Mean (SD) | Mean (SD) | Mean (SD) | |||
| Age [years] | 72.4 (7.0) | 67.3 (4.1) | 80.8 (3.9) | 0.0000 | 68.9 (3.5) | 80.3 (4.2) | 0.0000 |
| Height [m] | 1.6 (0.1) | 1.7 (0.1) | 1.7 (0.1) | 0.2437 | 1.6 (0.1) | 1.6 (0.1) | 0.3090 |
| Body weight [kg] | 72.7 (15.9) | 82.6 (15.7) | 74.8 (12.0) | 0.0291 | 67.9 (15.4) | 67.1 (12.9) | 0.7563 |
| BMI [kg/m2] | 27.4 (5.4) | 27.8 (4.9) | 25.8 (4.0) | 0.0716 | 27.5 (6.0) | 27.7 (5.5) | 0.8415 |
| MNA-SF | 11.9 (2.2) | 12.5 (1.9) | 11.9 (2.3) | 0.2310 | 11.7 (2.6) | 11.6 (1.9) | 0.2511 |
| MNA-LF | 24.7 (3.6) | 25.3 (2.9) | 24.6 (3.8) | 0.4712 | 24.5 (4.2) | 24.5 (3.0) | 0.3725 |
| MNA Domain I | 6.9 (1.8) | 7.2 (1.5) | 6.8 (1.9) | 0.3318 | 6.7 (2.0) | 6.8 (1.7) | 0.8091 |
| MNA Domain II | 7.2 (1.4) | 7.5 (1.3) | 7.1 (1.3) | 0.2706 | 7.3 (1.5) | 7.0 (1.4) | 0.1421 |
| MNA Domain III | 7.8 (1.1) | 7.8 (0.9) | 7.6 (1.0) | 0.3454 | 7.8 (1.2) | 7.9 (1.0) | 0.9549 |
| MNA Domain IV | 2.8 (1.0) | 2.8 (0.9) | 3.0 (1.0) | 0.3038 | 2.7 (1.1) | 2.8 (1.1) | 0.5479 |
| n (%) | n (%) | n (%) | n (%) | n (%) | |||
| Marital status | |||||||
| Unmarried | 95 (46.1) | 11 (19.0) | 10 (40.0) | 0.0431 | 43 (55.8) | 31 (67.4) | 0.2056 |
| Married | 111 (53.9) | 47 (81.0) | 15 (60.0) | 34 (44.2) | 15 (32.6) | ||
| Residential pattern a | |||||||
| Living alone | 70 (34.0) | 7 (12.1) | 6 (24.0) | 0.2970 | 31 (40.3) | 26 (56.5) | 0.0801 |
| Living with a mate | 136 (66.0) | 51 (87.9) | 19 (76.0) | 46 (59.7) | 20 (43.5) | ||
| Education level b | |||||||
| Lower than primary or primary | 14 (6.8) | 3 (5.2) | 1 (4.0) | 0.7416 | 4 (5.2) | 6 (13.3) | 0.2153 |
| Higher than primary | 191 (93.2) | 55 (94.8) | 24 (96.0) | 73 (94.8) | 39 (86.7) | ||
| MNA-SF | |||||||
| Malnutrition | 13 (6.2) | 2 (3.4) | 2 (8.0) | 0.4871 | 7 (8.6) | 2 (4.3) | 0.1105 |
| At risk of malnutrition | 49 (23.2) | 8 (13.6) | 5 (20.0) | 18 (22.2) | 18 (39.1) | ||
| Normal nutritional status | 149 (70.6) | 49 (83.1) | 18 (72.0) | 56 (69.1) | 26 (56.5) | ||
| MNA-LF | |||||||
| Malnutrition | 7 (3.3) | 0 (0.0) | 1 (4.0) | 0.2882 | 6 (7.4) | 0 (0.00 | 0.0133 |
| At risk of malnutrition | 59 (28.0) | 16 (27.1) | 7 (28.0) | 18 (22.2) | 18 (39.1) | ||
| Normal nutritional status | 145 (68.7) | 43 (72.9) | 17 (68.0) | 57 (70.4) | 28 (60.9) | ||
| Nutritional status | |||||||
| PNS | 66 (31.3) | 16 (27.1) | 8 (32.0) | 0.6507 | 24 (29.6) | 18 (39.1) | 0.2740 |
| Normal nutritional status | 145 (68.7) | 43 (72.9) | 17 (68.0) | 57 (70.4) | 28 (60.9) | ||
| (a) | |||||
| Variable | Sarcopenia (n = 21) | Obesity (n = 69) | SO (n = 15) | Non-Sarcopenic Non-Obese (n = 106) | p |
| Sex | |||||
| Women | 10 (47.62) | 34 (49.28) | 10 (66.67) | 73 (68.87) | 0.1351 |
| Men | 11 (52.38) | 35 (50.72) | 5 (33.33) | 33 (31.13) | |
| Age cohorts | |||||
| Younger old | 11 (52.38) | 52 (75.36) | 5 (33.33) | 72 (67.92) | 0.0378 |
| Older old | 10 (47.62) | 17 (24.64) | 10 (66.67) | 34 (32.08) | |
| Marital status a | |||||
| Unmarried | 9 (47.4) | 25 (36.8) | 10 (66.7) | 51 (49.0) | 0.1503 |
| Married | 10 (52.6) | 43 (63.2) | 5 (33.3) | 53 (51.0) | |
| Residential pattern a | |||||
| Living alone | 6 (31.6) | 20 (29.4) | 5 (33.3) | 39 (37.5) | 0.7390 |
| Living with a mate | 13 (68.4) | 48 (70.6) | 10 (66.7) | 65 (62.5) | |
| Education level b | |||||
| Lower than primary or primary | 1 (5.6) | 5 (7.4) | 5 (33.3) | 3 (2.9) | 0.0060 |
| Higher than primary | 17 (94.4) | 63 (92.6) | 10 (66.7) | 101 (97.1) | |
| Number of chronic diseases a [mean (SD)] | 3.7 (1.6) | 3.1 (1.6) | 5.1 (2.2) | 3.1 (1.7) | 0.0043 |
| Number of prescribed drugs c [mean (SD)] | 6.2 (3.3) | 6.0 (3.7) | 9.5 (4.0) | 5.2 (4.0) | 0.0013 |
| AMTS [mean (SD)] | 9.1 (0.7) | 9.5 (0.6) | 9.2 (0.9) | 9.4 (0.6) | 0.0736 |
| ADL d [mean (SD)] | 5.7 (0.3) | 5.9 (0.3) | 5.2 (0.8) | 5.8 (0.3) | 0.0000 |
| IADL d [mean (SD)] | 23.5 (2.5) | 26.0 (1.7) | 21.1 (4.0) | 25.8 (2.1) | 0.0000 |
| MNA-SF [mean (SD)] | 9.2 (3.0) | 12.8 (1.3) | 11.6 (1.9) | 11.9 (2.2) | 0.0000 |
| MNA-LF[mean (SD)] | 20.2 (4.5) | 26.1 (2.1) | 23.4 (2.7) | 24.9 (3.5) | 0.0000 |
| (b) | |||||
| Variable | Sarcopenia (n = 21) | Obesity (n = 69) | SO (n = 15) | Non-Sarcopenic Non-Obese (n = 106) | p |
| Age [years] | 74.5 (8.2) | 70.3 (6.4) | 78.9 (6.0) | 72.3 (6.6) | 0.0002 |
| Height [m] | 1.6 (0.1) | 1.6 (0.1) | 1.6 (0.1) | 1.6 (0.1) | 0.0053 |
| Body weight [kg] | 54.9 (11.7) | 85.8 (11.8) | 82.3 (11.0) | 66.3 (12.1) | 0.0000 |
| BMI [kg/m2] | 20.9 (3.0) | 31.6 (3.4) | 34.2 (5.1) | 25.0 (3.6) | 0.0000 |
| Mid-arm circumference [cm] e | 22.35 (2.71) | 30.08 (2.92) | 32.11 (5.28) | 26.33 (3.29) | 0.0000 |
| Calf circumference [cm] f | 30.56 (3.80) | 38.84 (3.23) | 38.35 (3.03) | 35.03 (3.53) | 0.0000 |
| TBW [l] | 29.7 (5.7) | 37.7 (6.9) | 33.4 (5.1) | 34.0 (6.9) | 0.0000 |
| FM [kg] | 14.6 (5.8) | 34.6 (7.1) | 37.0 (6.9) | 20.4 (6.7) | 0.0000 |
| PBF [%] | 25.2 (7.2) | 40.4 (6.6) | 44.9 (4.8) | 30.3 (7.8) | 0.0000 |
| SMM [kg] | 21.5 (4.5) | 28.2 (5.5) | 24.6 (4.1) | 25.2 (5.6) | 0.0000 |
| FFM [kg] | 40.3 (7.6) | 51.2 (9.3) | 45.2 (6.9) | 45.9 (9.8) | 0.0000 |
| ALM upper limbs [kg] | 3.9 (1.2) | 5.9 (1.5) | 5.2 (1.2) | 4.8 (1.6) | 0.0000 |
| ALM lower limbs [kg] | 11.6 (3.0) | 15.2 (3.2) | 12.9 (2.3) | 13.5 (3.2) | 0.0000 |
| ALM [kg] | 15.4 (4.1) | 21.1 (4.6) | 18.1 (3.4) | 18.4 (4.7) | 0.0000 |
| ALM index [kg/m2] | 5.8 (1.0) | 7.7 (1.0) | 7.5 (1.0) | 6.8 (1.10 | 0.0000 |
| ALM/BMI | 0.7 (0.2) | 0.7 (0.2) | 0.5 (0.1) | 0.7 (0.2) | 0.0001 |
| Low muscle mass as low ALM index [n (%)] | 21 (100.0) | 5 (7.2) | 2 (13.3) | 21 (19.8) | 0.0000 |
| Low muscle mass as low ALM/BMI [n (%)] | 3 (14.3) | 23 (33.3) | 15 (100.0) | 9 (8.5) | 0.0000 |
| (c) | |||||
| Variable |
Sarcopenia (n = 21) |
Obesity (n = 69) |
SO (n = 15) |
Non-Sarcopenic Non-Obese (n = 106) | p |
| The best of four upper limb strength measurements [kg] | 18.9 (4.20) | 31.7 (9.8) | 17.0 (6.0) | 27.2 (9.5) | 0.0000 |
| Five-Repetition Sit-to-Stand test [s] g | 18.0 (7.3) | 12.1 (4.5) | 17.6 (4.9) | 12.4 (4.3) | 0.0000 |
| 4 m usual walking speed test [m/s] | 0.7 (0.3) | 1.1 (0.3) | 0.6 (0.3) | 1.0 (0.4) | 0.0000 |
| Reduced upper limb muscle strength [n (%)] | 16 (76.2) | 0 (0.0) | 12 (80.0) | 7 (6.6) | 0.0000 |
| Reduced lower limb muscle strength g [n (%)] | 12 (63.2) | 8 (11.6) | 8 (66.7) | 20 (19.4) | 0.0000 |
| Reduced muscle strength according EWGSOP2 (upper and/or lower limbs) [n (%)] | 21 (100.0) | 8 (11.6) | 15 (100.0) | 22 (20.8) | 0.0000 |
| Low gait speed [n (%)] | 12 (57.1) | 10 (14.5) | 11 (73.3) | 19 (17.9) | 0.0000 |
| MNA Domains | Total (n = 211) | Sarcopenia (n = 21) | Obesity (n = 69) | Sarcopenic Obesity (n = 15) | Non-Sarcopenic Non-Obese (n = 106) | |
|---|---|---|---|---|---|---|
| Mean (SD) | Mean (SD) | Mean (SD) | Mean (SD) | Mean (SD) | p | |
| Domain I—anthropometrics | ||||||
| B. Weight loss during the last 3 months | 2.5 (0.9) | 2.1 (1.1) | 2.6 (0.8) | 2.5 (1.0) | 2.4 (0.9) | 0.1400 |
| F. Body Mass Index | 2.6 (0.8) | 1.5 (1.1) | 3.0 (0.0) | 3.0 (0.0) | 2.6 (0.9) | 0.0000 |
| Q. Mid-arm circumference in cm | 0.9 (0.3) | 0.6 (0.4) | 1.0 (0.1) | 1.0 (0.0) | 0.9 (0.3) | 0.0000 |
| R. Calf circumference in cm | 0.9 (0.3) | 0.4 (0.5) | 1.0 (0.0) | 1.0 (0.0) | 0.9 (0.3) | 0.0000 |
| Domain I (score) | 6.9 (1.8) | 4.6 (2.5) | 7.6 (0.8) | 7.5 (1.0) | 6.8 (1.8) | 0.0000 |
| Domain II—general health status | ||||||
| C. Mobility | 1.9 (0.3) | 1.7 (0.5) | 2.0 (0.2) | 1.7 (0.5) | 2.0 (0.2) | 0.0000 |
| D. Has suffered psychological stress or acute disease in the past 3 months? | 1.2 (1.0) | 0.5 (0.9) | 1.3 (1.0) | 1.1 (1.0) | 1.3 (1.0) | 0.0039 |
| E. Neuropsychological problems | 1.9 (0.5) | 1.9 (0.5) | 1.9 (0.3) | 1.4 (0.9) | 1.9 (0.4) | 0.0017 |
| G. Lives independently (not in nursing home or hospital) | 1.0 (0.0) | 1.0 (0.0) | 1.0 (0.0) | 1.0 (0.0) | 1.0 (0.0) | 1.0000 |
| H. Takes more than 3 prescription drugs per day | 0.3 (0.5) | 0.1 (0.3) | 0.3 (0.5) | 0.0 | 0.4 (0.5) | 0.0009 |
| I. Pressure sores or skin ulcers | 0.9 (0.2) | 0.9 (0.3) | 0.9 (0.2) | 0.9 (0.4) | 1.0 (0.2) | 0.5452 |
| Domain II (score) | 7.3 (1.4) | 6.1 (1.4) | 7.5 (1.2) | 6.1 (1.4) | 7.5 (1.3) | 0.0000 |
| Domain III—dietary habits | ||||||
| A. Has food intake declined over the past 3 months due to loss of appetite, digestive problems, chewing or swallowing difficulties? | 1.8 (0.5) | 1.6 (0.7) | 1.9 (0.3) | 1.9 (0.3) | 1.8 (0.5) | 0.0254 |
| J. How many full meals does the patient eat daily | 1.9 (0.3) | 1.9 (0.3) | 1.9 (0.4) | 1.9 (0.4) | 1.9 (0.3) | 0.9357 |
| K. Selected consumption markers for protein intake | 0.5 (0.4) | 0.6 (0.4) | 0.5 (0.4) | 0.5 (0.4) | 0.5 (0.4) | 0.8823 |
| L. Consumes two or more servings of fruit or vegetables per day? | 0.8 (0.4) | 0.6 (0.5) | 0.8 (0.4) | 0.9 (0.4) | 0.8 (0.4) | 0.3300 |
| M. How much fluid (water, juice, coffee, tea, milk...) is consumed per day? | 0.8 (0.3) | 0.7 (0.3) | 0.8 (0.2) | 0.7 (0.3) | 0.8 (0.3) | 0.0205 |
| N. Mode of feeding | 2.0 (0.1) | 2.0 (0.2) | 2.0 (0.0) | 2.0 (0.0) | 2.0 (0.1) | 0.2574 |
| Domain III (score) | 7.7 (1.1) | 7.3 (1.4) | 7.9 (0.8) | 7.8 (0.9) | 7.8 (1.1) | 0.3518 |
| Domain IV—self-view of nutritional and health status | ||||||
| O. Self-view of nutritional status | 1.7 (0.6) | 1.6 (0.8) | 1.9 (0.4) | 1.4 (0.7) | 1.7 (0.6) | 0.3240 |
| P. In comparison with other people of the same age, how does the patient consider his/her health status? | 1.1 (0.8) | 0.7 (0.9) | 1.2 (0.7) | 0.7 (0.7) | 1.1 (0.8) | 0.0081 |
| Domain IV (score) | 2.8 (1.0) | 2.3 (1.2) | 3.1 (0.9) | 2.1 (1.1) | 2.8 (1.0) | 0.0011 |
Publisher’s Note: MDPI stays neutral with regard to jurisdictional claims in published maps and institutional affiliations. |
© 2022 by the authors. Licensee MDPI, Basel, Switzerland. This article is an open access article distributed under the terms and conditions of the Creative Commons Attribution (CC BY) license (https://creativecommons.org/licenses/by/4.0/).
Share and Cite
Murawiak, M.; Krzymińska-Siemaszko, R.; Kaluźniak-Szymanowska, A.; Lewandowicz, M.; Tobis, S.; Wieczorowska-Tobis, K.; Deskur-Śmielecka, E. Sarcopenia, Obesity, Sarcopenic Obesity and Risk of Poor Nutritional Status in Polish Community-Dwelling Older People Aged 60 Years and Over. Nutrients 2022, 14, 2889. https://doi.org/10.3390/nu14142889
Murawiak M, Krzymińska-Siemaszko R, Kaluźniak-Szymanowska A, Lewandowicz M, Tobis S, Wieczorowska-Tobis K, Deskur-Śmielecka E. Sarcopenia, Obesity, Sarcopenic Obesity and Risk of Poor Nutritional Status in Polish Community-Dwelling Older People Aged 60 Years and Over. Nutrients. 2022; 14(14):2889. https://doi.org/10.3390/nu14142889
Chicago/Turabian StyleMurawiak, Marika, Roma Krzymińska-Siemaszko, Aleksandra Kaluźniak-Szymanowska, Marta Lewandowicz, Sławomir Tobis, Katarzyna Wieczorowska-Tobis, and Ewa Deskur-Śmielecka. 2022. "Sarcopenia, Obesity, Sarcopenic Obesity and Risk of Poor Nutritional Status in Polish Community-Dwelling Older People Aged 60 Years and Over" Nutrients 14, no. 14: 2889. https://doi.org/10.3390/nu14142889
APA StyleMurawiak, M., Krzymińska-Siemaszko, R., Kaluźniak-Szymanowska, A., Lewandowicz, M., Tobis, S., Wieczorowska-Tobis, K., & Deskur-Śmielecka, E. (2022). Sarcopenia, Obesity, Sarcopenic Obesity and Risk of Poor Nutritional Status in Polish Community-Dwelling Older People Aged 60 Years and Over. Nutrients, 14(14), 2889. https://doi.org/10.3390/nu14142889