
How the “Are We Drinking Ourselves Sick?” Communication Campaign Built Support for Policy Action on Sugary Drinks in Jamaica

 ,
,
Abstract
:1. Introduction
2. Materials and Methods
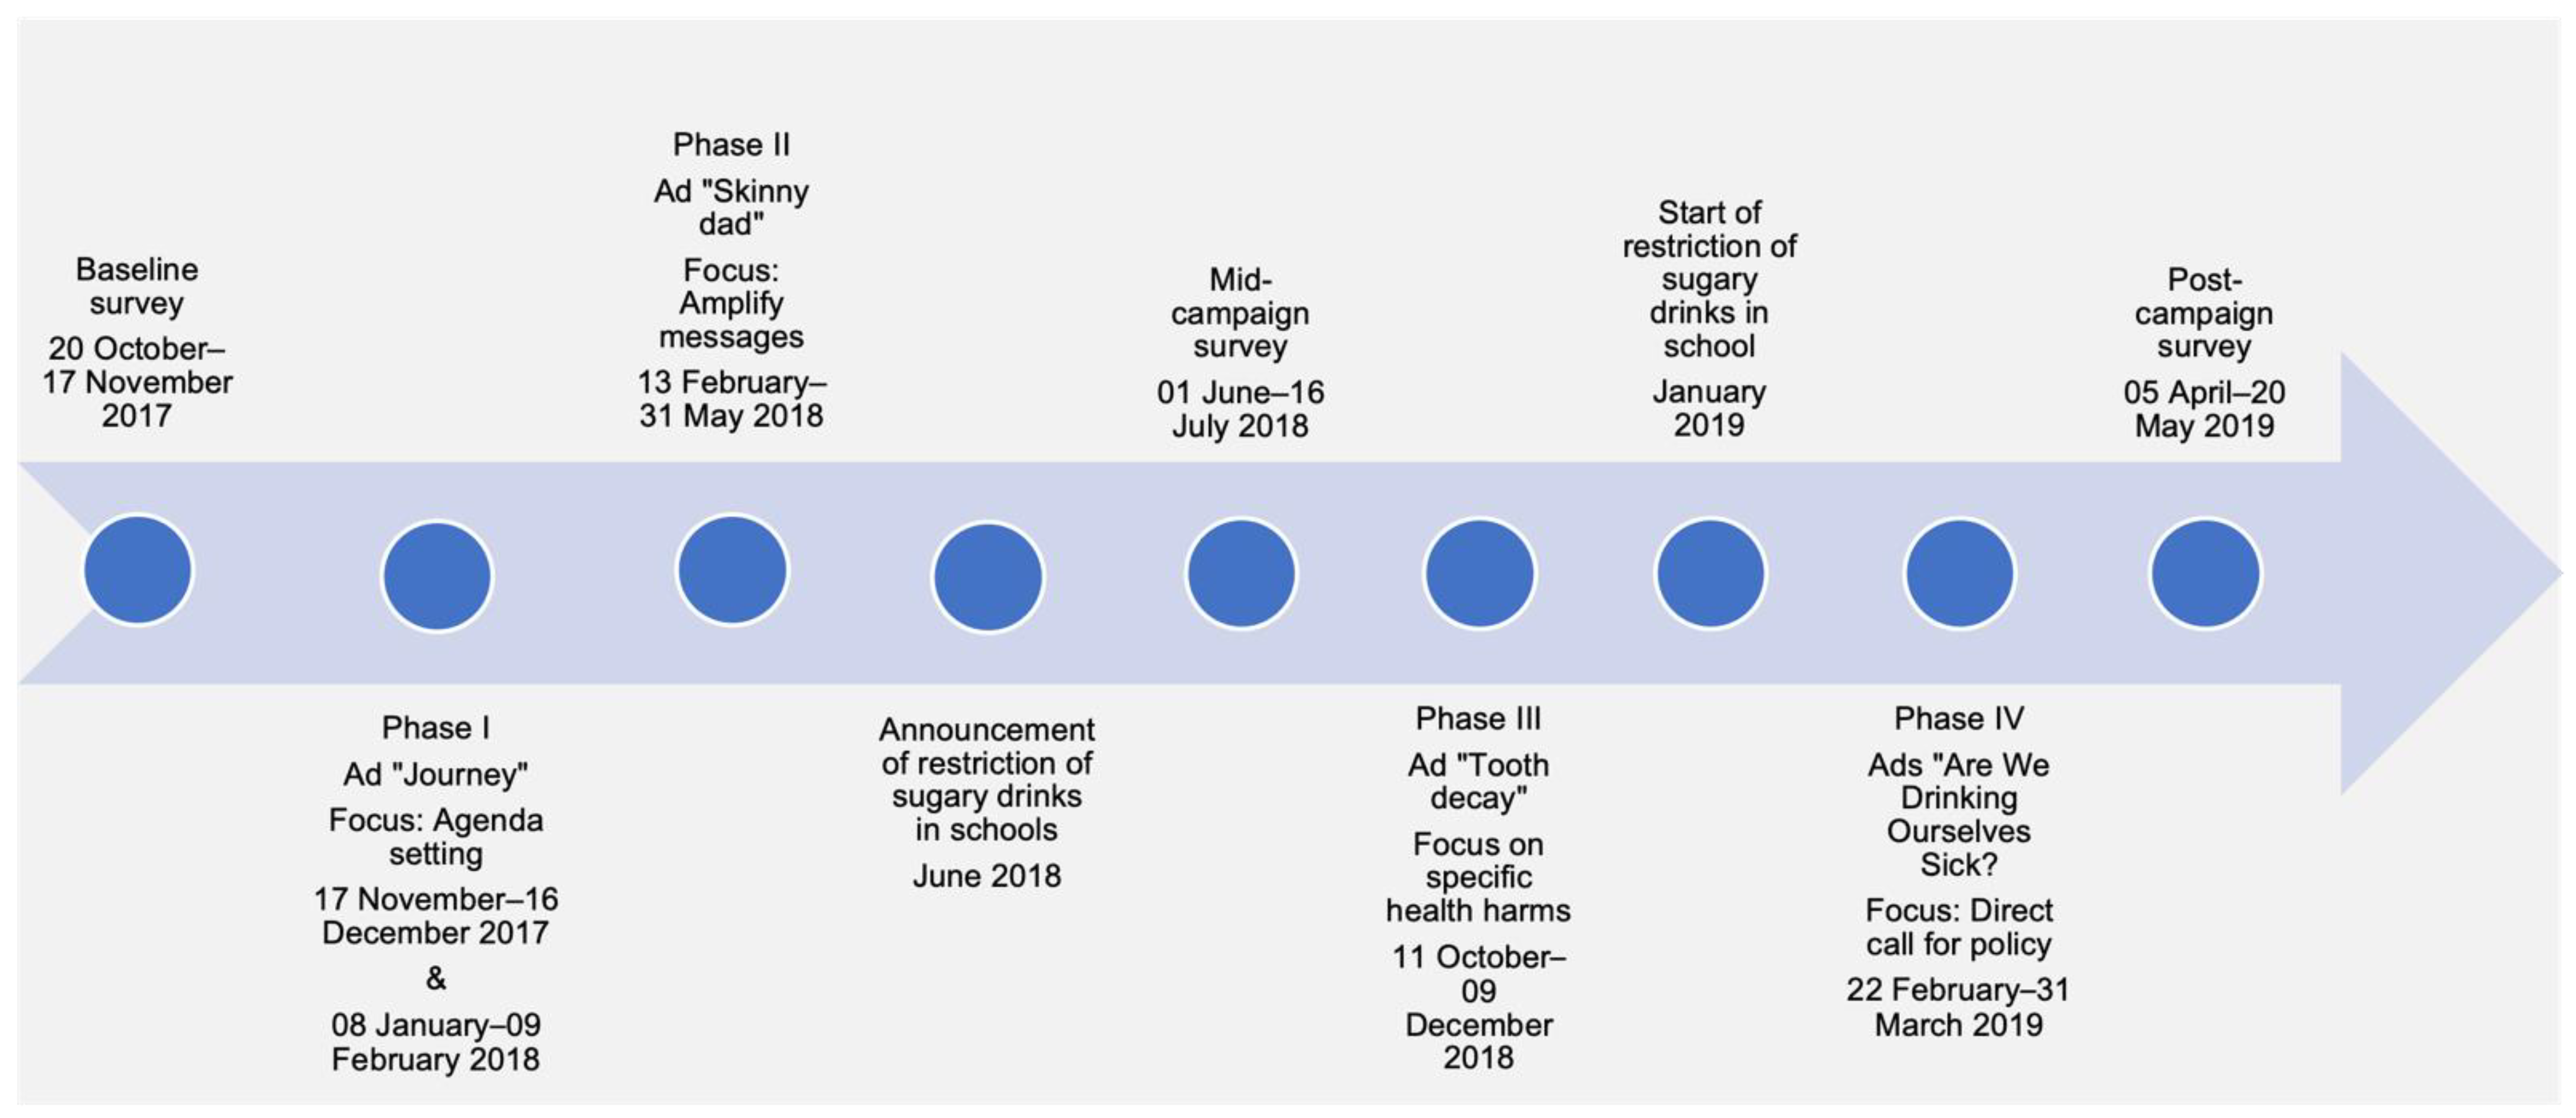
2.1. Jamaica’s “Are We Drinking Ourselves Sick?” Campaign, Phases 1–4

| Phase | Target Audience | Key Messages | Media Used | Name of TV ad and Image | Description |
|---|---|---|---|---|---|
| I 17 November–16 December 2017 and 8 January–9 February 2018 | Women, adults 18–65 years | Drinking sugary drinks increases the risk of type 2 diabetes, heart disease, cancers. | TV, radio, newspapers, digital, outdoors. | “Journey” | The ad follows a woman as she drinks sugary drinks throughout the day and explains how the sugar content in each drink accumulates (e.g., energy drink = 14 teaspoons of sugar). The woman is shown in the hospital suffering from heart disease, as it is explained how sugary drinks bring on obesity, which can lead to Type 2 diabetes, heart disease and some cancers. This campaign was inspired by the “Are You Drinking Yourself Sick?” campaign, developed by Healthy Living Alliance in South Africa. See Figure 1 for an example of additional campaign material launched during this phase. |
| II 13 February–31 May 2018 | Parents and guardians with children under 16 years | Sugary drinks are a main reason for the obesity crisis in Jamaica; just because you’re active, it doesn’t mean sugary drinks aren’t causing harm to your health. | TV, radio, newspapers, digital, outdoors. | “Skinny Dad”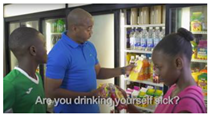 | The ad shows an active family entering a gas station mini mart to purchase drinks. After considering the health consequences of the sugary drinks they’ve selected, the father opts for water for his family instead. |
| III 11 October–9 December 2018 | Adults 18–65, parents, and guardians with children under 16 years, policymakers | All that sugar adds up; Sugary drinks can lead to Type 2 diabetes, destroy your children’s teeth by causing painful tooth decay; cut out those sugary drinks at home and at school. | TV, digital, radio, outdoors, newspapers. | “Tooth Decay” | The ad depicts a mother pouring a sugary drink for her toddler, who is shown consuming similar drinks as he grows into a young man and adult. He is shown developing Type 2 diabetes and tooth decay, as a voiceover encourages that sugary drinks be cut out at home and school. This campaign was inspired by “Tooth Decay, Play Every Day” campaign, developed by the Department of Health and Social Services, State of Alaska. |
| IV 22 February–31 March 2019 | Adults 18–65, policymakers | Support our children’s health, support a sugary drinks tax. | TV, digital, radio, newspapers, outdoors. | “Are We Drinking Ourselves Sick? Testimonies-Dentist” | This series of ads features two testimonials from medical professionals who share the ways in which they have seen children’s health compromised by sugary drinks. A third testimonial is from a man who shares his experience with Type 2 diabetes and his hopes that what happened to him does not happen to his children. Viewers are encouraged to support children’s health by backing a sugary drinks tax. See Figure 2 for an example of additional campaign material launched during this phase. |
| TV, digital, radio, newspapers. | “Are We Drinking Ourselves Sick? Testimonies-General Practitioner” | ||||
| TV, social media, radio, newspapers. | “Are We Drinking Ourselves Sick? Testimonies- Patient” |
2.2. Sample and Data Collection
Ethical Approval
2.3. Questionnaire and Measures
2.3.1. Campaign Awareness
2.3.2. Reactions to the Campaigns
2.3.3. Interpersonal Communication
2.3.4. Knowledge and Attitudes
2.3.5. Support for Policies and Government Action
2.3.6. Sociodemographic Characteristics
2.4. Data Analysis
3. Results
3.1. Sample Characteristics
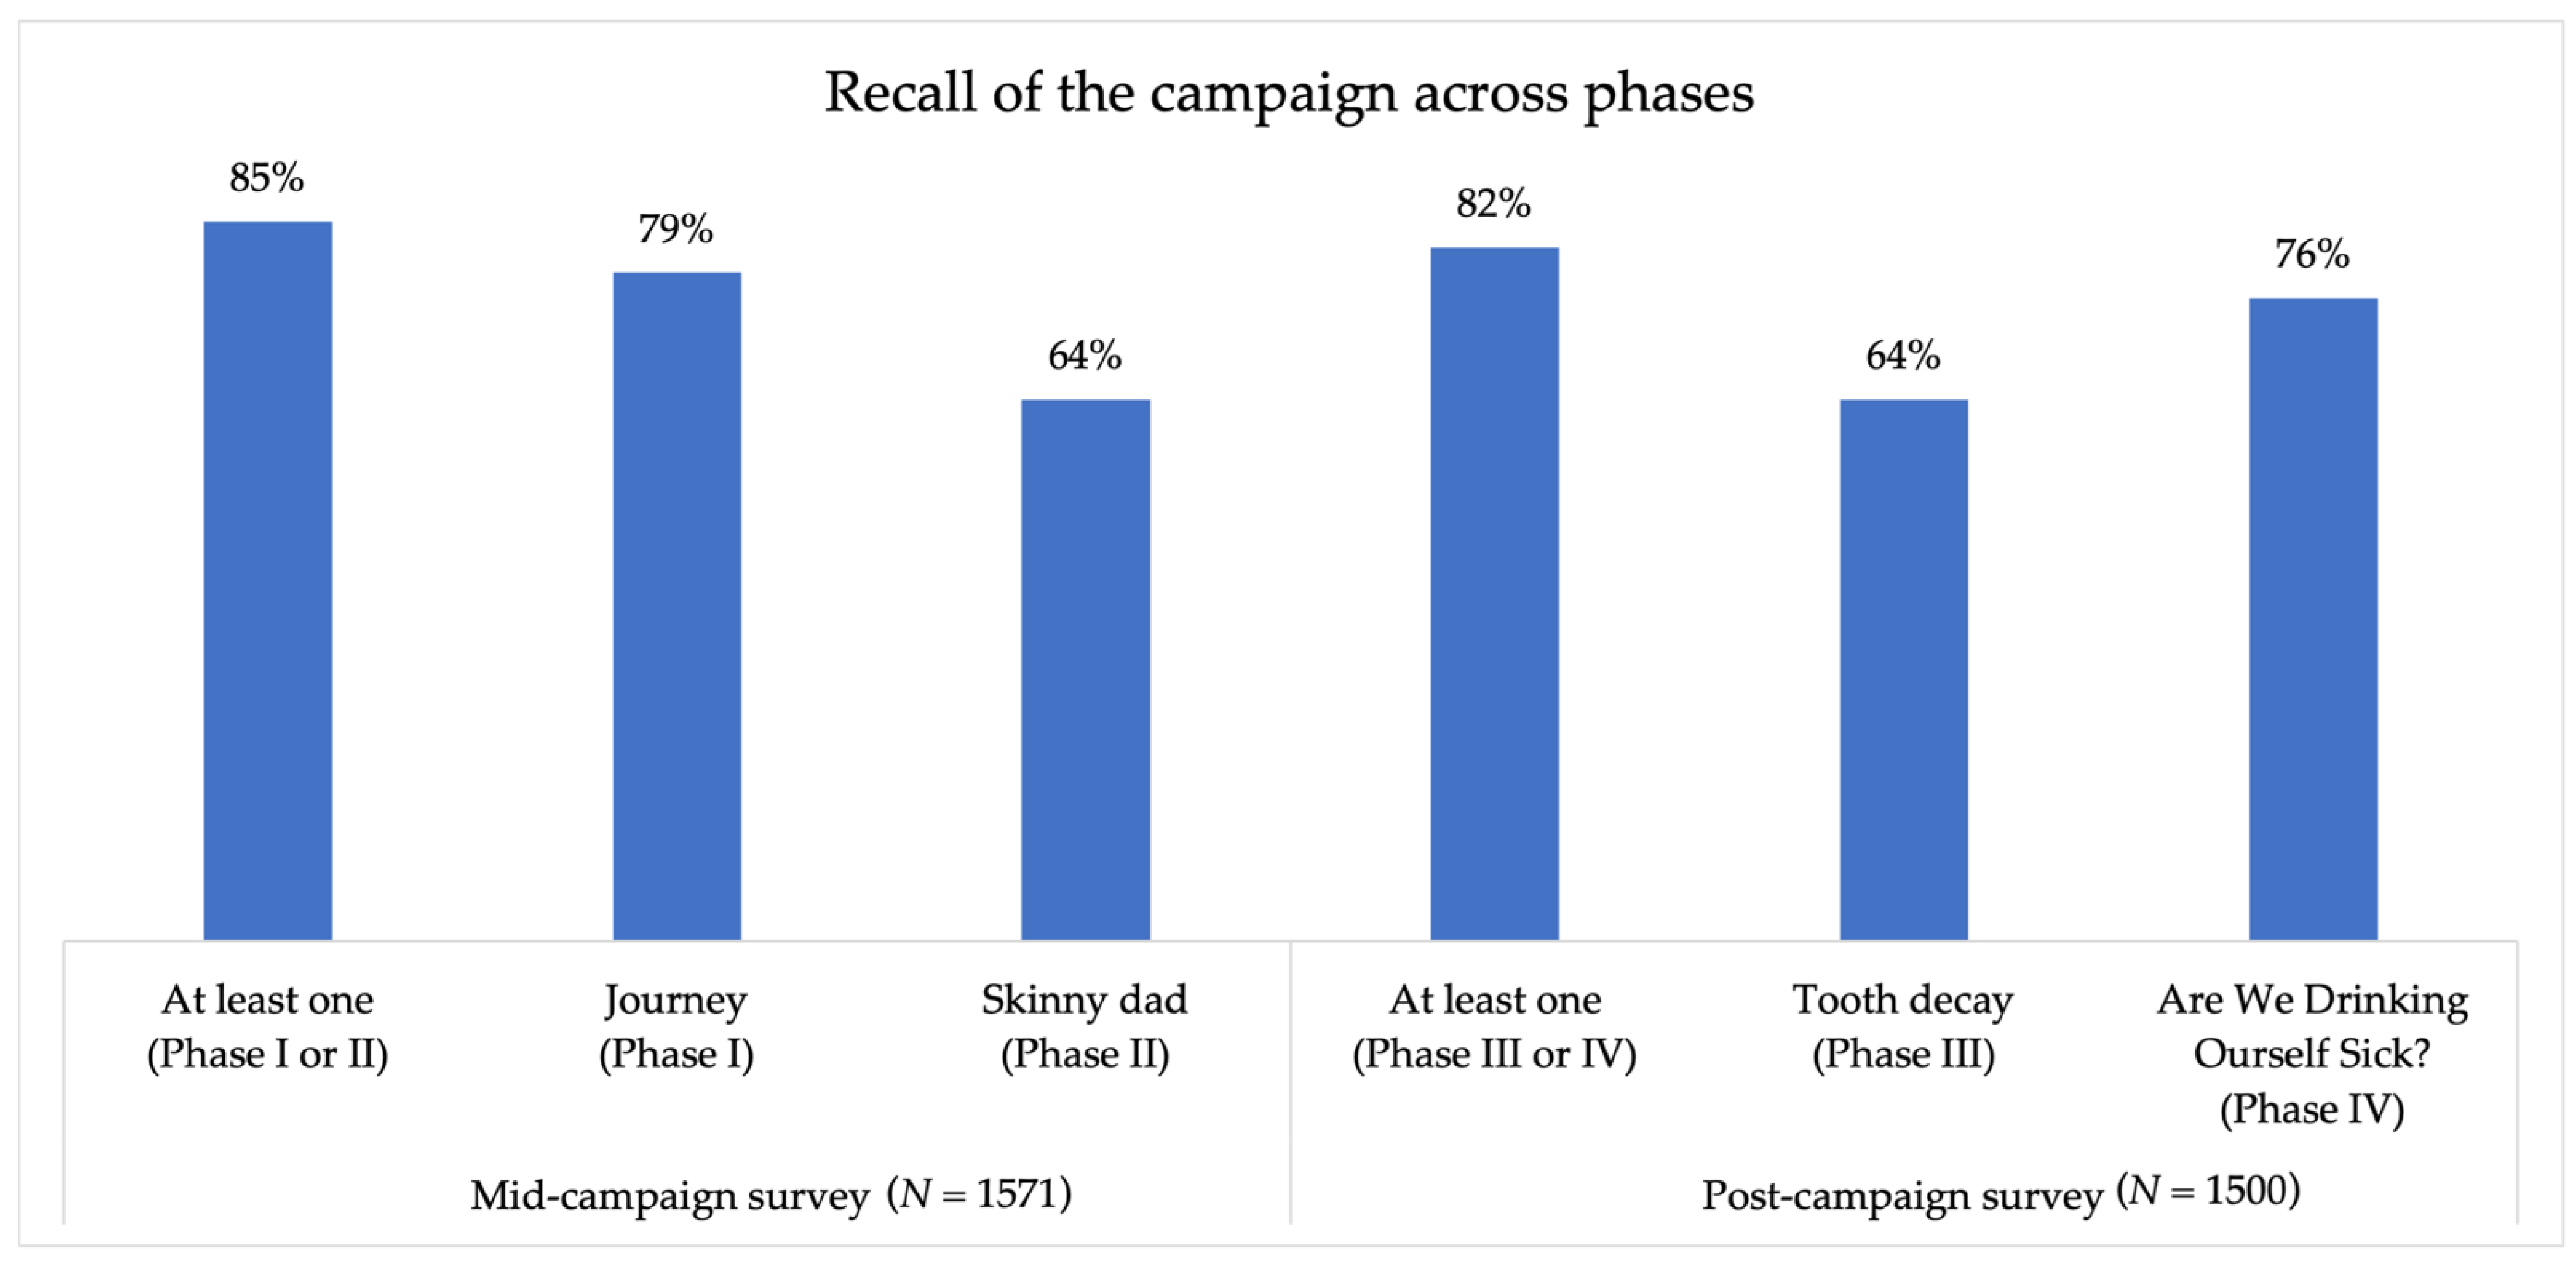
3.2. Campaign Awareness
3.3. Reactions to the Campaigns
3.4. Knowledge and Attitudes
3.4.1. Changes from Baseline to Mid- and Post-Campaign Surveys
3.4.2. Impact of Campaign Awareness within the Mid-and Post-Campaign Periods
3.5. Support for Government Action
3.5.1. Changes from Baseline to the Mid- and Post-Campaign Surveys
3.5.2. Impact of Campaign Awareness within the Mid-and Post-Campaign Periods
4. Discussion
5. Conclusions
Author Contributions
Funding
Institutional Review Board Statement
Informed Consent Statement
Data Availability Statement
Acknowledgments
Conflicts of Interest
References
- Harvard, T.H. Chan School of Public Health. The Nutrition Source. Sugary Drinks. Available online: https://www.hsph.harvard.edu/nutritionsource/healthy-drinks/sugary-drinks/ (accessed on 13 April 2022).
- Healthy Caribbean Coalition. Compelling Evidence for Tax on Sugar-Sweetened Beverages in Jamaica. 19 January 2018. Available online: https://www.healthycaribbean.org/compelling-evidence-for-tax-on-sugar-sweetened-beverages-in-jamaica/ (accessed on 13 April 2022).
- Qi, Q.; Chu, A.Y.; Kang, J.H.; Jensen, M.K.; Curhan, G.C.; Pasquale, L.R.; Ridker, P.M.; Hunter, D.J.; Willett, W.C.; Rimm, E.B.; et al. Sugar-sweetened beverages and genetic risk of obesity. N. Engl. J. Med. 2012, 367, 1387–1396. [Google Scholar] [CrossRef] [PubMed] [Green Version]
- Della Torre, S.B.; Keller, A.; Depeyre, J.L.; Kruseman, M. Sugar-sweetened beverages and obesity risk in children and adolescents: A systematic analysis on how methodological quality may influence conclusions. J. Acad. Nutr. Diet. 2016, 116, 638–659. [Google Scholar] [CrossRef] [PubMed]
- Malik, V.S.; Popkin, B.M.; Bray, G.A.; Després, J.P.; Willett, W.C.; Hu, F.B. Sugar-sweetened beverages and risk of metabolic syndrome and type 2 diabetes: A meta-analysis. Diabetes Care 2010, 33, 2477–2483. [Google Scholar] [CrossRef] [PubMed] [Green Version]
- Malik, V.S.; Popkin, B.M.; Bray, G.A.; Després, J.P.; Hu, F.B. Sugar-sweetened beverages, obesity, type 2 diabetes mellitus, and cardiovascular disease risk. Circulation 2010, 121, 1356–1364. [Google Scholar] [CrossRef]
- World Health Organization. Global School-Based Student Health Survey: Jamaica 2017 Fact Sheet; World Health Organization: Geneva, Switzerland, 2017. [Google Scholar]
- World Health Organization. Global School-Based Student Health Survey: Jamaica 2010 Fact Sheet; World Health Organization: Geneva, Switzerland, 2010. [Google Scholar]
- The Ministry of Health & Wellness. Caribbean Institute for Health Research. Jamaica Health and Lifestyle Survey III (2016–2017); Caribbean Institute for Health Research: Kingston, Jamaica, 2018. [Google Scholar]
- Razzaghi, H.; Martin, D.N.; Quesnel-Crooks, S.; Hong, Y.; Gregg, E.; Andall-Brereton, G.; Gawryszweski, V.; Saraiya, M. 10-year trends in noncommunicable disease mortality in the Caribbean region. Rev. Panam. Salud Pública 2019, 43, e37. [Google Scholar] [CrossRef] [Green Version]
- UNIATF; UNDP; PAHO. The Case for Investment in Prevention and Control of Noncommunicable Diseases in Jamaica: Evaluating the Return on Investment of Selected Tobacco, Alcohol, Diabetes, and Cardiovascular Disease Interventions. 2018. Available online: https://iris.paho.org/handle/10665.2/49693 (accessed on 13 April 2022).
- Kwon, J.; Cameron, A.J.; Hammond, D.; White, C.M.; Vanderlee, L.; Bhawra, J.; Sacks, G. A multi-country survey of public support for food policies to promote healthy diets: Findings from the International Food Policy Study. BMC Public Health 2019, 19, 1205. [Google Scholar] [CrossRef]
- Mozaffarian, D.; Angell, S.Y.; Lang, T.; Rivera, J.A. Role of government policy in nutrition—Barriers to and opportunities for healthier eating. BMJ 2018, 361, k2426. [Google Scholar] [CrossRef] [Green Version]
- Paraje, G.; Gomes, F.S. Expenditures on sugar-sweetened beverages in Jamaica and its association with household budget allocation. BMC Public Health 2022, 22, 580. [Google Scholar] [CrossRef] [PubMed]
- Ministry of Health/Ministry of Education Youth & Information. Interim Guidelines for Beverages in Schools. November 2018. Available online: https://www.healthycaribbean.org/cop/documents/Jamaica-Interim-Guidelines-for-Beverages-in-Schools.pdf (accessed on 13 April 2022).
- Patterson, C. Government to Implement Policy to Reduce Sugary drinks in Schools. Health & Wellness, 6 June 2018. [Google Scholar]
- University of Technology, Jamaica. Fiscal measures to prevent obesity/NCDs in Jamaica: Focus on sugar-sweetened beverages (Scientific Symposium). J. Arts Sci. Technol. 2018, 11, 1–115. [Google Scholar]
- Vandevijvere, S.; Swinburn, B. Creating healthy food environments through global benchmarking of government nutrition policies and food industry practices. Arch. Public Health 2014, 72, 7. [Google Scholar] [CrossRef] [Green Version]
- Mialon, M.; da Silva Gomes, F. Public health and the ultra-processed food and drink products industry: Corporate political activity of major transnationals in latin America and the Caribbean. Public Health Nutr. 2019, 22, 1898–1908. [Google Scholar] [CrossRef] [PubMed]
- Diepeveen, S.; Ling, T.; Suhrcke, M.; Roland, M.; Marteau, T.M. Public acceptability of government intervention to change health-related behaviours: A systematic review and narrative synthesis. BMC Public Health 2013, 13, 756. [Google Scholar] [CrossRef] [PubMed] [Green Version]
- Fernandez, M.A.; Raine, K.D. Insights on the influence of sugar taxes on obesity prevention efforts. Curr. Nutr. Rep. 2019, 8, 333–339. [Google Scholar] [CrossRef] [PubMed] [Green Version]
- Bos, C.; Lans, I.V.D.; Van Rijnsoever, F.; Van Trijp, H. Consumer acceptance of population-level intervention strategies for healthy food choices: The role of perceived effectiveness and perceived fairness. Nutrients 2015, 7, 7842–7862. [Google Scholar] [CrossRef] [Green Version]
- Hartocollis, A. Failure of State Soda Tax Plan Reflects Power of an Antitax Message. New York Times, 2 July 2010. [Google Scholar]
- Du, M.; Tugendhaft, A.; Erzse, A.; Hofman, K.J. Focus: Nutrition and food science: Sugar-sweetened beverage taxes: Industry response and tactics. Yale J. Biol. Med. 2018, 91, 185. [Google Scholar]
- Jacobs, A.; Richtel, M. She took on Colombia’s soda industry. Then she was silenced. New York Times, 13 November 2017. [Google Scholar]
- Colchero, M.A.; Rivera-Dommarco, J.; Popkin, B.M.; Ng, S.W. In Mexico, evidence of sustained consumer response two years after implementing a sugar-sweetened beverage tax. Health Aff. 2017, 36, 564–571. [Google Scholar] [CrossRef]
- Alvarado, M.; Unwin, N.; Sharp, S.J.; Hambleton, I.; Murphy, M.M.; Samuels, T.; Suhrcke, M.; Adams, J. Assessing the impact of the Barbados sugar-sweetened beverage tax on beverage sales: An observational study. Int. J. Behav. Nutr. Phys. Act. 2019, 16, 13. [Google Scholar] [CrossRef]
- Caro, J.C.; Corvalán, C.; Reyes, M.; Silva, A.; Popkin, B.; Taillie, L.S. Chile’s 2014 sugar-sweetened beverage tax and changes in prices and purchases of sugar-sweetened beverages: An observational study in an urban environment. PLoS Med. 2018, 15, e1002597. [Google Scholar] [CrossRef] [Green Version]
- Colchero, M.A.; Popkin, B.M.; Rivera, J.A.; Ng, S.W. Beverage purchases from stores in Mexico under the excise tax on sugar sweetened beverages: Observational study. BMJ 2016, 352, h6704. [Google Scholar] [CrossRef] [Green Version]
- Barrientos-Gutierrez, T.; Zepeda-Tello, R.; Rodrigues, E.R.; Colchero-Aragonés, A.; Rojas-Martínez, R.; Lazcano-Ponce, E.; Hernández-Ávila, M.; Rivera-Dommarco, J.; Meza, R. Expected population weight and diabetes impact of the 1-peso-per-litre tax to sugar sweetened beverages in Mexico. PLoS ONE 2017, 12, e0176336. [Google Scholar] [CrossRef]
- Sandoval, R.C.; Roche, M.; Belausteguigoitia, I.; Alvarado, M.; Galicia, L.; Gomes, F.S.; Paraje, G. Excise taxes on sugar-sweetened beverages in Latin America and the Caribbean. Rev. Panam. Salud Publica 2021, 45, e21. [Google Scholar] [CrossRef] [PubMed]
- Taber, D.R.; Chriqui, J.F.; Powell, L.M.; Chaloupka, F.J. Banning all sugar-sweetened beverages in middle schools: Reduction of in-school access and purchasing but not overall consumption. Arch. Pediatrics Adolesc. Med. 2012, 166, 256–262. [Google Scholar] [CrossRef] [PubMed] [Green Version]
- Edmondson, E.K.; Roberto, C.A.; Gregory, E.F.; Mitra, N.; Virudachalam, S. Association of a Sweetened Beverage Tax With Soda Consumption in High School Students. JAMA Pediatrics 2021, 175, 1261–1268. [Google Scholar] [CrossRef] [PubMed]
- Wakefield, M.A.; Loken, B.; Hornik, R.C. Use of mass media campaigns to change health behaviour. Lancet 2010, 376, 1261–1271. [Google Scholar] [CrossRef] [Green Version]
- Dixon, H.; Scully, M.; Cotter, T.; Maloney, S.; Wakefield, M. Healthy weight and lifestyle advertisements: An assessment of their persuasive potential. Health Educ. Res. 2015, 30, 569–579. [Google Scholar] [CrossRef] [Green Version]
- McCombs, M. Agenda setting function of mass media. Public Relat. Rev. 1977, 3, 89–95. [Google Scholar] [CrossRef]
- Durkin, S.; Brennan, E.; Wakefield, M. Mass media campaigns to promote smoking cessation among adults: An integrative review. Tob. Control 2012, 21, 127–138. [Google Scholar] [CrossRef] [Green Version]
- Bandura, A. Health promotion by social cognitive means. Health Educ. Behav. 2004, 31, 143–164. [Google Scholar] [CrossRef]
- McGuire, W.J. Public communication as a stratey for inducing health-promoting behaviorial change. Prev. Med. 1984, 13, 299–319. [Google Scholar] [CrossRef]
- Farley, T.A.; Halper, H.S.; Carlin, A.M.; Emmerson, K.M.; Foster, K.N.; Fertig, A.R. Mass media campaign to reduce consumption of sugar-sweetened beverages in a rural area of the United States. Am. J. Public Health 2017, 107, 989–995. [Google Scholar] [CrossRef]
- Jeong, M.; Gilmore, J.S.; Bleakley, A.; Jordan, A. Local news media framing of obesity in the context of a sugar-sweetened beverage reduction media campaign. J. Nutr. Educ. Behav. 2014, 46, 583–588. [Google Scholar] [CrossRef] [PubMed]
- Murukutla, N.; Cotter, T.; Wang, S.; Cullinan, K.; Gaston, F.; Kotov, A.; Maharjan, M.; Mullin, S. Results of a mass media campaign in South Africa to promote a sugary drinks tax. Nutrients 2020, 12, 1878. [Google Scholar] [CrossRef] [PubMed]
- Serju, C. Sugar Tax Blowback—Pandohie Chastises Advertising Attacks, Possible Levy. The Gleaner, 28 February 2019. [Google Scholar]
- Gilpin, J.-A. Not Changing Course—Health Ministry Remains Adamant with Sugary Drink Message. The Gleaner, 8 October 2018. [Google Scholar]
- JMEA, PSOJ to Educate Consumers on Healthier Lifestyles Choices. Loop News, 8 March 2019.
- Professor Errol Morrison on Sugary Drinks. RJR 94 FM, 5 October 2018.
- Professor Errol Morrison on Sugary Drinks. Prime Time News, 3 October 2018.
- Julia, C.; Méjean, C.; Vicari, F.; Péneau, S.; Hercberg, S. Public perception and characteristics related to acceptance of the sugar-sweetened beverage taxation launched in France in 2012. Public Health Nutr. 2015, 18, 2679–2688. [Google Scholar] [CrossRef] [PubMed] [Green Version]
- Eykelenboom, M.; Van Stralen, M.M.; Olthof, M.R.; Schoonmade, L.J.; Steenhuis, I.H.; Renders, C.M. Political and public acceptability of a sugar-sweetened beverages tax: A mixed-method systematic review and meta-analysis. Int. J. Behav. Nutr. Phys. Act. 2019, 16, 78. [Google Scholar] [CrossRef] [Green Version]
- Jou, J.; Niederdeppe, J.; Barry, C.L.; Gollust, S.E. Strategic messaging to promote taxation of sugar-sweetened beverages: Lessons from recent political campaigns. Am. J. Public Health 2014, 104, 847–853. [Google Scholar] [CrossRef]
- Munsell, C.R.; Harris, J.L.; Sarda, V.; Schwartz, M.B. Parents’ beliefs about the healthfulness of sugary drink options: Opportunities to address misperceptions. Public Health Nutr. 2016, 19, 46–54. [Google Scholar] [CrossRef] [Green Version]
- Dixon, H.; Scully, M.; Gascoyne, C.; Wakefield, M. Can counter-advertising diminish persuasive effects of conventional and pseudo-healthy unhealthy food product advertising on parents?: An experimental study. BMC Public Health 2020, 20, 1781. [Google Scholar] [CrossRef]
- Moodie, R.; Bennett, E.; Kwong, E.J.L.; Santos, T.M.; Pratiwi, L.; Williams, J.; Baker, P. Ultra-Processed Profits: The Political Economy of Countering the Global Spread of Ultra-Processed Foods-A Synthesis Review on the Market and Political Practices of Transnational Food Corporations and Strategic Public Health Responses. Int. J. Health Policy Manag. 2021, 10, 968–982. [Google Scholar] [CrossRef]


| Baseline | Mid-Campaign | Post-Campaign | χ2 p-Value a | |
|---|---|---|---|---|
| (n = 1430) | (n = 1571) | (n = 1500) | ||
| A | B | C | ||
| Average age (years) | 33 | 33 | 34 A,B | <0.001 |
| Women (%) | 52 | 50 | 50 | 0.557 |
| Parent/primary caregiver to children under the age of 16 (% yes) | 46 | 49 | 51 | 0.055 |
| Education (%) | <0.001 | |||
| No formal schooling | 22 C | 19 C | 13 | |
| Below high school | 76 | 80 A | 84 A,B | |
| High school and above | 2 B | 0.7 | 4 A,B | |
| Employment status (%) | <0.001 | |||
| Unemployed | 7 | 21 A,C | 17 A | |
| Employed | 76 B | 72 | 76 | |
| Student | 17 B,C | 7 | 7 | |
| Socioeconomic status (%) | 0.059 | |||
| Upper and upper middle socioeconomic status (ABC1) | 16 | 13 | 15 | |
| Middle socioeconomic status (C2) | 26 | 24 | 25 | |
| Low and low socioeconomic status (DE) | 58 | 63 A | 61 | |
| Fruits and vegetables intake in the last seven days (%) | <0.001 | |||
| Two or less than two times | 69 | 71 | 84 A,B | |
| More than two times | 31 C | 30 C | 17 | |
| Average vigorous physical activity in the last seven days (days) | 1.7 | 2.1 A,C | 1.7 | <0.001 |
| Body Mass Index (%) | 0.046 | |||
| Underweight | 5 | 3 | 7 B | |
| Normal weight | 39 | 41 | 37 | |
| Overweight | 30 | 29 | 32 | |
| Obese | 26 | 27 | 24 | |
| Self-rated health status (%) | <0.001 | |||
| Poor/fair | 47 B,C | 36 | 34 | |
| Good | 28 | 31 | 33 A | |
| Very good/excellent | 25 | 32 A | 33 A | |
| Frequency of watching television on a typical week (%) | <0.001 | |||
| Never | 14 C | 11 C | 6 | |
| Three or less than three times | 32 | 35 | 38 A | |
| More than three times | 54 | 54 | 57 | |
| Frequency of listening to the radio on a typical week (%) | 0.091 | |||
| Never | 23 | 24 | 23 | |
| Three or less than three times | 31 | 34 | 35 | |
| More than three times | 46 B | 42 | 42 | |
| Frequency of reading newspaper/magazines/periodicals in a typical week (%) | 0.007 | |||
| Never | 35 | 38 | 42 A | |
| Three or less than three times | 53 C | 51 | 48 | |
| More than three times | 12 | 11 | 11 | |
| Frequency of access to the internet (%) | 0.001 | |||
| Never | 13 C | 13 C | 9 | |
| Once or more than once a week | 16 | 16 | 14 | |
| Once or more than once a day | 71 | 71 | 77 A,B |
| Mid-Campaign | Post-Campaign | |||||
|---|---|---|---|---|---|---|
| Unaware | Aware | χ2 p-Value | Unaware | Aware | χ2 p-Value | |
| (n = 239) | (n = 1332) | (n = 271) | (n = 1229) | |||
| Average age (years) | 32 | 33 | 0.013 | 32 | 35 | <0.001 |
| Gender (%) | <0.001 | 0.004 | ||||
| Men | 19 | 81 | 21 | 79 | ||
| Women | 11 | 89 | 15 | 85 | ||
| Parent/primary caregiver to children under the age of 16 (% yes) | 0.014 | 0.88 | ||||
| Yes | 13 | 87 | 18 | 82 | ||
| No | 17 | 83 | 18 | 82 | ||
| Education (%) | 0.309 | 0.595 | ||||
| No formal schooling | 16 | 84 | 21 | 79 | ||
| Below high school | 15 | 85 | 18 | 82 | ||
| High school and above | 0 | 100 | 17 | 83 | ||
| Employment status (%) | 0.226 | 0.207 | ||||
| Unemployed | 12 | 88 | 15 | 85 | ||
| Employed | 16 | 84 | 19 | 81 | ||
| Student | 17 | 83 | 14 | 86 | ||
| Socioeconomic status (%) | 0.874 | 0.171 | ||||
| Upper and upper middle socioeconomic status (ABC1) | 16 | 84 | 17 | 83 | ||
| Middle socioeconomic status (C2) | 15 | 86 | 15 | 85 | ||
| Low and low socioeconomic status (DE) | 15 | 85 | 20 | 81 | ||
| Fruits and vegetables intake in the last seven days (%) | 0.405 | 0.219 | ||||
| Two or less than two times a day | 15 | 85 | 19 | 81 | ||
| Three or more than three times a day | 16 | 84 | 15 | 85 | ||
| Average vigorous physical activity in the last seven days (days) | 2 | 2 | 0.296 | 1 | 2 | 0.002 |
| Body Mass Index (%) | 0.613 | 0.143 | ||||
| Underweight | 10 | 90 | 22 | 78 | ||
| Normal weight | 14 | 86 | 18 | 82 | ||
| Overweight | 16 | 84 | 11 | 89 | ||
| Obese | 12 | 88 | 15 | 85 | ||
| Self-reported heath (%) | 0.072 | <0.001 | ||||
| Poor/fair | 18 | 82 | 23 | 78 | ||
| Good | 13 | 87 | 19 | 81 | ||
| Very good/excellent | 14 | 86 | 13 | 87 | ||
| Frequency of watching television in a typical week (%) | <0.001 | <0.001 | ||||
| Never | 42 | 58 | 41 | 59 | ||
| Three or less than three times | 17 | 83 | 23 | 77 | ||
| More than three times | 9 | 91 | 13 | 88 | ||
| Frequency of listening to the radio in a typical week (%) | <0.001 | <0.001 | ||||
| Never | 23 | 77 | 26 | 74 | ||
| Three or less than three times a week | 15 | 85 | 20 | 81 | ||
| More than three times a week | 11 | 89 | 12 | 88 | ||
| Frequency of reading magazines/periodicals/newspapers in a typical week (%) | <0.001 | <0.001 | ||||
| Never | 20 | 80 | 24 | 76 | ||
| Three or less than three times a week | 12 | 88 | 14 | 86 | ||
| More than three times a week | 12 | 88 | 14 | 86 | ||
| Accessing the internet (%) | 0.048 | 0.979 | ||||
| Never | 16 | 84 | 18 | 82 | ||
| Once or more than once a week | 10 | 90 | 18 | 82 | ||
| Once or more than once a day | 16 | 84 | 18 | 82 | ||
| Reactions to the Campaigns | Mid-Campaign Aware (n = 1332) | Post-Campaign Aware (n = 1229) |
|---|---|---|
| % | % | |
| Agreed that the campaign... | ||
| Was believable | 96 | 92 |
| Was relevant to me | 93 | 91 |
| Taught me something new | 78 | 74 |
| Made me stop and think | 84 | 80 |
| Made me feel uncomfortable | 33 | 35 |
| Made me feel concerned about the impact of sugary drinks on my health | 88 | 85 |
| Made me motivated to reduce drinking sugary drinks | 85 | 83 |
| Made me want to discuss the ad with others | 78 | 75 |
| Made me more supportive of government action to reduce sugary drink consumption in my country | 89 | 86 |
| I would like others to see this ad | 98 | 95 |
| This ad provides a public service/it is in the public’s interest to watch | 98 | 95 |
| This ad made me motivated to drink more water | 90 | –– |
| This ad motivated me to read food labels | 84 | –– |
| I would like children to see the ad [parents or primary caregivers only; mid-campaign (n) = 772; post campaign (n) = 759] | 99 | 95 |
| Made me motivated to reduce my child’s drinking of sugary drinks [parents or primary caregivers only; mid-campaign (n) = 772; post campaign (n) = 759] | 87 | 85 |
| Made me feel concerned about the impact of sugary drinks on my children’s health [parents or primary caregivers only; mid-campaign (n) = 772; post campaign (n) = 759] | –– | 86 |
| Discussed the campaign with… | ||
| Family | 29 | 27 |
| Friends | 12 | 9 |
| Colleagues | 2 | 2 |
| Others | 3 | 3 |
| Likelihood of reducing the number of sugary drinks consumed as a result of seeing the campaign (likely) | 65 | 59 |
| Likelihood of reducing the number of sugary drinks consumed by your children as a result of seeing the campaign (likely) | 76 | 68 |
| Support for ads like this one on the health effects of consumption of nonessential food and sugary drinks (support) | 95 | 97 |
| Baseline Survey | Mid-Campaign Survey | Post-Campaign Survey | Mid-Campaign Survey | Post-Campaign Survey | Mid-Campaign Survey | Post-Campaign Survey | ||||||||
|---|---|---|---|---|---|---|---|---|---|---|---|---|---|---|
| Unaware | Aware | Unaware | Aware | |||||||||||
| (n = 1430) | (n = 1571) | (n = 1500) | Ref: Baseline Survey | (n = 239) | (n = 1332) | (n = 271) | (n = 1229) | |||||||
| A | B | C | D | E | F | G | ||||||||
| % | % | % | Adj. OR ^ (95% CI) | Adj. OR ^ (95% CI) | % | % | Adj. OR ^ (95% CI) | % | % | Adj. OR ^ (95% CI) | ||||
| Knowledge About Sugary Drinks | ||||||||||||||
| To the best of your knowledge, does drinking sugary drinks increase the risk of…? (somewhat/greatly) | ||||||||||||||
| Diabetes | 84 C | 84 C | 77 | 1.018 (0.83, 1.25) | 0.62 ** (0.51, 0.76) | ↓ | 81 | 85 | 1.26 (0.85, 1.86) | 71 | 78 F | 1.45 * (1.06, 1.99) | ↑ | |
| Overweight or obesity | 78 C | 79 C | 67 | 1.1 (0.92, 1.31) | 0.58 * (0.49, 0.69) | ↓ | 74 | 79 D | 1.2 (0.85, 1.70) | 56 | 69 F | 1.65 ** (1.24, 2.19) | ↑ | |
| Heart disease, including heart attacks | 58 C | 61 C | 52 | 1.14 (0.98, 1.32) | 0.79 * (0.68, 0.92) | ↓ | 56 | 62 | 1.24 (0.92, 1.68) | 44 | 53 F | 1.44 * (1.09, 1.90) | ↑ | |
| Asthma | 19 C | 23 A,C | 14 | 1.26 * (1.05, 1.51) | ↑ | 0.69 * (0.56, 0.84) | ↓ | 24 | 23 | 0.86 (0.61, 1.23) | 13 | 14 | 1.01 (0.67, 1.52) | |
| Hypertension or high blood pressure | 56 | 61 C | 53 | 1.22 * (1.05, 1.42) | ↑ | 0.897 (0.77, 1.06) | 57 | 61 | 1.17 (0.86, 1.59) | 47 | 54 F | 1.28 (0.97, 1.69) | ||
| Cancer | 33 | 40 A,C | 31 | 1.36 ** (1.16, 1.58) | ↑ | 0.972 (0.83, 1.15) | 39 | 40 | 0.99 (0.73, 1.35) | 26 | 33 F | 1.37 (1.00, 1.88) | ||
| Dental problems | 62 | 65 C | 61 | 1.13 (0.97, 1.31) | 0.955 (0.82, 1.12) | 63 | 66 | 1.19 (0.88, 1.62) | 56 | 62 | 1.19 (0.90, 1.58) | |||
| Early death (premature death) | 49 | 56 A,C | 49 | 1.37 ** (1.18, 1.58) | ↑ | 1.01 (0.87, 1.18) | 54 | 57 | 1.17 (0.87, 1.58) | 44 | 50 | 1.2 (0.90, 1.58) | ||
| Attitudes Towards Sugary Drinks | ||||||||||||||
| Sugary drinks are a major contributor to the obesity problem in Jamaica. | 84 | 87 | 80 | 1.3 * (1.05, 1.60) | ↑ | 0.823 (0.67, 1.01) | 83 | 87 | 1.32 (0.88, 1.98) | 76 | 81 F | 1.4 * (1.00, 1.95) | ↑ | |
| Sugary drinks are the major source of unnecessary sugars in a person’s daily diet. | 84 | 86 | 84 | 1.17 (0.99, 1.44) | 0.928 (0.76, 1.14) | 86 | 86 | 0.9 (0.58, 1.40) | 79 | 85 F | 1.59 * (1.12, 2.25) | ↑ | ||
| Too much sugar can cause severe health problems | 96 | 96 | 95 | 0.92 (0.63, 1.35) | 0.738 (0.51, 1.08) | 94 | 96 | 1.25 (0.63, 2.50) | 93 | 95 | 1.4 (0.79, 2.50) | |||
| Concerned about the effect of drinking sugary drinks on your health? (concerned) | 64 | 66 | 63 | 1.11 (0.95, 1.30) | 0.981 (0.84, 1.15) | 63 | 67 | 1.04 (0.77, 1.42) | 53 | 65 F | 1.45 * (1.09, 1.92) | ↑ | ||
| Concerned about the effect of drinking sugary drinks on your children’s health? (concerned) | 78 | 78 | 79 | 1.03 (0.79, 1.33) | 1.133 (0.86, 1.49) | 75 | 78 | 1.19 (0.70, 2.00) | 80 | 79 | 0.75 (0.43, 1.29) | |||
| As long as I exercise regularly, too much sugar will not harm my health. | 39 | 41 | 46 A | 1.03 (0.89, 1.20) | 1.21 * (1.04, 1.41) | ↑ | 45 | 41 | 1 (0.73, 1.35) | 44 | 46 | 1.11 (0.84, 1.47) | ||
| Social Norms Around Sugary Drinks | ||||||||||||||
| There are fewer and fewer occasions in which I feel comfortable drinking sugary drinks. | 70 | 68 | 73 B | 0.93 (0.79, 1.09) | 1.11 (0.94, 1.31) | 64 | 69 | 1.09 (0.79, 1.50) | 69 | 74 | 1.22 (0.90, 1.65) | |||
| People in my country are unaware of the health harms of sugary drinks. | 74 C | 72 | 69 | 0.9 (0.76, 1.06) | 0.79 * (0.67, 0.94) | ↓ | 72 | 71 | 1.03 (0.74, 1.43) | 68 | 70 | 1.08 (0.80, 1.45) | ||
| The people important to me believe that I should avoid or stop drinking sugary drinks. | 83 | 81 | 80 | 0.86 (0.71, 1.04) | 0.77 * (0.63, 0.94) | ↓ | 81 | 81 | 0.84 (0.570, 1.23) | 78 | 80 | 1.17 (0.83, 1.64) | ||
| People important to me disapprove of children drinking sugary drinks frequently. | 77 | 77 | 79 | 0.99 (0.83, 1.18) | 1.077 (0.89, 1.29) | 75 | 77 | 1.01 (0.71, 1.43) | 73 | 80 F | 1.55 * (1.12, 2.15) | ↑ | ||
| Baseline Survey | Mid-Campaign Survey | Post-Campaign Survey | Mid-Campaign Survey | Post-Campaign Survey | Mid-Campaign Survey | Post-Campaign Survey | |||||||||
|---|---|---|---|---|---|---|---|---|---|---|---|---|---|---|---|
| Unaware | Aware | Adj. OR ^ (95% CI) | Unaware | Aware | Adj. OR ^ (95% CI) | ||||||||||
| (n = 1430) | (n = 1571) | (n = 1500) | Ref: Baseline Survey | (n = 239) | (n = 1332) | (n = 271) | (n = 1229) | ||||||||
| A | B | C | Adj. OR ^ (95% CI) | Adj. OR ^ (95% CI) | D | E | F | G | |||||||
| % | % | % | % | % | % | % | |||||||||
| To what extent do you agree or disagree with the following statements? (% agree) | |||||||||||||||
| My government must act quickly to implement policies to address the problem of obesity in my country. | 90 | 91 | 90 | 1.12 (0.88, 1.44) | 0.97 (0.76, 1.25) | 88 | 91 | 1.28 (0.79, 2.05) | 87 | 91 | 1.39 (0.91, 2.11) | ||||
| The government should pass and enforce policies that discourage drinking sugary drinks and eating non-essential foods that are high in sugar, salt, and fat. | 72 | 77 A | 77 A | 1.22 * (1.03, 1.44) | ↑ | 1.2 * (1.01, 1.43) | ↑ | 72 | 78 D | 1.22 (0.87, 1.71) | 72 | 78 F | 1.29 (0.94, 1.78) | ||
| How strongly would you agree with or disagree with each of the following policies as a way of reducing obesity in Jamaica? | |||||||||||||||
| Taxes on sugary drinks. | 55 | 61 A | 59 | 1.29 * (1.11, 1.50) | ↑ | 1.17 * (1.00, 1.36) | ↑ | 52 | 62 D | 1.43 * (1.06, 1.93) | ↑ | 51 | 61 F | 1.46 * (1.11, 1.93) | ↑ |
| Taxes on unhealthy foods that are high in sugar, salt or fats, such as ice-creams, chips, burgers, and buns. | 54 | 59 A | 59 A | 1.24 ** (1.07, 1.44) | ↑ | 1.24 * (1.07, 1.45) | ↑ | 46 | 61 | 1.68 * (1.24, 2.26) | ↑ | 51 | 61 F | 1.42 * (1.08, 1.88) | ↑ |
| Taxes on sugary drinks if the money collected is invested in public programs to improve health. | 71 | 77 A | 77 A | 1.42 ** (1.20, 1.69) | ↑ | 1.4 ** (1.18, 1.67) | ↑ | 74 | 78 | 1.18 (0.84, 1.67) | ↑ | 72 | 79 F | 1.39 * (1.02, 1.91) | ↑ |
| Taxes on unhealthy foods that are high in sugar, salt or fats, such as ice-creams, chips, burgers, and buns if the money collected is invested in public programs to improve health. | 76 | 76 | 74 | 1 (0.84, 1.19) | 0.86 (0.72, 1.03) | 70 | 77 D | 1.23 (0.88, 1.72) | 66 | 75 F | 1.53 * (1.13, 2.07) | ↑ | |||
| To what extent do you agree or disagree with the following statements? (agree) | |||||||||||||||
| I intend to support government efforts to increase children’s access to healthy foods and drinks. | 93 | 96 A | 96 A | 1.69 ** (1.21, 2.37) | ↑ | 1.49 * (1.06, 2.11) | ↑ | 93 | 97 D | 1.63 (0.85, 3.12) | 94 | 96 | 1.29 (0.69, 2.42) | ||
| I support restriction on the sale and/or provision of sugary drinks and unhealthy foods in schools. | 72 | 75 | 77 A | 1.149 (0.97, 1.36) | 1.28 * (1.07, 1.52) | ↑ | 73 | 75 | 0.95 (0.68, 1.34) | 70 | 78 F | 1.55 * (1.14, 2.11) | ↑ | ||
| I support requiring the provision of healthy food and beverages in schools. | 95 | 95 | 96 A | 0.76 (0.54, 1.09) | 1.01 (0.68, 1.49) | 93 | 95 | 1.35 (0.75, 2.44) | 96 | 96 | 1.21 (0.61, 2.38) | ||||
Publisher’s Note: MDPI stays neutral with regard to jurisdictional claims in published maps and institutional affiliations. |
© 2022 by the authors. Licensee MDPI, Basel, Switzerland. This article is an open access article distributed under the terms and conditions of the Creative Commons Attribution (CC BY) license (https://creativecommons.org/licenses/by/4.0/).
Share and Cite
Christian, D.; Maharjan, M.; Kotov, A.; Cotter, T.; Mullin, S.; Nurse, V.; McGaw, B.; Chen, D.; Puri, P.; Wang, S.; et al. How the “Are We Drinking Ourselves Sick?” Communication Campaign Built Support for Policy Action on Sugary Drinks in Jamaica. Nutrients 2022, 14, 2866. https://doi.org/10.3390/nu14142866
Christian D, Maharjan M, Kotov A, Cotter T, Mullin S, Nurse V, McGaw B, Chen D, Puri P, Wang S, et al. How the “Are We Drinking Ourselves Sick?” Communication Campaign Built Support for Policy Action on Sugary Drinks in Jamaica. Nutrients. 2022; 14(14):2866. https://doi.org/10.3390/nu14142866
Chicago/Turabian StyleChristian, Donnelle, Meena Maharjan, Alexey Kotov, Trish Cotter, Sandra Mullin, Vonetta Nurse, Barbara McGaw, Deborah Chen, Pallavi Puri, Shuo Wang, and et al. 2022. "How the “Are We Drinking Ourselves Sick?” Communication Campaign Built Support for Policy Action on Sugary Drinks in Jamaica" Nutrients 14, no. 14: 2866. https://doi.org/10.3390/nu14142866
APA StyleChristian, D., Maharjan, M., Kotov, A., Cotter, T., Mullin, S., Nurse, V., McGaw, B., Chen, D., Puri, P., Wang, S., Negi, N. S., & Murukutla, N. (2022). How the “Are We Drinking Ourselves Sick?” Communication Campaign Built Support for Policy Action on Sugary Drinks in Jamaica. Nutrients, 14(14), 2866. https://doi.org/10.3390/nu14142866