
Important Food Sources of Fructose-Containing Sugars and Non-Alcoholic Fatty Liver Disease: A Systematic Review and Meta-Analysis of Controlled Trials

 ,
,  , , ,
, , ,  , , , and
Abstract
:1. Introduction
2. Materials and Methods
2.1. Data Sources and Search Strategy
2.2. Study Selection
2.3. Data Extraction
2.4. Risk of Bias Assessment
2.5. Outcomes
2.6. Data Syntheses and Analyses
2.7. Certainty of the Evidence
3. Results
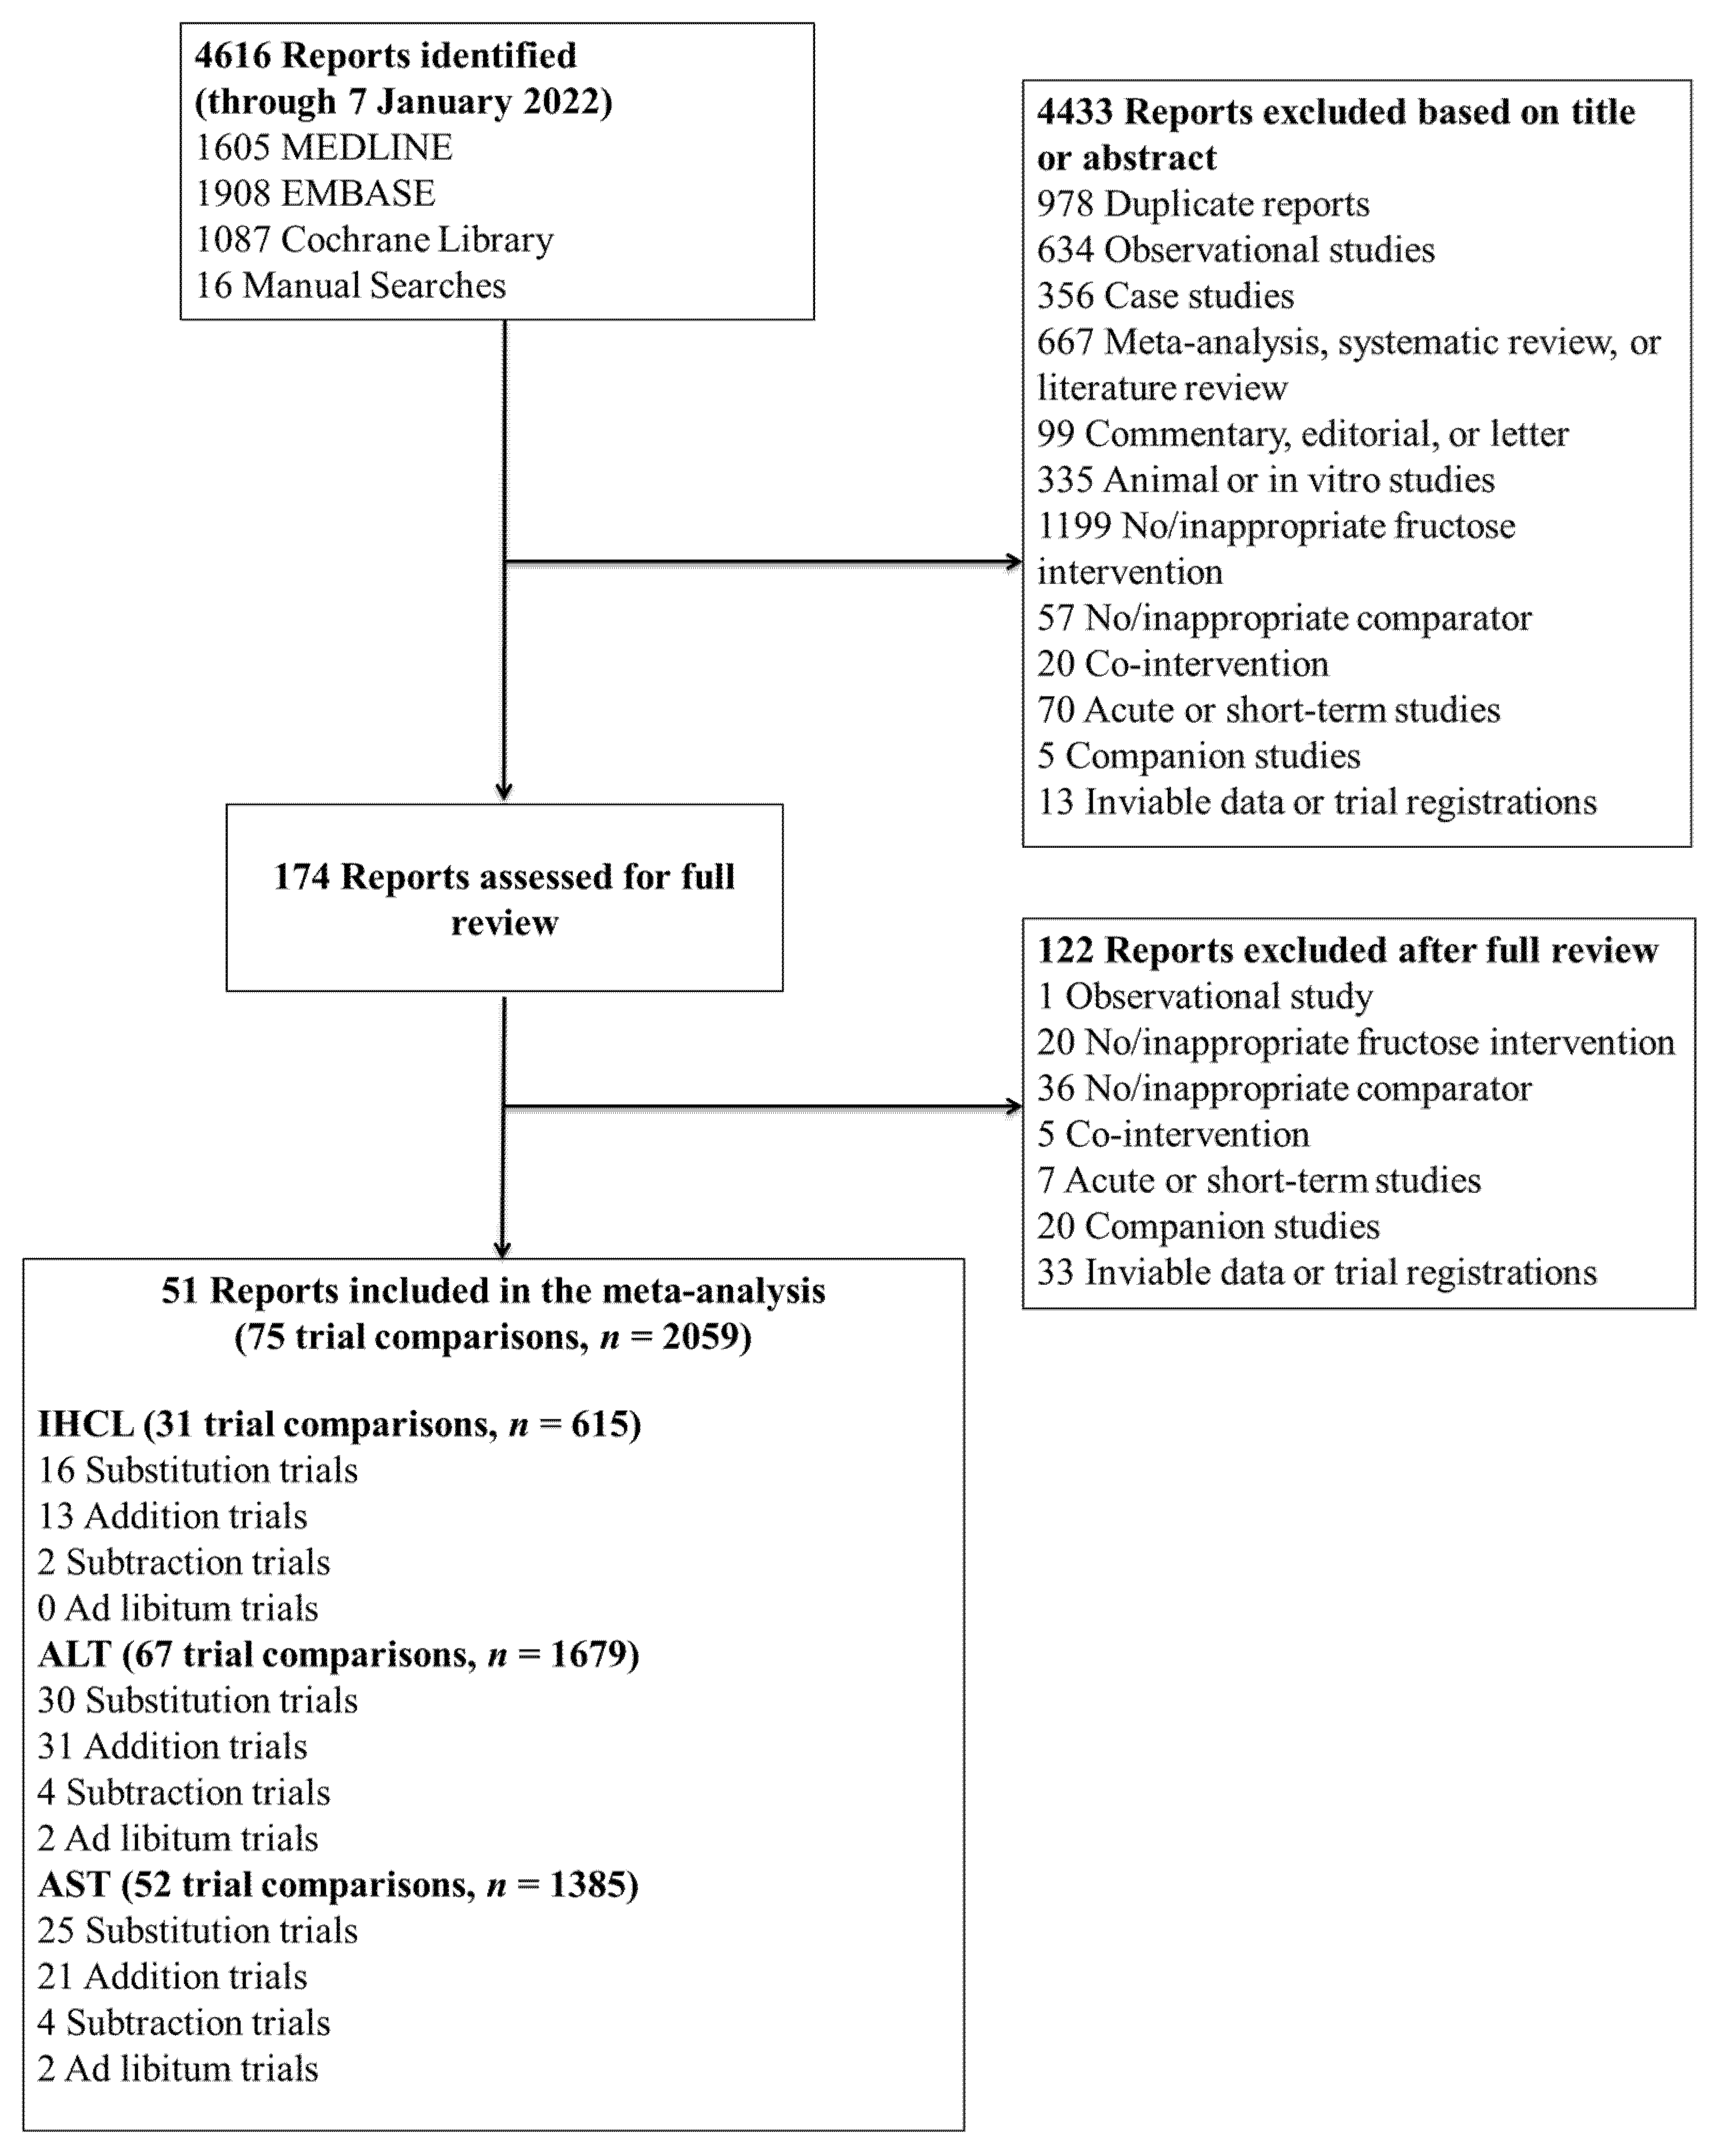
3.1. Search Results
3.2. Trial Characteristics
3.3. Risk of Bias
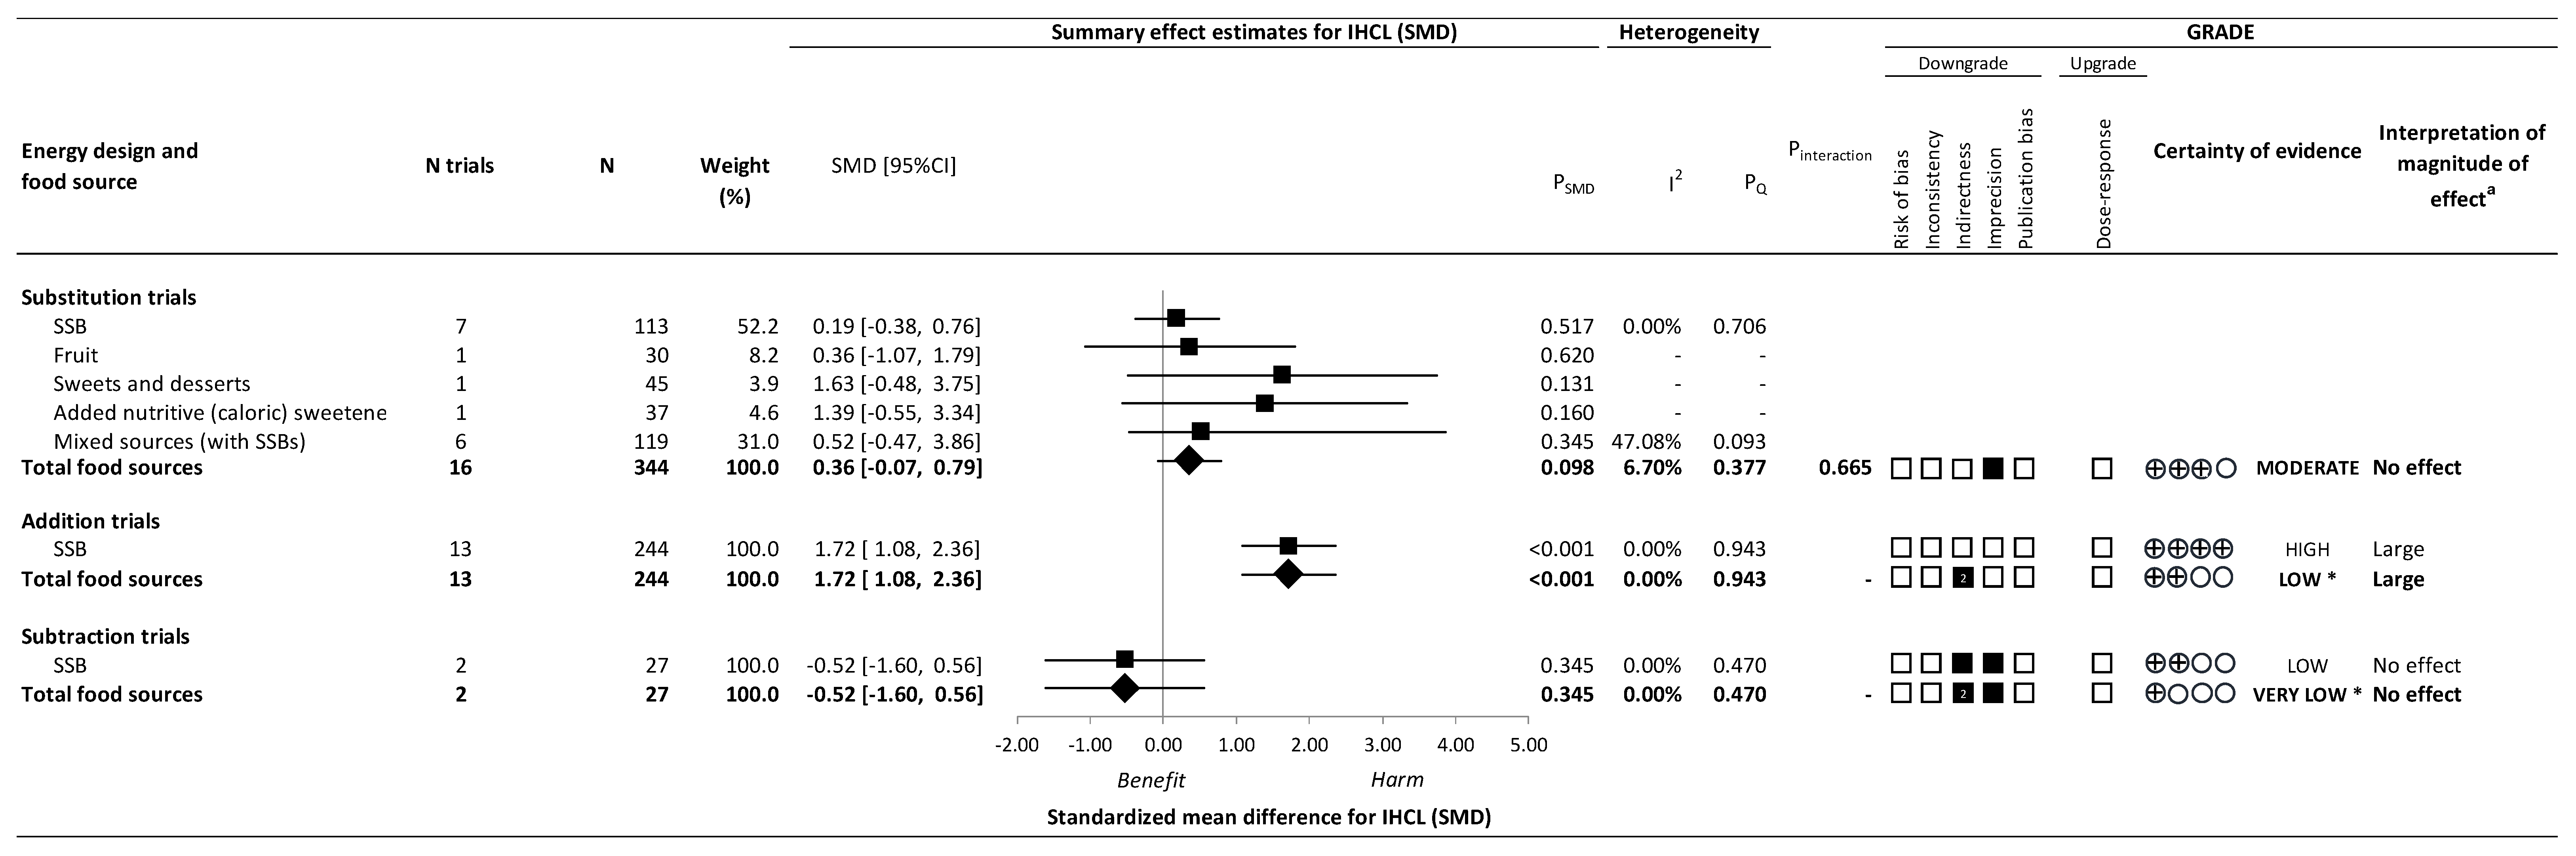
3.4. Primary Outcome
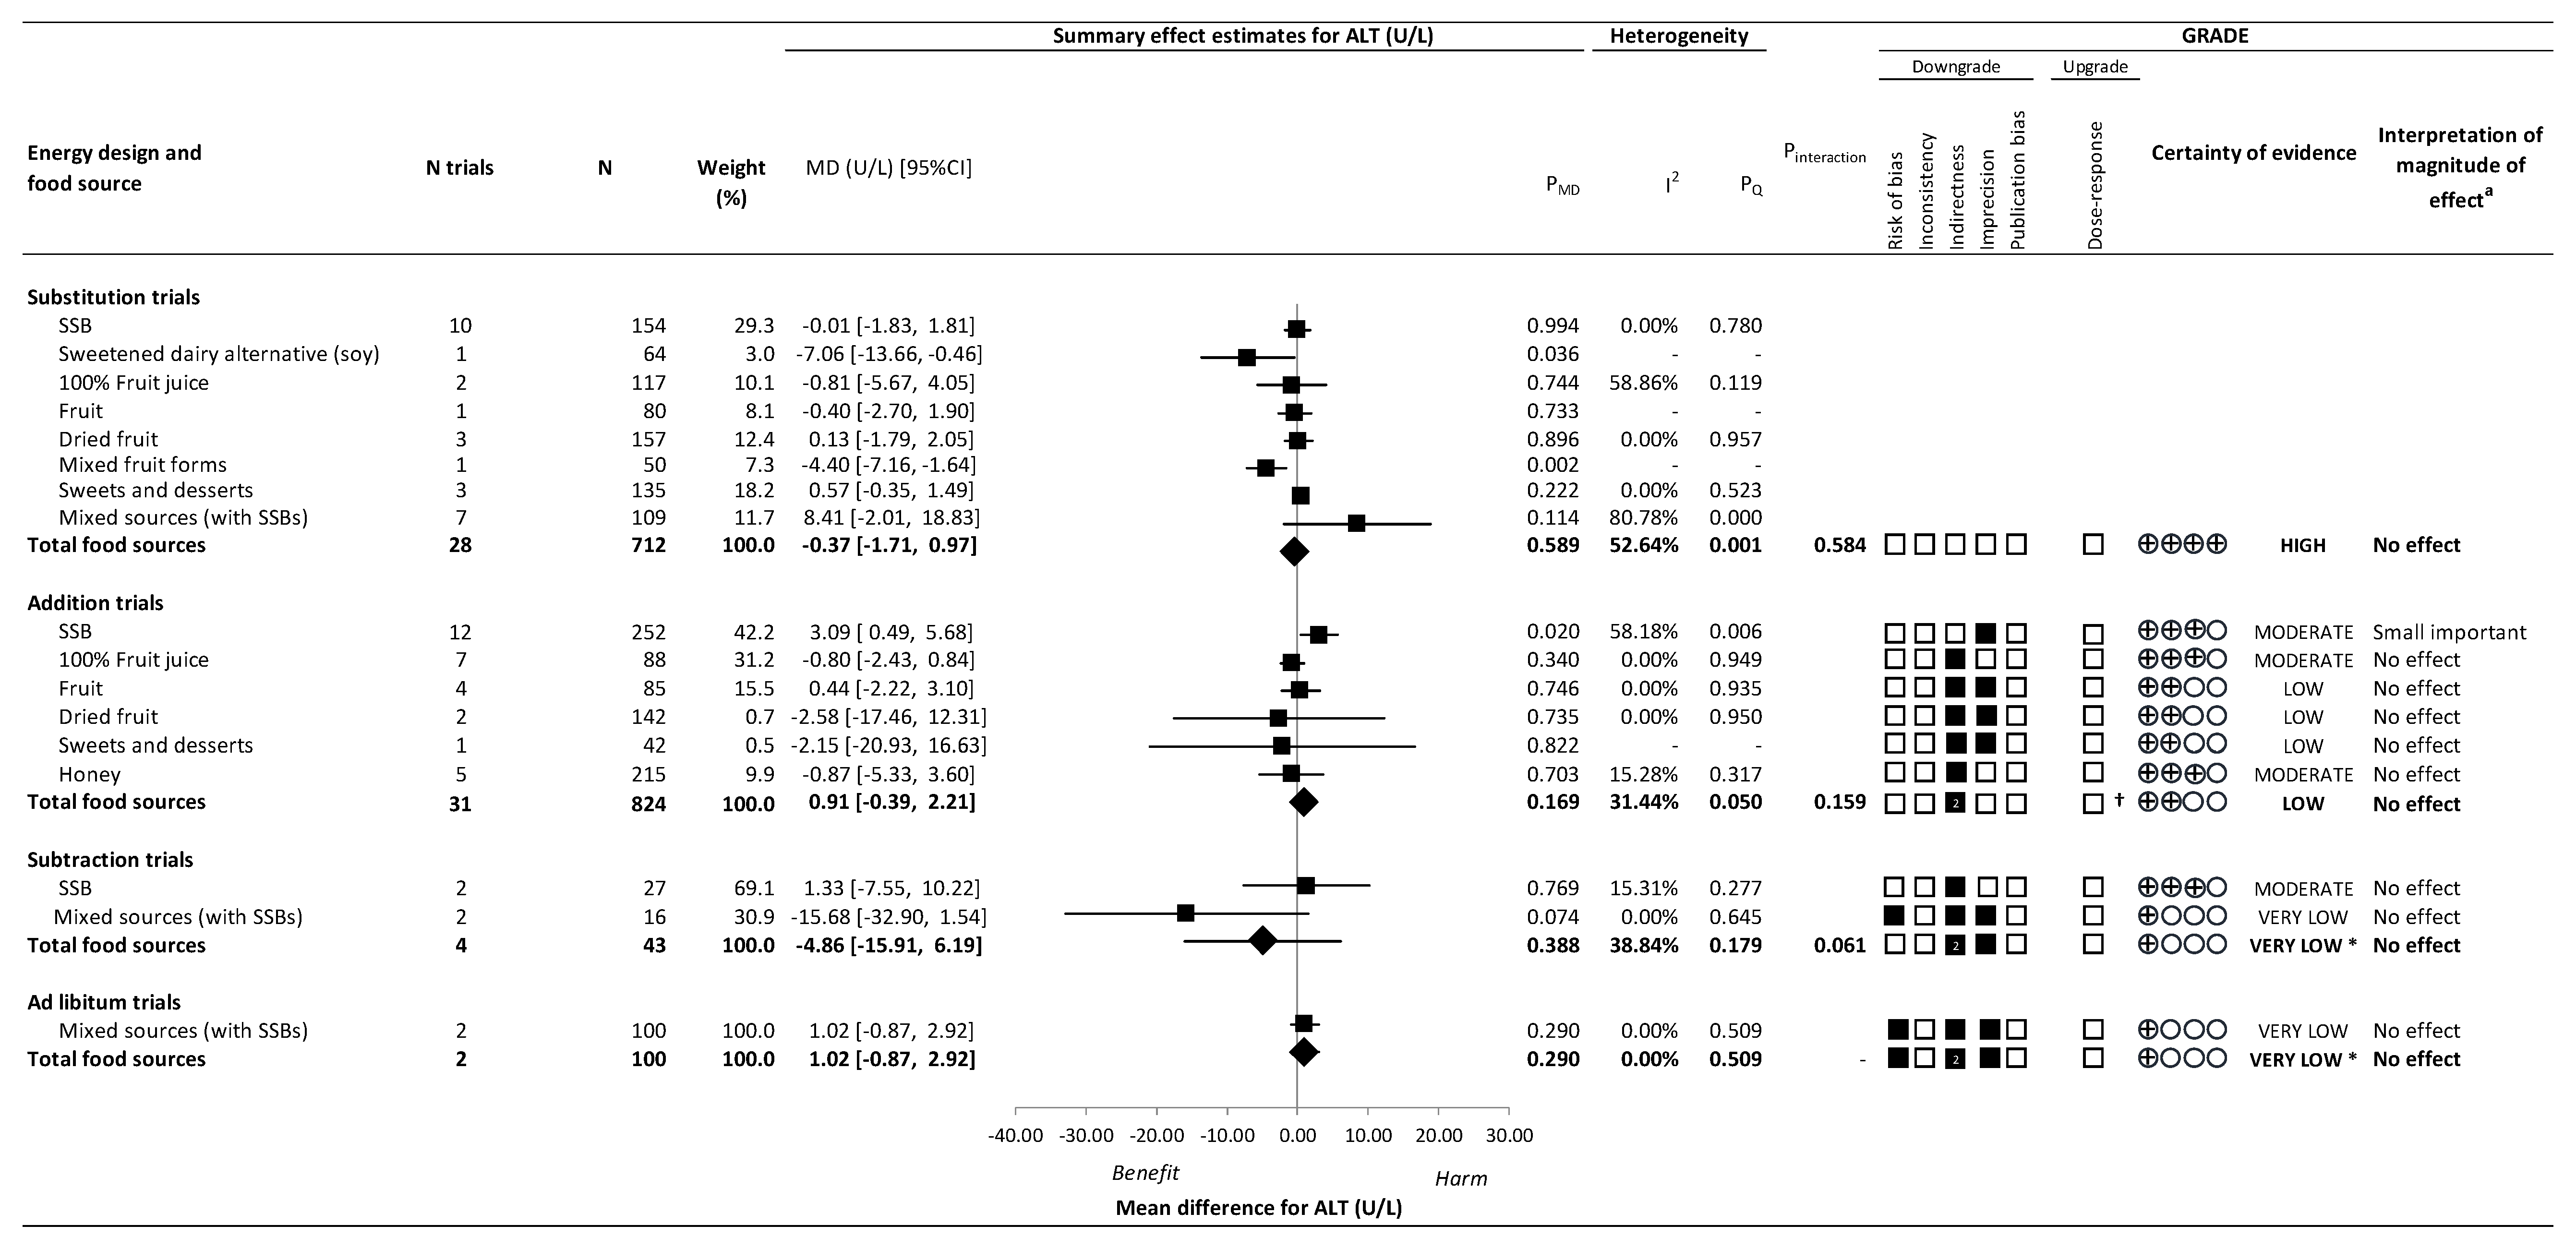
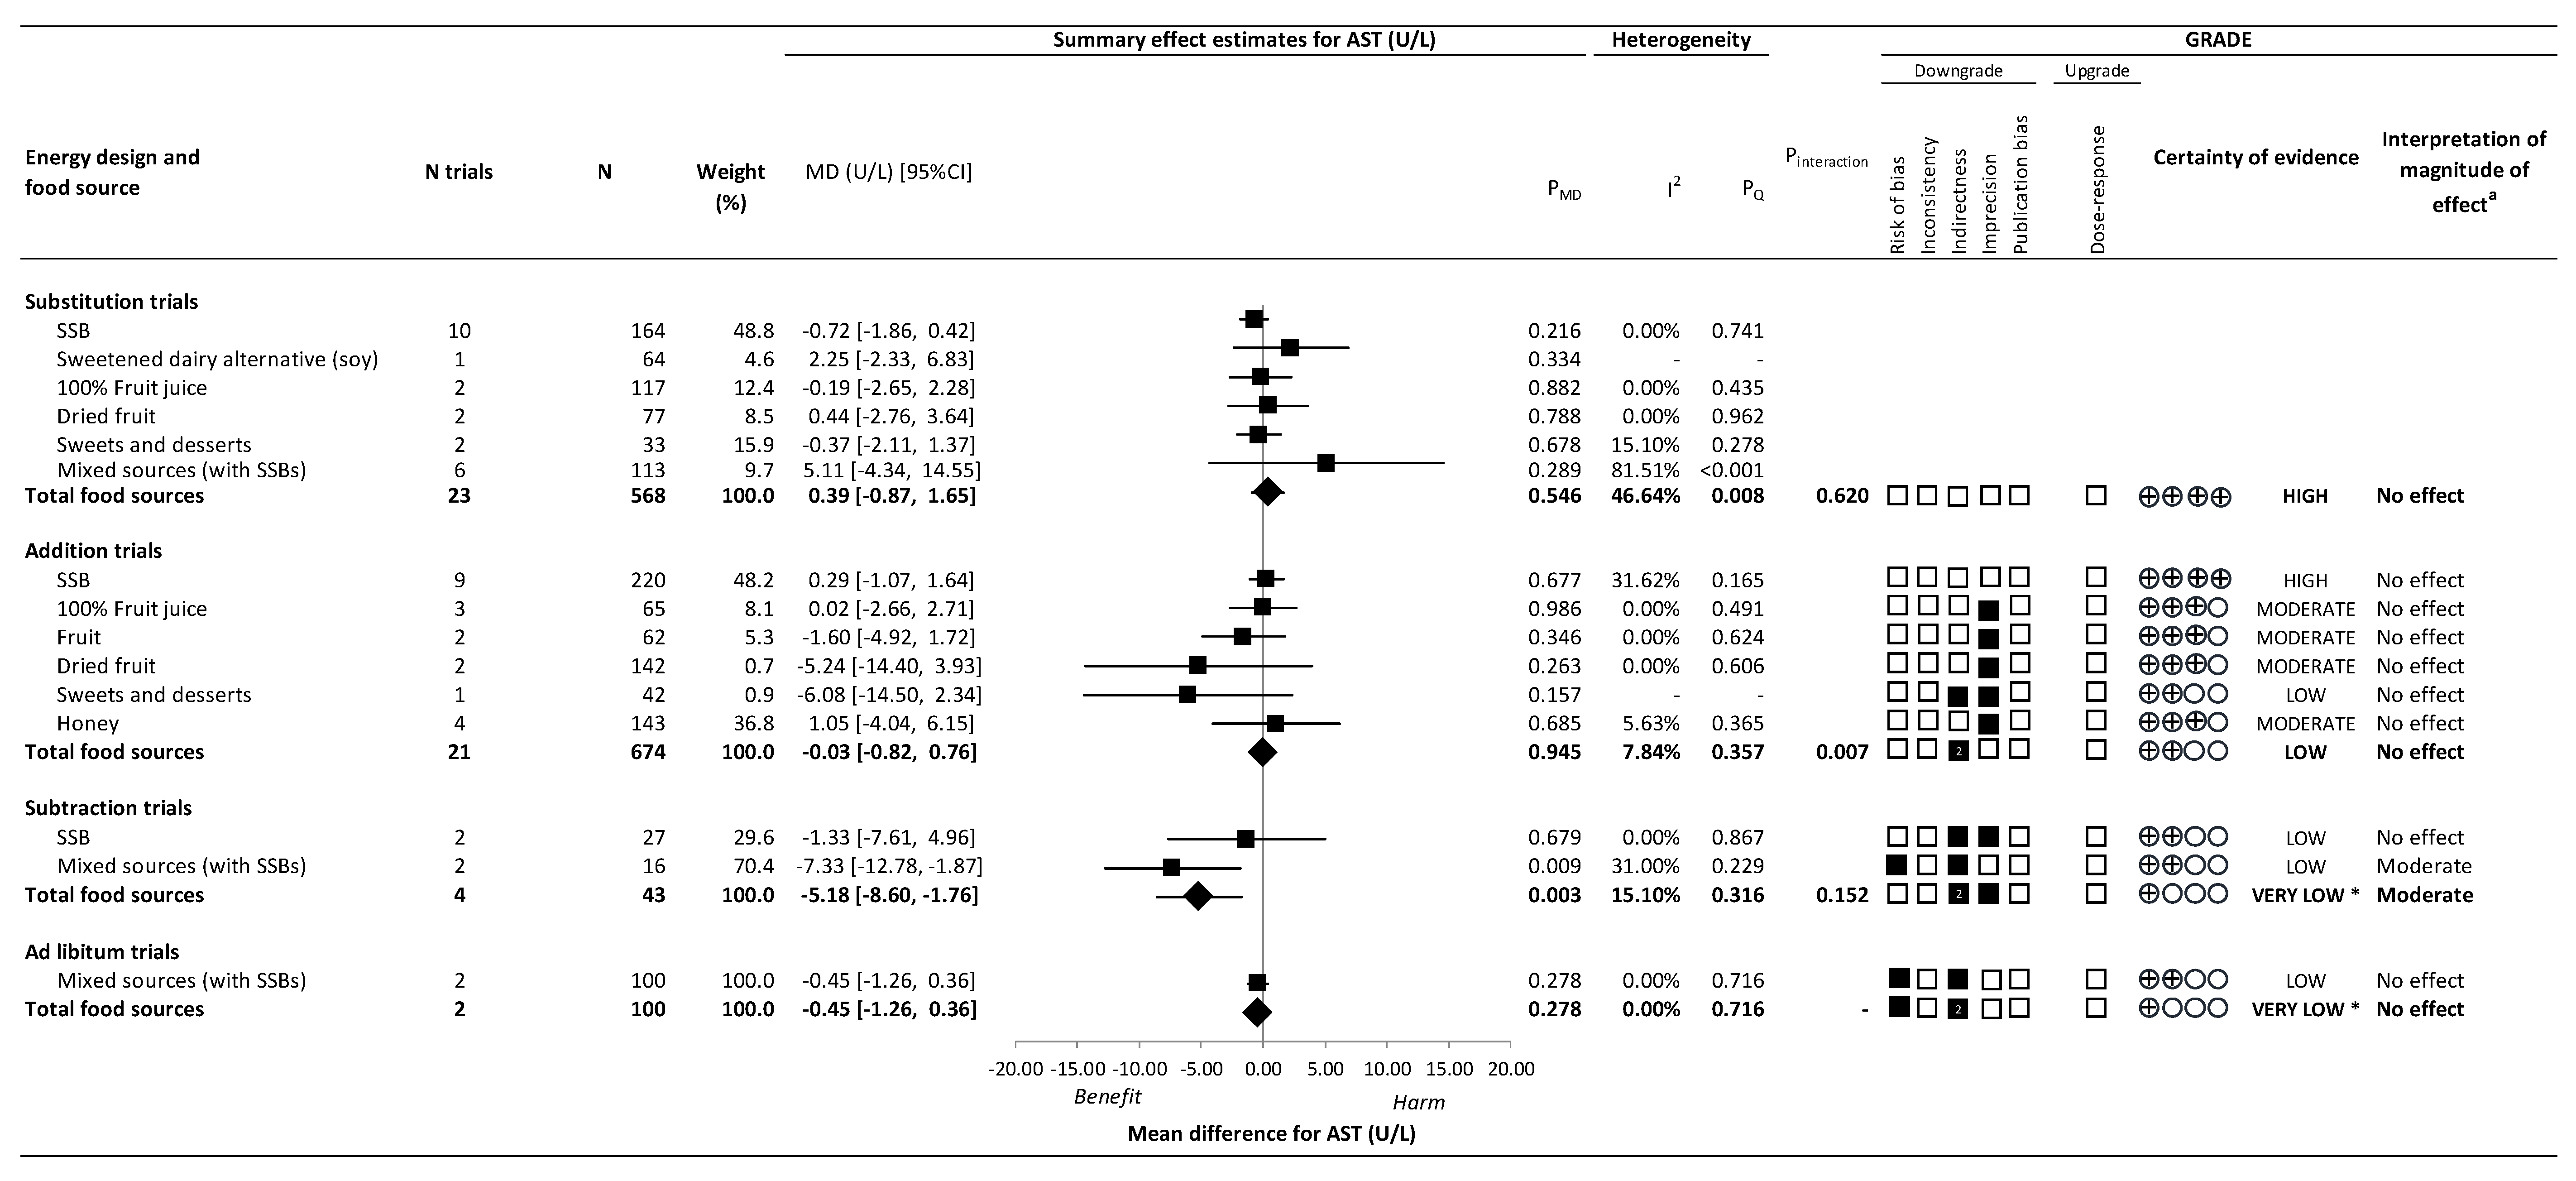
3.5. Secondary Outcomes
3.6. Sensitivity Analyses
3.7. Dose–Response Analyses
3.8. Publication Bias
3.9. GRADE Assessment
4. Discussion
4.1. Findings in Relation to the Literature
4.2. Potential Mechanisms
4.3. Strengths and Limitations
4.4. Implications
5. Conclusions
Supplementary Materials
Author Contributions
Funding
Institutional Review Board Statement
Informed Consent Statement
Data Availability Statement
Acknowledgments
Conflicts of Interest
References
- Bellentani, S.; Marino, M. Epidemiology and natural history of non-alcoholic fatty liver disease (NAFLD). Ann. Hepatol. 2009, 8 (Suppl. 1), S4–S8. [Google Scholar] [CrossRef]
- Younossi, Z.M.; Koenig, A.B.; Abdelatif, D.; Fazel, Y.; Henry, L.; Wymer, M. Global epidemiology of nonalcoholic fatty liver disease-Meta-analytic assessment of prevalence, incidence, and outcomes. Hepatology 2016, 64, 73–84. [Google Scholar] [CrossRef] [PubMed] [Green Version]
- Lelis, D.D.F.; Andrade, J.M.O.; Almenara, C.C.P.; Broseguini-Filho, G.B.; Mill, J.G.; Baldo, M.P. High fructose intake and the route towards cardiometabolic diseases. Life Sci. 2020, 259, 118235. [Google Scholar] [CrossRef] [PubMed]
- Campos, V.C.; Tappy, L. Physiological handling of dietary fructose-containing sugars: Implications for health. Int. J. Obes. 2016, 40 (Suppl. 1), S6–S11. [Google Scholar] [CrossRef]
- Sun, S.Z.; Empie, M.W. Fructose metabolism in humans—What isotopic tracer studies tell us. Nutr. Metab. 2012, 9, 89. [Google Scholar] [CrossRef] [Green Version]
- European Association for the Study of the Liver, European Association for the Study of Diabetes, European Association for the Study of Obesity. EASL-EASD-EASO Clinical Practice Guidelines for the management of non-alcoholic fatty liver disease. J. Hepatol. 2016, 64, 1388–1402. [Google Scholar] [CrossRef]
- Chiu, S.; Sievenpiper, J.L.; de Souza, R.; Cozma, A.I.; Mirrahimi, A.; Carleton, A.J.; Ha, V.; Di Buono, M.; Jenkins, A.L.; Leiter, L.A.; et al. Effect of fructose on markers of non-alcoholic fatty liver disease (NAFLD): A systematic review and meta-analysis of controlled feeding trials. Eur. J. Clin. Nutr. 2014, 68, 416–423. [Google Scholar] [CrossRef]
- Choo, V.L.; Viguiliouk, E.; Mejia, S.B.; Cozma, A.I.; Khan, T.A.; Ha, V.; Wolever, T.M.S.; Leiter, L.A.; Vuksan, V.; Kendall, C.W.C.; et al. Food sources of fructose-containing sugars and glycaemic control: Systematic review and meta-analysis of controlled intervention studies. BMJ 2018, 363, k4644. [Google Scholar] [CrossRef] [Green Version]
- Ayoub-Charette, S.; Chiavaroli, L.; Liu, Q.; Khan, T.A.; Zurbau, A.; Au-Yeung, F.; Cheung, A.; Ahmed, A.; Lee, D.; Choo, V.L.; et al. Different Food Sources of Fructose-Containing Sugars and Fasting Blood Uric Acid Levels: A Systematic Review and Meta-Analysis of Controlled Feeding Trials. J. Nutr. 2021, 151, 2409–2421. [Google Scholar] [CrossRef]
- Liu, Q.; Chiavaroli, L.; Ayoub-Charette, S.; Khan, T.; Au-Yeung, F.; Cheung, A.; Lee, D.; Ahmed, A.; Mejia, S.B.; de Souza, R.J.; et al. Important Food Sources of Fructose-Containing Sugars and Blood Pressure: A Systematic Review and Meta-Analysis of Controlled Trials. Curr. Dev. Nutr. 2021, 5 (Suppl. 2), 1056. [Google Scholar] [CrossRef]
- Chiavaroli, L.; Cheung, A.; Ayoub-Charette, S.; Ahmed, A.; Lee, D.; Au-Yeung, F.; McGlynn, N.; Ha, V.; Khan, T.; Mejia, S.B.; et al. Important Food Sources of Fructose-Containing Sugars and Adiposity: A Systematic Review and Meta-Analysis of Controlled Feeding Trials. Curr. Dev. Nutr. 2021, 5 (Suppl. 2), 1017. [Google Scholar] [CrossRef]
- Higgins, J.P.; Thomas, T.J.; Chandler, J.; Cumpston, M.; Li, T.; Page, M.J.; Welch, V.A. Cochrane Handbook for Systematic Reviews of Interventions; Version 6.1 [Internet]; Wiley: Hoboken, NJ, USA, 2020; Available online: https://training.cochrane.org/cochrane-handbook-systematic-reviews-interventions#how-to-cite (accessed on 2 June 2022).
- Page, M.J.; Moher, D.; Bossuyt, P.M.; Boutron, I.; Hoffmann, T.C.; Mulrow, C.D.; Shamseer, L.; Tetzlaff, J.M.; Akl, E.A.; Brennan, S.E.; et al. PRISMA 2020 explanation and elaboration: Updated guidance and exemplars for reporting systematic reviews. BMJ 2021, 372, n160. [Google Scholar] [CrossRef]
- Wilczynski, N.L.; Morgan, D.; Haynes, R.B.; Hedges, T. An overview of the design and methods for retrieving high-quality studies for clinical care. BMC Med. Inform. Decis. Mak. 2005, 5, 20. [Google Scholar] [CrossRef] [Green Version]
- Source Forge. Plot Digitizer. 2001. Available online: http://plotdigitizer.sourceforge.net/ (accessed on 18 January 2022).
- Luo, D.; Wan, X.; Liu, J.; Tong, T. Optimally estimating the sample mean from the sample size, median, mid-range, and/or mid-quartile range. Stat. Methods Med. Res. 2018, 27, 1785–1805. [Google Scholar] [CrossRef] [Green Version]
- Wan, X.; Wang, W.; Liu, J.; Tong, T. Estimating the sample mean and standard deviation from the sample size, median, range and/or interquartile range. BMC Med. Res. Methodol. 2014, 14, 135. [Google Scholar] [CrossRef] [Green Version]
- Furukawa, T.A.; Barbui, C.; Cipriani, A.; Brambilla, P.; Watanabe, N. Imputing missing standard deviations in meta-analyses can provide accurate results. J. Clin. Epidemiol. 2006, 59, 7–10. [Google Scholar] [CrossRef]
- Borenstein, M.; Hedges, L.V.; Higgins, J.P.; Rothstein, H.R. Introduction to Meta-Analysis; John Wiley & Sons: Oxford, UK, 2009. [Google Scholar]
- Borenstein, M.; Higgins, J.P. Meta-analysis and subgroups. Prev. Sci. 2013, 14, 134–143. [Google Scholar] [CrossRef]
- Deeks, J.J.; Higgins, J.P.; Altman, D.G. Cochrane Statistical Methods Group. Analysing data and undertaking meta-analyses. In Cochrane Handbook for Systematic Reviews of Interventions; Wiley: Hoboken, NJ, USA, 2019; pp. 241–284. [Google Scholar]
- Der Simonian, R.; Laird, N. Meta-analysis in clinical trials. Control. Clin. Trials 1986, 7, 177–188. [Google Scholar] [CrossRef]
- Elbourne, D.R.; Altman, D.G.; Higgins, J.; Curtin, F.; Worthington, H.; Vail, A. Meta-analyses involving cross-over trials: Methodological issues. Int. J. Epidemiol. 2002, 31, 140–149. [Google Scholar] [CrossRef]
- Follmann, D.; Elliott, P.; Suh, I.; Cutler, J. Variance imputation for overviews of clinical trials with continuous response. J. Clin. Epidemiol. 1992, 45, 769–773. [Google Scholar] [CrossRef]
- Balk, E.M.; Earley, A.; Patel, K.; Trikalinos, T.A.; Dahabreh, I.J. AHRQ Methods for Effective Health Care. Empirical Assessment of Within-Arm Correlation Imputation in Trials of Continuous Outcomes; Agency for Healthcare Research and Quality: Rockville, MD, USA, 2012. [Google Scholar]
- Hedges, L.; Olkin, I. Statistical Methods in Meta-Analysis; Academic Press: Cambridge, MA, USA, 2019. [Google Scholar]
- Tietz, N.W.; Carl, A.B.; Edward, R.A. Tietz Textbook of Clinical Chemistry, 2nd ed.; Saunders: Philadelphia, PA, USA, 1994. [Google Scholar]
- Thompson, S.G.; Higgins, J.P. How should meta-regression analyses be undertaken and interpreted? Stat. Med. 2002, 21, 1559–1573. [Google Scholar] [CrossRef]
- Fu, R.; Gartlehner, G.; Grant, M.; Shamliyan, T.; Sedrakyan, A.; Wilt, T.J.; Griffith, L.; Oremus, M.; Raina, P.; Ismaila, A.; et al. Conducting quantitative synthesis when comparing medical interventions: AHRQ and the Effective Health Care Program. J. Clin. Epidemiol. 2011, 64, 1187–1197. [Google Scholar] [CrossRef]
- World Health Organization. Guideline: Sugars Intake for Adults and Children; World Health Organization: Geneva, Switzerland, 2015; Available online: http://apps.who.int/iris/bitstream/handle/10665/149782/9789241549028_eng.pdf;jsessionid=F9FAD19E165BB45830BA1A484FC6FD93?sequence=1 (accessed on 11 January 2022).
- Scientific Advisory Committee on Nutrition. Carbohydrates and Health: Scientific Advisory Committee on Nutrition. 2015. Available online: https://www.gov.uk/government/publications/sacn-carbohydrates-and-health-report#:~:text=The%20Scientific%20Advisory%20Committee%20on%20Nutrition%20(%20SACN%20)%20was%20asked%20by,2%20diabetes%2C%20bowel%20health%20and (accessed on 11 January 2022).
- United States Department of Health and Human Services and United States Department of Agriculture. 2015–2020 Dietary Guidelines for Americans, 8th ed.; United States Department of Health and Human Services and United States Department of Agriculture: Washington, DC, USA, 2015. Available online: http://health.gov/dietaryguidelines/2015/guidelines/ (accessed on 11 January 2022).
- Institute of Medicine. Dietary Reference Intakes for Energy, Carbohydrate, Fiber, Fat, Fatty Acids, Cholesterol, Protein, and Amino Acids; The National Academies Press: Washington, DC, USA, 2005; Available online: https://www.nap.edu/catalog/10490/dietary-reference-intakes-for-energy-carbohydrate-fiber-fat-fatty-acids-cholesterol-protein-and-amino-acids (accessed on 11 January 2022).
- Egger, M.; Smith, G.D.; Schneider, M.; Minder, C. Bias in meta-analysis detected by a simple, graphical test. BMJ 1997, 315, 629–634. [Google Scholar] [CrossRef] [Green Version]
- Begg, C.B.; Mazumdar, M. Operating Characteristics of a Rank Correlation Test for Publication Bias. Biometrics 1994, 50, 1088–1101. [Google Scholar] [CrossRef]
- Sterne, J.A.; Gavaghan, D.; Egger, M. Publication and related bias in meta-analysis: Power of statistical tests and prevalence in the literature. J. Clin. Epidemiol. 2000, 53, 1119–1129. [Google Scholar] [CrossRef]
- Duval, S.; Tweedie, R. Trim and fill: A simple funnel-plot-based method of testing and adjusting for publication bias in meta-analysis. Biometrics 2000, 56, 455–463. [Google Scholar] [CrossRef]
- Schünemann, H.B.J.; Guyatt, G.O.A. GRADE Handbook. 2013. Available online: https://handbook-5-1.cochrane.org (accessed on 2 June 2022).
- Andrews, J.; Guyatt, G.; Oxman, A.D.; Alderson, P.; Dahm, P.; Falck-Ytter, Y.; Nasser, M.; Meerpohl, J.; Post, P.N.; Kunz, R.; et al. GRADE guidelines: Going from evidence to recommendations: The significance and presentation of recommendations. J. Clin. Epidemiol. 2013, 66, 719–725. [Google Scholar] [CrossRef]
- Brunetti, M.; Shemilt, I.; Pregno, S.; Vale, L.; Oxman, A.D.; Lord, J.; Sisk, J.; Ruiz, F.; Hill, S.; Guyatt, G.H.; et al. GRADE guidelines: Considering resource use and rating the quality of economic evidence. J. Clin. Epidemiol. 2013, 66, 140–150. [Google Scholar] [CrossRef]
- Guyatt, G.H.; Oxman, A.D.; Schünemann, H.J. GRADE guidelines-an introduction to the 10th–13th articles in the series. J. Clin. Epidemiol. 2013, 66, 121–123. [Google Scholar] [CrossRef]
- Guyatt, G.; Oxman, A.D.; Sultan, S.; Brozek, J.; Glasziou, P.; Alonso-Coello, P.; Atkins, D.; Kunz, R.; Montori, V.; Jaeschke, R.; et al. GRADE guidelines: Making an overall rating of confidence in effect estimates for a single outcome and for all outcomes. J. Clin. Epidemiol. 2013, 66, 151–157. [Google Scholar] [CrossRef]
- Guyatt, G.H.; Oxman, A.D.; Santesso, N.; Helfand, M.; Vist, G.; Kunz, R. GRADE guidelines: Preparing summary of findings tables-binary outcomes. J. Clin. Epidemiol. 2013, 66, 158–172. [Google Scholar] [CrossRef] [PubMed]
- Guyatt, G.H.; Thorlund, K.; Oxman, A.D.; Walter, S.D.; Patrick, D.; Furukawa, T.A. GRADE guidelines: Preparing summary of findings tables and evidence profiles-continuous outcomes. J. Clin. Epidemiol. 2013, 66, 173–183. [Google Scholar] [CrossRef] [PubMed]
- Aeberli, I.; Gerber, P.A.; Hochuli, M.; Kohler, S.; Haile, S.R.; Gouni-Berthold, I. Low to moderate sugar-sweetened beverage consumption impairs glucose and lipid metabolism and promotes inflammation in healthy young men: A randomized controlled trial. Am. J. Clin. Nutr. 2011, 94, 479–485. [Google Scholar] [CrossRef] [PubMed] [Green Version]
- Agebratt, C.; Ström, E.; Romu, T.; Dahlqvist-Leinhard, O.; Borga, M.; Leanderson, P.; Nystrom, F.H. A Randomized Study of the Effects of Additional Fruit and Nuts Consumption on Hepatic Fat Content, Cardiovascular Risk Factors and Basal Metabolic Rate. PLoS ONE 2016, 11, e0147149. [Google Scholar] [CrossRef]
- Banini, A.E.; Boyd, L.C.; Allen, J.C.; Allen, H.G.; Sauls, D.L. Muscadine grape products intake, diet and blood constituents of non-diabetic and type 2 diabetic subjects. Nutrition 2006, 22, 1137–1145. [Google Scholar] [CrossRef]
- Kreis, R.; Boesch, C.H.; Campos, V.; Schneiter, P.; Despland, C.; Brandejsky, V.; Tappy, L.; Chiolero, A. Sugar and artificially sweetened beverages and intrahepatic fat: A randomized controlled trial. Obes. (Silver Spring) 2015, 23, 2335–2339. [Google Scholar] [CrossRef]
- Claesson, A.L.; Holm, G.; Ernersson, A.; Lindström, T.; Nystrom, F.H. Two weeks of overfeeding with candy, but not peanuts, increases insulin levels and body weight. Scand. J. Clin. Lab. Investig. 2009, 69, 598–605. [Google Scholar] [CrossRef]
- Cox, C.L.; Stanhope, K.L.; Schwarz, J.M.; Graham, J.L.; Hatcher, B.; Griffen, S.C.; Bremer, A.A.; Berglund, L.; McGahan, J.P.; Keim, N.L.; et al. Consumption of fructose- but not glucose-sweetened beverages for 10 weeks increases circulating concentrations of uric acid, retinol binding protein-4, and gamma-glutamyl transferase activity in overweight/obese humans. Nutr. Metab. 2012, 9, 68. [Google Scholar] [CrossRef] [Green Version]
- Jin, R.; Welsh, J.A.; Le, N.-A.; Holzberg, J.; Sharma, P.; Martin, D.R.; Vos, M.B. Dietary Fructose Reduction Improves Markers of Cardiovascular Disease Risk in Hispanic-American Adolescents with NAFLD. Nutrients 2014, 6, 3187–3201. [Google Scholar] [CrossRef] [Green Version]
- Johnston, R.D.; Stephenson, M.C.; Crossland, H.; Cordon, S.M.; Palcidi, E.; Cox, E.; Taylor, M.A.; Aithal, G.; Macdonald, I. No Difference Between High-Fructose and High-Glucose Diets on Liver Triacylglycerol or Biochemistry in Healthy Overweight Men. Gastroenterology 2013, 145, 1016–1025.e2. [Google Scholar] [CrossRef] [Green Version]
- Koopman, K.E.; Caan, M.W.; Nederveen, A.J.; Pels, A.; Ackermans, M.T.; Fliers, E.; La Fleur, S.E.; Serlie, M.J. Hypercaloric diets with increased meal frequency, but not meal size, increase intrahepatic triglycerides: A randomized controlled trial. Hepatology 2014, 60, 545–553. [Google Scholar] [CrossRef]
- Lê, K.A.; Faeh, D.; Stettler, R.; Ith, M.; Kreis, R.; Vermathen, P.; Tappy, L. A 4-wk high-fructose diet alters lipid metabolism without affecting insulin sensitivity or ectopic lipids in healthy humans. Am. J. Clin. Nutr. 2006, 84, 1374–1379. [Google Scholar] [CrossRef] [Green Version]
- Lê, K.A.; Ith, M.; Kreis, R.; Faeh, D.; Bortolotti, M.; Tran, C.; Tappy, L. Fructose overconsumption causes dyslipidemia and ectopic lipid deposition in healthy subjects with and without a family history of type 2 diabetes. Am. J. Clin. Nutr. 2009, 89, 1760–1765. [Google Scholar] [CrossRef] [Green Version]
- Lehtonen, H.-M.; Suomela, J.-P.; Tahvonen, R.; Vaarno, J.; Venojärvi, M.; Viikari, J.; Kallio, H. Berry meals and risk factors associated with metabolic syndrome. Eur. J. Clin. Nutr. 2010, 64, 614–621. [Google Scholar] [CrossRef]
- Ngo Sock, E.T.; Lê, K.A.; Ith, M.; Kreis, R.; Boesch, C.; Tappy, L. Effects of a short-term overfeeding with fructose or glucose in healthy young males. Br. J. Nutr. 2010, 103, 939–943. [Google Scholar] [CrossRef] [Green Version]
- Ravn-Haren, G.; Dragsted, L.O.; Buch-Andersen, T.; Jensen, E.N.; Jensen, R.I.; Németh-Balogh, M.; Paulovicsová, B.; Bergström, A.; Wilcks, A.; Licht, T.R.; et al. Intake of whole apples or clear apple juice has contrasting effects on plasma lipids in healthy volunteers. Eur. J. Nutr. 2013, 52, 1875–1889. [Google Scholar] [CrossRef]
- Ahmed, T.; Sadia, H.; Khalid, A.; Batool, S.; Janjua, A. Report: Prunes and liver function: A clinical trial. Pak. J. Pharm. Sci. 2010, 23, 463–466. [Google Scholar]
- Alavinejad, P.; Alavinejad, F.F.P.; Farsi, F.; Rezazadeh, A.; Mahmoodi, M.; Hajiani, E.; Masjedizadeh, A.R.; Mard, S.A.; Neisi, N.; Hoseini, H.; et al. The Effects of Dark Chocolate Consumption on Lipid Profile, Fasting Blood Sugar, Liver Enzymes, Inflammation, and Antioxidant Status in Patients with Non-Alcoholic Fatty Liver Disease: A Randomized, Placebo-Controlled, Pilot study. J. Gastroenterol. Hepatol. Res. 2015, 4, 1858–1864. [Google Scholar] [CrossRef]
- Amagase, H.; Sun, B.; Nance, D.M. Immunomodulatory effects of a standardized Lycium barbarum fruit juice in Chinese older healthy human subjects. J. Med. Food 2009, 12, 1159–1165. [Google Scholar] [CrossRef]
- Bahrami, M.; Ataie-Jafari, A.; Hosseini, S.; Foruzanfar, M.H.; Rahmani, M.; Pajouhi, M. Effects of natural honey consumption in diabetic patients: An 8-week randomized clinical trial. Int. J. Food Sci. Nutr. 2009, 60, 618–626. [Google Scholar] [CrossRef]
- Chiu, S.; Siri-Tarino, P.; Bergeron, N.; Suh, J.H.; Krauss, R.M. A Randomized Study of the Effect of Replacing Sugar-Sweetened Soda by Reduced Fat Milk on Cardiometabolic Health in Male Adolescent Soda Drinkers. Nutrients 2020, 12, 405. [Google Scholar] [CrossRef] [Green Version]
- Eslami, O.; Shidfar, F.; Maleki, Z.; Jazayeri, S.; Hosseini, A.F.; Agah, S.; Ardiyani, F. Effect of Soy Milk on Metabolic Status of Patients with Nonalcoholic Fatty Liver Disease: A Randomized Clinical Trial. J. Am. Coll. Nutr. 2019, 38, 51–58. [Google Scholar] [CrossRef] [PubMed]
- Niri, Z.I.; Shidfar, F.; Jabbari, M.; Zarrati, M.; Hosseini, A.; Malek, M. The effect of dried Ziziphus vulgaris on glycemic control, lipid profile, Apo-proteins and hs-CRP in patients with type 2 diabetes mellitus: A randomized controlled clinical trial. J. Food Biochem. 2020, 45, e13193. [Google Scholar]
- Kaliora, A.C.; Kokkinos, A.; Diolintzi, A.; Stoupaki, M.; Gioxari, A.; Kanellos, P.T.; Dedoussis, G.V.Z.; Vlachogiannakos, J.; Revenas, C.; Ladas, S.D.; et al. The effect of minimal dietary changes with raisins in NAFLD patients with non-significant fibrosis: A randomized controlled intervention. Food Funct. 2016, 7, 4533–4544. [Google Scholar] [CrossRef] [PubMed]
- Kanellos, P.T.; Kaliora, A.C.; Protogerou, A.; Tentolouris, N.; Perrea, D.N.; Karathanos, V.T. The effect of raisins on biomarkers of endothelial function and oxidant damage; an open-label and randomized controlled intervention. Food Res. Int. 2017, 102, 674–680. [Google Scholar] [CrossRef] [PubMed]
- Kelsay, J.L.; Behall, K.M.; Holden, J.M.; Prather, E.S. Diets high in glucose or sucrose and young women. Am. J. Clin. Nutr. 1974, 27, 926–936. [Google Scholar] [CrossRef] [PubMed]
- Lehtonen, H.-M.; Suomela, J.-P.; Tahvonen, R.; Yang, B.; Venojärvi, M.; Viikari, J.; Kallio, H. Different berries and berry fractions have various but slightly positive effects on the associated variables of metabolic diseases on overweight and obese women. Eur. J. Clin. Nutr. 2011, 65, 394–401. [Google Scholar] [CrossRef] [PubMed] [Green Version]
- Luukkonen, P.K.; Sädevirta, S.; Zhou, Y.; Kayser, B.; Ali, A.; Ahonen, L.; Lallukka, S.; Pelloux, V.; Gaggini, M.; Jian, C.; et al. Saturated Fat Is More Metabolically Harmful for the Human Liver Than Unsaturated Fat or Simple Sugars. Diabetes Care 2018, 41, 1732–1739. [Google Scholar] [CrossRef] [Green Version]
- Maersk, M.; Belza, A.; Stødkilde-Jørgensen, H.; Ringgaard, S.; Chabanova, E.; Thomsen, H.; Pedersen, S.B.; Astrup, A.; Richelsen, B. Sucrose-sweetened beverages increase fat storage in the liver, muscle, and visceral fat depot: A 6-mo randomized intervention study. Am. J. Clin. Nutr. 2012, 95, 283–289. [Google Scholar] [CrossRef]
- Mäkinen, K.K.; Scheinin, A. Turku sugar studies XIII: Effect of the diet on certain clinico-chemical values of serum. Acta Odontol. Scand. 1976, 34, 371–380. [Google Scholar] [CrossRef]
- Nier, A.; Brandt, A.; Conzelmann, I.B.; Özel, Y.; Bergheim, I. Non-Alcoholic Fatty Liver Disease in Overweight Children: Role of Fructose Intake and Dietary Pattern. Nutrients 2018, 10, 1329. [Google Scholar] [CrossRef] [Green Version]
- Ribeiro, C.; Dourado, G.; Cesar, T. Orange juice allied to a reduced-calorie diet results in weight loss and ameliorates obesity-related biomarkers: A randomized controlled trial. Nutrition 2017, 38, 13–19. [Google Scholar] [CrossRef]
- Silbernagel, G.; Machann, J.; Unmuth, S.; Schick, F.; Stefan, N.; Häring, H.U.; Fritsche, A. Effects of 4-week very-high-fructose/glucose diets on insulin sensitivity, visceral fat and intrahepatic lipids: An exploratory trial. Br. J. Nutr. 2011, 106, 79–86. [Google Scholar] [CrossRef] [Green Version]
- Sobrecases, H.; Lê, K.-A.; Bortolotti, M.; Schneiter, P.; Ith, M.; Kreis, R.; Boesch, C.; Tappy, L. Effects of short-term overfeeding with fructose, fat and fructose plus fat on plasma and hepatic lipids in healthy men. Diabetes Metab. 2010, 36, 244–246. [Google Scholar] [CrossRef]
- Parry, S.A.; Rosqvist, F.; Mozes, F.E.; Cornfield, T.; Hutchinson, M.; Piche, M.-E.; Hülsmeier, A.J.; Hornemann, T.; Dyson, P.; Hodson, L. Intrahepatic Fat and Postprandial Glycemia Increase After Consumption of a Diet Enriched in Saturated Fat Compared with Free Sugars. Diabetes Care 2020, 43, 1134–1141. [Google Scholar] [CrossRef]
- Purkins, L.; Love, E.R.; Eve, M.D.; Wooldridge, C.L.; Cowan, C.; Smart, T.S.; Johnson, P.J.; Rapeport, G. The influence of diet upon liver function tests and serum lipids in healthy male volunteers resident in a Phase I unit. Br. J. Clin. Pharmacol. 2004, 57, 199–208. [Google Scholar] [CrossRef] [Green Version]
- Schell, J.; Betts, N.M.; Lyons, T.J.; Basu, A. Raspberries Improve Postprandial Glucose and Acute and Chronic Inflammation in Adults with Type 2 Diabetes. Ann. Nutr. Metab. 2019, 74, 165–174. [Google Scholar] [CrossRef]
- Schwarz, J.-M.; Noworolski, S.M.; Wen, M.J.; Dyachenko, A.; Prior, J.L.; Weinberg, M.E.; Herraiz, L.A.; Tai, V.W.; Bergeron, N.; Bersot, T.P.; et al. Effect of a High-Fructose Weight-Maintaining Diet on Lipogenesis and Liver Fat. J. Clin. Endocrinol. Metab. 2015, 100, 2434–2442. [Google Scholar] [CrossRef]
- Schwimmer, J.B.; Ugalde-Nicalo, P.; Welsh, J.A.; Angeles, J.E.; Cordero, M.; Harlow, K.E. Effect of a Low Free Sugar Diet vs Usual Diet on Nonalcoholic Fatty Liver Disease in Adolescent Boys: A Randomized Clinical Trial. JAMA 2019, 321, 256–265. [Google Scholar] [CrossRef] [Green Version]
- Umpleby, A.M.; Shojaee-Moradie, F.; Fielding, B.; Li, X.; Marino, A.; Alsini, N.; Isherwood, C.; Jackson, N.; Ahmad, A.; Stolinski, M.; et al. Impact of liver fat on the differential partitioning of hepatic triacylglycerol into VLDL subclasses on high and low sugar diets. Clin. Sci. 2017, 131, 2561–2573. [Google Scholar] [CrossRef] [Green Version]
- Vos, M.B.; Weber, M.B.; Welsh, J.; Khatoon, F.; Jones, D.P.; Whitington, P.F.; McClain, C.J. Fructose and Oxidized Low-Density Lipoprotein in Pediatric Nonalcoholic Fatty Liver Disease: A Pilot Study. Arch. Pediatr. Adolesc. Med. 2009, 163, 674–675. [Google Scholar] [CrossRef] [Green Version]
- Zakaria, Z.; Abidin, Z.F.Z.; Gan, S.H.; Hamid, W.Z.W.A.; Mohamed, M. Effects of honey supplementation on safety profiles among postmenopausal breast cancer patients. J. Taibah Univ. Med. Sci. 2018, 13, 535–540. [Google Scholar] [CrossRef]
- Dikariyanto, V.; Smith, L.; Francis, L.; Robertson, M.; Kusaslan, E.; O’Callaghan-Latham, M.; Palanche, C.; D’Annibale, M.; Christodoulou, D.; Basty, N.; et al. Snacking on whole almonds for 6 weeks improves endothelial function and lowers LDL cholesterol but does not affect liver fat and other cardiometabolic risk factors in healthy adults: The ATTIS study, a randomized controlled trial. Am. J. Clin. Nutr. 2020, 111, 1178–1189. [Google Scholar] [CrossRef]
- Simons, N.; Veeraiah, P.; Simons, P.I.H.G.; Schaper, N.C.; Kooi, M.E.; Schrauwen-Hinderling, V.B.; Feskens, E.J.M.; van der Ploeg, E.M.C. Effects of fructose restriction on liver steatosis (FRUITLESS); A double-blind randomized controlled trial. Am. J. Clin. Nutr. 2021, 113, 391–400. [Google Scholar] [CrossRef]
- Tang, S.P.; Wan Yusuf, W.N.; Abd Aziz, C.B.; Mustafa, M.; Mohamed, M. Effects of Six-Month Tualang Honey Supplementation on Physiological and Biochemical Profiles in Asymptomatic, Treatment-naïve HIV-infected Patients. Trop. J. Nat. Prod. Res. 2020, 4, 1116–1123. [Google Scholar]
- Porikos, K.P.; Van Itallie, T.B. Diet-induced changes in serum transaminase and triglyceride levels in healthy adult men: Role of sucrose and excess calories. Am. J. Med. 1983, 75, 624–630. [Google Scholar] [CrossRef]
- Alemán, J.O.; Henderson, W.A.; Walker, J.M.; Ronning, A.; Jones, D.R.; Walter, P.J.; Daniel, S.G.; Bittinger, K.; Vaughan, R.; MacArthur, R.; et al. Excess dietary fructose does not alter gut microbiota or permeability in humans: A pilot randomized controlled study. J. Clin. Transl. Sci. 2021, 5, e143. [Google Scholar] [CrossRef] [PubMed]
- Debray, F.-G.; Seyssel, K.; Fadeur, M.; Tappy, L.; Paquot, N.; Tran, C. Effect of a high fructose diet on metabolic parameters in carriers for hereditary fructose intolerance. Clin. Nutr. 2021, 40, 4246–4254. [Google Scholar] [CrossRef]
- Kojadinovic, M.; Glibetic, M.; Vucic, V.; Popovic, M.; Vidovic, N.; Debeljak-Martacic, J.; Arsic, A. Short-Term Consumption of Pomegranate Juice Alleviates Some Metabolic Disturbances in Overweight Patients with Dyslipidemia. J. Med. Food 2021, 24, 925–933. [Google Scholar] [CrossRef]
- Ponce, O.; Benassi, R.; Cesar, T. Orange juice associated with a balanced diet mitigated risk factors of metabolic syndrome: A randomized controlled trial. J. Nutr. Intermed. Metab. 2019, 17, 100101. [Google Scholar] [CrossRef]
- Sigala, D.M.; Hieronimus, B.; Medici, V.; Lee, V.; Nunez, M.V.; Bremer, A.A.; Cox, C.L.; Price, C.A.; Benyam, Y.; Chaudhari, A.J.; et al. Consuming Sucrose- or HFCS-sweetened Beverages Increases Hepatic Lipid and Decreases Insulin Sensitivity in Adults. J. Clin. Endocrinol. Metab. 2021, 106, 3248–3264. [Google Scholar] [CrossRef]
- Tutino, V.; De Nunzio, V.; Milella, R.A.; Gasparro, M.; Cisternino, A.M.; Gigante, I.; Lanzilotta, E.; Iacovazzi, P.A.; Lippolis, A.; Lippolis, T.; et al. Impact of Fresh Table Grape Intake on Circulating microRNAs Levels in Healthy Subjects: A Significant Modulation of Gastrointestinal Cancer-Related Pathways. Mol. Nutr. Food Res. 2021, 65, 2100428. [Google Scholar] [CrossRef]
- Chung, M.; Ma, J.; Patel, K.; Berger, S.; Lau, J.; Lichtenstein, A.H. Fructose, high-fructose corn syrup, sucrose, and nonalcoholic fatty liver disease or indexes of liver health: A systematic review and meta-analysis. Am. J. Clin. Nutr. 2014, 100, 833–849. [Google Scholar] [CrossRef] [Green Version]
- Wijarnpreecha, K.; Thongprayoon, C.; Edmonds, P.; Cheungpasitporn, W. Associations of sugar and artificially sweetened soda with nonalcoholic fatty liver disease: A systematic review and meta-analysis. QJM Int. J. Med. 2016, 109, 461–466. [Google Scholar] [CrossRef]
- Asgari-Taee, F.; Zerafati-Shoae, N.; Dehghani, M.; Sadeghi, M.; Baradaran, H.R.; Jazayeri, S. Association of sugar sweetened beverages consumption with non-alcoholic fatty liver disease: A systematic review and meta-analysis. Eur. J. Nutr. 2019, 58, 1759–1769. [Google Scholar] [CrossRef]
- Kanerva, N.; Sandboge, S.; Kaartinen, N.E.; Männistö, S.; Eriksson, J.G. Higher fructose intake is inversely associated with risk of nonalcoholic fatty liver disease in older Finnish adults. Am. J. Clin. Nutr. 2014, 100, 1133–1138. [Google Scholar] [CrossRef] [Green Version]
- Sievenpiper, J.L.; Dworatzek, P.D. Food and Dietary Pattern-Based Recommendations: An Emerging Approach to Clinical Practice Guidelines for Nutrition Therapy in Diabetes. Can. J. Diabetes 2013, 37, 51–57. [Google Scholar] [CrossRef] [Green Version]
- Pearson, G.J.; Thanassoulis, G.; Anderson, T.J.; Barry, A.R.; Couture, P.; Dayan, N.; Wray, W. 2021 Canadian Cardiovascular Society Guidelines for the Management of Dyslipidemia for the Prevention of Cardiovascular Disease in Adults. Can. J. Cardiol. 2021, 37, 1129–1150. [Google Scholar] [CrossRef]
- Wharton, S.; Lau, D.C.; Vallis, M.; Sharma, A.M.; Biertho, L.; Campbell-Scherer, D.; Adamo, K.; Alberga, A.; Bell, R.; Boulé, N.; et al. Obesity in adults: A clinical practice guideline. Can. Med. Assoc. J. 2020, 192, E875–E891. [Google Scholar] [CrossRef]
- Sievenpiper, J.L.; Chan, C.B.; Dworatzek, P.D.; Freeze, C.; Williams, S.L. Nutrition Therapy. Can. J. Diabetes 2018, 42 (Suppl. 1), S64–S79. [Google Scholar] [CrossRef]
- Santesso, N.; Glenton, C.; Dahm, P.; Garner, P.; Akl, E.A.; Alper, B.; Brignardello-Petersen, R.; Carrasco-Labra, A.; De Beer, H.; Hultcrantz, M.; et al. GRADE guidelines 26: Informative statements to communicate the findings of systematic reviews of interventions. J. Clin. Epidemiol. 2019, 119, 126–135. [Google Scholar] [CrossRef] [PubMed] [Green Version]
- Balshem, H.; Helfand, M.; Schunemann, H.J.; Oxman, A.D.; Kunz, R.; Brozek, J.; Vist, G.E.; Falck-Ytter, Y.; Meerpohl, J.; Norris, S.; et al. GRADE guidelines: 3. Rating the quality of evidence. J. Clin. Epidemiol. 2011, 64, 401–406. [Google Scholar] [CrossRef] [PubMed]
- Wang, Y.F.; Chiavaroli, L.; Roke, K.; DiAngelo, C.; Marsden, S.; Sievenpiper, J. Canadian Adults with Moderate Intakes of Total Sugars have Greater Intakes of Fibre and Key Micronutrients: Results from the Canadian Community Health Survey 2015 Public Use Microdata File. Nutrients 2020, 12, 1124. [Google Scholar]


| Trial Characteristics | Substitution Trials | Addition Trials | Subtraction Trials | Ad Libitum Trials |
|---|---|---|---|---|
| Trial comparisons (n) | 35 | 39 | 4 | 2 |
| Participants (median n ((range)) | 29 (7–102) | 23 (6–91) | 12 (5–15) | 92 (92–92) |
| Health status (n trials) | NW = 5; MW = 7; OW/OB = 17; MetS = 1; NAFLD = 5 | NW = 9; MW = 9; OW/OB = 4; DM2 = 3; NAFLD = 1; Other = 5 | MW = 1; OW/OB = 3 | MW = 2 |
| Sex ratio (% male:female) b | 62:38 | 61:39 | 25:75 | 35:65 |
| Age (years; median (range)) b | 38 (7.7–59) | 36.2 (21.7–58.9) | 28.7 (28.3–29.1) | 29 (29–29) |
| Age category ratio (%; adult:children:mixed) b | 86:14:0 | 100:0:0 | 100:0:0 | 100:0:0 |
| Country (n trials) | 1 Brazil; 1 Denmark; 5 Finland; 2 Germany; 1 Greece; 2 Iran; 1 Sweden; 4 Switzerland; 7 UK; 8 USA; 1 Netherlands | 1 China; 8 Denmark; 1 Germany; 2 Iran; 4 Malaysia; 2 Netherlands; 1 Pakistan; 1 Sweden; 8 Switzerland; 1 UK; 2 USA | 2 Switzerland; 2 USA | 2 Finland |
| Setting ratio (%; inpatients:outpatients:inpatients/outpatients) | 9:88:3 | 8:87:5 | 50:50:0 | 0:100:0 |
| Baseline IHCL (% liver fat; median (range)) c | 5.7 (2.6–16.5) | 4.1 (1.6–9.7) | 2.9 (2.6–3.3) | NR |
| Baseline ALT (U/L; median (range)) d | 23 (5.2–116.6) | 25 (16.4–46.9) | 28.5 (21.6–39.7) | NR |
| Baseline AST (U/L; median (range)) e | 25 (7.9–68.8) | 26 (18–37) | 24.7 (21.6–27.9) | NR |
| Trial design ratio (%; crossover:parallel) | 37:62 | 56:44 | 50:50 | 0:100 |
| Feeding control ratio (%; met:sup:DA:met/sup) | 22:66:11:3 | 5:87:0:8 | 50:50:0:0 | 0:100:0:0 |
| Randomization ratio (%; yes:no:partial) f | 91:9:0 | 85:15:0 | 50:50:0 | 0:0:100 |
| Fructose-containing sugar dose (% of total energy intake; median (range)) | 20 (1–42) | 12.2 (1.2–35) | 16.3 (15–22.5) | 14.4 (14–14.7) |
| Follow-up duration (median n (range) of weeks) | 4 (1–52) | 1 (1–24) | 7 (1.7–12) | 88 (88–88) |
| Funding sources (%; A:I:A+I:NR) | 54:40:0:6 | 69:3:26:3 | 50:0:50:0 | 0:0:0:100 |
| Fructose-containing sugar type (n trials) | Fructose = 11; fruit = 8; HFCS = 2; sucrose = 14 | Fructose = 13; sucrose = 7; honey = 5; HFCS = 1; fruit = 13 | Sucrose = 4 | Fructose = 1; sucrose = 1 |
| Sugar regulatory designation (n trials) | Naturally occurring = 7; added = 18; mixed = 10 | Naturally occurring = 13; added = 26 | Added = 2; mixed = 2 | Mixed = 2 |
| Comparator (n trials) | NNS = 1; fat = 8; glucose = 12; lactose = 2; starch = 5; mixed comparator = 9 | NNS = 6; diet alone = 22; fat = 1; water = 3; other = 7 | NNS = 4 | NNS = 2 |
| Food sources of fructose-containing sugars (n trials) | SSB = 13; sweetened dairy alternative (soy) = 1; 100% fruit juice = 2; fruit = 2; dried fruit = 3; honey = 1; sweets and desserts = 3; mixed sources (with SSBs) = 10 | SSB = 20; 100% fruit juice = 7; fruit = 4; dried fruit = 2; honey = 5; sweets and desserts = 1 | SSB = 2; mixed sources (with SSBs) = 2 | Mixed sources (with SSBs) = 2 |
Publisher’s Note: MDPI stays neutral with regard to jurisdictional claims in published maps and institutional affiliations. |
© 2022 by the authors. Licensee MDPI, Basel, Switzerland. This article is an open access article distributed under the terms and conditions of the Creative Commons Attribution (CC BY) license (https://creativecommons.org/licenses/by/4.0/).
Share and Cite
Lee, D.; Chiavaroli, L.; Ayoub-Charette, S.; Khan, T.A.; Zurbau, A.; Au-Yeung, F.; Cheung, A.; Liu, Q.; Qi, X.; Ahmed, A.; et al. Important Food Sources of Fructose-Containing Sugars and Non-Alcoholic Fatty Liver Disease: A Systematic Review and Meta-Analysis of Controlled Trials. Nutrients 2022, 14, 2846. https://doi.org/10.3390/nu14142846
Lee D, Chiavaroli L, Ayoub-Charette S, Khan TA, Zurbau A, Au-Yeung F, Cheung A, Liu Q, Qi X, Ahmed A, et al. Important Food Sources of Fructose-Containing Sugars and Non-Alcoholic Fatty Liver Disease: A Systematic Review and Meta-Analysis of Controlled Trials. Nutrients. 2022; 14(14):2846. https://doi.org/10.3390/nu14142846
Chicago/Turabian StyleLee, Danielle, Laura Chiavaroli, Sabrina Ayoub-Charette, Tauseef A. Khan, Andreea Zurbau, Fei Au-Yeung, Annette Cheung, Qi Liu, Xinye Qi, Amna Ahmed, and et al. 2022. "Important Food Sources of Fructose-Containing Sugars and Non-Alcoholic Fatty Liver Disease: A Systematic Review and Meta-Analysis of Controlled Trials" Nutrients 14, no. 14: 2846. https://doi.org/10.3390/nu14142846
APA StyleLee, D., Chiavaroli, L., Ayoub-Charette, S., Khan, T. A., Zurbau, A., Au-Yeung, F., Cheung, A., Liu, Q., Qi, X., Ahmed, A., Choo, V. L., Blanco Mejia, S., Malik, V. S., El-Sohemy, A., de Souza, R. J., Wolever, T. M. S., Leiter, L. A., Kendall, C. W. C., Jenkins, D. J. A., & Sievenpiper, J. L. (2022). Important Food Sources of Fructose-Containing Sugars and Non-Alcoholic Fatty Liver Disease: A Systematic Review and Meta-Analysis of Controlled Trials. Nutrients, 14(14), 2846. https://doi.org/10.3390/nu14142846