
Impact of COVID-19 Lockdown on Non-Alcoholic Fatty Liver Disease and Insulin Resistance in Adults: A before and after Pandemic Lockdown Longitudinal Study

 , , ,
, , ,
Abstract
:1. Introduction
2. Materials and Methods
- −
- Aged between 18–69 years and an active worker;
- −
- Healthy without diseases that do not allow the medical check-up to be passed;
- −
- Belong to one of the companies collaborating in the study;
- −
- Agreement to participate.
- The metabolic score for insulin resistance (METS-IR), which is a mathematical approach to quantify hepatic sensitivity to insulin using fasting parameters [30].
- ⚬
- METS-IR = Ln [(2FPG) + TG] × BMI)/(Ln[HDLc]).
- The triglyceride glucose index (TyG), which is used for the presumptive diagnosis of insulin resistance [30].
- ⚬
- TyG = Ln [fasting TG (mg/dL) × FPG (mg/dL)/2].
- The triglyceride glucose index–body mass index, which is a useful marker for insulin resistance in non-diabetic individuals (TyG-BMI) [30].
- ⚬
- TyG-BMI = TyG × BMI.
- The triglyceride glucose index–waist to height ratio (TyG-WtHR) [30].
- ⚬
- TyG-WtHR = TyG × WtHR.
- Triglyceride glucose index–waist circumference (TyC-WC) [30].
- ⚬
- TyG-WC = TyG × WC.
- Lipid accumulation product (LAP) [30].
- ⚬
- Men: LAP = (waist circumference (cm) − 65) × (triglyceride concentration (mMol)).
- ⚬
- Women: LAP = (waist circumference (cm) − 58) × (triglyceride concentration (mMol)).
- Fatty liver index (FLI) [30].
- ⚬
- FLI = (log (triglycerides) × 100.953 + 0.139 × BMI + 0.71 × log (ggt) + 0.053 × waist circumference − 15.745)/(1 + log (triglycerides) × 100.953 + 0.139 × BMI + 0.718 × log (ggt) + 0.053 × waist circumference − 15.745) × 100.
- Hepatic steatosis index (HSI) [30].
- ⚬
- HSI = 8 × ALT/AST + BMI (+ 2 if type 2 diabetes yes, + 2 if female).
2.1. Statistical Analysis
2.2. Ethical Considerations and Aspects
3. Results
4. Discussion
5. Conclusions
Author Contributions
Funding
Institutional Review Board Statement
Informed Consent Statement
Data Availability Statement
Conflicts of Interest
References
- Cobbina, E.; Akhlaghi, F. Non-alcoholic fatty liver disease (NAFLD)—Pathogenesis, classification, and effect on drug metabolizing enzymes and transporters. Drug Metab. Rev. 2017, 49, 197–211. [Google Scholar] [CrossRef] [PubMed]
- Younossi, Z.; Anstee, Q.M.; Marietti, M.; Hardy, T.; Henry, L.; Eslam, M.; George, J.; Bugianesi, E. Global burden of NAFLD and NASH: Trends, predictions, risk factors and prevention. Nat. Rev. Gastroenterol. Hepatol. 2017, 15, 11–20. [Google Scholar] [CrossRef] [PubMed]
- Wolfs, M.G.M.; Gruben, N.; Rensen, S.S.; Verdam, F.; Greve, J.W.; Driessen, A.; Wijmenga, C.; A Buurman, W.; Franke, L.; Scheja, L.; et al. Determining the association between adipokine expression in multiple tissues and phenotypic features of non-alcoholic fatty liver disease in obesity. Nutr. Diabetes 2015, 5, e146. [Google Scholar] [CrossRef] [PubMed]
- Makri, E.; Goulas, A.; Polyzos, S.A. Epidemiology, Pathogenesis, Diagnosis and Emerging Treatment of Nonalcoholic Fatty Liver Disease. Arch. Med. Res. 2021, 52, 25–37. [Google Scholar] [CrossRef] [PubMed]
- Stefan, N.; Häring, H.-U.; Cusi, K. Non-alcoholic fatty liver disease: Causes, diagnosis, cardiometabolic consequences, and treatment strategies. Lancet Diabetes Endocrinol. 2019, 7, 313–324. [Google Scholar] [CrossRef]
- Rhee, E.-J. The Influence of Obesity and Metabolic Health on Vascular Health. Endocrinol. Metab. 2022, 37, 1–8. [Google Scholar] [CrossRef]
- Eslam, M.; Newsome, P.N.; Sarin, S.K.; Anstee, Q.M.; Targher, G.; Romero-Gomez, M.; Zelber-Sagi, S.; Wong, V.W.-S.; Dufour, J.-F.; Schattenberg, J.M.; et al. A new definition for metabolic dysfunction-associated fatty liver disease: An international expert consensus statement. J. Hepatol. 2020, 73, 202–209. [Google Scholar] [CrossRef]
- Laird, L.; Fernández, C.N.; Gil Llinás, M.; Casquero, R.G.; González, I.d.R.C. Influence of sociodemographic variables and tobacco consumption on the risk of nonalcoholic fatty liver disease and liver fibrosis. Med. Balear. 2021, 36, 34–39. [Google Scholar] [CrossRef]
- Powell, E.E.; Wong, V.W.; Rinella, M. Non-alcoholic fatty liver disease. Lancet 2021, 397, 2212–2224. [Google Scholar] [CrossRef]
- Eslam, M.; Sanyal, A.J.; George, J.; on behalf of the International Consensus Panel. MAFLD: A Consensus-Driven Proposed Nomenclature for Metabolic Associated Fatty Liver Disease. Gastroenterology 2020, 158, 1999–2014.e1. [Google Scholar] [CrossRef]
- Wong, R.J.; Cheung, R.; Ahmed, A. Nonalcoholic steatohepatitis is the most rapidly growing indication for liver transplantation in patients with hepatocellular carcinoma in the U.S. Hepatology 2014, 59, 2188–2195. [Google Scholar] [CrossRef] [PubMed]
- Paik, J.M.; Golabi, P.; Younossi, Y.; Mishra, A.; Younossi, Z.M. Changes in the Global Burden of Chronic Liver Diseases From 2012 to 2017: The Growing Impact of NAFLD. Hepatology 2020, 72, 1605–1616. [Google Scholar] [CrossRef] [PubMed]
- Estes, C.; Razavi, H.; Loomba, R.; Younossi, Z.; Sanyal, A.J. Modeling the epidemic of nonalcoholic fatty liver disease demonstrates an exponential increase in burden of disease. Hepatology 2018, 67, 123–133. [Google Scholar] [CrossRef] [PubMed]
- Portincasa, P.; Krawczyk, M.; Smyk, W.; Lammert, F.; Di Ciaula, A. COVID-19 and non-alcoholic fatty liver disease: Two intersecting pandemics. Eur. J. Clin. Investig. 2020, 50, e13338. [Google Scholar] [CrossRef] [PubMed]
- Wuhan Seafood Market Pneumonia Virus Isolate Wuhan-Hu-1, Complete Genome. 23 January 2020. Available online: http://www.ncbi.nlm.nih.gov/nuccore/MN908947.3 (accessed on 14 February 2022).
- Huang, C.; Wang, Y.; Li, X.; Ren, L.; Zhao, J.; Hu, Y.; Zhang, L.; Fan, G.; Xu, J.; Gu, X.; et al. Clinical features of patients infected with 2019 novel coronavirus in Wuhan, China. Lancet 2020, 395, 497–506. [Google Scholar] [CrossRef] [Green Version]
- Unnikrishnan, R.; Misra, A. Diabetes and COVID19: A bidirectional relationship. Nutr. Diabetes 2021, 11, 21. [Google Scholar] [CrossRef]
- Koh, D. COVID-19 lockdowns throughout the world. Occup. Med. 2020, 70, 322. [Google Scholar] [CrossRef]
- Real Decreto 463/2020, de 14 de Marzo, por el que se Declara el Estado de Alarma para la Gestión de la Situación de Crisis Sanitaria Ocasionada Por el COVID-19. Available online: https://www.boe.es/buscar/doc.php?id=BOE-A-2020-3692 (accessed on 10 February 2021).
- Hew-Butler, T.; Smith-Hale, V.; Van Sumeren, M.; Sabourin, J.; Levy, P. Is Exercise the Best Medicine during a COVID-19 Pandemic? Comment on Constandt, B.; Thibaut, E.; De Bosscher, V.; Scheerder, J.; Ricour, M.; Willem, A. Exercising in Times of Lockdown: An Analysis of the Impact of COVID-19 on Levels and Patterns of Exercise among Adults in Belgium. Int. J. Environ. Res. Public Health 2020, 17, 4144. Int. J. Environ. Res. Public Health 2020, 17, 5730. [Google Scholar]
- Paltrinieri, S.; Bressi, B.; Costi, S.; Mazzini, E.; Cavuto, S.; Ottone, M.; De Panfilis, L.; Fugazzaro, S.; Rondini, E.; Rossi, P.G. Beyond Lockdown: The potential side effects of the SARS-CoV-2 pandemic on public health. Nutrients 2021, 13, 1600. [Google Scholar] [CrossRef]
- Manz, K.; Mensink, G.B.M.; Finger, J.D.; Haftenberger, M.; Brettschneider, A.-K.; Barbosa, C.L.; Krug, S.; Schienkiewitz, A. Associations between Physical Activity and Food Intake among Children and Adolescents: Results of KiGGS Wave 2. Nutrients 2019, 11, 1060. [Google Scholar] [CrossRef] [Green Version]
- Skotnicka, M.; Karwowska, K.; Kłobukowski, F.; Wasilewska, E.; Małgorzewicz, S. Dietary Habits before and during the COVID-19 Epidemic in Selected European Countries. Nutrients 2021, 13, 1690. [Google Scholar] [CrossRef] [PubMed]
- Rodríguez-Pérez, C.; Molina-Montes, E.; Verardo, V.; Artacho, R.; García-Villanova, B.; Guerra-Hernández, E.J.; Ruíz-López, M.D. Changes in Dietary Behaviours during the COVID-19 Outbreak Confinement in the Spanish COVIDiet Study. Nutrients 2020, 12, 1730. [Google Scholar] [CrossRef] [PubMed]
- Fernandez-Rio, J.; Cecchini, J.A.; Mendez-Gimenez, A.; Carriedo, A. Weight changes during the COVID-19 home confinement. Effects on psychosocial variables. Obes. Res. Clin. Pract. 2020, 14, 383–385. [Google Scholar] [CrossRef]
- Kriaucioniene, V.; Bagdonaviciene, L.; Rodríguez-Pérez, C.; Petkeviciene, J. Associations between Changes in Health Behav-iours and Body Weight during the COVID-19 Quarantine in Lithuania: The Lithuanian COVIDiet Study. Nutrients 2020, 12, 3119. [Google Scholar] [CrossRef] [PubMed]
- Ammar, A.; Brach, M.; Trabelsi, K.; Chtourou, H.; Boukhris, O.; Masmoudi, L.; Bouaziz, B.; Bentlage, E.; How, D.; Ahmed, M.; et al. Effects of COVID-19 Home Confinement on Eating Behaviour and Physical Activity: Results of the ECLB-COVID19 International Online Survey. Nutrients 2020, 12, 1583. [Google Scholar] [CrossRef] [PubMed]
- Singu, S.; Acharya, A.; Challagundla, K.; Byrareddy, S.N. Impact of Social Determinants of Health on the Emerging COVID-19. Pandemic in the United States. Front. Public Health 2020, 8, 406. [Google Scholar] [CrossRef]
- López-González, A.; Manent, J.R.; Vicente-Herrero, M.; Ruiz, E.G.; Blanco, M.A.; Safont, N.L. Prevalence of diabesity in the Spanish working population: Influence of sociodemographic variables and tobacco consumption. An. Sist. Sanit. Navar. 2022, 45, e0977. [Google Scholar] [CrossRef]
- Mohebbi, V.; Aramayo, A.; Morales, J. Determination of scales related to cardiovascular risk and fatty liver in 5.370 spanish farmers. Med. Balear. 2021, 36, 26–33. [Google Scholar] [CrossRef]
- Lee, P.H.; Macfarlane, D.J.; Lam, T.H.; Stewart, S.M. Validity of the international physical activity questionnaire short form (IPAQ-SF): A systematic review. Int. J. Behav. Nutr. Phys. Act. 2011, 8, 115. [Google Scholar] [CrossRef] [Green Version]
- Saklayen, M.G. The Global Epidemic of the Metabolic Syndrome. Curr. Hypertens. Rep. 2018, 20, 12. [Google Scholar] [CrossRef] [Green Version]
- Shanmugam, H.; Di Ciaula, A.; Di Palo, D.M.; Molina-Molina, E.; Garruti, G.; Faienza, M.F.; Vanerpecum, K.; Portincasa, P. Multiplying effects of COVID-19 lockdown on metabolic risk and fatty liver. Eur. J. Clin. Investig. 2021, 51, e13597. [Google Scholar] [CrossRef] [PubMed]
- Cicero, A.F.G.; Fogacci, F.; Giovannini, M.; Mezzadri, M.; Grandi, E.; Borghi, C. The Brisighella Heart Study Group. COVID-19-Related Quarantine Effect on Dietary Habits in a Northern Italian Rural Population: Data from the Brisighella Heart Study. Nutrients 2021, 13, 309. [Google Scholar] [CrossRef]
- Ab Khan, M.; Menon, P.; Govender, R.; Abu Samra, A.M.; Allaham, K.K.; Nauman, J.; Östlundh, L.; Mustafa, H.; Smith, J.E.; Al Kaabi, J.M. Systematic review of the effects of pandemic confinements on body weight and their determinants. Br. J. Nutr. 2022, 127, 298–317. [Google Scholar] [CrossRef] [PubMed]
- Lima-Martínez, M.M.; Boada, C.C.; Madera-Silva, M.D.; Marín, W.; Contreras, M. COVID-19 and diabetes: A bidirectional relationship. Clín. Investig. Arterioscler. 2021, 33, 151–157. [Google Scholar] [CrossRef] [PubMed]
- Beran, D.; Perone, S.A.; Perolini, M.C.; Chappuis, F.; Chopard, P.; Haller, D.M.; Bausch, F.J.; Maisonneuve, H.; Perone, N.; Gastaldi, G. Beyond the virus: Ensuring continuity of care for people with diabetes during COVID-19. Prim. Care Diabetes 2021, 15, 16–17. [Google Scholar] [CrossRef]
- Martínez-Quintana, E.; Vega-Acedo, L.D.C.; Santana-Herrera, D.; Pérez-Acosta, C.; Medina-Gil, J.M.; Muñoz-Díaz, E.; Rodríguez-González, F. Mental well-being among patients with congenital heart disease and heart failure during the COVID-19 pandemic. Am. J. Cardiovasc. Dis. 2021, 11, 618–623. [Google Scholar] [PubMed]
- Sohn, M.; Koo, B.K.; Yoon, H.I.; Song, K.-H.; Kim, E.S.; Bin Kim, H.; Lim, S. Impact of COVID-19 and Associated Preventive Measures on Cardiometabolic Risk Factors in South Korea. J. Obes. Metab. Syndr. 2021, 30, 248–260. [Google Scholar] [CrossRef]
- Kaufman-Shriqui, V.; Navarro, D.A.; Raz, O.; Boaz, M. Multinational dietary changes and anxiety during the coronavirus pandemic-findings from Israel. Isr. J. Health Policy Res. 2021, 10, 28. [Google Scholar] [CrossRef]
- Ahmed, M.; Ahmed, M.H. Nonalcoholic fatty liver disease and COVID-19: An epidemic that begets pandemic. World J. Clin. Cases 2021, 9, 4133–4142. [Google Scholar] [CrossRef]
- Jontez, N.B.; Novak, K.; Kenig, S.; Petelin, A.; Pražnikar, Z.J.; Mohorko, N. The Impact of COVID-19-Related Lockdown on Diet and Serum Markers in Healthy Adults. Nutrients 2021, 13, 1082. [Google Scholar] [CrossRef]
- O’Gorman, P.; Norris, S. Exercising in the COVID-19 era: Implications in non-alcoholic fatty liver disease (NAFLD). BMJ Open Gastroenterol. 2021, 8, e000568. [Google Scholar] [CrossRef] [PubMed]
- Jung, I.; Koo, D.-J.; Lee, M.Y.; Moon, S.J.; Kwon, H.; Park, S.E.; Rhee, E.-J.; Lee, W.-Y. Increased Risk of Nonalcoholic Fatty Liver Disease in Individuals with High Weight Variability. Endocrinol. Metab. 2021, 36, 845–854. [Google Scholar] [CrossRef]
- Targher, G.; Corey, K.E.; Byrne, C.D. NAFLD, and cardiovascular and cardiac diseases: Factors influencing risk, prediction and treatment. Diabetes Metab. 2021, 47, 101215. [Google Scholar] [CrossRef] [PubMed]
- Lai, J.; Wang, H.L.; Zhang, X.; Wang, H.; Liu, X. Pathologic Diagnosis of Nonalcoholic Fatty Liver Disease. Arch. Pathol. Lab. Med. 2021, 1–7. [Google Scholar] [CrossRef] [PubMed]
- Gurka, M.J.; Filipp, S.L.; DeBoer, M.D. Geographical variation in the prevalence of obesity, metabolic syndrome, and diabetes among US adults. Nutr. Diabetes 2018, 8, 14. [Google Scholar] [CrossRef] [PubMed] [Green Version]
- Jahangiry, L.; Montazeri, A.; Najafi, M.; Yaseri, M.; A Farhangi, M. An interactive web-based intervention on nutritional status, physical activity and health-related quality of life in patient with metabolic syndrome: A randomized-controlled trial (The Red Ruby Study). Nutr. Diabetes 2017, 7, e240. [Google Scholar] [CrossRef] [PubMed] [Green Version]
- Rhee, E.-J. Nonalcoholic Fatty Liver Disease and Diabetes: An Epidemiological Perspective. Endocrinol. Metab. 2019, 34, 226–233. [Google Scholar] [CrossRef] [PubMed]
- Zhao, L.; Zou, T.; Gomez, N.A.; Wang, B.; Zhu, M.-J.; Du, M. Raspberry alleviates obesity-induced inflammation and insulin resistance in skeletal muscle through activation of AMP-activated protein kinase (AMPK) α1. Nutr. Diabetes 2018, 8, 39. [Google Scholar] [CrossRef] [PubMed]
- Hill, M.A.; Yang, Y.; Zhang, L.; Sun, Z.; Jia, G.; Parrish, A.R.; Sowers, J.R. Insulin resistance, cardiovascular stiffening and cardiovascular disease. Metabolism 2021, 119, 154766. [Google Scholar] [CrossRef] [PubMed]
- Koo, D.-J.; Lee, M.Y.; Jung, I.; Moon, S.J.; Kwon, H.; Park, S.E.; Rhee, E.-J.; Lee, W.-Y. Changes in Insulin Resistance Index and the Risk of Liver Fibrosis in Patients with Nonalcoholic Fatty Liver Disease without Diabetes: Kangbuk Samsung Health Study. Endocrinol. Metab. 2021, 36, 1016–1028. [Google Scholar] [CrossRef]
- Chaiyasoot, K.; Sarasak, R.; Pheungruang, B.; Dawilai, S.; Pramyothin, P.; Boonyasiri, A.; Supapueng, O.; Jassil, F.C.; Yamwong, P.; Batterham, R.L. Evaluation of a 12-week lifestyle education intervention with or without partial meal replacement in Thai adults with obesity and metabolic syndrome: A randomised trial. Nutr. Diabetes 2018, 8, 23. [Google Scholar] [CrossRef] [PubMed] [Green Version]
- Landstra, C.P.; de Koning, E. COVID-19 and Diabetes: Understanding the Interrelationship and Risks for a Severe Course. Front. Endocrinol. 2021, 12, 649525. [Google Scholar] [CrossRef] [PubMed]
- Martinez-Ferran, M.; De La Guía-Galipienso, F.; Sanchis-Gomar, F.; Pareja-Galeano, H. Metabolic Impacts of Confinement during the COVID-19 Pandemic Due to Modified Diet and Physical Activity Habits. Nutrients 2020, 12, 1549. [Google Scholar] [CrossRef] [PubMed]
- Pal, R.; Bhadada, S.K. COVID-19 and diabetes mellitus: An unholy interaction of two pandemics. Diabetes Metab. Syndr. Clin. Res. Rev. 2020, 14, 513–517. [Google Scholar] [CrossRef]
- Govender, N.; Khaliq, O.P.; Moodley, J.; Naicker, T. Insulin resistance in COVID-19 and diabetes. Prim. Care Diabetes 2021, 15, 629–634. [Google Scholar] [CrossRef]
- Stefan, N.; Birkenfeld, A.L.; Schulze, M.B.; Ludwig, D. Obesity and impaired metabolic health in patients with COVID-19. Nat. Rev. Endocrinol. 2020, 16, 341–342. [Google Scholar] [CrossRef] [Green Version]
- Cinque, F.; Cespiati, A.; Lombardi, R.; Costantino, A.; Maffi, G.; Alletto, F.; Colavolpe, L.; Francione, P.; Oberti, G.; Fatta, E.; et al. Interaction between Lifestyle Changes and PNPLA3 Genotype in NAFLD Patients during the COVID-19 Lockdown. Nutrients 2022, 14, 556. [Google Scholar] [CrossRef]
- Sachdeva, S.; Khandait, H.; Kopel, J.; Aloysius, M.M.; Desai, R.; Goyal, H. NAFLD and COVID-19: A Pooled Analysis. SN Compr. Clin. Med. 2020, 2, 2726–2729. [Google Scholar] [CrossRef]
- Ghoneim, S.; Butt, M.U.; Hamid, O.; Shah, A.; Asaad, I. The incidence of COVID-19 in patients with metabolic syndrome and non-alcoholic steatohepatitis: A population-based study. Metab. Open 2020, 8, 100057. [Google Scholar] [CrossRef]
- Calder, P.C. Nutrition and immunity: Lessons for COVID-19. Nutr. Diabetes 2021, 11, 19. [Google Scholar] [CrossRef]
- Dhurandhar, N.V.; Akheruzzaman; Hegde, V. Potentially modifiable factors to reduce severity of COVID-19 in type 2 diabetes. Nutr. Diabetes 2020, 10, 30. [Google Scholar] [CrossRef] [PubMed]
- Simon, T.G.; Hagström, H.; Sharma, R.; Söderling, J.; Roelstraete, B.; Larsson, E.; Ludvigsson, J.F. Risk of severe COVID-19 and mortality in patients with established chronic liver disease: A nationwide matched cohort study. BMC Gastroenterol. 2021, 21, 439. [Google Scholar] [CrossRef] [PubMed]
- Yoo, H.W.; Jin, H.Y.; Yon, D.K.; Effenberger, M.; Shin, Y.H.; Kim, S.Y.; Yang, J.M.; Kim, M.S.; Koyanagi, A.; Jacob, L.; et al. Non-alcoholic Fatty Liver Disease and COVID-19 Susceptibility and Outcomes: A Korean Nationwide Cohort. J. Korean Med. Sci. 2021, 36, e291. [Google Scholar] [CrossRef] [PubMed]
- Vranić, L.; Radovan, A.; Poropat, G.; Mikolašević, I.; Milić, S. Non-Alcoholic Fatty Liver Disease and COVID-19–Two Pandemics Hitting at the Same Time. Medicina 2021, 57, 1057. [Google Scholar] [CrossRef]
- Herta, T.; Berg, T. COVID-19 and the liver—Lessons learned. Liver Int. 2021, 41 (Suppl. 1), 1–8. [Google Scholar] [CrossRef]
- Bhutani, S.; Vandellen, M.; Cooper, J. Longitudinal Weight Gain and Related Risk Behaviors during the COVID-19 Pandemic in Adults in the US. Nutrients 2021, 13, 671. [Google Scholar] [CrossRef]
- Ji, W.; Lee, R.; Huh, K.; Kang, M.; Hwang, I.C.; Radnaabaatar, M.; Lee, D.H.; Jung, J. Overweight and Obesity are Risk Factors for Coronavirus Disease 2019: A Propensity Score-Matched Case-Control Study. Endocrinol. Metab. 2021, 36, 196–200. [Google Scholar] [CrossRef]
- Sharma, P.; Kumar, A. Metabolic dysfunction associated fatty liver disease increases risk of severe COVID-19. Diabetes Metab. Syndr. Clin. Res. Rev. 2020, 14, 825–827. [Google Scholar] [CrossRef]
- Steenblock, C.; Schwarz, P.E.H.; Ludwig, B.; Linkermann, A.; Zimmet, P.; Kulebyakin, K.; Tkachuk, V.A.; Markov, A.G.; Lehnert, H.; de Angelis, M.H.; et al. COVID-19 and metabolic disease: Mechanisms and clinical management. Lancet Diabetes Endocrinol. 2021, 9, 786–798. [Google Scholar] [CrossRef]
- Myers, J.; Kokkinos, P.; Nyelin, E. Physical Activity, Cardiorespiratory Fitness, and the Metabolic Syndrome. Nutrients 2019, 11, 1652. [Google Scholar] [CrossRef] [Green Version]
- De Rubies, V.; Lee, J.; Saqib Anwer, M.; Yoshida-Montezuma, Y.; Andreacchi, A.; Stone, E.; Iftikhar, S.; Morgenstern, J.D.; Rebinsky, R.; Neil-Sztramko, S.E.; et al. Impact of disasters, including pandemics, on cardiometabolic outcomes across the life course: A systematic review. BMJ Open 2021, 11, e047152. [Google Scholar] [CrossRef] [PubMed]
- Cabanillas, B.; Valdelvira, R.; Akdis, C.A. Monkeypox outbreak in Europe, UK, North America, and Australia: A changing trend of a zoonotic disease. In Allergy; John Wiley & Sons, Inc.: Hoboken, NJ, USA, 2022. [Google Scholar] [CrossRef]

| N = 6236 | 2018 | 2019 | 2020 | |
|---|---|---|---|---|
| Mean ± SD | Mean ± SD | Mean ± SD | p-Value | |
| Age (years) | 41.1 ± 9.9 | 42.1 ± 9.9 | 43.1 ± 9.9 | <0.001 |
| Weight (kg) | 71.7 ± 16.3 | 72.2 ± 16.4 | 73.8 ± 16.5 | <0.001 |
| BMI (kg/m2) | 25.1 ± 4.7 | 25.3 ± 4.7 | 25.9 ± 4.7 | <0.001 |
| Waist circumference (cm) | 82.8 ± 14.0 | 84.6 ± 14.1 | 87.6 ± 14.1 | <0.001 |
| Hip circumference (cm) | 98.7 ± 9.4 | 99.8 ± 9.4 | 101.5 ± 9.5 | <0.001 |
| Waist to Height ratio | 0.49 ± 0.08 | 0.50 ± 0.08 | 0.52 ± 0.08 | <0.001 |
| Waist to Hip ratio | 0.84 ± 0.10 | 0.85 ± 0.09 | 0.86 ± 0.09 | <0.001 |
| Body fat (%) | 24.5 ± 9.1 | 25.3 ± 8.7 | 26.9 ± 8.8 | <0.001 |
| SBP (mmHg) | 120.0 ± 16.8 | 121.3 ± 16.3 | 124.6 ± 16.3 | <0.001 |
| DBP (mmHg) | 76.9 ± 10.7 | 78.2 ± 10.5 | 82.8 ± 10.6 | <0.001 |
| Glycemia (mg/dL) | 90.5 ± 16.4 | 91.9 ± 15.7 | 95.4 ± 15.8 | <0.001 |
| Total cholesterol (mg/dL) | 190.7 ± 37.3 | 194.3 ± 35.3 | 202.8 ± 35.7 | <0.001 |
| HDL-c (mg/dL) | 53.9 ± 13.7 | 53.1 ± 13.4 | 50.7 ± 13.7 | <0.001 |
| LDL-c (mg/dL) | 117.4 ± 40.3 | 121.4 ± 38.5 | 131.0 ± 39.0 | <0.001 |
| Triglycerides (mg/dL) | 96.8 ± 79.2 | 98.7 ± 78.5 | 105.8 ± 78.9 | <0.001 |
| ALT (U/L) | 24.1 ± 28.5 | 25.7 ± 28.7 | 28.4 ± 28.7 | <0.001 |
| AST (U/L) | 21.7 ± 15.5 | 22.7 ± 15.6 | 24.0 ± 15.7 | <0.001 |
| GGT (U/L) | 25.8 ± 27.4 | 26.8 ± 27.4 | 28.9 ± 27.4 | <0.001 |
| N (%) | N (%) | N (%) | p-value | |
| Women | 3236 (51.9) | 3236 (51.9) | 3236 (51.9) | |
| Men | 3000 (48.1) | 3000 (48.1) | 3000 (48.1) | |
| Smokers | 1176 (18.9) | 1202 (19.3) | 1302 (20.9) | <0.001 |
| Physical exercise | 2732 (43.8) | 2600 (41.7) | 2044 (32.8) | <0.001 |
| Social class I | 3664 (58.8) | 3664 (58.8) | 3664 (58.8) | |
| Social class II | 812 (13.0) | 812 (13.0) | 812 (13.0) | |
| Social class III | 1760 (28.2) | 1760 (28.2) | 1760 (28.2) | |
| Obesity | 846 (13.6) | 860 (13.8) | 1007 (16.1) | <0.001 |
| Diabetes type 2 | 86 (1.4) | 100 (1.6) | 140 (2.2) | <0.001 |
| Dyslipidemia | 2361 (37.9) | 2470 (39.6) | 3234 (51.9) | <0.001 |
| Metabolic Syndrome | 463 (7.4) | 865 (13.9) | 1304 (20.9) | <0.001 |
| 2018 | 2019 | 2020 | Difference 2018–2019 | Difference 2019–2020 | |||
|---|---|---|---|---|---|---|---|
| Mean ± SD | Mean ± SD | Mean ± SD | p-Value | Value (%) | Value (%) | p-Value | |
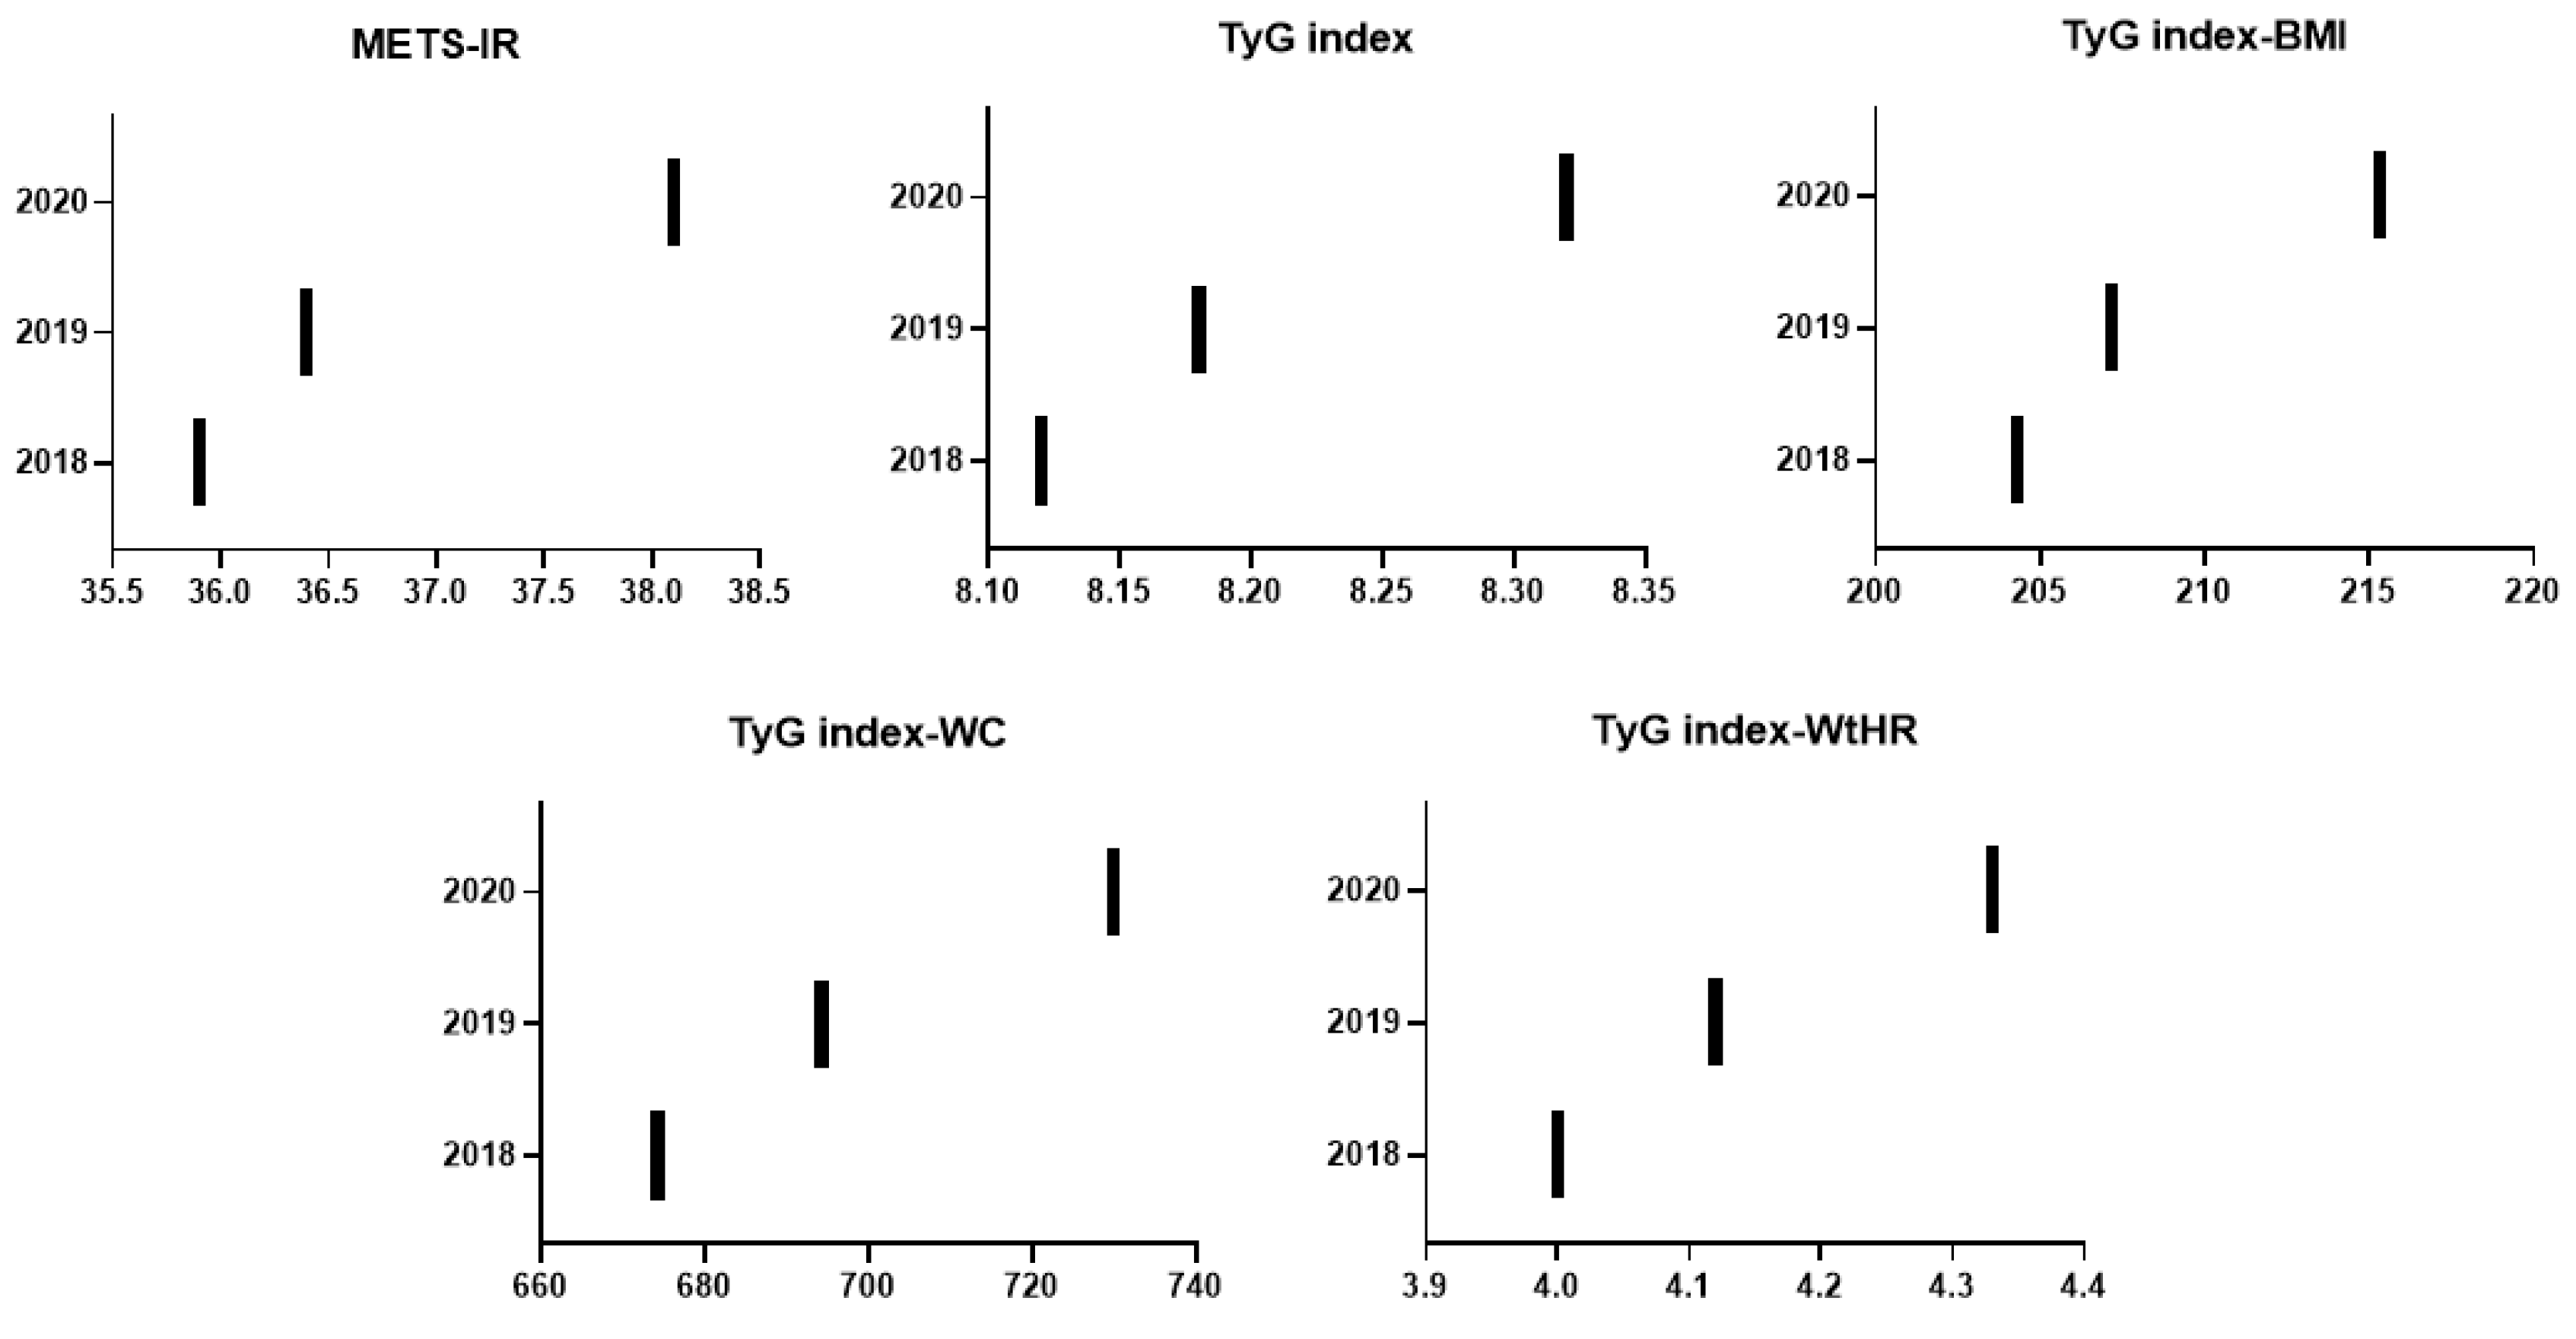
| METS-IR | 35.9 ± (8.6) | 36.4 ± (8.7) | 38.1 ± 9.1 | <0.0001 | 0.49 (1.36) | 1.71 (4.71) | <0.0001 |
| TyG index | 8.1 ± 0.7 | 8.2 ± 0.7 | 8.3 ± 0.6 | <0.0001 | 0.06 (0.77) | 0.13 (1.63) | <0.0001 |
| TyG index-BMI | 204.3 ± 44.0 | 207.2 ± 43.7 | 215.3 ± 44.2 | <0.0001 | 2.88 (1.41) | 8.09 (3.9) | <0.0001 |
| TyG index-Waist circumference | 674.2 ± 137.1 | 694.3 ± 137.6 | 729.9 ± 137.6 | <0.0001 | 20.12 (2.98) | 35.57 (5.12) | <0.0001 |
| TyG index-Waist to height ratio | 4.0 ± 0.8 | 4.1 ± 0.8 | 4.3 ± 0.8 | <0.0001 | 0.12 (2.97) | 0.21 (5.4) | <0.0001 |
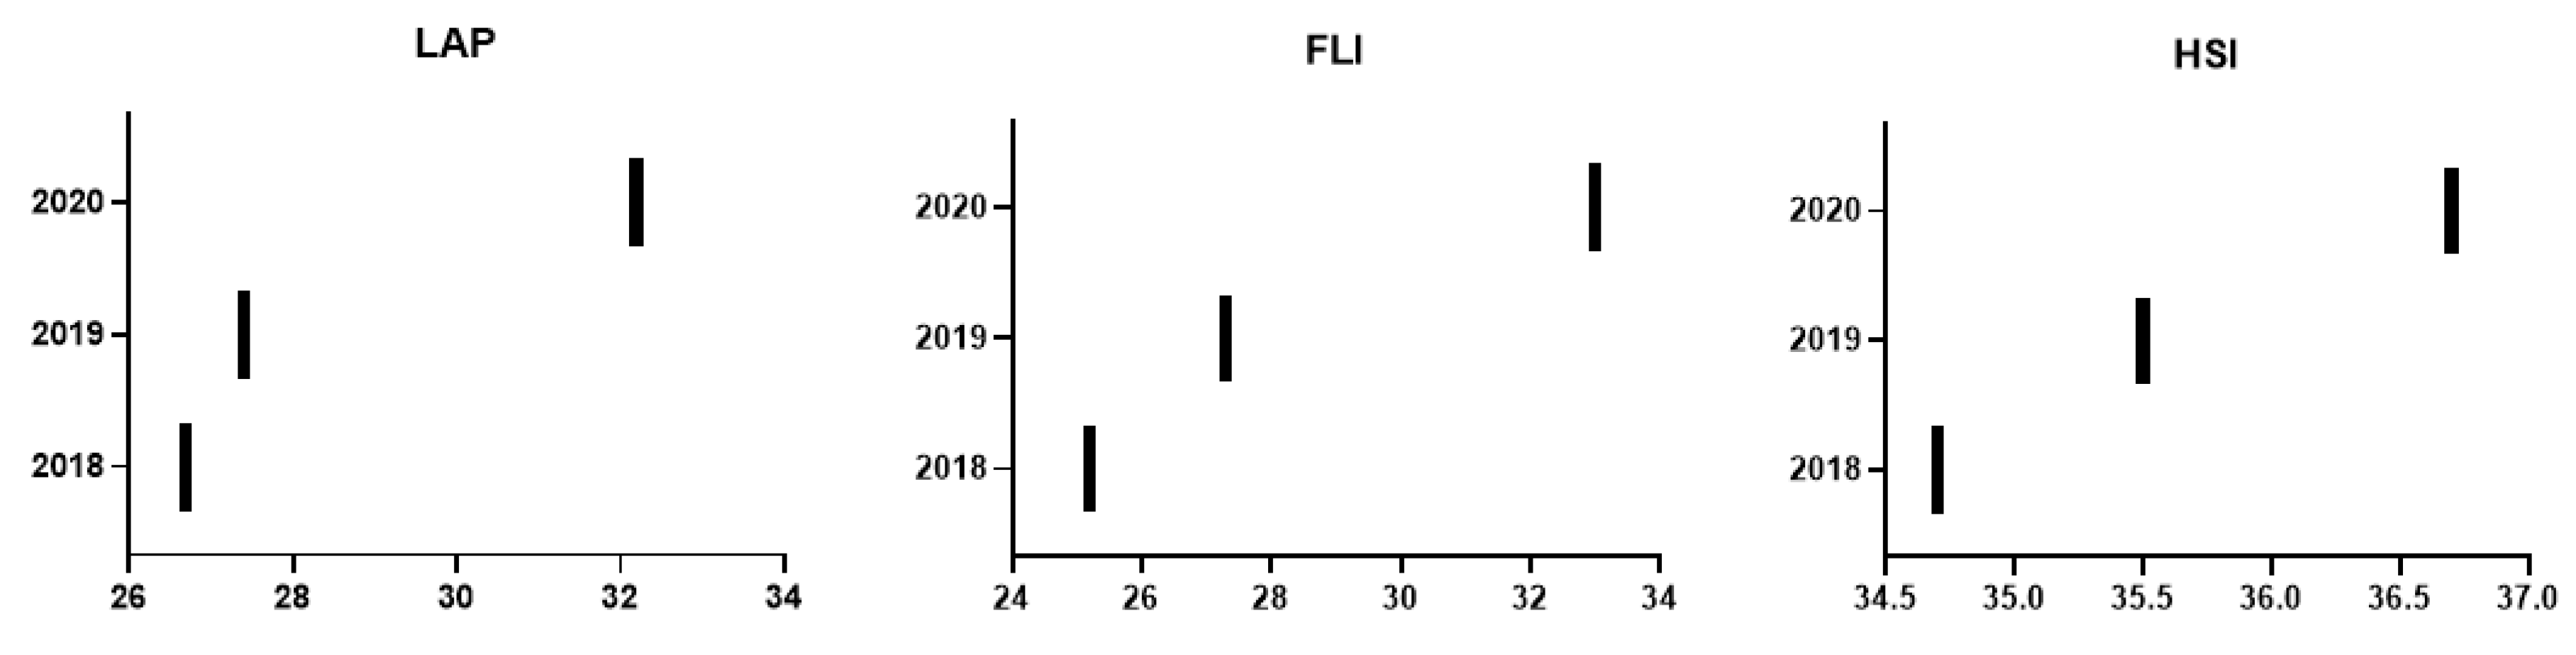
| Lipid accumulation product | 26.7 ± 28.5 | 27.4 ± 30.0 | 32.2 ± 32.8 | <0.0001 | 2.05 (8,30) | 5.45 (20.40) | <0.0001 |
| Fatty liver index | 25.2 ± 25.9 | 27.3 ± 26.8 | 33.0 ± 27.9 | <0.0001 | 2.09 (8.30) | 5.70 (20.89) | <0.0001 |
| Hepatic steatosis index | 34.7 ± 6.3 | 35.5 ± 6.2 | 36.7 ± 6.4 | <0.0001 | 0.84 (2.43) | 1.16 (3.27) | <0.0001 |
| Year 2018 | Year 2019 | Year 2020 | Difference 2018–2019 | Difference 2019–2020 | |||
|---|---|---|---|---|---|---|---|
| Non diabetic | n (%) | n (%) | n (%) | p-value | value (%) | value (%) | p-value |
| METS-IR high | 418 (6.8) | 440 (7.2) | 627 (10.3) | <0.0001 | 0.4 (5.9) | 3.1 (43.5) | <0.0001 |
| TyG index high | 1240 (20.2) | 1292 (21.1) | 1512 (24.8) | <0.0001 | 0.9 (4.5) | 3.7 (17.5) | <0.0001 |
| Lipid accumulation product high | 1376 (22.4) | 1499 (24.6) | 1974 (32.4) | <0.0001 | 2.2 (9.8) | 7.8 (31.7) | <0.0001 |
| Fatty liver index high | 796 (12.9) | 900 (14.7) | 1169 (19.2) | <0.0001 | 1.8 (14.0) | 4.5 (30.6) | <0.0001 |
| Hepatic steatosis index high | 1933 (31.4) | 1998 (32.6) | 2198 (36.1) | <0.0001 | 1.2 (3.8) | 3.5 (10.7) | <0.0001 |
| Diabetic | |||||||
| METS-IR high | 39 (45.3) | 46 (46.0) | 70 (50.0) | <0.0001 | 0.7 (1.5) | 4.0 (8.7) | <0.0001 |
| TyG index high | 41 (47.7) | 48 (48.0) | 70 (50.0) | <0.0001 | 0.3 (0.6) | 2.0 (1.2) | <0.0001 |
| Lipid accumulation product high | 36 (47.9) | 49 (49.0) | 74 (52.9) | <0.0001 | 1.1 (2.3) | 3.9 (8.0) | <0.0001 |
| Fatty liver index high | 49 (57.0) | 57 (57.0) | 82 (58.6) | <0.0001 | 0.0 (0.0) | 1.6 (2.8) | <0.0001 |
| Hepatic steatosis index high | 75 (87.2) | 90 (90.0) | 132 (94.3) | <0.0001 | 2.8 (3.2) | 4.3 (4.8) | <0.0001 |
| LAP | FLI | HSI | |
|---|---|---|---|
| METS-IR | 0.588 | 0.861 | 0.879 |
| TyG INDEX | 0.653 | 0.439 | 0.092 |
| TyG index BMI | 0.685 | 0.892 | 0.837 |
| TyG index waist | 0.772 | 0.910 | 0.676 |
| TyG index waist/high | 0.761 | 0.888 | 0.701 |
Publisher’s Note: MDPI stays neutral with regard to jurisdictional claims in published maps and institutional affiliations. |
© 2022 by the authors. Licensee MDPI, Basel, Switzerland. This article is an open access article distributed under the terms and conditions of the Creative Commons Attribution (CC BY) license (https://creativecommons.org/licenses/by/4.0/).
Share and Cite
López-González, Á.A.; Altisench Jané, B.; Masmiquel Comas, L.; Arroyo Bote, S.; González San Miguel, H.M.; Ramírez Manent, J.I. Impact of COVID-19 Lockdown on Non-Alcoholic Fatty Liver Disease and Insulin Resistance in Adults: A before and after Pandemic Lockdown Longitudinal Study. Nutrients 2022, 14, 2795. https://doi.org/10.3390/nu14142795
López-González ÁA, Altisench Jané B, Masmiquel Comas L, Arroyo Bote S, González San Miguel HM, Ramírez Manent JI. Impact of COVID-19 Lockdown on Non-Alcoholic Fatty Liver Disease and Insulin Resistance in Adults: A before and after Pandemic Lockdown Longitudinal Study. Nutrients. 2022; 14(14):2795. https://doi.org/10.3390/nu14142795
Chicago/Turabian StyleLópez-González, Ángel Arturo, Bárbara Altisench Jané, Luis Masmiquel Comas, Sebastiana Arroyo Bote, Hilda María González San Miguel, and José Ignacio Ramírez Manent. 2022. "Impact of COVID-19 Lockdown on Non-Alcoholic Fatty Liver Disease and Insulin Resistance in Adults: A before and after Pandemic Lockdown Longitudinal Study" Nutrients 14, no. 14: 2795. https://doi.org/10.3390/nu14142795
APA StyleLópez-González, Á. A., Altisench Jané, B., Masmiquel Comas, L., Arroyo Bote, S., González San Miguel, H. M., & Ramírez Manent, J. I. (2022). Impact of COVID-19 Lockdown on Non-Alcoholic Fatty Liver Disease and Insulin Resistance in Adults: A before and after Pandemic Lockdown Longitudinal Study. Nutrients, 14(14), 2795. https://doi.org/10.3390/nu14142795