Article

Association among Premenstrual Syndrome, Dietary Patterns, and Adherence to Mediterranean Diet

1
Department of Family Medicine, Yongin Severance Hospital, Yonsei University College of Medicine, Yongin 16995, Korea
2
Department of Medicine, Yonsei University College of Medicine, Seoul 03722, Korea
3
Department of Family Medicine, Severance Hospital, Yonsei University College of Medicine, Seoul 03722, Korea
*
Author to whom correspondence should be addressed.
These authors contributed equally to this work.
Nutrients 2022, 14(12), 2460; https://doi.org/10.3390/nu14122460
Submission received: 23 May 2022 / Revised: 6 June 2022 / Accepted: 8 June 2022 / Published: 14 June 2022
(This article belongs to the Special Issue The Effect of the Mediterranean Diet on Metabolic Health)

Abstract

:
Premenstrual syndrome (PMS) adversely affects the physiological and psychological health and quality of life of women. Mediterranean diet (MD) could be helpful for managing and preventing PMS, but evidence on the association between dietary patterns and PMS in Asian women is limited. This study aimed to investigate the association of dietary patterns and adherence to MD with PMS in Korean women. This cross-sectional study recruited 262 women aged 20–49 years via an online survey. PMS was diagnosed using the American College of Obstetricians and Gynecologists diagnostic criteria. MD adherence was assessed using the Korean version of the Mediterranean Diet Adherence Screener. Mediterranean Diet Score (MDS) was classified into tertiles (T) (T1: 0–3, T2: 4–5, and T3: ≥6). Dietary pattern was assessed with the Food Frequency Questionnaire. Multiple logistic regression analyses were conducted to evaluate the association between dietary pattern scores and PMS prevalence. The proportion of PMS was significantly lower in MDS tertile (T) 3 than in T1 (55.4% in T3 vs. 74.4% in T1, p = 0.045). After adjusting for confounders, participants in the highest tertile of the bread/snack pattern had a higher risk of PMS (odds ratio [95% CI]: 2.59 [1.32–5.06]), while traditional dietary pattern and meat/alcohol pattern were not associated with PMS. In conclusion, we found that low adherence to MD and higher bread/snack dietary pattern were associated with increased risk of PMS, respectively.

1. Introduction

Premenstrual syndrome (PMS), which occurs during the luteal phase of the menstrual cycle and resolves spontaneously after the onset of menstruation, is a common psychological and somatic disorder among women of reproductive age [1]. This syndrome consists of psychiatric or physical symptoms that significantly impair the normal daily functioning of women at any stage in her reproductive life, including work, relationships, and personal activities, and negatively impact quality of life [1,2,3]. Although the exact etiology of PMS remains unknown, the symptoms may be related to hormonal variations [4]. Genetic backgrounds, psychosocial factors, and lifestyle factors such as aerobic exercise and dietary pattern are known to associated with prevalence of PMS [1,5,6,7]. For example, excessive consumption of sweet-tasting food, fast food, deep-fried meals, coffee, and alcohol are significantly associated with the development of PMS [8,9]. In contrast, adequate intake of vegetables and fruits could alleviate PMS symptoms [8,9].
The Mediterranean diet (MD) is characterized by high consumption of vegetables, fruits, whole grains, legumes, nuts, and olive oil. Importantly, it has consistently been validated for its beneficial influence on health [10,11]. Thus, the MD could have beneficial effects on management and prevention of PMS [12]. However, there has been a limited amount of research investigating the association between dietary patterns and PMS in Asian women. Therefore, we aimed to investigate this association, particularly between PMS and MD adherence.

2. Materials and Methods

2.1. Study Design and Population

This cross-sectional study was conducted among Korean women of childbearing age who participated in an online survey in September 2021. The survey was conducted using survey panels from dataSpring (https://ko.d8aspring.com/contact). A total of 262 women aged 20–49 years voluntarily participated in the online survey. The exclusion criteria were as follows: (1) age <20 years or >49 years; (2) known history of thyroid disease; (3) current medical history of oral contraceptives or hormone replacement therapy; and (4) unwillingness to provide informed consent.

2.2. Data Collection

Data were collected during the online survey using a self-administered questionnaire. The participants were first assigned to a pre-screening procedure. The pre-screening questionnaire included anthropometric variables (height and weight), demographic characteristics, underlying medical conditions (hypertension, diabetes mellitus, and dyslipidemia), and menstrual history. Body mass index (BMI) was calculated as weight (kg) divided by height (m) squared. Menstrual history included age of menarche (years), menstrual length (days), duration of flow (days), menstrual regularity (regular/irregular), amount of flow (little/moderate/heavy), and dysmenorrhea (present/none).
Demographic information included age (years), education status (under-graduate or graduate), marital status (single or married), and personal lifestyle habits (smoking, alcohol drinking, and physical activity). Smoking and alcohol drinking habits were classified as never/former/current smoker and never/current drinker, respectively. Physical activity was assessed using the Godin Leisure-Time Exercise Questionnaire [13]. Participants were asked to recall the number of strenuous, moderate, or mild physical activity exceeding 15 min in duration, considering a 7-day period (a week). The intensity of each physical activity was described as “heart beats rapidly (e.g., running or vigorous swimming)”, not exhausting (e.g., fast walking, easy bicycling, and folk dancing)”, and “minimal effort (e.g., yoga or easy walking)”. Total weekly leisure activity score was calculated by multiplying the number of 15-min episodes by the weights of 9, 5, and 3, and summing those values into an overall score. Based on the total score, participants were categorized into three groups: active (≥24 units), moderately active (14–23 units), and insufficiently active/sedentary (<14 units).
The subjects who qualified in the pre-screening procedure proceeded to the main survey. The main survey questionnaire included: (1) American College of Obstetricians and Gynecologists (ACOG) diagnostic criteria for PMS [14,15]; (2) Korean version of the Mediterranean Diet Adherence Screener (K-MEDAS) [16]; and (3) Food Frequency Questionnaire (FFQ) [17].

2.3. Diagnosis of Premenstrual Syndrome

PMS was confirmed following the ACOG diagnostic criteria proposed in 2000 [14], as follows. PMS was diagnosed if the patient reported at least one affective symptom (i.e., depression, angry outbursts, irritability, anxiety, confusion, or social withdrawal) and at least one somatic symptom (i.e., breast tenderness, abdominal bloating, headache, or swelling of extremities) during the 5 days before menses in each of the three prior menstrual cycles. In addition, these symptoms should have been relieved within 4 days from the onset of menses, without recurrence until at least cycle day 13. The ACOG PMS questionnaires translated into Korean by the National Institute of Food and Drug Safety Evaluation [15] were used. Based on the ACOG diagnostic criteria, participants with or without PMS were classified into the PMS and non-PMS groups.

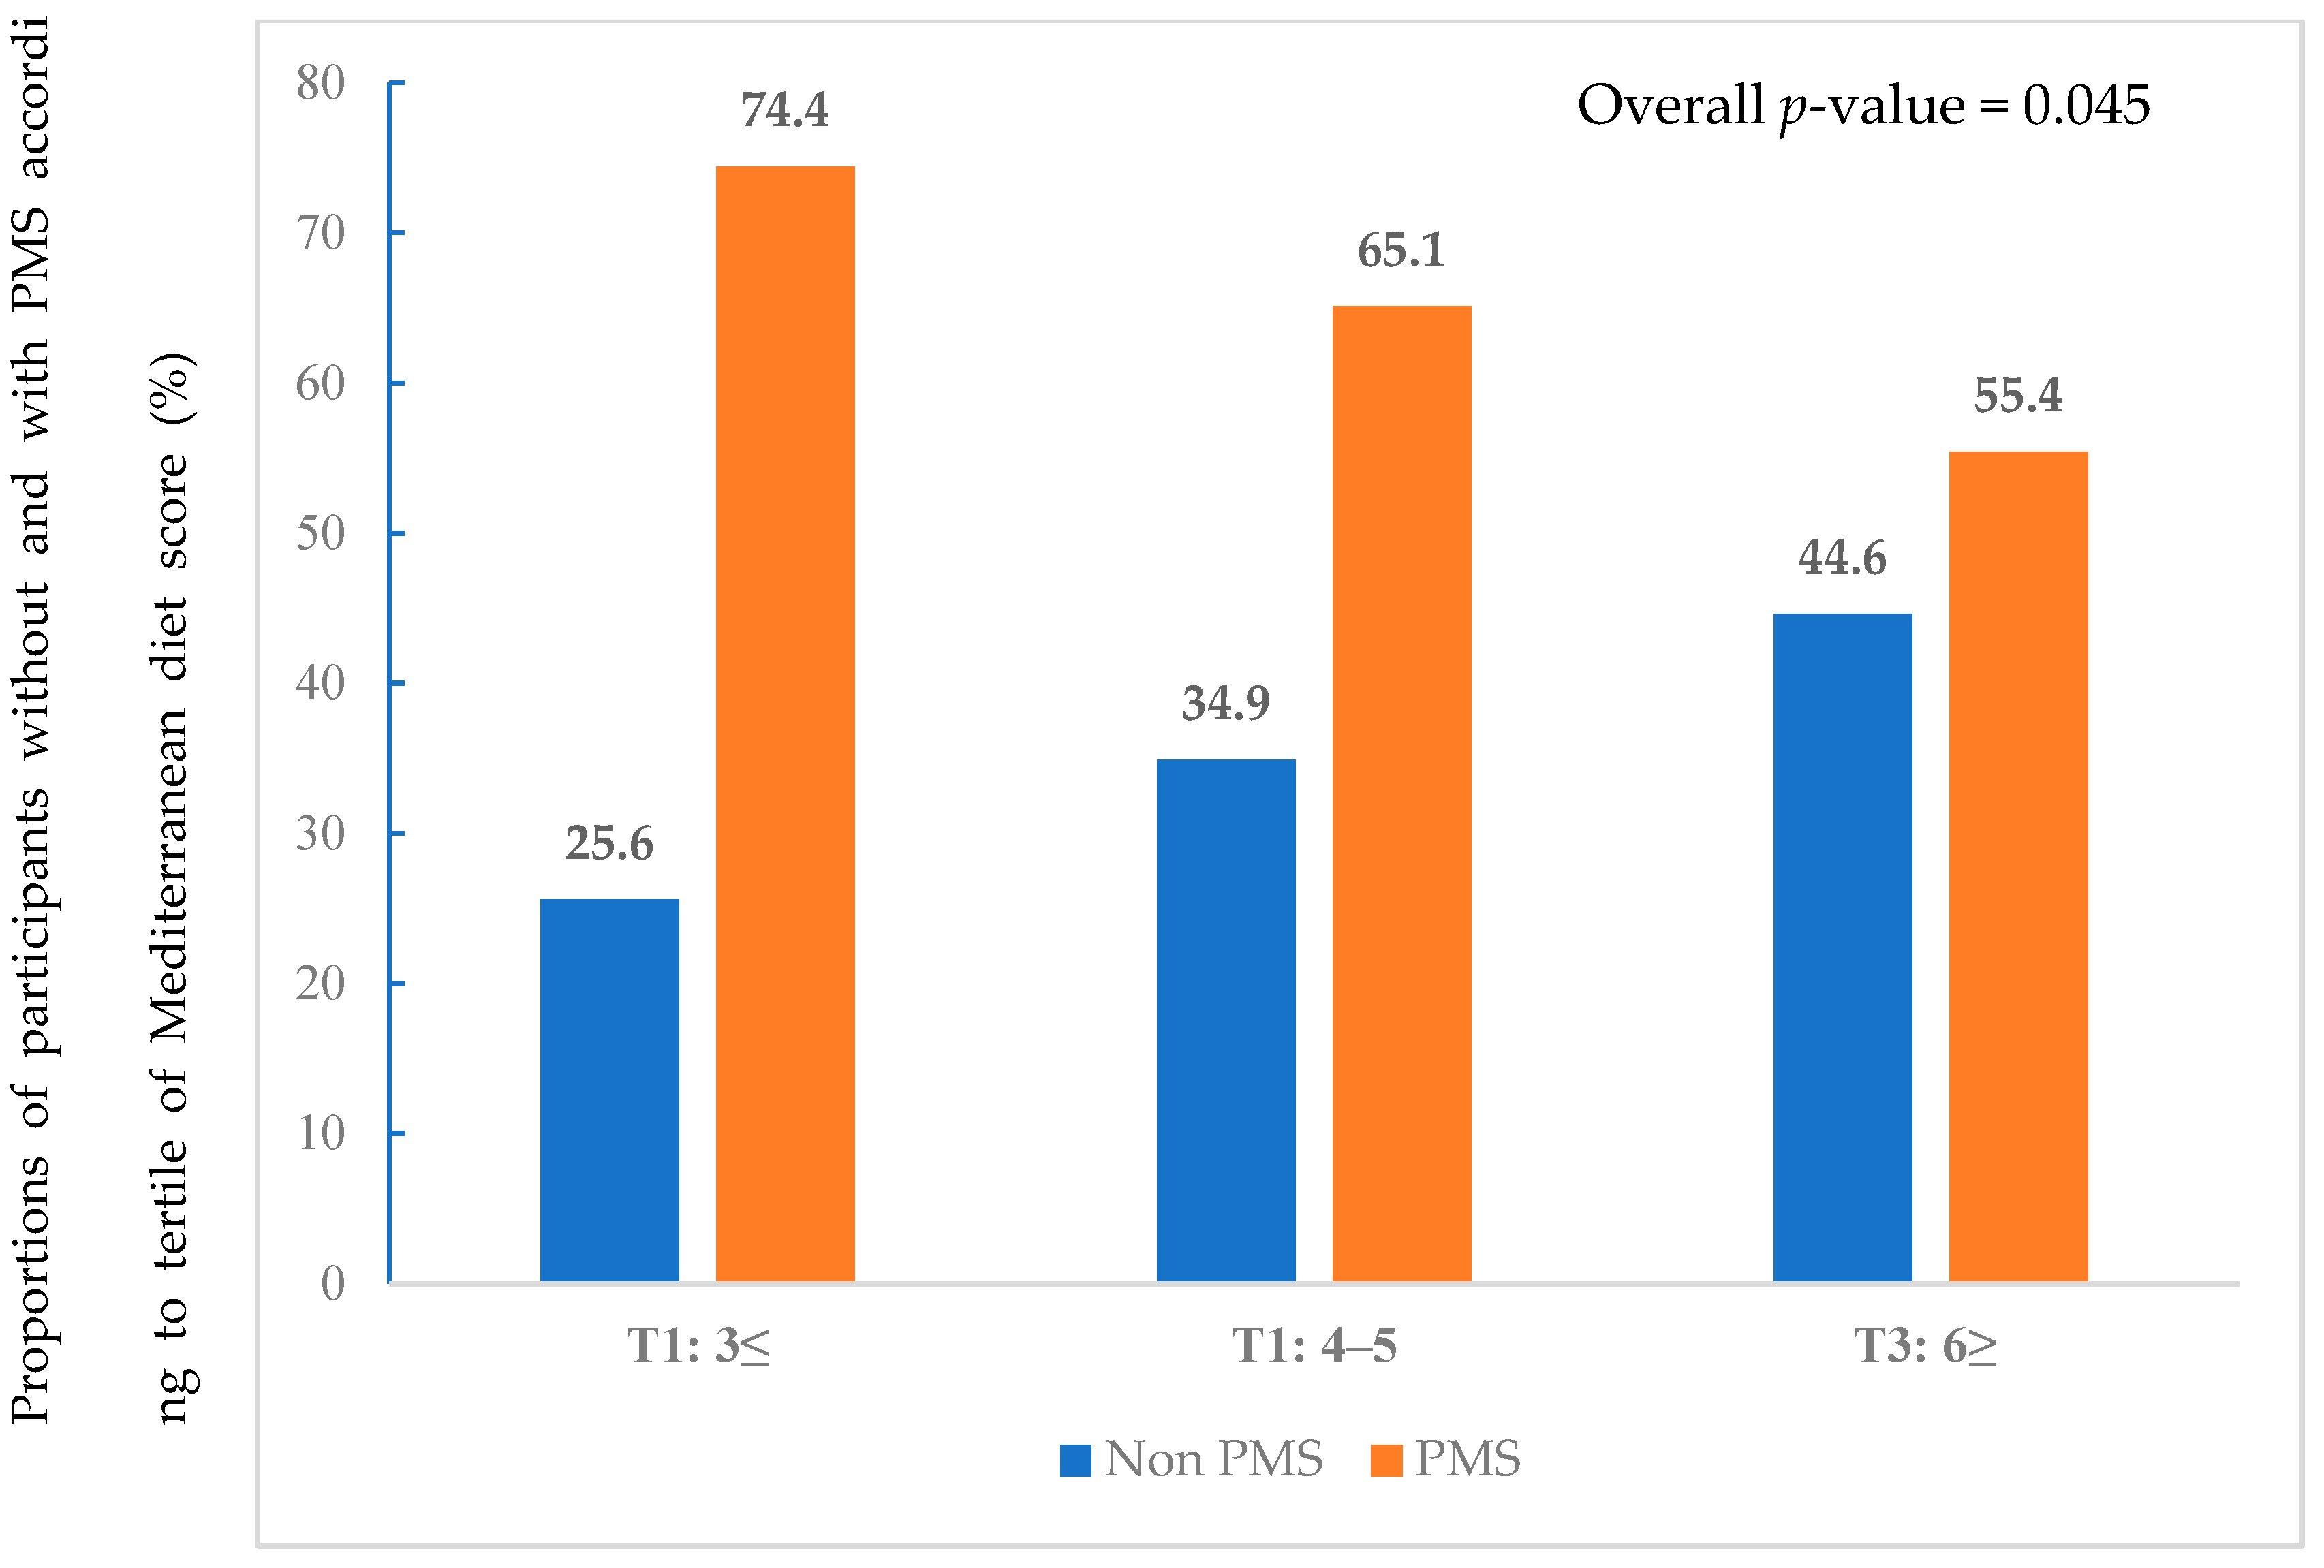
2.4. Assessment of Mediterranean Diet Adherence

Adherence to the MD was assessed using a 14-item questionnaire developed by Ji-won Lee et al. which was a modification of the validated Mediterranean Diet Adherence Screener [16]. The K-MEDAS questionnaire is a validated tool for assessing adherence to the Mediterranean diet in the Korean population. One point is given for using perilla oil or olive oil as the principal source of fat for cooking (question; Q1) and for preferring white meat over red meat (Q13). One point is also given in the following cases: for Q2, ≥3 teaspoons of perilla oil or olive oil per day; for Q3, ≥2 servings of vegetables per/day; for Q4, ≥1 pieces of fruit per day; for Q5, <1 serving of red meat or sausages per day; for Q6, <1 serving of butter, margarine, or cream per day; for Q7, <1 serving of sugar-sweetened beverages per day; for Q8, ≥7 servings of wine per week; for Q9, ≥3 servings of beans or tofu per week; for Q10, ≥3 servings of fish or seafood per week; for Q11, <3 times of sweets, bread (except whole wheat bread), cakes, and cookies per week; for Q12, ≥3 times of nuts per week; and for Q14, ≥3 times of whole grain per week. Failure to meet each parameter is given a 0 score. The resulting modified MD scores ranged from 0 to 14, with higher score indicating higher adherence to the MD.

2.5. Assessment of Nutritional Intake and Dietary Patterns

The nutritional survey was conducted using the semi-quantitative FFQ, which has been validated for 112 food items [17]. Participants were required to report the frequency of usual food items consumed in the preceding year on a daily, weekly, or monthly basis, considering the average amount of intake for each food item. Based on the nutrient composition similarity, food items were categorized into 21 food groups: rice, mixed grain rice, noodles/dumplings, breads/rice cakes, soup/stew, soybeans, eggs, red meat, white meat, fish/seafood, vegetables, fermented foods, kimchi, seaweed, potatoes, milk/dairy products, fruits, beverages, snacks, nuts, and alcoholic beverages. Total energy and nutrient intake values were derived from this FFQ. Detailed information regarding the specific food items is available on the KNHANES website [18].

2.6. Statistical Analysis

Normally distributed continuous variables were presented as the mean ± standard deviation or median (25th, 75th), while categorical variables were presented as the number (percentage, %). Between-group comparisons were performed using an independent two-sample t-test or Mann–Whitney U test for continuous variables and using chi-square test for categorical variables. For continuous variables, analysis of variance was performed to compare the differences among tertile groups. Dietary patterns were generated by factor analysis using the principal component method. Twenty-one food items were entered into the factor analysis. Eigenvalues > 1.0 were used to determine the number of factors to retain by scree plot. To increase interpretability, factors were rotated by orthogonal transformation (varimax).
Foods with factor-loading > 0.5 were considered to contribute to the dietary patterns. Finally, 15 food items were used in the factor analysis. Three major dietary patterns were extracted, which explained 49.5% of the total variance. The Keiser–Meyer–Olkin (KMO) value was 0.826. Factor scores for each dietary pattern were categorized into tertile. Multiple logistic regression analyses were conducted to evaluate the association between each dietary pattern score and prevalence of PMS. Model 1 was an unadjusted model. Model 2 was adjusted for age and BMI. Model 3 was adjusted for all factors in model 1 with the addition of smoking status, alcohol drinking status, and physical activity. All statistical analyses were performed using Statistical Package for the Social Sciences version 23.0 (IBM Corp., Armonk, NY, USA). All tests were two sided, and p values < 0.05 were considered statistically significant.

3. Results

3.1. Baseline Participant Characteristics

In total, 171 (65.3%) and 91 (34.7%) participants did and did not have PMS, respectively. The baseline participant characteristics by group are shown in Table 1. There were significant between-group differences in age, BMI, education, marital status, physical activity, and underlying conditions. The participants with PMS were likely to be current smokers and current drinkers (p = 0.046 and p < 0.001, respectively). Table 2 shows the menstrual characteristics by group. Although there were no differences in age of menarche, menstrual length, duration of flow, menstrual regularity, and amount of flow (little/moderate/heavy), the prevalence of dysmenorrhea was significantly higher in the PMS group (95.3% vs. 80.2%, p < 0.001).

3.2. Nutritional Status and Dietary Patterns

Table 3 presents the nutritional intake status according to the presence of PMS. Compared with the non-PMS group, the PMS group had a significant higher intake of total calorie, carbohydrate, fiber, vitamin A, vitamin K, and Ca. However, after adjusting for the total calorie intake, no significant difference in nutritional status between two groups was observed. Weekly consumption frequency of food groups in accordance with the presence of PMS is shown in Table 4. A comparison of weekly consumption frequency showed a significant difference with respect to the food groups of white meat, snacks, and alcoholic beverages. Weekly consumption frequency of white meat was significantly higher in the PMS group than in the non-PMS group (0.32 ± 0.46 times/wk vs. 0.23 ± 0.17 times/wk, p = 0.024). In addition, the PMS group showed significantly higher weekly consumption frequency of snacks (1.52 ± 2.07 times/wk vs. 1.05 ± 1.49 times/wk, p = 0.033) and alcoholic beverages (0.44 ± 0.86 times/wk vs. 0.25 ± 0.45 times/wk, p = 0.022).
Figure 1 presents the proportions corresponding to each tertile. MDS was classified into tertiles (T1: 0–3, T2: 4–5, and T3: ≥6). The proportions of PMS was significantly lower in T3 than in T1 (55.4% vs. 74.4%, p = 0.045), while the proportion of non-PMS was significantly higher in T3 than in T1 (44.6% vs. 25.6%, p = 0.045). Figure 2 shows the proportion of PMS according to adherence to each of the 14 MDS components. The non-PMS group showed a higher adherence rate to MD component 6 (<1 serving of butter, margarine, or cream per day) (81.3% vs. 66.7%, p = 0.012), component 7 (<1 serving of sugar-sweetened beverages per day) (59.3% vs. 45.6%, p = 0.034), and component 11 (<3 times of sweets, bread (except whole wheat bread), cakes, and cookies per week) (52.7% vs. 39.8%, p = 0.044). There were no significant differences in adherence to other components. Adherence to MDS component 8 (≥7 servings of wine per week) was zero for all participants.

3.3. Association between Dietary Patterns and PMS

We identified three major dietary patterns using factor analysis: (i) traditional diet pattern, which was high in fish/seafood, vegetables, kimchi, seaweed, potatoes and fruits; (ii) meat/alcohol pattern, which was high in rice, noodles/dumplings, red meat, and alcoholic beverages; and (iii) bread/snack pattern, which was high in breads/rice cakes and snacks. The identified dietary patterns explained 49.5% of dietary food intakes in the study population. The factor loadings associated with 15 food groups for the major dietary patterns are presented in Table S1.
Table 5 presented the odds ratio (OR) and 95% confidence intervals (CI) for PMS across tertiles (T) of the three major dietary patterns. The bread/snack pattern was associated with prevalence of PMS in model 1 (T3 vs. T1, OR, 95% CI 2.63 (1.39–5.00), p-value = 0.003). After adjusting for age, body mass index, smoking status, alcohol drinking status, and physical activity, this significant association was remained (T3 vs. T1, OR, 95% CI, 2.59 (1.32–5.06), p-value = 0.006). Traditional diet pattern was not associated with prevalence of PMS in model 1 (T3 vs. T1, OR, 95% CI 0.91, (0.49–1.68), p-value = 0.905). Meat/alcohol pattern was not associated with prevalence of PMS in model 1 (T3 vs. T1, OR, 95% CI, 1.82 (0.97–3.40), p-value = 0.060). After adjusting for same confounders, similar trends were shown (traditional diet pattern; T3 vs. T1, OR, 95% CI, 1.13 (0.56–2.30), p-value = 0.735 and meat/alcohol pattern; T3 vs. T1, OR, 95% CI 1.60 (0.83–2.09) p-value = 0.160).

4. Discussion

Research on the association between dietary patterns and PMS in Asian women is scarce. This cross-sectional study found that participants with PMS have lower adherence to MD. In addition, we identified three dietary patterns among Korean women: bread/snack, traditional diet, and meat/alcohol diet. Importantly, bread/snack dietary pattern was adversely associated with PMS, whereas traditional dietary pattern and meat and alcohol diet pattern were not associated with PMS.
A recent systemic review and meta-analysis conducted in India and Turkey reported that PMS was prevalent in 43–52.2% of women of reproductive age [19,20]. A Spanish cohort study also reported a PMS prevalence of 73.7% [21] and a meta-analysis in Iranian women of reproductive age reported a prevalence rate of 70.8% [95% CI: 63.8–77.7] [22]. This difference in prevalence among the studies might be due to the difference in the study population, and cultural contexts, as well as differences in study methodology such as sample size, design, and methods of PMS measurement. In our study, majority of participants had PMS (65.3% of 262 participants). Although it cannot be excluded that ACOG diagnostic criteria overestimated the prevalence of PMS [23], the rate was consistent with the results of previous studies that reported a high prevalence of PMS in Korea [24,25].
Dietary factors are influential but modifiable parameters that can be included in the management of PMS, and several studies have found a significant association between dietary habit and PMS [5,26]. A study conducted in the United Arab Emirates reported a high prevalence of PMS among university students with high calorie/fat/sugar/salt food consumption [26]. Western dietary pattern, which is characterized by high consumption of fast foods, soft drink, and desserts, is significantly associated with a higher likelihood of PMS, whereas healthy and traditional dietary pattern is associated with a lower risk [5,9]. The MD is rich in high-complex carbohydrate and monounsaturated fatty acids, rather than simple sweets and saturated and trans-fatty acids [10,11]. Many studies have shown that the MD has beneficial effects in preventing chronic diseases, such as metabolic syndrome, type 2 diabetes, inflammatory disease, cardiovascular disease, and cancer [27]. In a recent Spanish study, low adherence to the MD was associated with longer menstrual cycles [28]. Women who ate less than two pieces of fruit per day had a higher risk of menstrual pain (OR: 2.984; 95% CI = 1.390–6.406; p < 0.05) [28]. The amount of menstrual bleeding was lower in women who consumed olive oil daily, while it was more severe in those who consumed ham weekly.
However, only few studies have found a significant association between MD habit and PMS, especially in Asians. Our findings are consistent with those of previous studies. We found a significantly higher MD score in the non-PMS group than in the PMS group. The proportions of participants consuming butter, margarine, or cream less than one serving/day; sugar-sweetened beverage less than one serving; and sweets, bread, cakes, and cookies less than three times per week were significantly higher in the non-PMS group than PMS group. Further, highest bread/snack pattern was associated with a 2.59 times higher risk of PMS. Although the exact etiology of PMS still remains unknown, several possible mechanisms could support our findings. First, high consumption of bread and snacks with excess sodium [29] may decrease serum magnesium (Mg) levels [30,31].
Reduced Mg levels have been reported in women with PMS [32], and a randomized clinical trial confirmed that Mg supplementation alleviated PMS symptoms related to mood [32]. The traditional Korean diet pattern is characterized by high consumption of vegetables, legumes, whole grains, fish and fermented foods (kimchi, soy sauce, and soybean paste), and these components are similar to those of MD [33]. However, traditional fermented foods of Korean diet also contain high sodium [34]. Therefore, in the current study, traditional diet pattern might not be associated with prevalence of PMS. Second, individuals with PMS are prone to have depressive mood and stronger cravings for refined carbohydrate and fat foods [35,36]. Third, a western dietary pattern is closely related to chronic low-grade inflammation, and several studies proved significant positive associations between serum levels of inflammatory markers (e.g., high-sensitivity C-reactive protein, interleukin-12, and interferon-γ) and menstrual symptom severity in women with PMS [37,38]. In addition, the common psychiatric features of PMS have been associated with chronic inflammation [38]. Fourth, a previous study demonstrated that oxidative stress results from an oxidant/antioxidant imbalance is closely associated with various symptoms of PMS [39]. MD, a representative antioxidant diet, has abundant polyphenols and monounsaturated and polyunsaturated fatty acids. Therefore, MD could help to reduce PMS symptoms.
Our study has some limitations. First, the causal relationship between dietary patterns and PMS could not be investigated owing to the nature of cross-sectional study. Second, nutritional status and dietary pattern were assessed using the FFQ, which has disadvantages of lacking accuracy for absolute nutrient values, especially micronutrients and possibility of over and underreporting of consumption of certain foods [40]. In addition, dietary patterns do not represent all possible patterns and people may fit into more than one pattern. Third, we only included the participants who participated in the online survey panel. Therefore, our results have limited generalizability to the overall population of Korean women, other races, and other countries. Fourth, during the survey, we allowed subjects to freely report their diseases in addition to hypertension, dyslipidemia, diabetes, and cardiovascular disease. Participants who have mental illness are likely to understate their situation and report falsely. Therefore, we could not fully evaluate the individuals’ psychological status. Finally, the effect of unmeasured factors such as physiological condition (e.g., menopause status) and comorbidities cannot be completely ruled out. Despite these limitations, to our best knowledge, this study is the first to investigate the association between dietary pattern and PMS and examine adherence to MD as it relates to the prevalence of PMS among Korean women. Further investigations into the biological mechanisms by which dietary factors influence the pathogenesis of PMS are required.

5. Conclusions

This is the first study investigating the association between dietary pattern and PMS among Korean women. Our result suggested that bread/ snack pattern is associated with higher prevalence of PMS in Korean women. We also suggest that low adherence to MD is associated with PMS. Our findings suggest that adherence to MD and avoiding bread/snack consumption could be helpful for managing and preventing PMS. Further investigations into the biological mechanisms of dietary factors’ action on the pathogenesis of PMS are required.

Supplementary Materials

The following supporting information can be downloaded at: https://www.mdpi.com/article/10.3390/nu14122460/s1, Table S1: Factor loadings of the dietary patterns derived from factor analysis.

Author Contributions

D.-I.S., Y.-J.K. and J.-W.L. contributed to the conception or design of the work. D.-I.S., Y.-J.K. and J.-W.L. contributed to the acquisition, analysis, or interpretation of the data and drafting of the manuscript. All authors critically revised the manuscript, provided final approval and agree to be accountable for all aspects of the work, ensuring integrity and accuracy. All authors have read and agreed to the published version of the manuscript.

Funding

This research was supported by the Technology Innovation Program, grant number 20002781, A Platform for Prediction and Management of Health Risk Based on Personal Big Data and Life-logging], funded by the Ministry of Trade, Industry & Energy (MOTIE, Korea) and the Korea Institute of Planning and Evaluation for Technology in Food, Agriculture and Forestry (IPET) through High Value-added Food Technology Development Program, funded by Ministry of Agriculture, Food and Rural Affairs (MAFRA), grant number 321030051HD030.

Institutional Review Board Statement

The study was conducted in accordance with the Declaration of Helsinki, and was approved by the Institutional Review Board of Yongin Severance Hospital (protocol code 9-2021-0110).

Informed Consent Statement

Informed consent was obtained from all subjects involved in the study.

Data Availability Statement

The data presented in this study are available on request from the corresponding author.

Acknowledgments

We thank the participants who voluntarily joined this study.

Conflicts of Interest

The authors declare no conflict of interest.

References

  1. Hofmeister, S.; Bodden, S. Premenstrual syndrome and premenstrual dysphoric disorder. Am. Fam. Physician 2016, 94, 236–240. [Google Scholar] [PubMed]
  2. Ryu, A.; Kim, T.H. Premenstrual syndrome: A mini review. Maturitas 2015, 82, 436–440. [Google Scholar] [CrossRef] [PubMed]
  3. Halbreich, U.; Borenstein, J.; Pearlstein, T.; Kahn, L.S. The prevalence, impairment, impact, and burden of premenstrual dysphoric disorder (pms/pmdd). Psychoneuroendocrinology 2003, 28 (Suppl. 3), 1–23. [Google Scholar] [CrossRef]
  4. Liu, Q.; Wang, Y.; van Heck, C.H.; Qiao, W. Stress reactivity and emotion in premenstrual syndrome. Neuropsychiatr. Dis. Treat. 2017, 13, 1597–1602. [Google Scholar] [CrossRef] [PubMed] [Green Version]
  5. MoradiFili, B.; Ghiasvand, R.; Pourmasoumi, M.; Feizi, A.; Shahdadian, F.; Shahshahan, Z. Dietary patterns are associated with premenstrual syndrome: Evidence from a case-control study. Public Health Nutr. 2020, 23, 833–842. [Google Scholar] [CrossRef] [PubMed]
  6. Jahanfar, S.; Lye, M.S.; Krishnarajah, I.S. The heritability of premenstrual syndrome. Twin Res. Hum Genet. 2011, 14, 433–436. [Google Scholar] [CrossRef] [Green Version]
  7. Han, J.; Cha, Y.; Kim, S. Effect of psychosocial interventions on the severity of premenstrual syndrome: A meta-analysis. J. Psychosom. Obstet. Gynaecol. 2019, 40, 176–184. [Google Scholar] [CrossRef]
  8. Bertone-Johnson, E.R.; Hankinson, S.E.; Willett, W.C.; Johnson, S.R.; Manson, J.E. Adiposity and the development of premenstrual syndrome. J. Womens Health 2010, 19, 1955–1962. [Google Scholar] [CrossRef] [Green Version]
  9. Farasati, N.; Siassi, F.; Koohdani, F.; Qorbani, M.; Abashzadeh, K.; Sotoudeh, G. Western dietary pattern is related to premenstrual syndrome: A case-control study. Br. J. Nutr. 2015, 114, 2016–2021. [Google Scholar] [CrossRef] [Green Version]
  10. Sofi, F.; Cesari, F.; Abbate, R.; Gensini, G.F.; Casini, A. Adherence to mediterranean diet and health status: Meta-analysis. Bmj 2008, 337, a1344. [Google Scholar] [CrossRef] [Green Version]
  11. Sofi, F.; Macchi, C.; Abbate, R.; Gensini, G.F.; Casini, A. Mediterranean diet and health status: An updated meta-analysis and a proposal for a literature-based adherence score. Public Health Nutr. 2014, 17, 2769–2782. [Google Scholar] [CrossRef] [PubMed] [Green Version]
  12. Schwingshackl, L.; Bogensberger, B.; Hoffmann, G. Diet quality as assessed by the healthy eating index, alternate healthy eating index, dietary approaches to stop hypertension score, and health outcomes: An updated systematic review and meta-analysis of cohort studies. J. Acad. Nutr. Diet. 2018, 118, 74–100.e111. [Google Scholar] [CrossRef] [PubMed] [Green Version]
  13. Godin, G.; Jobin, J.; Bouillon, J. Assessment of leisure time exercise behavior by self-report: A concurrent validity study. Can. J. Public Health 1986, 77, 359–362. [Google Scholar] [CrossRef] [PubMed]
  14. ACOG Practice Bulletin. Premenstrual syndrome. Clinical management guidelines for obstetrician–gynecologists. Number 15. J. Obstet. Gynecol. 2001, 73, 183–191. [Google Scholar]
  15. Kim, T.-H.; Park, H.S.; Lee, H.-H.; Chung, S.-H. Premenstrual syndrome and dysmenorrhea in the career women at bucheon city. Korean J. Obstet. Gynecol. 2011, 54, 523–528. [Google Scholar] [CrossRef] [Green Version]
  16. Kwon, Y.J.; Lee, H.; Yoon, Y.; Kim, H.M.; Chu, S.H.; Lee, J.W. Development and validation of a questionnaire to measure adherence to the mediterranean diet in korean adults. Nutrients 2020, 12, 1102. [Google Scholar] [CrossRef] [Green Version]
  17. Yun, S.H.; Shim, J.-S.; Kweon, S.; Oh, K. Development of a food frequency questionnaire for the korea national health and nutrition examination survey: Data from the fourth korea national health and nutrition examination survey (knhanes iv). Korean J. Nutr. 2013, 46, 186–196. [Google Scholar] [CrossRef] [Green Version]
  18. Korea Disease Control and Prevention Agency. Korea National Health & Nutritional Examination Survey Sixth (2013–2015), Guidbook for Data User (Korean). Available online: https://knhanes.cdc.go.kr/knhanes/eng/index.do (accessed on 20 November 2017).
  19. Erbil, N.; Yücesoy, H. Premenstrual syndrome prevalence in turkey: A systematic review and meta-analysis. Psychol. Health Med. 2021, 8, 1–11. [Google Scholar] [CrossRef]
  20. Dutta, A.; Sharma, A. Prevalence of premenstrual syndrome and premenstrual dysphoric disorder in india: A systematic review and meta-analysis. Health Promot. Perspect. 2021, 11, 161–170. [Google Scholar] [CrossRef]
  21. Dueñas, J.L.; Lete, I.; Bermejo, R.; Arbat, A.; Pérez-Campos, E.; Martínez-Salmeán, J.; Serrano, I.; Doval, J.L.; Coll, C. Prevalence of premenstrual syndrome and premenstrual dysphoric disorder in a representative cohort of spanish women of fertile age. Eur. J. Obstet. Gynecol. Reprod. Biol. 2011, 156, 72–77. [Google Scholar] [CrossRef]
  22. Ranjbaran, M.; Omani Samani, R.; Almasi-Hashiani, A.; Matourypour, P.; Moini, A. Prevalence of premenstrual syndrome in iran: A systematic review and meta-analysis. Int. J. Reprod. Biomed. 2017, 15, 679–686. [Google Scholar] [CrossRef] [PubMed] [Green Version]
  23. Potter, J.; Bouyer, J.; Trussell, J.; Moreau, C. Premenstrual syndrome prevalence and fluctuation over time: Results from a french population-based survey. J. Womens Health 2009, 18, 31–39. [Google Scholar] [CrossRef] [PubMed] [Green Version]
  24. PARK, Y.-H.; JEONG, B.-S.; KIM, C.-Y.; Lee, C. Prevalence of premenstrual dysphoric disorder and occupational function in a nurse group. J. Korean Neuropsychiatr. Assoc. 2001, 40, 832–841. [Google Scholar]
  25. Kang, S.; Lee, Y. Menstruation and the variability of food intake in female college students. Korean J. Community Nutr. 2013, 18, 577–587. [Google Scholar] [CrossRef]
  26. Hashim, M.S.; Obaideen, A.A.; Jahrami, H.A.; Radwan, H.; Hamad, H.J.; Owais, A.A.; Alardah, L.G.; Qiblawi, S.; Al-Yateem, N.; Faris, M.A.E. Premenstrual syndrome is associated with dietary and lifestyle behaviors among university students: A cross-sectional study from sharjah, uae. Nutrients 2019, 11, 1939. [Google Scholar] [CrossRef] [Green Version]
  27. Gantenbein, K.V.; Kanaka-Gantenbein, C. Mediterranean diet as an antioxidant: The impact on metabolic health and overall wellbeing. Nutrients 2021, 13, 1951. [Google Scholar] [CrossRef]
  28. Onieva-Zafra, M.D.; Fernández-Martínez, E.; Abreu-Sánchez, A.; Iglesias-López, M.T.; García-Padilla, F.M.; Pedregal-González, M.; Parra-Fernández, M.L. Relationship between diet, menstrual pain and other menstrual characteristics among spanish students. Nutrients 2020, 12, 1759. [Google Scholar] [CrossRef]
  29. Kraemer, M.V.; Oliveira, R.C.; Gonzalez-Chica, D.A.; Proença, R.P. Sodium content on processed foods for snacks. Public Health Nutr. 2016, 19, 967–975. [Google Scholar] [CrossRef] [Green Version]
  30. Chidambaram, N.; Sethupathy, S.; Saravanan, N.; Mori, M.; Yamori, Y.; Garg, A.K.; Chockalingam, A. Relationship of sodium and magnesium intakes to hypertension proven by 24-hour urianalysis in a south indian population. J. Clin. Hypertens. 2014, 16, 581–586. [Google Scholar] [CrossRef]
  31. Johnson, S. The multifaceted and widespread pathology of magnesium deficiency. Med. Hypotheses 2001, 56, 163–170. [Google Scholar] [CrossRef] [Green Version]
  32. Facchinetti, F.; Borella, P.; Sances, G.; Fioroni, L.; Nappi, R.E.; Genazzani, A.R. Oral magnesium successfully relieves premenstrual mood changes. Obstet. Gynecol. 1991, 78, 177–181. [Google Scholar] [PubMed]
  33. Song, Y.; Joung, H. A traditional korean dietary pattern and metabolic syndrome abnormalities. Nutr. Metab. Cardiovasc. Dis. 2012, 22, 456–462. [Google Scholar] [CrossRef] [PubMed]
  34. Kim, S.H.; Kim, M.S.; Lee, M.S.; Park, Y.S.; Lee, H.J.; Kang, S.-a.; Lee, H.S.; Lee, K.-E.; Yang, H.J.; Kim, M.J. Korean diet: Characteristics and historical background. J. Ethn. Foods 2016, 3, 26–31. [Google Scholar] [CrossRef] [Green Version]
  35. Knüppel, A.; Shipley, M.J.; Llewellyn, C.H.; Brunner, E.J. Sugar intake from sweet food and beverages, common mental disorder and depression: Prospective findings from the whitehall ii study. Sci. Rep. 2017, 7, 6287. [Google Scholar] [CrossRef] [Green Version]
  36. Dye, L.; Blundell, J.E. Menstrual cycle and appetite control: Implications for weight regulation. Hum. Reprod. 1997, 12, 1142–1151. [Google Scholar] [CrossRef] [Green Version]
  37. Khayyatzadeh, S.S.; Bagherniya, M.; Fazeli, M.; Khorasanchi, Z.; Bidokhti, M.S.; Ahmadinejad, M.; Khoshmohabbat, S.; Arabpour, M.; Afkhamizadeh, M.; Ferns, G.A.; et al. A western dietary pattern is associated with elevated level of high sensitive c-reactive protein among adolescent girls. Eur. J. Clin. Investig. 2018, 48, e12897. [Google Scholar] [CrossRef]
  38. Bertone-Johnson, E.R.; Ronnenberg, A.G.; Houghton, S.C.; Nobles, C.; Zagarins, S.E.; Takashima-Uebelhoer, B.B.; Faraj, J.L.; Whitcomb, B.W. Association of inflammation markers with menstrual symptom severity and premenstrual syndrome in young women. Hum. Reprod. 2014, 29, 1987–1994. [Google Scholar] [CrossRef] [Green Version]
  39. Duvan, C.I.; Cumaoglu, A.; Turhan, N.O.; Karasu, C.; Kafali, H. Oxidant/antioxidant status in premenstrual syndrome. Arch. Gynecol. Obstet. 2011, 283, 299–304. [Google Scholar] [CrossRef]
  40. Resnicow, K.; Odom, E.; Wang, T.; Dudley, W.N.; Mitchell, D.; Vaughan, R.; Jackson, A.; Baranowski, T. Validation of three food frequency questionnaires and 24-hour recalls with serum carotenoid levels in a sample of african-american adults. Am. J. Epidemiol. 2000, 152, 1072–1080. [Google Scholar] [CrossRef]
Figure 1. Proportions of participants without and with PMS according to Mediterranean diet score tertiles.
Nutrients 14 02460 g001
Figure 2. Proportion of participants without and with PMS according to adherence to each of the 14 components of the Mediterranean diet score.
Nutrients 14 02460 g002
Table 1. Baseline participant characteristics by PMS group.
CharacteristicsNon-PMS GroupPMS Groupp-Value
N91 (34.7%)171 (65.3%)
Age (years)33.0 (26.0–37.0)31.0 (26.0–37.0)0.213
BMI (kg/m2)21.1 (19.6–23.1)20.5 (19.1–22.9)0.460
Education, N (%)
Undergraduate26 (28.6%)46 (26.9%)0.773
Graduate65 (71.4%)125 (73.1%)
Marital status, N (%)
Single63 (69.2%)123 (71.9%)0.647
Married28 (30.8%)48 (28.1%)
Smoking status, N (%)
Never smoker78 (85.7%)126 (73.7%)0.046
Former smoker8 (8.8%)19 (11.1%)
Current smoker5 (5.5%)26 (15.2%)
Alcohol drinking status, N (%)
Never drinker31 (34.1%)23 (13.5%)<0.001
Current drinker60 (65.9%)148 (86.5%)
Physical activity, N (%)
Active22 (24.2%)55 (32.2%)0.389
Moderately active28 (30.8%)45 (26.3%)
Insufficiently active/sedentary41 (45.1%)71 (41.5%)
Underlying conditions, N (%)
Hypertension 3 (3.3%)1 (0.6%)0.122
Diabetes mellitus 0 (0.0%)3 (1.8%)0.554
PMS, premenstrual syndrome.
Table 2. Menstrual characteristics of the study participants by PMS group.
CharacteristicsNon-PMS GroupPMS Groupp-Value
Age of Menarche (years)14.0 (13.0–15.0)13.0 (12.0–13.0)0.227
Menstrual Length (days)28.0 (28.0–30.0)29.0 (28.0–30.0)0.275
Duration of flow (days)5.0 (5.0–7.0)6.0 (5.0–6.0)0.771
Menstrual regularity, N (%)
Regular61 (67.0%)124 (72.5%)0.354
Irregular30 (33.0%)47 (27.5%)
Amount of flow, N (%)
Mild10 (11.0%)18 (10.5%)0.993
Moderate72 (79.1%)136 (79.5%)
Heavy9 (9.9%)17 (9.9%)
Dysmenorrhea, N (%)
Present73 (80.2%)163 (95.3%)<0.001
None18 (19.3%)8 (4.7%)
PMS, premenstrual syndrome.
Table 3. Nutritional status by PMS group.
VariablesNon-PMS GroupPMS Groupp-Value
N91171
Total calorie1667.6 ± 931.21950.6 ± 1121.50.041
Carbohydrate (g/day)255.7 ± 128.3295.7 ± 168.80.049
Protein (g/day)45.9 ± 4.843.5 ± 3.30.112
Fat (g/day)45.5 ± 34.355.1 ± 39.20.050
Fiber (g/day)10.7 ± 1.113.3 ± 1.00.036
Saturated fatty acids (%)1.93 ± 0.21.90 ± 2.00.584
Polyunsaturated fatty acids (%)5.36 ± 2.905.35 ± 1.950.961
Monounsaturated fatty acids5.34 ± 1.905.50 ± 2.200.539
Omega-3 fatty acids0.30 ± 0.310.29 ± 0.200.692
Omega-6 fatty acids0.01 ± 0.020.01 ± 0.010.783
Omega-6/Omega-30.08 ± 0.190.06 ± 0.110.268
Vitamin A298.6 ± 236.4386.2 ± 304.20.011
Vitamin C93.4 ± 83.5115.2 ± 121.10.088
Vitamin D3.2 ± 5.04.2 ± 11.50.473
Vitamin E13.4 ± 10.715.9 ± 11.50.098
Vitamin K116.1 ± 121.0166.2 ± 177.90.008
Riboflavin1.3 ± 0.91.5 ± 1.00.250
Niacin9.8 ± 7.311.5 ± 7.20.075
Vitamin B61.7 ± 3.81.5 ± 1.00.660
Ca375.2 ± 280.0460.3 ± 307.90.029
Na2327.4 ± 2287.32783.7 ± 2068.30.103
K2216.4 ± 1547.62584.9 ± 1665.60.082
Zinc8.6 ± 7.79.7 ± 5.80.222
PMS, premenstrual syndrome.
Table 4. Weekly consumption frequency (times/week) of food groups by PMS group.
VariablesNon-PMS GroupPMS Groupp-Value
N91171
Rice2.31 ± 1.672.43 ± 1.730.598
Mixed grain rice5.19 ± 5.885.04 ± 5.670.84
Noodles/dumplings0.50 ± 0.490.58 ± 0.580.27
Breads/rice cakes0.42 ± 0.480.51 ± 0.490.166
Soup/stew0.36 ± 0.560.40 ± 0.410.492
Soybeans0.67 ± 0.980.75 ± 1.080.56
Eggs1.91 ± 1.891.90 ± 1.740.953
Red meat0.48 ± 0.660.47 ± 0.440.833
White meat0.23 ± 0.170.32 ± 0.460.024
Fish/seafood0.38 ± 0.680.37 ± 0.610.957
Vegetables0.59 ± 0.700.64 ± 0.740.623
Fermented foods0.83 ± 1.650.96 ± 1.370.53
Kimchi2.64 ± 3.002.92 ± 3.220.492
Seaweed0.69 ± 1.370.66 ± 1.160.876
Potatoes0.34 ± 0.640.35 ± 0.660.986
Milk/dairy products1.37 ± 1.551.72 ± 1.970.11
Fruits0.51 ± 0.530.57 ± 0.600.401
Beverages1.80 ± 1.652.03 ± 1.720.289
Snacks1.05 ± 1.491.52 ± 2.070.033
Nuts0.19 ± 0.510.34 ± 1.350.171
Alcoholic beverages0.25 ± 0.450.44 ± 0.860.022
PMS, premenstrual syndrome.
Table 5. Odds ratio and 95% confidence intervals for PMS according to the major dietary patterns.
Traditional Diet PatternMeat and Alcohol PatternBread and Snack Pattern
OR (95% CI)p-ValueOR (95% CI)p-ValueOR (95% CI)p-Value
Model 1
T11.00 (Ref) 1.00 (Ref) 1.00 (Ref)
T21.070.8311.750.0761.910.039
(0.57–2.00)(0.94–3.26)(1.03–3.53)
T30.910.9051.820.0602.630.003
(0.49–1.68)(0.97–3.40)(1.39–5.00)
Model 2
T11.00 (Ref) 1.00 (Ref) 1.00 (Ref)
T21.110.7511.800.0681.870.048
(0.59–2.09)(0.96–3.36)(1.01–3.48)
T31.030.9271.860.0532.610.003
(0.54–1.98)(0.99–3.49)(1.37–4.97)
Model 3
T11.00 (Ref) 1.00 (Ref) 1.00 (Ref)
T21.170.6351.530.2051.880.056
(0.61–2.29)(0.79–2.95)(0.98–3.58)
T31.130.7351.600.1602.590.006
(0.56–2.30)(0.83–2.09)(1.32–5.06)
Ref, reference; PMS, premenstrual syndrome; OR, odds ratio; 95% CI, 95% confidence interval. Model 1: unadjusted model. Model 2: Adjusted for age and body mass index. Model 3: Adjusted for age, body mass index, smoking status, alcohol drinking status, and physical activity.
Publisher’s Note: MDPI stays neutral with regard to jurisdictional claims in published maps and institutional affiliations.

