
Evaluation of a Novel WeChat Applet for Image-Based Dietary Assessment among Pregnant Women in China


Abstract
:
1. Introduction
2. Materials and Methods
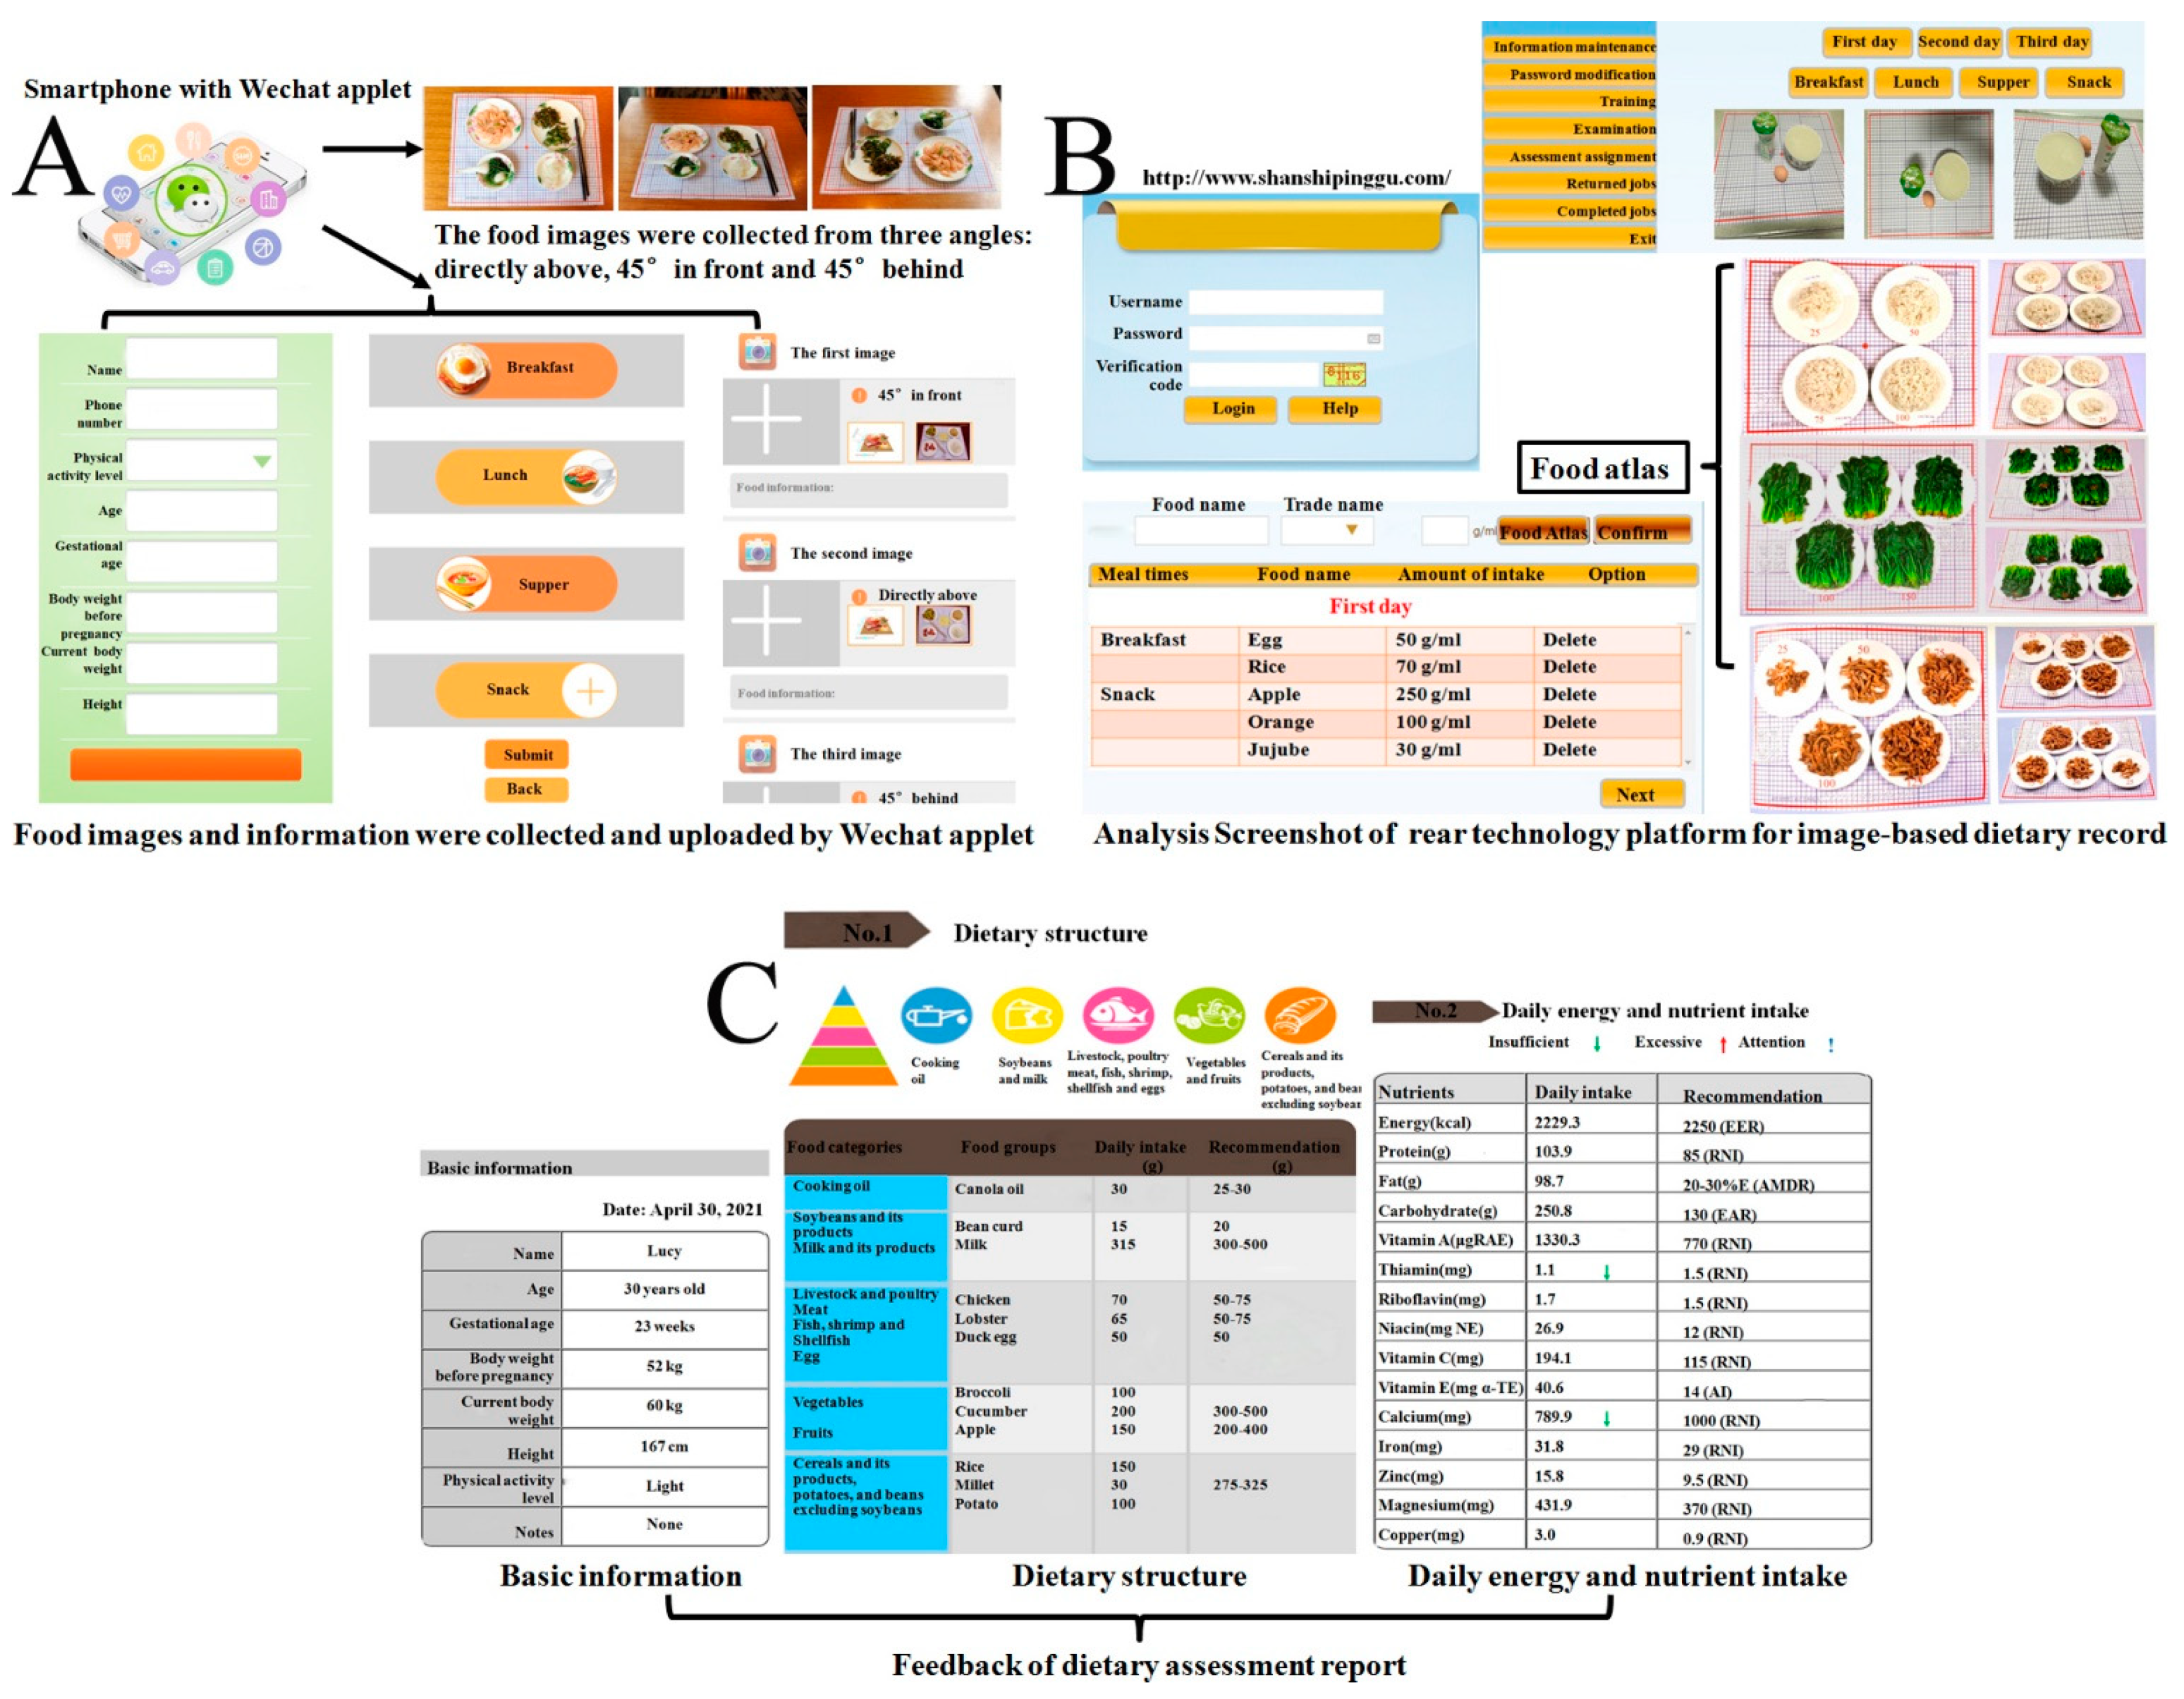
2.1. Overview of the WAIDA
2.2. Validation of the WAIDA
2.2.1. Participants
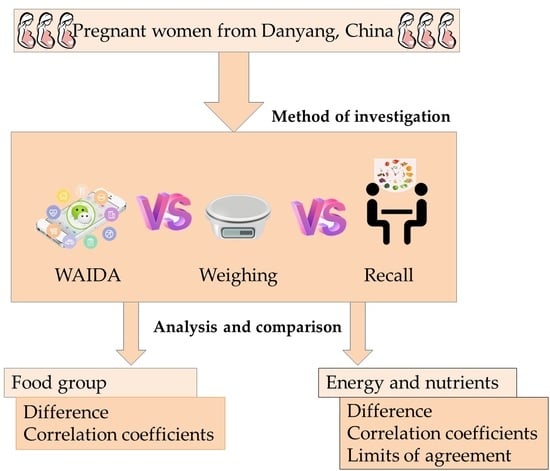
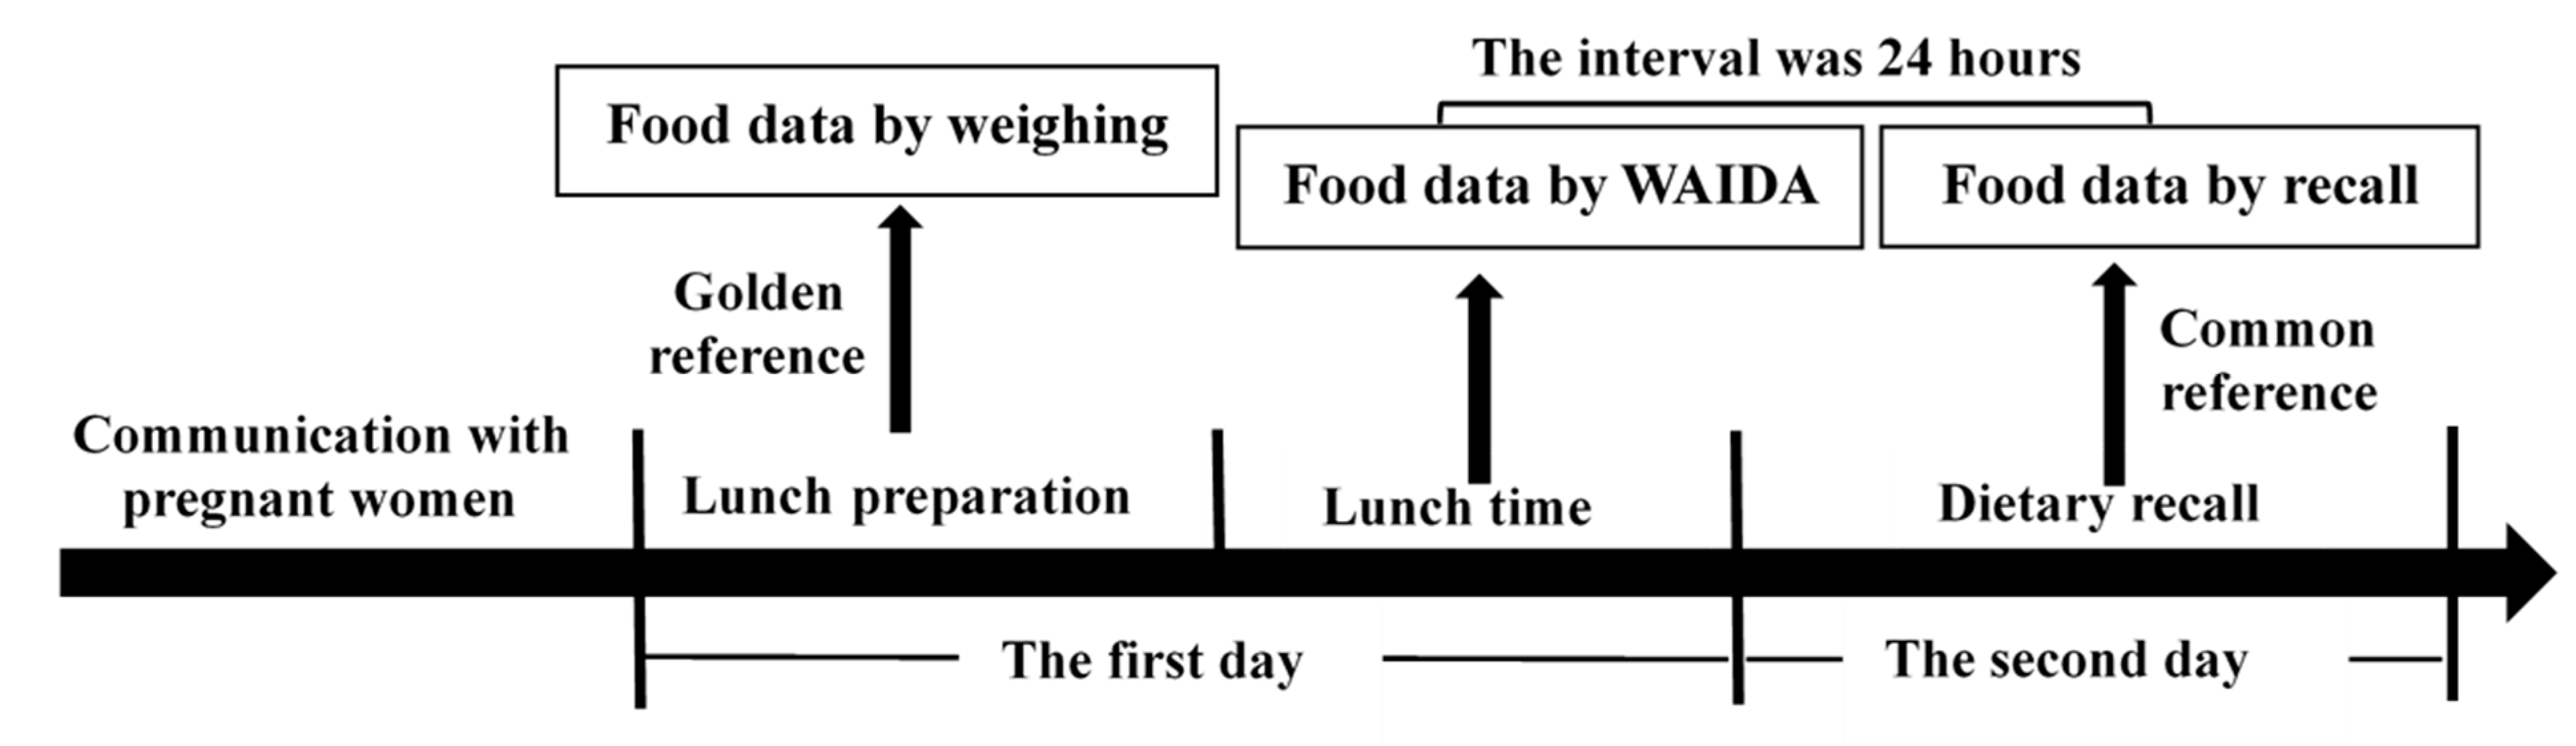
2.2.2. Study Design
2.2.3. Lunch Preparation and Food Weighing
2.2.4. The WAIDA Method
2.2.5. The Recall Method
2.3. Statistical Analysis
3. Results
3.1. Comparison and Correlation Analysis between Food Weights Estimated by the Recall or WAIDA Method with the Actual Food Weight
3.2. Comparison and Correlation Analysis of Energy and Nutrient Intakes Derived from the Recall or WAIDA Method with the Weighing Method
3.3. Bland-Altman Analysis of Energy and Nutrient Intakes from Those Estimated by the Weighing Method and the Recall or WAIDA Method
4. Discussion
5. Conclusions
Author Contributions
Funding
Institutional Review Board Statement
Informed Consent Statement
Data Availability Statement
Acknowledgments
Conflicts of Interest
References
- Kozlowska, A.; Jagielska, A.M.; Okreglicka, K.M.; Dabrowski, F.; Kanecki, K.; Nitsch-Osuch, A.; Wielgos, M.; Bomba-Opon, D. Dietary vitamin and mineral intakes in a sample of pregnant women with either gestational diabetes or type 1 diabetes mellitus, assessed in comparison with Polish nutritional guidelines. Ginekol. Polska 2018, 89, 581–586. [Google Scholar] [CrossRef] [PubMed]
- Chango, A.; Pogribny, I.P. Considering Maternal Dietary Modulators for Epigenetic Regulation and Programming of the Fetal Epigenome. Nutrients 2015, 7, 2748–2770. [Google Scholar] [CrossRef] [PubMed] [Green Version]
- Huybregts, L.; Roberfroid, D.; Lachat, C.; Van Camp, J.; Kolsteren, P. Validity of photographs for food portion estimation in a rural West African setting. Public Health Nutr. 2008, 11, 581–587. [Google Scholar] [CrossRef] [PubMed] [Green Version]
- Howat, P.M.; Mohan, R.; Champagne, C.; Monlezun, C.; Wozniak, P.; A Bray, G. Validity and reliability of reported dietary intake data. J. Am. Diet. Assoc. 1994, 94, 169–173. [Google Scholar] [CrossRef]
- Kohlmeier, L. Gaps in dietary assessment methodology: Meal- vs list-based methods. Am. J. Clin. Nutr. 1994, 59, 175S–179S. [Google Scholar] [CrossRef]
- Gibson, R.S. Principles of Nutritional Assessment, 2nd ed.; Oxford University Press: New York, NY, USA, 2005. [Google Scholar]
- Martin, C.K.; Correa, J.; Han, H.; Allen, H.R.; Rood, J.C.; Champagne, C.M.; Gunturk, B.; Bray, G.A. Validity of the Remote Food Photography Method (RFPM) for Estimating Energy and Nutrient Intake in Near Real-Time. Obesity 2012, 20, 891–899. [Google Scholar] [CrossRef] [Green Version]
- Martin, C.K.; Nicklas, T.; Gunturk, B.; Correa, J.; Allen, H.R.; Champagne, C. Measuring food intake with digital photography. J. Hum. Nutr. Diet. 2013, 27, 72–81. [Google Scholar] [CrossRef] [Green Version]
- Ptomey, L.T.; Willis, E.A.; Goetz, J.R.; Lee, J.; Sullivan, D.K.; Donnelly, J.E. Digital photography improves estimates of dietary intake in adolescents with intellectual and developmental disabilities. Disabil. Health J. 2015, 8, 146–150. [Google Scholar] [CrossRef]
- Prinz, N.; Bohn, B.; Kern, A.; Püngel, D.; Pollatos, O.; Holl, R.W. Feasibility and relative validity of a digital photo-based dietary assessment: Results from the Nutris-Phone study. Public Health Nutr. 2018, 22, 1–8. [Google Scholar] [CrossRef]
- Six, B.L.; Schap, T.E.; Zhu, F.M.; Mariappan, A.; Bosch, M.; Delp, E.; Ebert, D.S.; Kerr, D.A.; Boushey, C.J. Evidence-Based Development of a Mobile Telephone Food Record. J. Am. Diet. Assoc. 2010, 110, 74–79. [Google Scholar] [CrossRef] [Green Version]
- Cyberspace Administration of China. The 47th China Statistical Peport on Internet Development. Available online: http://www.cac.gov.cn/2021-02/03/c_1613923423079314.htm# (accessed on 8 June 2021).
- People’s Posts and Telecommunications News (PPTN). Digital Economy. Available online: http://paper.cnii.com.cn/article/rmydb_15826_299023.html (accessed on 5 June 2021).
- Science on WeChat. Nat. Methods 2020, 17, 863. Available online: https://www.nature.com/articles/s41592-020-0954-1#citeas (accessed on 1 September 2020). [CrossRef]
- Zhang, X.; Wen, D.; Liang, J.; Lei, J. How the public uses social media wechat to obtain health information in china: A survey study. BMC Med. Inform. Decis. Mak. 2017, 17, 71–79. [Google Scholar] [CrossRef] [PubMed]
- Baidu Encyclopedia WeChat. Available online: http://baike.baidu.com/subview/5117297/15145056.htm (accessed on 8 June 2021).
- Ngo, J.; Engelen, A.; Molag, M.; Roesle, J.; García-Segovia, P.; Serra-Majem, L. A review of the use of information and communication technologies for dietary assessment. Br. J. Nutr. 2009, 101, S102–S112. [Google Scholar] [CrossRef] [PubMed] [Green Version]
- Ambrosini, G.L.; Hurworth, M.; Giglia, R.; Trapp, G.; Strauss, P. Feasibility of a commercial smartphone application for dietary assessment in epidemiological research and comparison with 24-h dietary recalls. Nutr. J. 2018, 17, 5. [Google Scholar] [CrossRef]
- Hanks, A.S.; Wansink, B.; Just, D.R. Reliability and Accuracy of Real-Time Visualization Techniques for Measuring School Cafeteria Tray Waste: Validating the Quarter-Waste Method. J. Acad. Nutr. Diet. 2014, 114, 470–474. [Google Scholar] [CrossRef] [PubMed] [Green Version]
- Li, J.R.; Hsieh, Y.H. Traditional Chinese food technology and cuisine. Asia Pac. J. Clin. Nutr. 2004, 13, 147–155. [Google Scholar]
- Gangwei, P.; Mo, Z.; Shijun, L.; Jiazhang, H. Study on the use of cooking oil in Chinese dishes. Int. J. Environ. Res. Public Health 2019, 16, 3367. [Google Scholar]
- Chinese Nutrition Society. Chinese Dietary Guidelines; People’s Medical Publishing House Press: Beijing, China, 2016. [Google Scholar]
- Chinese Nutrition Society. Chinese Dietary Reference Intakes; Science Press: Beijing, China, 2014. [Google Scholar]
- Yang, Y.; Wang, G.; Pan, X. China Food Composition Tables, 6th ed.; Peking University Medical Press: Beijing, China, 2019. [Google Scholar]
- Linusson, E.E.I.; Sanjur, D.; Erickson, E.C. Validating the 24-hour recall method as a dietary survey tool. Arch. Latinoam. Nutr. 1974, 24, 277–294. [Google Scholar]
- Marcano-Olivier, M.; Erjavec, M.; Horne, P.J.; Viktor, S.; Pearson, R. Measuring lunchtime consumption in school cafeterias: A validation study of the use of digital photography. Public Health Nutr. 2019, 22, 1745–1754. [Google Scholar] [CrossRef] [Green Version]
- Lassen, A.D.; Poulsen, S.; Ernst, L.; Andersen, K.K.; Biltoft-Jensen, A.P.; Tetens, I. Evaluation of a digital method to assess evening meal intake in a free-living adult population. Food Nutr. Res. 2010, 54. [Google Scholar] [CrossRef]
- Naaman, R.; Parrett, A.; Bashawri, D.; Campo, I.; Fleming, K.; Nichols, B.; Burleigh, E.; Murtagh, J.; Reid, J.; Gerasimidis, K. Assessment of Dietary Intake Using Food Photography and Video Recording in Free-Living Young Adults: A Comparative Study. J. Acad. Nutr. Diet. 2020, 121, 749–761.e1. [Google Scholar] [CrossRef]
- Christoph, M.J.; Loman, B.R.; Ellison, B. Developing a digital photography-based method for dietary analysis in self-serve dining settings. Appetite 2017, 114, 217–225. [Google Scholar] [CrossRef]
- Ding, Y.; Yang, Y.; Li, F.; Shao, Y.; Sun, Z.; Zhong, C.; Fan, P.; Li, Z.; Zhang, M.; Li, X.; et al. Development and validation of a photographic atlas of food portions for accurate quantification of dietary intakes in China. J. Hum. Nutr. Diet. 2021, 34, 604–615. [Google Scholar] [CrossRef]
- Wang, D.-H.; Kogashiwa, M.; Ohta, S.; Kira, S. Validity and reliability of a dietary assessment method: The application of a digital camera with a mobile phone card attachment. J. Nutr. Sci. Vitaminol. 2002, 48, 498–504. [Google Scholar] [CrossRef] [PubMed]
- Wang, D.-H.; Kogashiwa, M.; Kira, S. Development of a New Instrument for Evaluating Individuals’ Dietary Intakes. J. Am. Diet. Assoc. 2006, 106, 1588–1593. [Google Scholar] [CrossRef] [PubMed]
- Williamson, D.A.; Allen, H.; Martin, P.D.; Alfonso, A.J.; Gerald, B.; Hunt, A. Comparison of digital photography to weighed and visual estimation of portion sizes. J. Am. Diet. Assoc. 2003, 103, 1139–1145. [Google Scholar] [CrossRef]
- Martin, C.K.; Han, H.; Coulon, S.M.; Allen, H.R.; Champagne, C.M.; Anton, S.D. A novel method to remotely measure food intake of free-living individuals in real time: The remote food photography method. Br. J. Nutr. 2008, 101, 446–456. [Google Scholar] [CrossRef] [PubMed] [Green Version]
- Pelly, F.E.; Thurecht, R. Evaluation of Athletes’ Food Choices during Competition with Use of Digital Images. Nutrients 2019, 11, 1627. [Google Scholar] [CrossRef] [PubMed] [Green Version]
- Daugherty, B.L.; E Schap, T.; Ettienne-Gittens, R.; Zhu, F.M.; Bosch, M.; Delp, E.J.; Ebert, D.S.; A Kerr, D.; Boushey, C.J.; Stumbo, P.; et al. Novel Technologies for Assessing Dietary Intake: Evaluating the Usability of a Mobile Telephone Food Record Among Adults and Adolescents. J. Med. Internet Res. 2012, 14, e58. [Google Scholar] [CrossRef]


| Food Groups | n | Methods | d (g) | D (g) | d% (%) | D% (%) |
|---|---|---|---|---|---|---|
| Cereals and potatoes | 269 | Recall | −19.95 ± 40.82 | 33.99 ± 30.11 | 18.14 ± 42.77 | 37.58 ± 27.24 |
| WAIDA | −6.80 ± 15.56 * | 13.33 ± 10.50 * | −8.42 ± 21.19 ** | 16.54 ± 15.67 ** | ||
| Rice and its products | 222 | Recall | 23.42 ± 41.56 | 37.24 ± 29.76 | 23.57 ± 38.90 | 37.94 ± 25.00 |
| WAIDA | −9.151 ± 14.98 ** | 14.25 ± 10.22 ** | −9.84 ± 17.04 ** | 15.61 ± 11.94 ** | ||
| Wheat and its products | 47 | Recall | −6.86 ± 34.66 | 20.50 ± 28.64 | 2.33 ± 47.14 | 34.80 ± 31.48 |
| WAIDA | −2.43 ± 14.58 | 9.29 ± 11.42 ** | 5.07 ± 33.51 | 19.94 ± 27.26 ** | ||
| Fish, shrimp, shellfish, eggs, livestock meat, and poultry | 528 | Recall | −4.75 ± 42.88 | 30.57 ± 30.42 | −1.16 ± 76.83 | 53.39 ± 55.21 |
| WAIDA | 1.42 ± 20.09 ** | 15.28 ± 13.10 ** | 4.64 ± 38.08 | 28.39 ± 25.78 ** | ||
| Fish, shrimp, and shellfish | 69 | Recall | 17.74 ± 55.74 | 42.18 ± 40.26 | 50.43 ± 104.11 | 80.13 ± 83.10 |
| WAIDA | 10.63 ± 17.97 | 15.04 ± 14.42 ** | 22.50 ± 35.89 * | 29.78 ± 30.03 ** | ||
| Eggs | 117 | Recall | −15.34 ± 27.96 | 24.12 ± 20.78 | −18.73 ± 61.87 | 42.80 ± 48.30 |
| WAIDA | −6.21 ± 18.51 ** | 15.35 ± 12.00 ** | −5.43 ± 37.71 * | 27.73 ± 26.01 ** | ||
| Livestock meat and poultry | 342 | Recall | −5.67 ± 42.60 | 30.43 ± 30.31 | −5.56 ± 70.68 | 51.62 ± 48.52 |
| WAIDA | 2.17 ± 21.13 ** | 15.31 ± 13.22 ** | 4.48 ± 37.44 ** | 28.34 ± 24.82 ** | ||
| Less than 100% can be eaten | 118 | Recall | 14.10 ± 53.22 | 38.56 ± 39.16 | 29.29 ± 88.74 | 61.19 ± 70.45 |
| WAIDA | 9.35 ± 22.01 | 19.12 ± 14.28 ** | 18.53 ± 37.47 | 31.58 ± 27.29 ** | ||
| 100% can be eaten | 224 | Recall | −16.09 ± 31.20 | 26.14 ± 23.38 | −23.92 ± 50.27 | 46.58 ± 30.36 |
| WAIDA | −1.62 ± 18.00 ** | 13.31 ± 12.19 ** | −2.92 ± 35.32 ** | 26.63 ± 23.31 ** | ||
| Fruits | 286 | Recall | −6.70 ± 46.27 | 30.41 ± 35.46 | −3.03 ± 57.04 | 40.57 ± 40.13 |
| WAIDA | −10.10 ± 23.10 | 18.32 ± 17.29 ** | −9.93 ± 26.88 * | 22.72 ± 17.41 ** | ||
| Fruit cut into pieces | 124 | Recall | −13.51 ± 57.75 | 37.88 ± 45.52 | −9.93 ± 65.33 | 47.64 ± 45.60 |
| WAIDA | −8.80 ± 27.08 | 20.20 ± 20.01 ** | −5.58 ± 30.17 | 23.88 ± 19.15 ** | ||
| Whole fruit | 162 | Recall | −1.48 ± 34.32 | 24.70 ± 23.80 | 2.25 ± 49.34 | 35.16 ± 34.58 |
| WAIDA | −11.09 ± 19.54 ** | 16.89 ± 14.79 ** | −13.26 ± 23.62 ** | 21.84 ± 15.96 ** | ||
| Vegetables | 464 | Recall | −11.71 ± 43.76 | 32.32 ± 31.71 | −11.22 ± 60.22 | 49.10 ± 36.56 |
| WAIDA | −1.18 ± 25.51 ** | 17.82 ± 18.27 ** | 5.71 ± 42.60 ** | 30.13 ± 30.63 ** | ||
| Root and stem vegetables | 75 | Recall | −5.69 ± 42.26 | 27.75 ± 32.22 | −3.93 ± 52.44 | 42.01 ± 31.25 |
| WAIDA | 5.44 ± 25.36 * | 15.89 ± 20.43 ** | 10.27 ± 35.07 * | 26.05 ± 25.47 ** | ||
| Melon and solanaceous vegetables | 129 | Recall | −6.17 ± 48.90 | 34.93 ± 34.64 | −4.85 ± 57.35 | 45.75 ± 34.70 |
| WAIDA | −1.81 ± 31.27 | 21.88 ± 22.34 ** | 12.97 ± 49.82 ** | 33.82 ± 38.72 ** | ||
| Mushrooms and algae vegetables | 73 | Recall | −8.10 ± 19.64 | 15.09 ± 14.88 | −7.15 ± 74.21 | 55.48 ± 49.38 |
| WAIDA | 0.19 ± 12.50 ** | 9.16 ± 8.44 ** | 5.57 ± 53.33 | 36.30 ± 39.26 ** | ||
| Leafy, flower, and sprout vegetables | 187 | Recall | −18.78 ± 46.32 | 38.68 ± 31.56 | −19.06 ± 59.09 | 51.67 ± 34.25 |
| WAIDA | −4.15 ± 24.19 ** | 18.96 ± 15.53 ** | −1.87 ± 32.98 ** | 26.61 ± 19.46 ** | ||
| All Kinds of food | 1547 | Recall | −9.87 ± 43.74 | 31.67 ± 31.73 | −7.50 ± 63.64 | 46.94 ± 43.61 |
| WAIDA | −0.52 ± 22.34 ** | 16.25 ± 15.33 ** | 2.94 ± 35.82 ** | 25.75 ± 25.06 ** |
| Food Groups | n | Recall | WAIDA | ||
|---|---|---|---|---|---|
| r | P | r | P | ||
| Cereals and potatoes | 269 | 0.545 | <0.001 | 0.916 | <0.001 |
| Rice and its products | 222 | 0.46 | <0.001 | 0.871 | <0.001 |
| Wheat and its products | 47 | 0.794 | <0.001 | 0.973 | <0.001 |
| Fish, shrimp, shellfish, eggs, livestock meat, and poultry | 528 | 0.359 | <0.001 | 0.781 | <0.001 |
| Fish, shrimp, and shellfish | 69 | 0.383 | 0.001 | 0.864 | <0.001 |
| Eggs | 117 | 0.218 | 0.018 | 0.589 | <0.001 |
| Livestock meat and poultry | 342 | 0.387 | <0.001 | 0.804 | <0.001 |
| Less than 100% can be eaten | 118 | −0.019 | 0.836 | 0.332 | <0.001 |
| 100% can be eaten | 224 | 0.543 | <0.001 | 0.869 | <0.001 |
| Fruits | 286 | 0.37 | <0.001 | 0.753 | <0.001 |
| Fruit cut into pieces | 124 | 0.309 | <0.001 | 0.739 | <0.001 |
| Whole fruit | 162 | 0.479 | <0.001 | 0.774 | <0.001 |
| Vegetables | 464 | 0.635 | <0.001 | 0.818 | <0.001 |
| Root and stem vegetables | 75 | 0.626 | <0.001 | 0.854 | <0.001 |
| Melon and solanaceous vegetables | 129 | 0.745 | <0.001 | 0.812 | <0.001 |
| Mushrooms and algae vegetables | 73 | 0.534 | <0.001 | 0.876 | <0.001 |
| Leafy, flower, and sprout vegetables | 187 | 0.371 | <0.001 | 0.709 | <0.001 |
| All Kinds of food | 1547 | 0.520 | <0.001 | 0.825 | <0.001 |
| Food Groups | Methods | d | D | d% (%) | D% (%) |
|---|---|---|---|---|---|
| Energy (kcal) | Recall | −107.79 ± 233.32 | 186.42 ± 176.66 | −16.41 ± 35.23 | 30.85 ± 23.57 |
| WAIDA | −3.28 ± 119.36 ** | 80.94 ± 87.64 ** | 0.41 ± 19.41 ** | 13.98 ± 13.43 ** | |
| Carbohydrate (g) | Recall | −10.17 ± 31.99 | 20.32 ± 26.70 | −16.09 ± 41.53 | 32.22 ± 30.69 |
| WAIDA | −2.22 ± 14.89 ** | 9.23 ± 11.88 ** | −1.28 ± 20.19 ** | 14.09 ± 14.49 ** | |
| Protein (g) | Recall | −5.66 ± 12.65 | 10.53 ± 8.99 | −14.20 ± 36.45 | 31.70 ± 22.84 |
| WAIDA | 0.66 ± 6.75 ** | 4.57 ± 5.00 ** | 1.41 ± 20.62 ** | 14.80 ± 14.40 ** | |
| Fat (g) | Recall | −5.08 ± 12.23 | 9.44 ± 9.28 | −15.39 ± 46.82 | 38.19 ± 31.08 |
| WAIDA | 0.31 ± 5.94 ** | 4.15 ± 4.26 ** | 1.25 ± 22.89 ** | 17.89 ± 14.30 ** | |
| Total fatty acid (g) | Recall | −5.24 ± 10.60 | 8.37 ± 8.33 | −18.98 ± 45.78 | 38.70 ± 30.89 |
| WAIDA | −0.90 ± 6.67 ** | 4.41 ± 5.06 ** | −3.12 ± 29.04 ** | 21.38 ± 19.86 ** | |
| SFA (g) ¹ | Recall | −2.21 ± 4.39 | 3.52 ± 3.42 | −19.07 ± 46.34 | 39.89 ± 31.52 |
| WAIDA | −0.38 ± 2.80 ** | 1.84 ± 2.14 ** | −2.84 ± 29.80 ** | 21.46 ± 20.82 ** | |
| MUFA (g) ² | Recall | −2.39 ± 5.09 | 3.90 ± 4.04 | −18.43 ± 48.39 | 40.35 ± 32.38 |
| WAIDA | −0.40 ± 3.20 ** | 2.10 ± 2.44 ** | −2.64 ± 30.96 ** | 22.70 ± 21.17 ** | |
| PUFA (g) ³ | Recall | −0.54 ± 1.06 | 0.85 ± 0.83 | −18.48 ± 40.90 | 35.49 ± 27.41 |
| WAIDA | −0.11 ± 0.73 ** | 0.46 ± 0.57 ** | −3.90 ± 26.64 ** | 20.08 ± 17.89 ** | |
| Vitamin A (μg RAE) 4 | Recall | −42.22 ± 95.25 | 61.01 ± 84.41 | −18.66 ± 37.43 | 34.58 ± 23.45 |
| WAIDA | −14.57 ± 73.67 ** | 37.64 ± 64.95 ** | −4.00 ± 28.52 ** | 21.69 ± 18.90 ** | |
| Vitamin E (mg) | Recall | −0.55 ± 1.33 | 0.90 ± 1.12 | −15.80 ± 36.42 | 32.30 ± 23.02 |
| WAIDA | −0.31 ± 1.18 ** | 0.54 ± 1.10 ** | −5.43 ± 25.82 ** | 17.97 ± 19.30 ** | |
| Vitamin C (mg) | Recall | −5.61 ± 21.20 | 16.04 ± 14.93 | −10.53 ± 45.48 | 36.66 ± 28.82 |
| WAIDA | −3.56 ± 15.22 | 9.82 ± 12.14 ** | −4.65 ± 34.91 ** | 23.32 ± 26.36 ** | |
| Folic acid (μg) | Recall | −22.94 ± 48.54 | 37.46 ± 38.42 | −17.70 ± 39.84 | 34.11 ± 27.09 |
| WAIDA | −8.83 ± 37.33 ** | 22.03 ± 31.38 ** | −3.89 ± 28.76 ** | 20.05 ± 20.94 ** | |
| Vitamin B6 (mg) | Recall | −0.21 ± 0.41 | 0.32 ± 0.32 | −18.86 ± 40.40 | 35.64 ± 26.72 |
| WAIDA | −0.06 ± 0.33 ** | 0.18 ± 0.28 ** | −2.77 ± 27.75 ** | 19.33 ± 20.06 ** | |
| Vitamin B12 (μg) | Recall | 0.12 ± 2.52 | 1.18 ± 2.23 | −13.84 ± 57.24 | 41.96 ± 41.24 |
| WAIDA | 0.25 ± 1.12 | 0.59 ± 0.98 ** | 2.60 ± 42.94 ** | 23.60 ± 35.93 ** | |
| Calcium (mg) | Recall | −24.27 ± 50.90 | 37.35 ± 42.20 | −17.14 ± 33.67 | 30.89 ± 21.70 |
| WAIDA | −7.81 ± 43.16 ** | 23.49 ± 37.01 ** | −4.24 ± 24.34 ** | 17.76 ± 17.13 ** | |
| Magnesium (mg) | Recall | −40.41 ± 151.45 | 58.28 ± 145.49 | −15.41 ± 32.00 | 28.79 ± 20.74 |
| WAIDA | −1.32 ± 82.08 ** | 30.80 ± 76.07 ** | −3.53 ± 20.48 ** | 15.18 ± 14.16 ** | |
| Iron (mg) | Recall | −6.79 ± 33.10 | 9.28 ± 32.47 | −17.56 ± 36.00 | 31.88 ± 24.19 |
| WAIDA | 0.62 ± 17.27 ** | 4.72 ± 16.62 ** | −4.73 ± 23.38 ** | 16.21 ± 17.47 ** | |
| Zinc (mg) | Recall | −0.82 ± 1.83 | 1.43 ± 1.40 | −16.44 ± 36.27 | 32.38 ± 23.11 |
| WAIDA | −0.14 ± 1.41 ** | 0.78 ± 1.18 ** | −2.14 ± 23.40 ** | 16.81 ± 16.38 ** |
| Energy and Nutrients | Recall | WAIDA | ||
|---|---|---|---|---|
| r | P | r | P | |
| Energy (kcal) | 0.509 | <0.001 | 0.865 | <0.001 |
| Carbohydrate (g) | 0.584 | <0.001 | 0.860 | <0.001 |
| Protein (g) | 0.48 | <0.001 | 0.887 | <0.001 |
| Fat (g) | 0.576 | <0.001 | 0.917 | <0.001 |
| Total fatty acid (g) | 0.593 | <0.001 | 0.863 | <0.001 |
| SFA ¹ (g) | 0.592 | <0.001 | 0.854 | <0.001 |
| MUFA ² (g) | 0.596 | <0.001 | 0.866 | <0.001 |
| PUFA ³ (g) | 0.605 | <0.001 | 0.840 | <0.001 |
| Vitamin A (μg RAE 4) | 0.815 | <0.001 | 0.893 | <0.001 |
| Vitamin E (mg) | 0.722 | <0.001 | 0.788 | <0.001 |
| Vitamin C (mg) | 0.676 | <0.001 | 0.797 | <0.001 |
| Folic acid (μg) | 0.656 | <0.001 | 0.792 | <0.001 |
| Vitamin B6 (mg) | 0.887 | <0.001 | 0.928 | <0.001 |
| Vitamin B12 (μg) | 0.865 | <0.001 | 0.970 | <0.001 |
| Calcium (mg) | 0.808 | <0.001 | 0.866 | <0.001 |
| Magnesium (mg) | 0.821 | <0.001 | 0.963 | <0.001 |
| Iron (mg) | 0.844 | <0.001 | 0.969 | <0.001 |
| Zinc (mg) | 0.555 | <0.001 | 0.752 | <0.001 |
| Energy and Nutrients | Weighing Method VS Recall Method | Weighing Method VS WAIDA Method | ||||
|---|---|---|---|---|---|---|
| Mean Differences (95% Confidence Interval) | 95%LOA 1 | Mean Differences (95% Confidence Interval) | 95%LOA | |||
| Lower Limit | Upper Limit | Lower Limit | Upper Limit | |||
| Energy (kcal) | −107.8 (−136.79; −78.78) | −565.1 | 349.5 | −3.28 (−18.12; 11.56) | −237.2 | 230.7 |
| Carbohydrate (g) | −10.17 (−14.15; −6.13) | −72.87 | 52.53 | −2.22 (−4.07; −0.37) | −31.41 | 26.96 |
| Protein (g) | −5.66 (−5.47; −4.09) | −30.45 | 19.12 | 0.66 (−0.18; 1.49) | −12.57 | 13.88 |
| Fat (g) | −5.08 (−6.60; −3.56) | −29.06 | 18.89 | 0.31 (−0.43; 1.05) | −11.33 | 11.95 |
| Total fatty acid (g) | −5.24 (−6.56; −3.92) | −26.01 | 15.53 | −0.90 (−1.73; −0.07) | −13.97 | 12.17 |
| SFA 2 (g) | −2.21 (−2.75; −1.66) | −10.80 | 6.39 | −0.38 (−0.73; −0.03) | −5.86 | 5.10 |
| MUFA 3 (g) | −2.39 (−3.02; −1.75) | −12.36 | 7.59 | −0.40 (−0.79; 0.00) | −6.66 | 5.87 |
| PUFA 4 (g) | −0.54 (−0.67; −0.41) | −2.62 | 1.54 | −0.11 (−0.20; −0.02) | −1.54 | 1.31 |
| Vitamin A (μg RAE 5) | −42.20 (−54.06; −30.38) | −228.9 | 144.5 | −14.57 (−23.73; −5.41) | −159.0 | 129.8 |
| Vitamin E (mg) | −0.55 (−0.71; −0.38) | −3.15 | 2.05 | −0.31 (−0.46; −0.16) | −2.63 | 2.01 |
| Vitamin C (mg) | −5.61 (−8.25; −2.98) | −47.16 | 35.95 | −3.56 (−5.45; −1.67) | −33.38 | 26.27 |
| Folic acid (μg) | −22.94 (−28.98; −16.91) | −118.1 | 72.20 | −8.83 (−13.47; −4.19) | −82.00 | 64.34 |
| Vitamin B6 (mg) | −0.21 (−0.26; −0.16) | −1.00 | 0.59 | −0.06 (−0.10; −0.02) | −0.71 | 0.58 |
| Vitamin B12 (μg) | 0.12 (−0.19; 0.44) | −4.81 | 5.06 | 0.25 (0.11;0.39) | −1.93 | 2.44 |
| Calcium (mg) | −24.26 (−30.59; −17.94) | −124.0 | 75.49 | −7.81 (−13.17; −2.44) | −92.4 | 76.78 |
| Magnesium (mg) | −40.41 (−59.24; −21.58) | −337.2 | 256.4 | −1.32 (−11.53; 8.88) | −162.2 | 159.5 |
| Iron (mg) | −6.79 (−10.91; −2.68) | −71.67 | 58.09 | 0.62 (−1.53; 2.77) | −33.23 | 34.47 |
| Zinc (mg) | −0.82 (−1.05; −0.60) | −4.41 | 2.76 | −0.14 (−0.32; 0.03) | −2.90 | 2.62 |
Publisher’s Note: MDPI stays neutral with regard to jurisdictional claims in published maps and institutional affiliations. |
© 2021 by the authors. Licensee MDPI, Basel, Switzerland. This article is an open access article distributed under the terms and conditions of the Creative Commons Attribution (CC BY) license (https://creativecommons.org/licenses/by/4.0/).
Share and Cite
Ding, Y.; Lu, X.; Xie, Z.; Jiang, T.; Song, C.; Wang, Z. Evaluation of a Novel WeChat Applet for Image-Based Dietary Assessment among Pregnant Women in China. Nutrients 2021, 13, 3158. https://doi.org/10.3390/nu13093158
Ding Y, Lu X, Xie Z, Jiang T, Song C, Wang Z. Evaluation of a Novel WeChat Applet for Image-Based Dietary Assessment among Pregnant Women in China. Nutrients. 2021; 13(9):3158. https://doi.org/10.3390/nu13093158
Chicago/Turabian StyleDing, Ye, Xiaolong Lu, Zhencheng Xie, Tingting Jiang, Chenglin Song, and Zhixu Wang. 2021. "Evaluation of a Novel WeChat Applet for Image-Based Dietary Assessment among Pregnant Women in China" Nutrients 13, no. 9: 3158. https://doi.org/10.3390/nu13093158
APA StyleDing, Y., Lu, X., Xie, Z., Jiang, T., Song, C., & Wang, Z. (2021). Evaluation of a Novel WeChat Applet for Image-Based Dietary Assessment among Pregnant Women in China. Nutrients, 13(9), 3158. https://doi.org/10.3390/nu13093158