Article

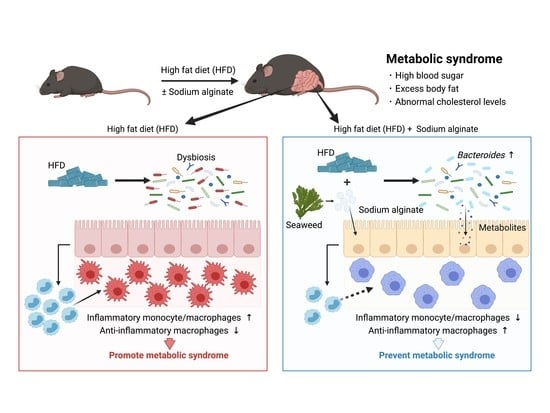
Seaweed Dietary Fiber Sodium Alginate Suppresses the Migration of Colonic Inflammatory Monocytes and Diet-Induced Metabolic Syndrome via the Gut Microbiota

1
Research Center for Drug Discovery, Faculty of Pharmacy and Graduate School of Pharmaceutical Sciences, Keio University, Tokyo 105-8512, Japan
2
Division of Biochemistry, Faculty of Pharmacy and Graduate School of Pharmaceutical Sciences, Keio University, Tokyo 105-8512, Japan
3
Kaigen Pharma Co., Ltd., Osaka 541-0045, Japan
4
Institute for Advanced Biosciences, Keio University, Yamagata 997-0052, Japan
5
Transborder Medical Research Center, University of Tsukuba, Ibaraki 305-8575, Japan
6
Intestinal Microbiota Project, Kanagawa Institute of Industrial Science and Technology, Kanagawa 210-0821, Japan
*
Author to whom correspondence should be addressed.
Nutrients 2021, 13(8), 2812; https://doi.org/10.3390/nu13082812
Submission received: 31 July 2021 / Revised: 13 August 2021 / Accepted: 13 August 2021 / Published: 16 August 2021
(This article belongs to the Special Issue Dietary Polysaccharides and Gut Microbiota Ecosystem)

Abstract

:
Metabolic syndrome (MetS) is a multifactorial chronic metabolic disorder that affects approximately one billion people worldwide. Recent studies have evaluated whether targeting the gut microbiota can prevent MetS. This study aimed to assess the ability of dietary fiber to control MetS by modulating gut microbiota composition. Sodium alginate (SA) is a seaweed-derived dietary fiber that suppresses high-fat diet (HFD)-induced MetS via an effect on the gut microbiota. We observed that SA supplementation significantly decreased body weight gain, cholesterol levels, and fat weight, while improving glucose tolerance in HFD-fed mice. SA changed the gut microbiota composition and significantly increased the abundance of Bacteroides. Antibiotic treatment completely abolished the suppressive effects of SA on MetS. Mechanistically, SA decreased the number of colonic inflammatory monocytes, which promote MetS development, in a gut microbiota-dependent manner. The abundance of Bacteroides was negatively correlated with that of inflammatory monocytes and positively correlated with the levels of several gut metabolites. The present study revealed a novel food function of SA in preventing HFD-induced MetS through its action on gut microbiota.

Graphical Abstract

1. Introduction

Metabolic syndrome (MetS) is a multifactorial chronic metabolic disorder characterized by obesity, insulin resistance, and hyperlipidemia, which leads to the development of type 2 diabetes. MetS affects more than one billion people worldwide and is closely associated with dietary habits, especially the consumption of high-fat foods, resulting in the accumulation of fat in various tissues due to an energy imbalance [1,2].
The gut microbiota influences various metabolic processes in the host. Many studies have reported that changes in the gut microbiota are closely linked to lipid and glucose metabolism, insulin resistance, energy metabolism, and immune function [3,4]. A high-fat diet (HFD) causes dysbiosis of the gut microbiota, in addition to its direct effects on the host metabolism [5]. This dysbiosis may promote metabolic abnormalities in the host by increasing energy harvesting, storage capacity, intestinal permeability, and inflammation [6].
Recent studies have evaluated whether targeting the gut microbiota can prevent HFD-induced MetS. For example, administration of probiotics Lactobacillus and Bifidobacterium species suppressed diet-induced obesity, which was associated with changes in gut microbiota composition and diversity [7,8,9]. In addition, supplementation of the probiotic yeast Saccharomyces boulardii to HFD-fed leptin-resistant obese and type 2 diabetic mice reduced body weight, fat mass, liver adiposity, and inflammatory tone, accompanied by dramatic changes in the composition of the gut microbiota [10].
Dietary fiber is a functional food that benefits the health of the host by causing specific changes in both the composition and activity of the gut microbiota [11]. Sodium alginate (SA), derived from brown algae, is a matrix polysaccharide that forms ~40% of the dry weight of the cell wall [12]. SA is used as an additive in processed foods, functioning as a food thickener, stabilizer, and gelling agent. In addition, as a dietary fiber, SA has been reported to reduce obesity and inflammation by decreasing blood glucose levels after meals, increasing fat excretion, and decreasing energy intake [13,14]. SA alters gut microbiota composition [15], which could regulate host metabolism. However, the role of SA in suppressing HFD-induced MetS through its action on the gut microbiota remains unclear.
In this study, we demonstrate that the gut microbiota contributes to the preventive effects of SA on MetS.

2. Materials and Methods

2.1. Animals and Diets

Wild-type (WT) C57BL/6 mice were purchased from Sankyo Labo Service Corporation (Tokyo, Japan). Ccr2−/− mice were generated by mating Ccr2−/+ mice, which were provided by Dr. Naofumi Mukaida, Kanazawa University, Ishikawa, Japan [16]. All mice were housed at the Keio University Faculty of Pharmacy, Tokyo. All experiments were approved by the ethics committee of the Keio University. Mice were fed a HFD from 9 weeks of age for 4 or 12 weeks. Compositions of the HFDs used in the study are listed in Table 1. We used two different HFDs with 60 kcal% fat and replaced cellulose with SA: a high fat purified diet with 50.0 g cellulose (D12492, HFD), or 11.3 g cellulose and 38.7 g SA (D18102802, 5% SA+HFD). The SA concentration was determined by preliminary experiments. All mice were maintained on a normal chow diet containing 22%, 23%, and 55% calories from fat, protein, and carbohydrates, respectively (CE-2, CLEA Japan, Inc., Tokyo, Japan), until the start of the experiments. At the end of the experimental period, blood was collected before euthanasia; organs such as the white adipose tissue (WAT) and liver were collected after euthanasia and weighed. The mice were fasted for approximately 12 h before euthanasia. In the experiments involving antibiotic (Abx) treatment, mice were administered drinking water containing erythromycin (200 mg/L) during HFD feeding.

2.2. Oral Glucose Tolerance Test (OGTT)

Mice were fasted for 6 h before the OGTT. Fasting glucose levels were measured using a OneTouch UltraVue glucometer (Johnson & Johnson, New Brunswick, NJ, USA) and LFS Quick Sensor (Johnson & Johnson). The fasted mice were orally gavaged with a 20% (w/v) glucose solution (2 g/kg body weight (BW)). Thereafter, blood glucose levels were measured at 15, 30, 60, and 120 min.

2.3. Total Blood Cholesterol

Blood was collected from the mice and centrifuged at 2000× g at 4 °C for 15 min with 1 µL of heparin sodium. The plasma supernatant was stored at −80 °C. Plasma cholesterol levels were measured using the FUJI DRI-CHEM SLIDE TCHO-PIII, FUJI DRI-CHEM SLIDE TG-PIII, and FUJI DRI-CHEM SYSTEM 7000i (Fujifilm, Tokyo, Japan).

2.4. Histological Analysis

Liver tissue samples were fixed in a 10% formalin neutral buffer solution (Mildform 10N, Wako Pure Chemical Industries, Ltd., Osaka, Japan). The fixed samples were embedded in paraffin, and the sections cut into 3 μm were deparaffinized, rehydrated, stained with hematoxylin (Agilent Technologies, Inc., Miami, FL, USA) and eosin (Wako, Osaka, Japan), and mounted using Mount-Quick (Daido Sangyo Co., Ltd., Tokyo, Japan).

2.5. Quantification of Hepatic Lipid Droplets in Hematoxylin–Eosin (H&E)-Stained Sections

To measure the hepatic lipid droplets, images of the sections from each sample were binarized using the imager R package (version 0.42.10, https://cran.r-project.org/), and the percentage of white area was calculated.

2.6. Sequencing and Processing of Bacterial 16S rRNA Genes in Fecal DNA

Bacterial DNA was extracted from the feces as described previously [17]. The V3–V4 region of the 16S gene was amplified using the KAPA HiFi HotStart ReadyMix (Nippon Genetics Co., Ltd., Tokyo, Japan) with the primer set (forward: 5ʹ-TCGTCGGCAGCGTCAGATGTGTATAAGAGACAGCCTACGGGNGGCWGCAG-3ʹ; reverse, 5ʹ-GTCTCGTGGGCTCGGAGATGTGTATAAGAGACAGGACTACHVGGGTATCT AATCC-3ʹ) and purified using AMPure XP (Beckman Coulter, Inc., Brea, CA, USA). Different index sequences were added to each DNA sample using the Nextera XT index kit (Illumina, Inc., San Diego, CA, USA). Then equal amounts of each amplified DNA sample were mixed and sequenced using a MiSeq System (Illumina, San Diego, CA, USA) with a 2 x 300-base-pair protocol (Miseq Reagent Kit V3, 600 cycles, Illumina). Sequencing data were analyzed using Qiime2 (version 2021.4) [18]. The primer region was trimmed from the raw sequences by employing Cutadapt in the Qiime2 plugin (https://doi.org/10.14806/ej.17.1.200, accessed on 27 May 2021). The primer-free sequences were processed with DADA2 [19] to remove PhiX contamination and PCR chimeras, trim reads, correct errors, and merge read pairs, and to obtain representative amplicon sequence variant (ASV) sequences. For each ASV-representative sequence, BLAST [20] was used to assign taxonomy based on the SILVA database (version 138) [21]. The representative ASV sequences and their abundances were extracted by feature table [22]; then, the compositional data were converted, and principal coordinate analysis (PCoA) was performed to analyze beta diversity using an unweighted UniFrac metric calculated by QIIME2.

2.7. Isolation of Colonic Lamina Propria Cells

Colonic lamina propria cells were isolated as previously described [23] with some modifications. The colons were opened longitudinally and washed vigorously with HBSS (Nacalai Tesque, Inc., Kyoto, Japan). Each colonic tissue was cut into four segments and stirred in HBSS containing 1 mM dithiothreitol, 20 mM EDTA, 10 µM DTT, and 12.5 mM HEPES (Nacalai Tesque) at 37 °C for 20 min two times. The tissues were then minced and dissociated with RPMI1640 (Nacalai Tesque) containing 0.125 mg/mL DNase I (Merck, Darmstadt, Germany), 0.2 U/mL Liberase TM (Roche Diagnostics, Mannheim, Germany), 2% NBCS (Thermo Fisher Scientific, Waltham, MA, USA), 100 U/mL penicillin, 100 µg/mL streptomycin (Nacalai Tesque), and 20 mM HEPES at 37 °C for 40 min. After filtering, the cell suspensions were washed with HBSS and subjected to flow cytometry analysis.

2.8. Flow Cytometry

Colonic lamina propria cells were incubated with the anti-mouse CD16/CD32 antibody (93; BioLegend, Inc., San Diego, CA, USA) to block Fc receptors and then stained using antibodies conjugated with eF450, Brilliant Violet 421 (BV), BV 510, FITC, Alexa Fluor 488, phycoerythrin (PE), PerCP-Cyanine5.5, PE-CF594, PE-Cy7, allophycocyanin (APC), or APC-Cy7.GATA3 (L50-823). The Ly6G (1A8), RORγt (Q31-378), Siglec-F (E50-2440), CD11c (HL3), and Ly6C (AL-21) antibodies were obtained from BD Biosciences (San Jose, CA, USA) CD45 (30-F11), whereas the CD3ε (145-2C11), F4/80 (BM1), CX3CR1 (SA011F11), T-bet (4B10), and F4/80 (BM8) antibodies were purchased from BioLegend. The MHC class II (M5/114.15.2), CD11b (M1/70), Foxp3 (FJK-16s), and CD4 (GK1.5) antibodies were acquired from eBioscience (San Diego, CA, USA). 7-AAD (BioLegend), or the Fixable Viability Stain 780 (BD Biosciences) was added to the cell suspension to label dead cells. Stained cells were analyzed using MACSQuant (Miltenyi Biotec, Bergisch Gladbach, Germany).

2.9. CE-TOFMS Metabolome Analysis

Fecal samples were freeze-dried and disrupted by vigorous shaking at 1500 rpm for 10 min with four 3 mm zirconia beads using a Shake Master NEO (Bio Medical Science, Tokyo, Japan). Fecal samples (10 ± 0.5 mg) were homogenized with 500 μL MeOH containing internal standards (20 μM each of methionine sulfone and D-camphor-10-sulfonic acid) and 100 mg of 0.1 mm and four 3 mm zirconia/silica beads (Biospec Products, Bartlesville, OK, USA). After vigorous shaking (1500 rpm for 5 min) using a Shake Master NEO (Bio Medical Science), 200 μL of Milli-Q water and 500 μL of chloroform were added, and the mixture was stirred again. After centrifugation at 4600× g and 4 °C for 15 min, the supernatant was transferred to a centrifugal filter tube with a 5 kDa limit. The filtrate was concentrated via centrifugation at 40 °C and reconstituted with 40 μL of Milli-Q water. Ionic metabolites were analyzed using CE-TOFMS in both the positive and negative modes [24]. All CE-TOFMS experiments were performed using an Agilent CE capillary electrophoresis system (Agilent Technologies). To identify peak annotation and quantification, the obtained data were processed using an in-house software (MasterHands) [25]. Principal component analysis (PCA) was based on Euclidean distances.

2.10. Statistical Analyses

Statistical analyses were performed using the GraphPad Prism software (version 9.1.2; GraphPad Software Inc.). Differences between two groups were evaluated using the D’Agostino and Pearson test and F-test, followed by the Student’s t-test, Welch’s t-test, or the Mann–Whitney U test. Comparisons of more than two groups were performed using two-way repeated measures ANOVA, followed by Šidák corrections for multiple comparisons. Spearman’s correlation analysis was performed on significantly changed gut microbiota and inflammatory monocytes (IMϕ or anti-inflammatory macrophages (AMϕ) using R. Differences were considered statistically significant at p < 0.05.

3. Results

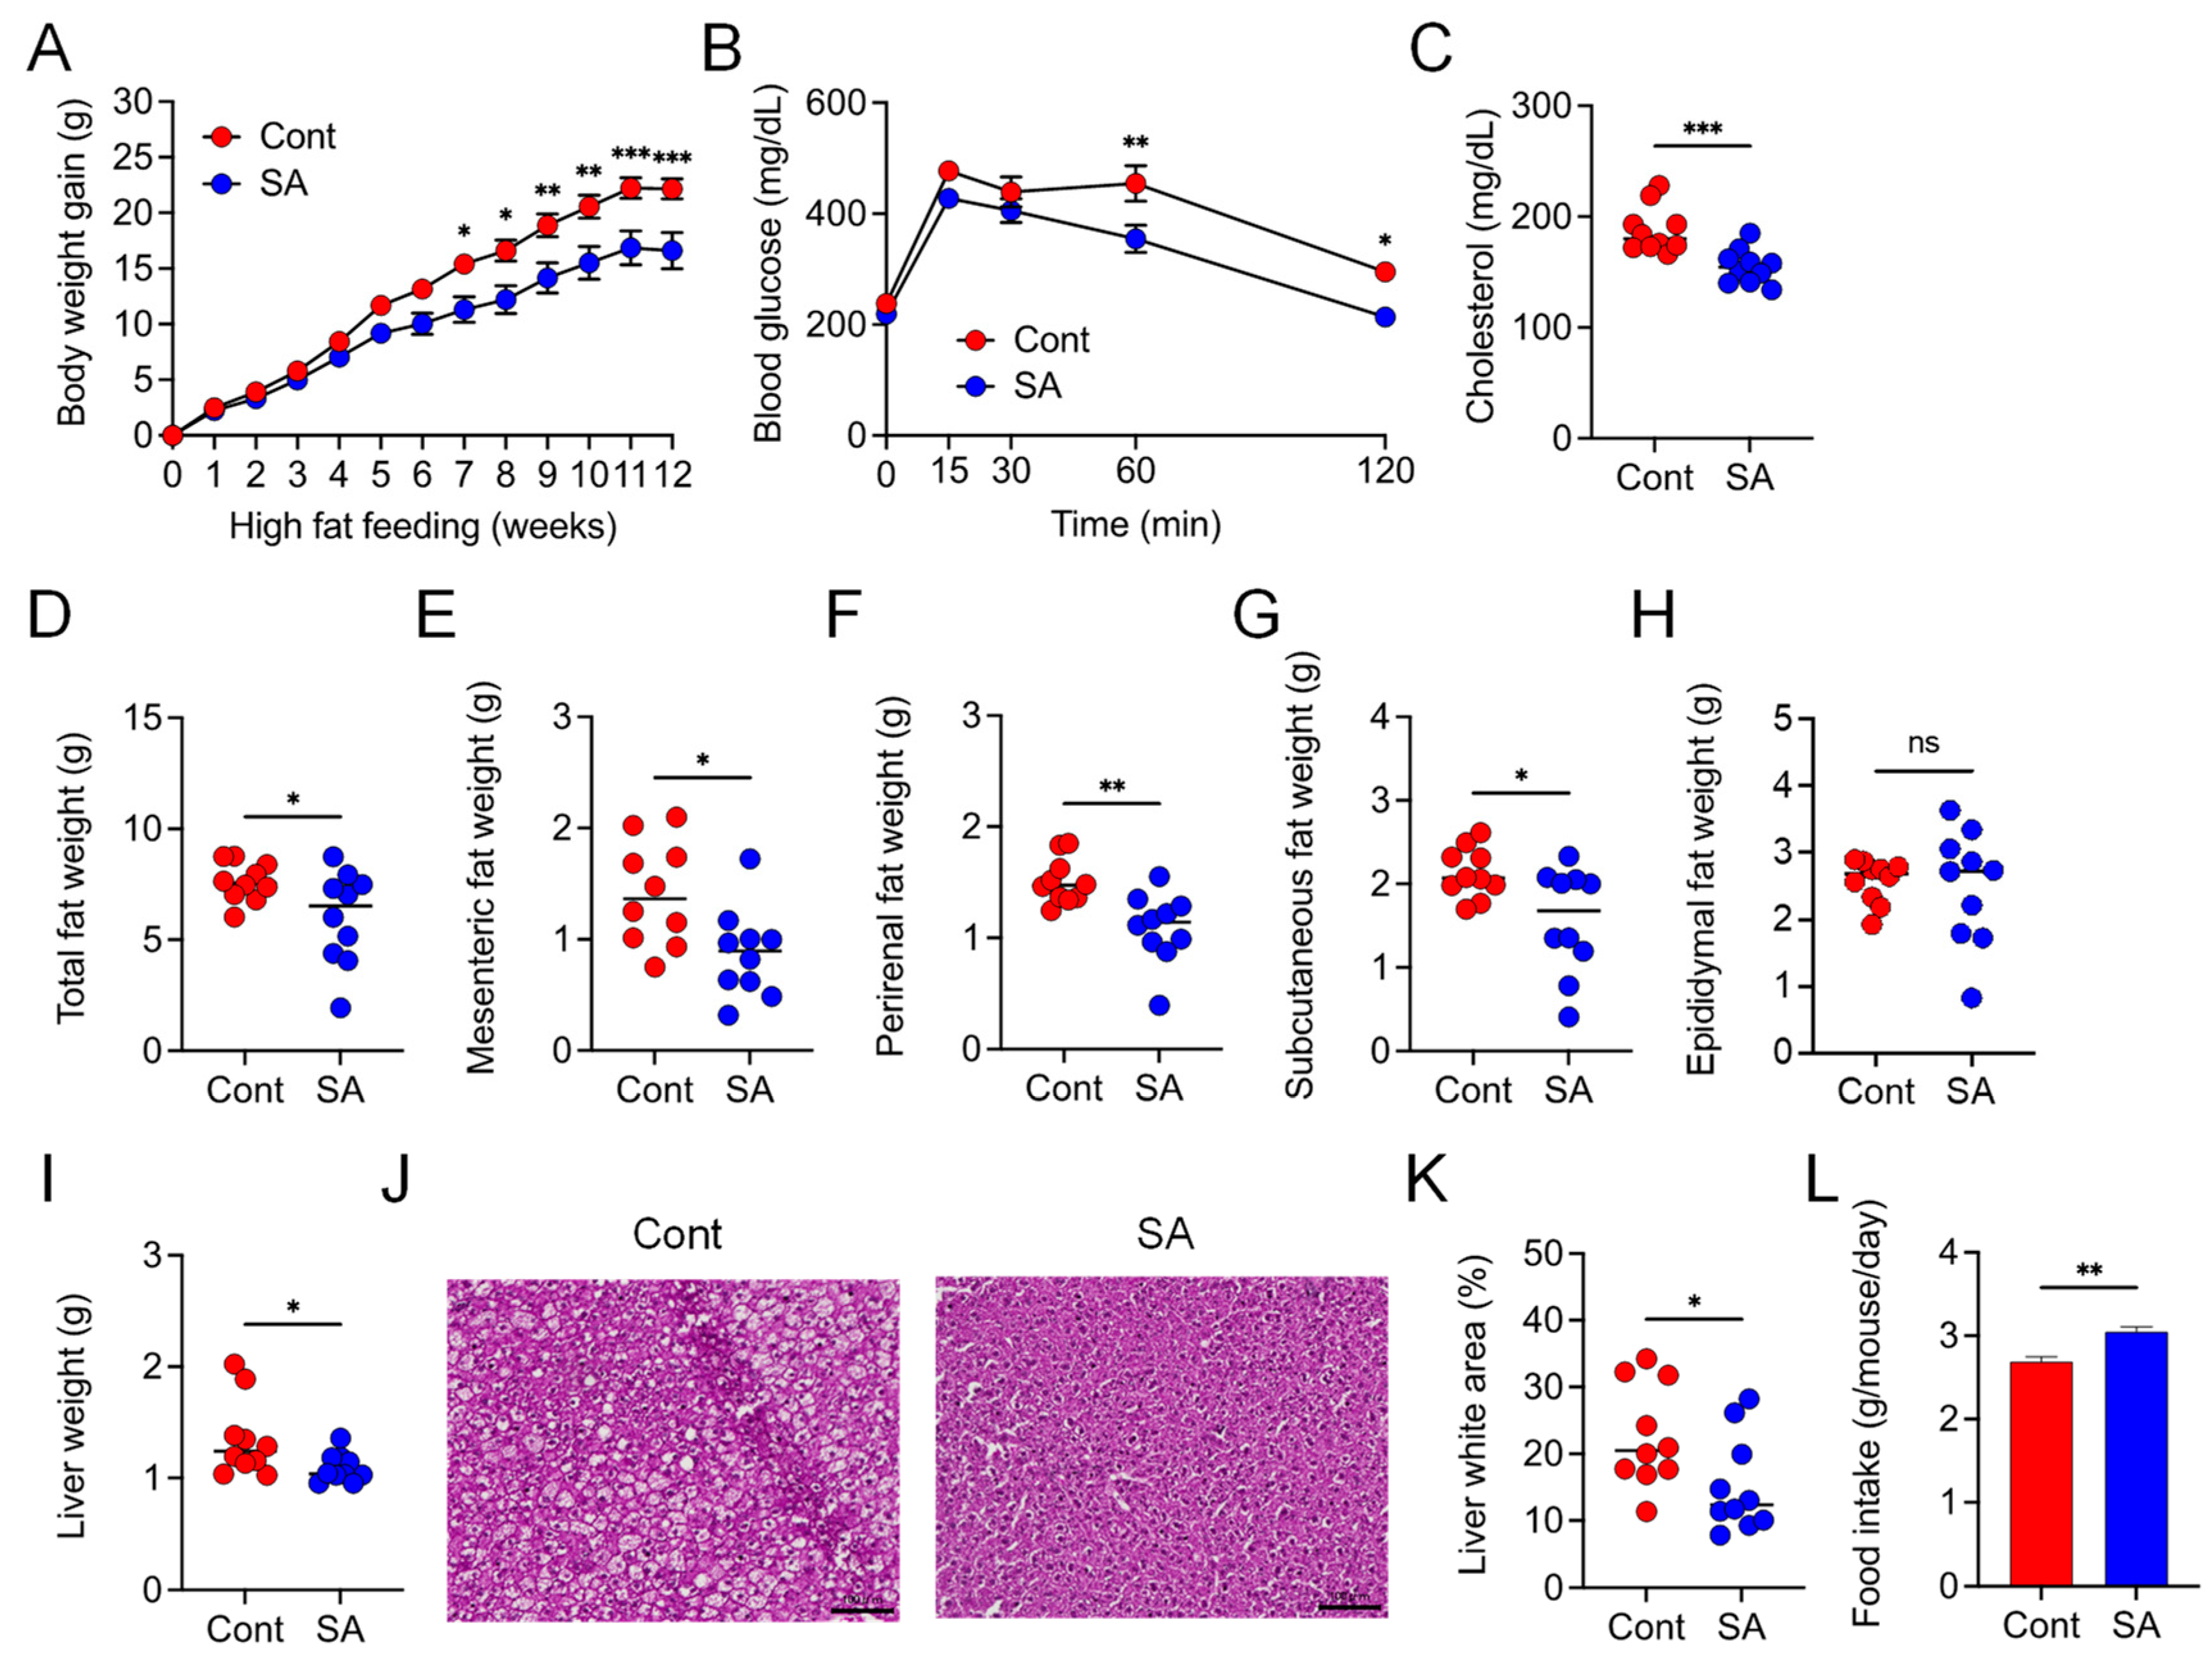
3.1. Dietary Supplementation with SA Suppresses HFD-Induced MetS

We first verified the inhibitory effect of SA on diet-induced MetS. Compared with controls, mice that were fed a HFD and treated with SA for 12 weeks exhibited reduced body weight gain and plasma cholesterol levels and improved glucose tolerance, as assessed by the OGTT (Figure 1A–C). In addition, the mesenteric, perirenal, subcutaneous, and total fat weights were significantly lower in the SA-treated group than in the controls (Figure 1D–G); however, there was no significant difference in the epididymal fat weight (Figure 1H). Liver weights were also lower in the SA-treated group than in the control group (Figure 1I). Furthermore, histological analysis revealed that the lipid droplet area in the liver was reduced after SA treatment (Figure 1J,K). Meanwhile, food intake was slightly increased in the SA-treated group than in controls (Figure 1L). Collectively, these results indicate that supplementing the diet with SA ameliorates HFD-induced MetS.

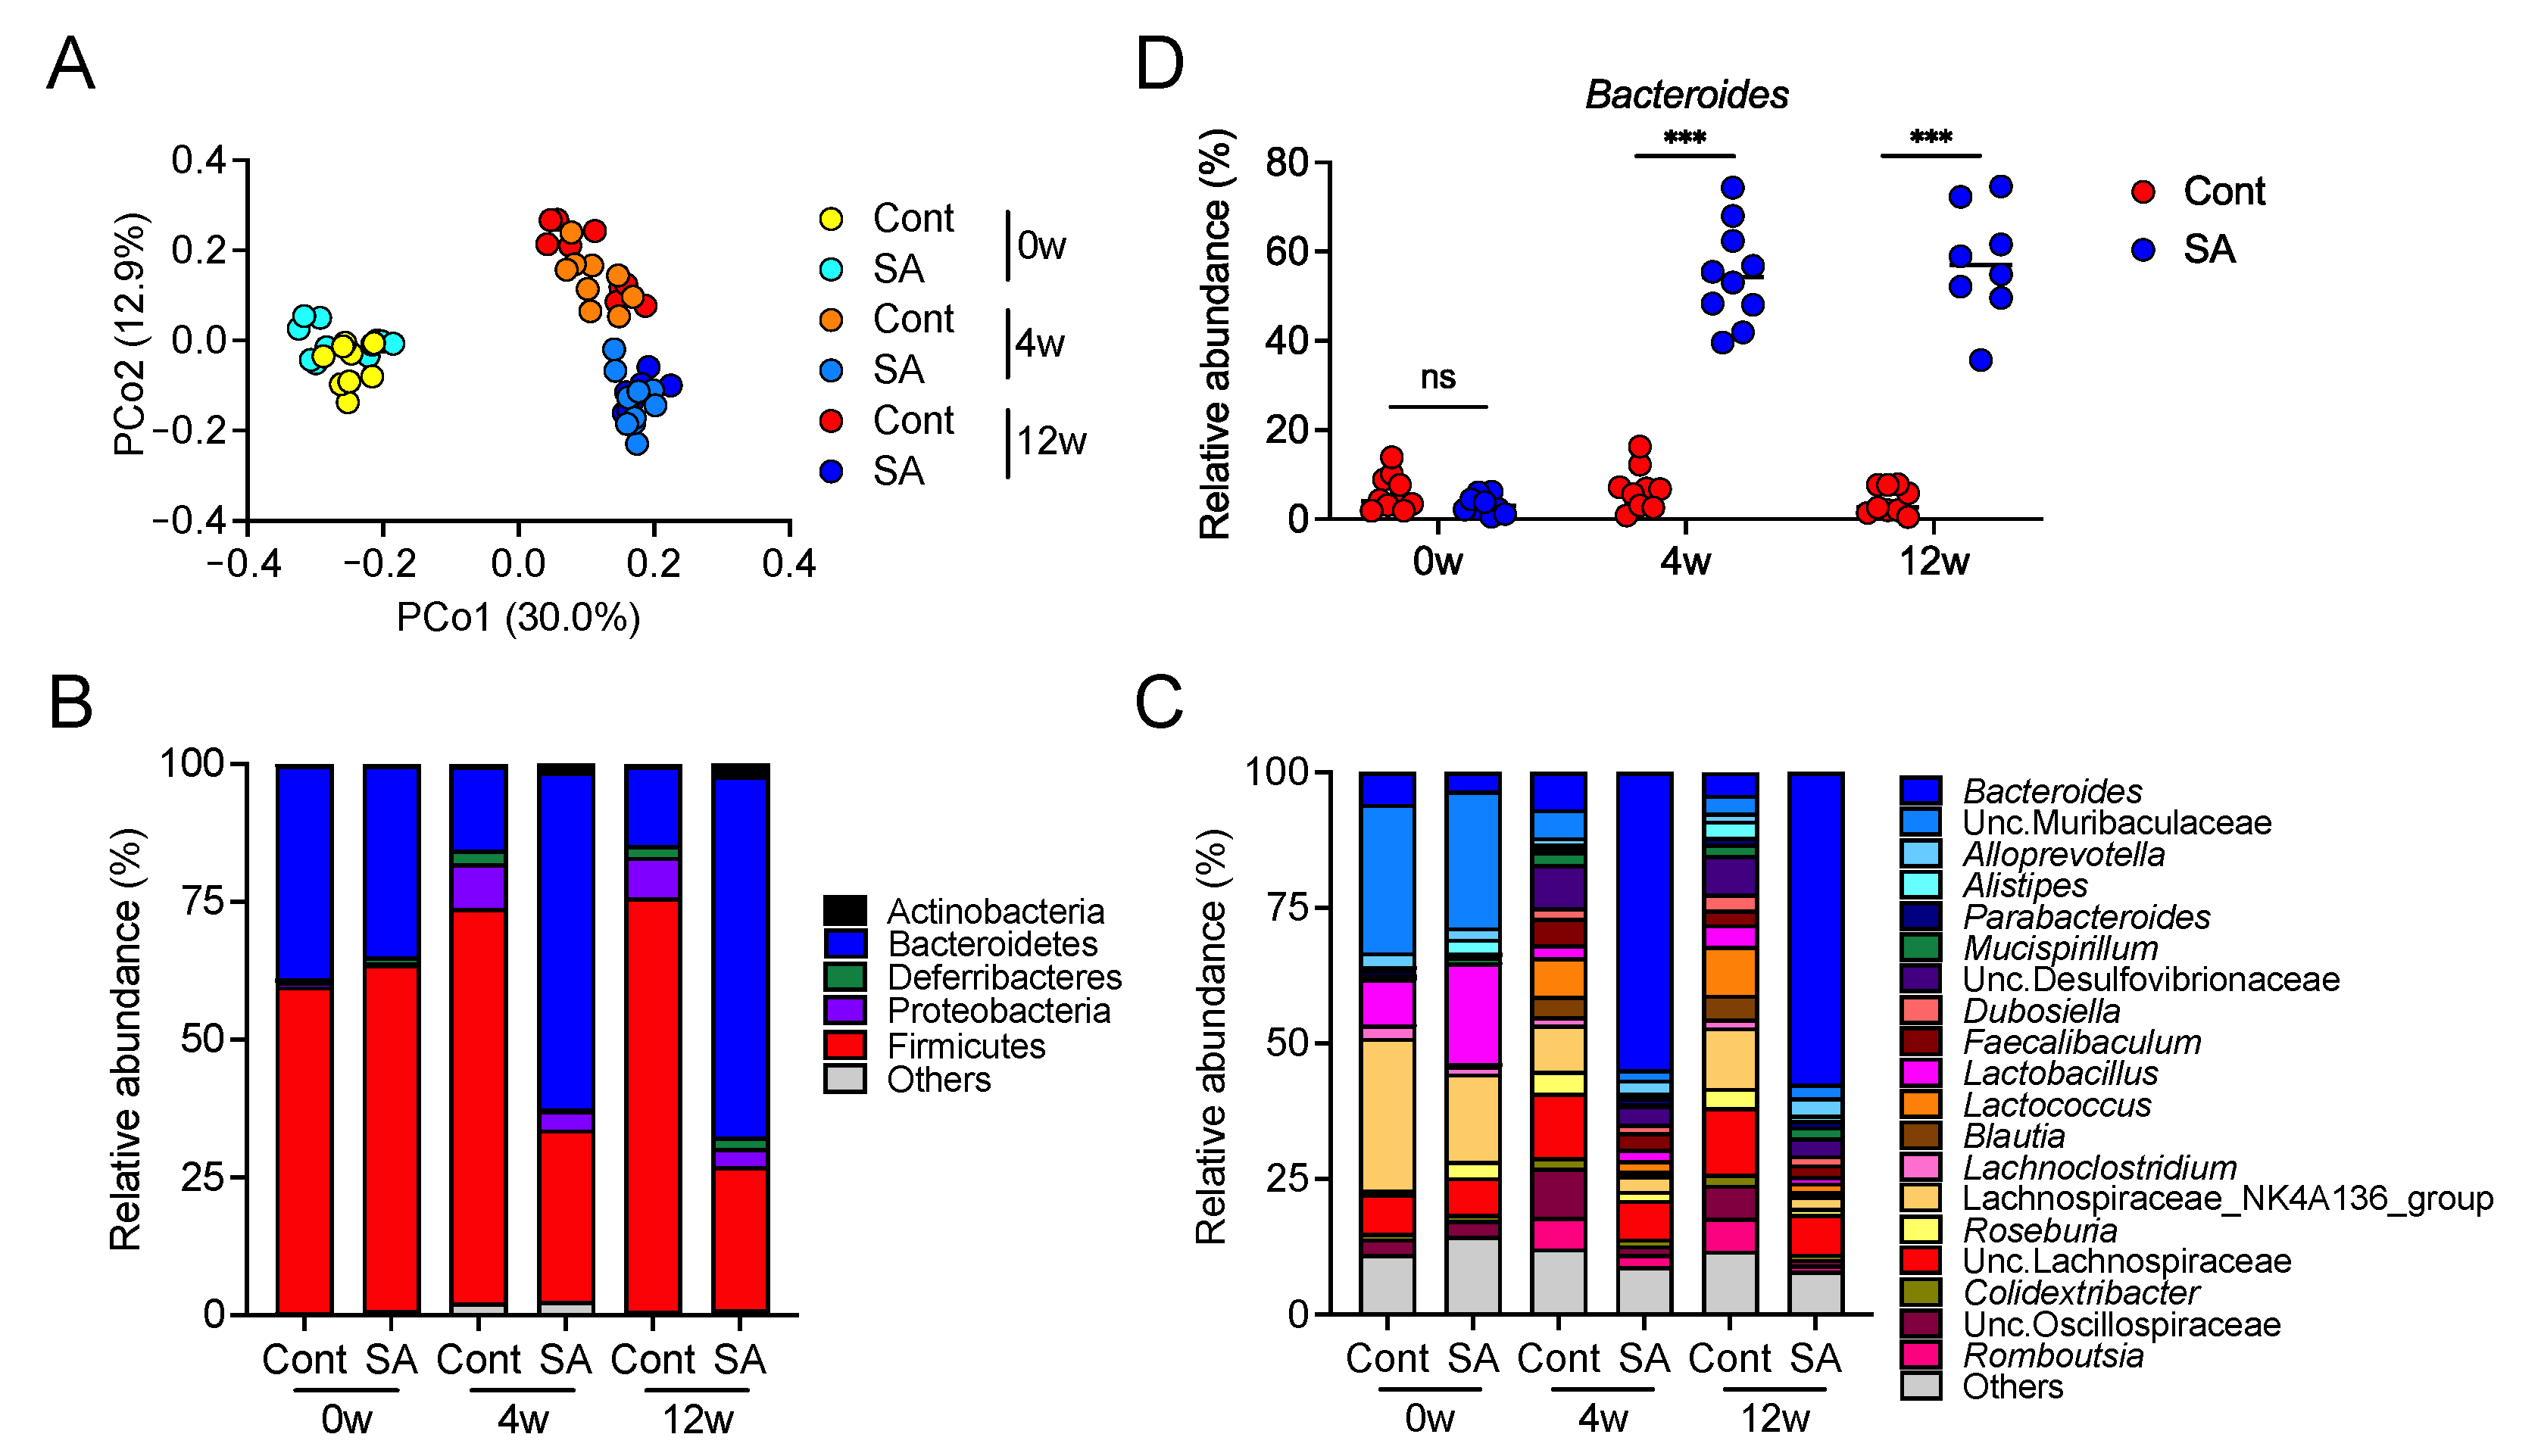
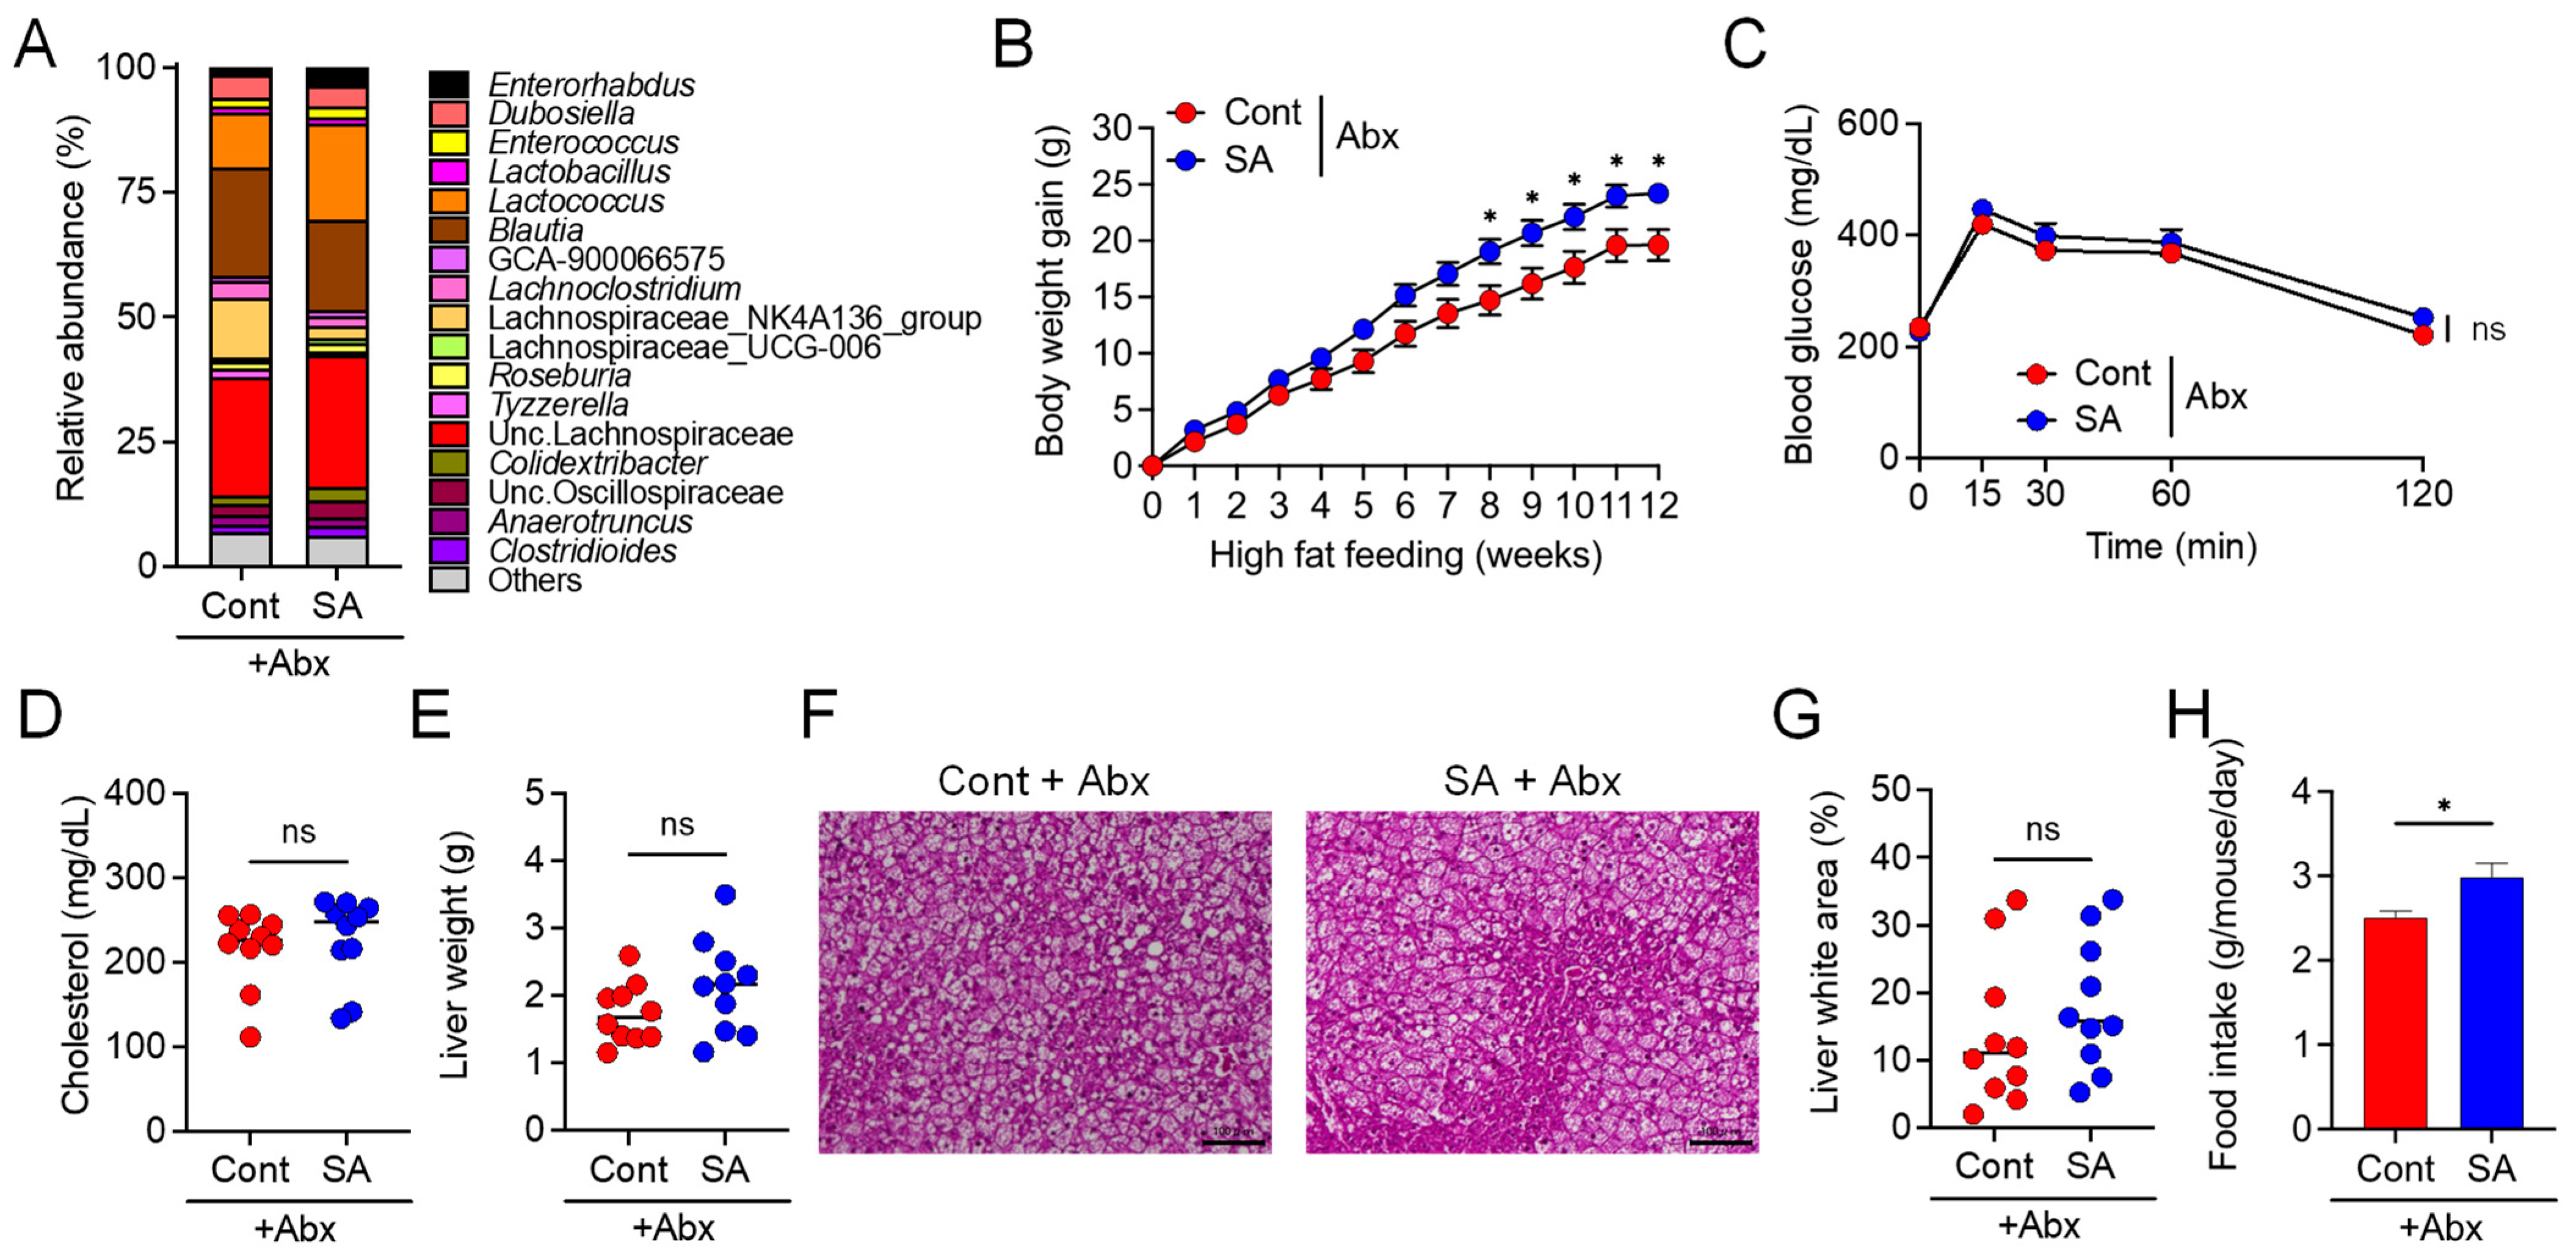
3.2. Suppression of Diet-Induced Obesity by SA Depends on the Gut Microbiota

Subsequently, we examined whether the inhibitory effects of SA on MetS depended on the gut microbiota. Analysis of the 16S ribosomal RNA (rRNA) genes of the mouse fecal microbiota revealed that HFD intake altered the gut microbiota composition. Moreover, these HFD-dependent changes in the gut microbiota composition differed between the control and SA-treated groups 4 weeks as well as 12 weeks after HFD intake (Figure 2A–C). HFD intake increased the abundance of Firmicutes and Proteobacteria and decreased the abundance of Bacteroidetes. Supplementation of HFD-fed mice with SA dramatically increased the abundance of Bacteroidetes and prevented the increase in Firmicutes and Proteobacteria (Figure 2B). Furthermore, supplementation with SA increased the abundance of the Bacteroides genus (Figure 2C). These results suggest that SA alters the gut microbiota composition and may ameliorate the effect of SA on HFD-induced MetS. To investigate whether the gut microbiota is required for the suppressive effects of SA, mice were maintained on a HFD, supplemented with or without SA and treated with Abx to deplete the microbiota. Gut microbiota composition was comparable between the control and SA-treated groups, and Bacteroides were undetectable following treatment with erythromycin (Figure 3A). SA treatment did not suppress but instead promoted body weight gain in response to HFD (Figure 3B). In addition, SA did not improve glucose tolerance (Figure 3C) or reduce plasma cholesterol levels (Figure 3D), liver weight (Figure 3E), or the lipid droplet area in the liver (Figure 3F,G). Food intake was slightly increased in the SA-treated group than in controls (Figure 3H). These results demonstrate that the preventive effect of SA on HFD-induced MetS depends on the gut microbiota.

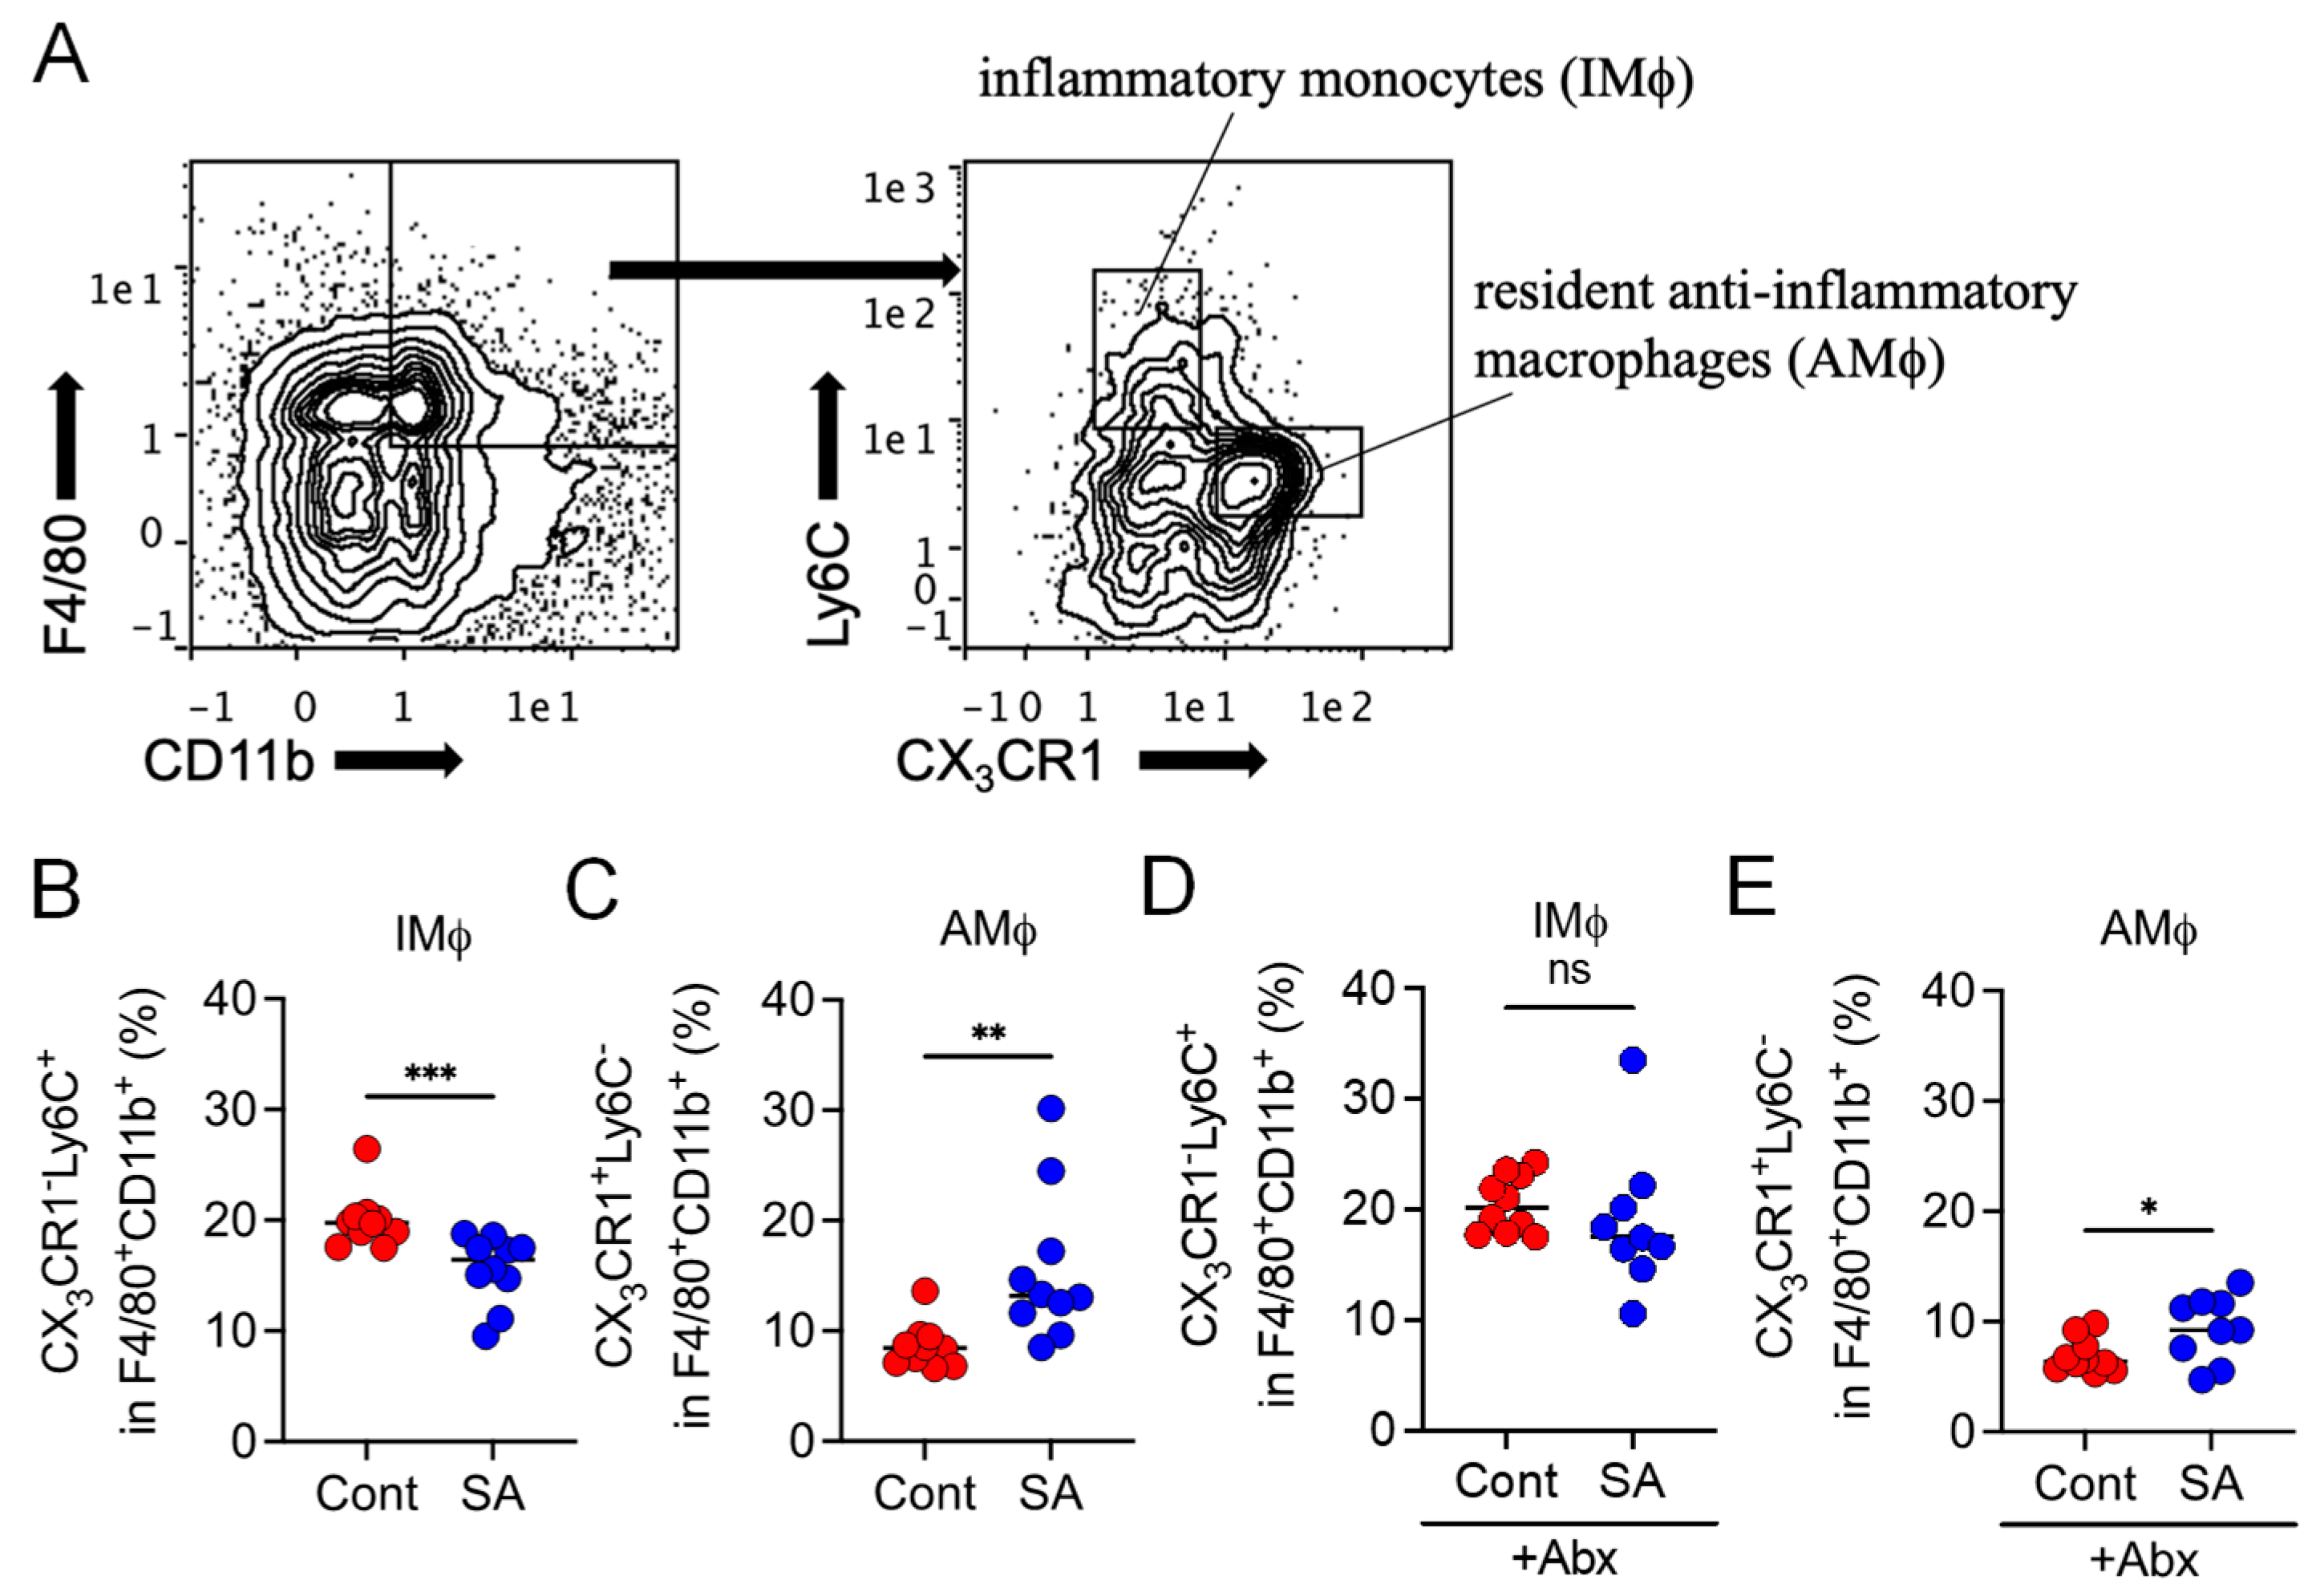
3.3. SA Reduces Colonic Inflammatory Monocytes in a Gut Microbiota-Dependent Manner

Next, we elucidated the mechanism by which SA suppresses MetS. Since the influx of inflammatory monocytes into the intestines of HFD-fed mice has been associated with metabolic dysfunction [26], we hypothesized that SA supplementation influences the macrophage population. To test this hypothesis, cells were isolated from colonic tissues, and the macrophage population was evaluated. Because SA had already changed the gut microbiota composition in 4 weeks when the difference in the weight gain was not observed after HFD intake, we assessed the cell population at this time point. Compared to the control mice, SA-treated mice displayed a decreased abundance of CD11b+F4/80+CX3CR1lowLy6C+ cells (IMϕ) and increased abundance of CD11b+F4/80+CX3CR1highLy6C cells (AMϕ) in the colon (Figure 4A,B). We next assessed whether alterations in the macrophage population due to SA were dependent on the gut microbiota. Abx treatment abolished the decrease in abundance of colonic IMϕ while still increasing the abundance of colonic AMϕ after SA supplementation (Figure 4C). The chemokine ligand 2 (CCL2)–CC chemokine receptor type 2 (CCR2) axis plays a critical role in the egress of Ly6C+ inflammatory monocytes from the bone marrow (BM) to the gut mucosa and is involved in insulin resistance [26]. Therefore, we assessed whether SA controls MetS via the CCL2–CCR2 axis. Although treatment with SA significantly increased the relative abundance of Bacteroides in the intestine of Ccr2−/− mice (Figure S1A), no significant differences were observed in body weight gain (Figure S1B), glucose tolerance (Figure S1C), blood cholesterol levels (Figure S1D), or fat weight (Figure S1E–J) in SA-treated mice compared to the control group 12 weeks after HFD intake. Food intake levels were comparable between the SA-treated and non-treated groups (Figure S1K). These results indicate that SA confers protective effects against MetS via the CCL2–CCR2 axis.
In addition to macrophages, we also monitored another population of immune cells in the intestine. The abundance of neutrophils (CD11b+Ly6G+Ly6C+, Figure S2A) and monocyte-derived dendritic cells (CD11c+CD11b+MHCII+Ly6C+, Figure S2B), which differentiate from Ly6C+ IMϕ [27], was significantly lower, while that of conventional dendritic cells (CD11c+CD11b+MHCII+Ly6C, Figure S2C) [28] was higher in the colonic tissues from the SA-treated mice than those from the controls. The abundance of eosinophils (CD11b+F4/80+SiglecF+) was comparable between the colonic tissues from SA-treated mice and those from the controls (Figure S2D). These differences were not observed after Abx treatment (Figure S2E–G). No difference was observed in the population of CD4+ T cell subsets, namely, T helper type-1, -2, and -17 cells, and T-regulatory cells, between the control and SA-treated groups (Figure S3).
Collectively, we concluded that SA intake regulates the accumulation of IMϕ in the intestine, which is a key factor that prevents MetS by changing the gut microbiota composition.

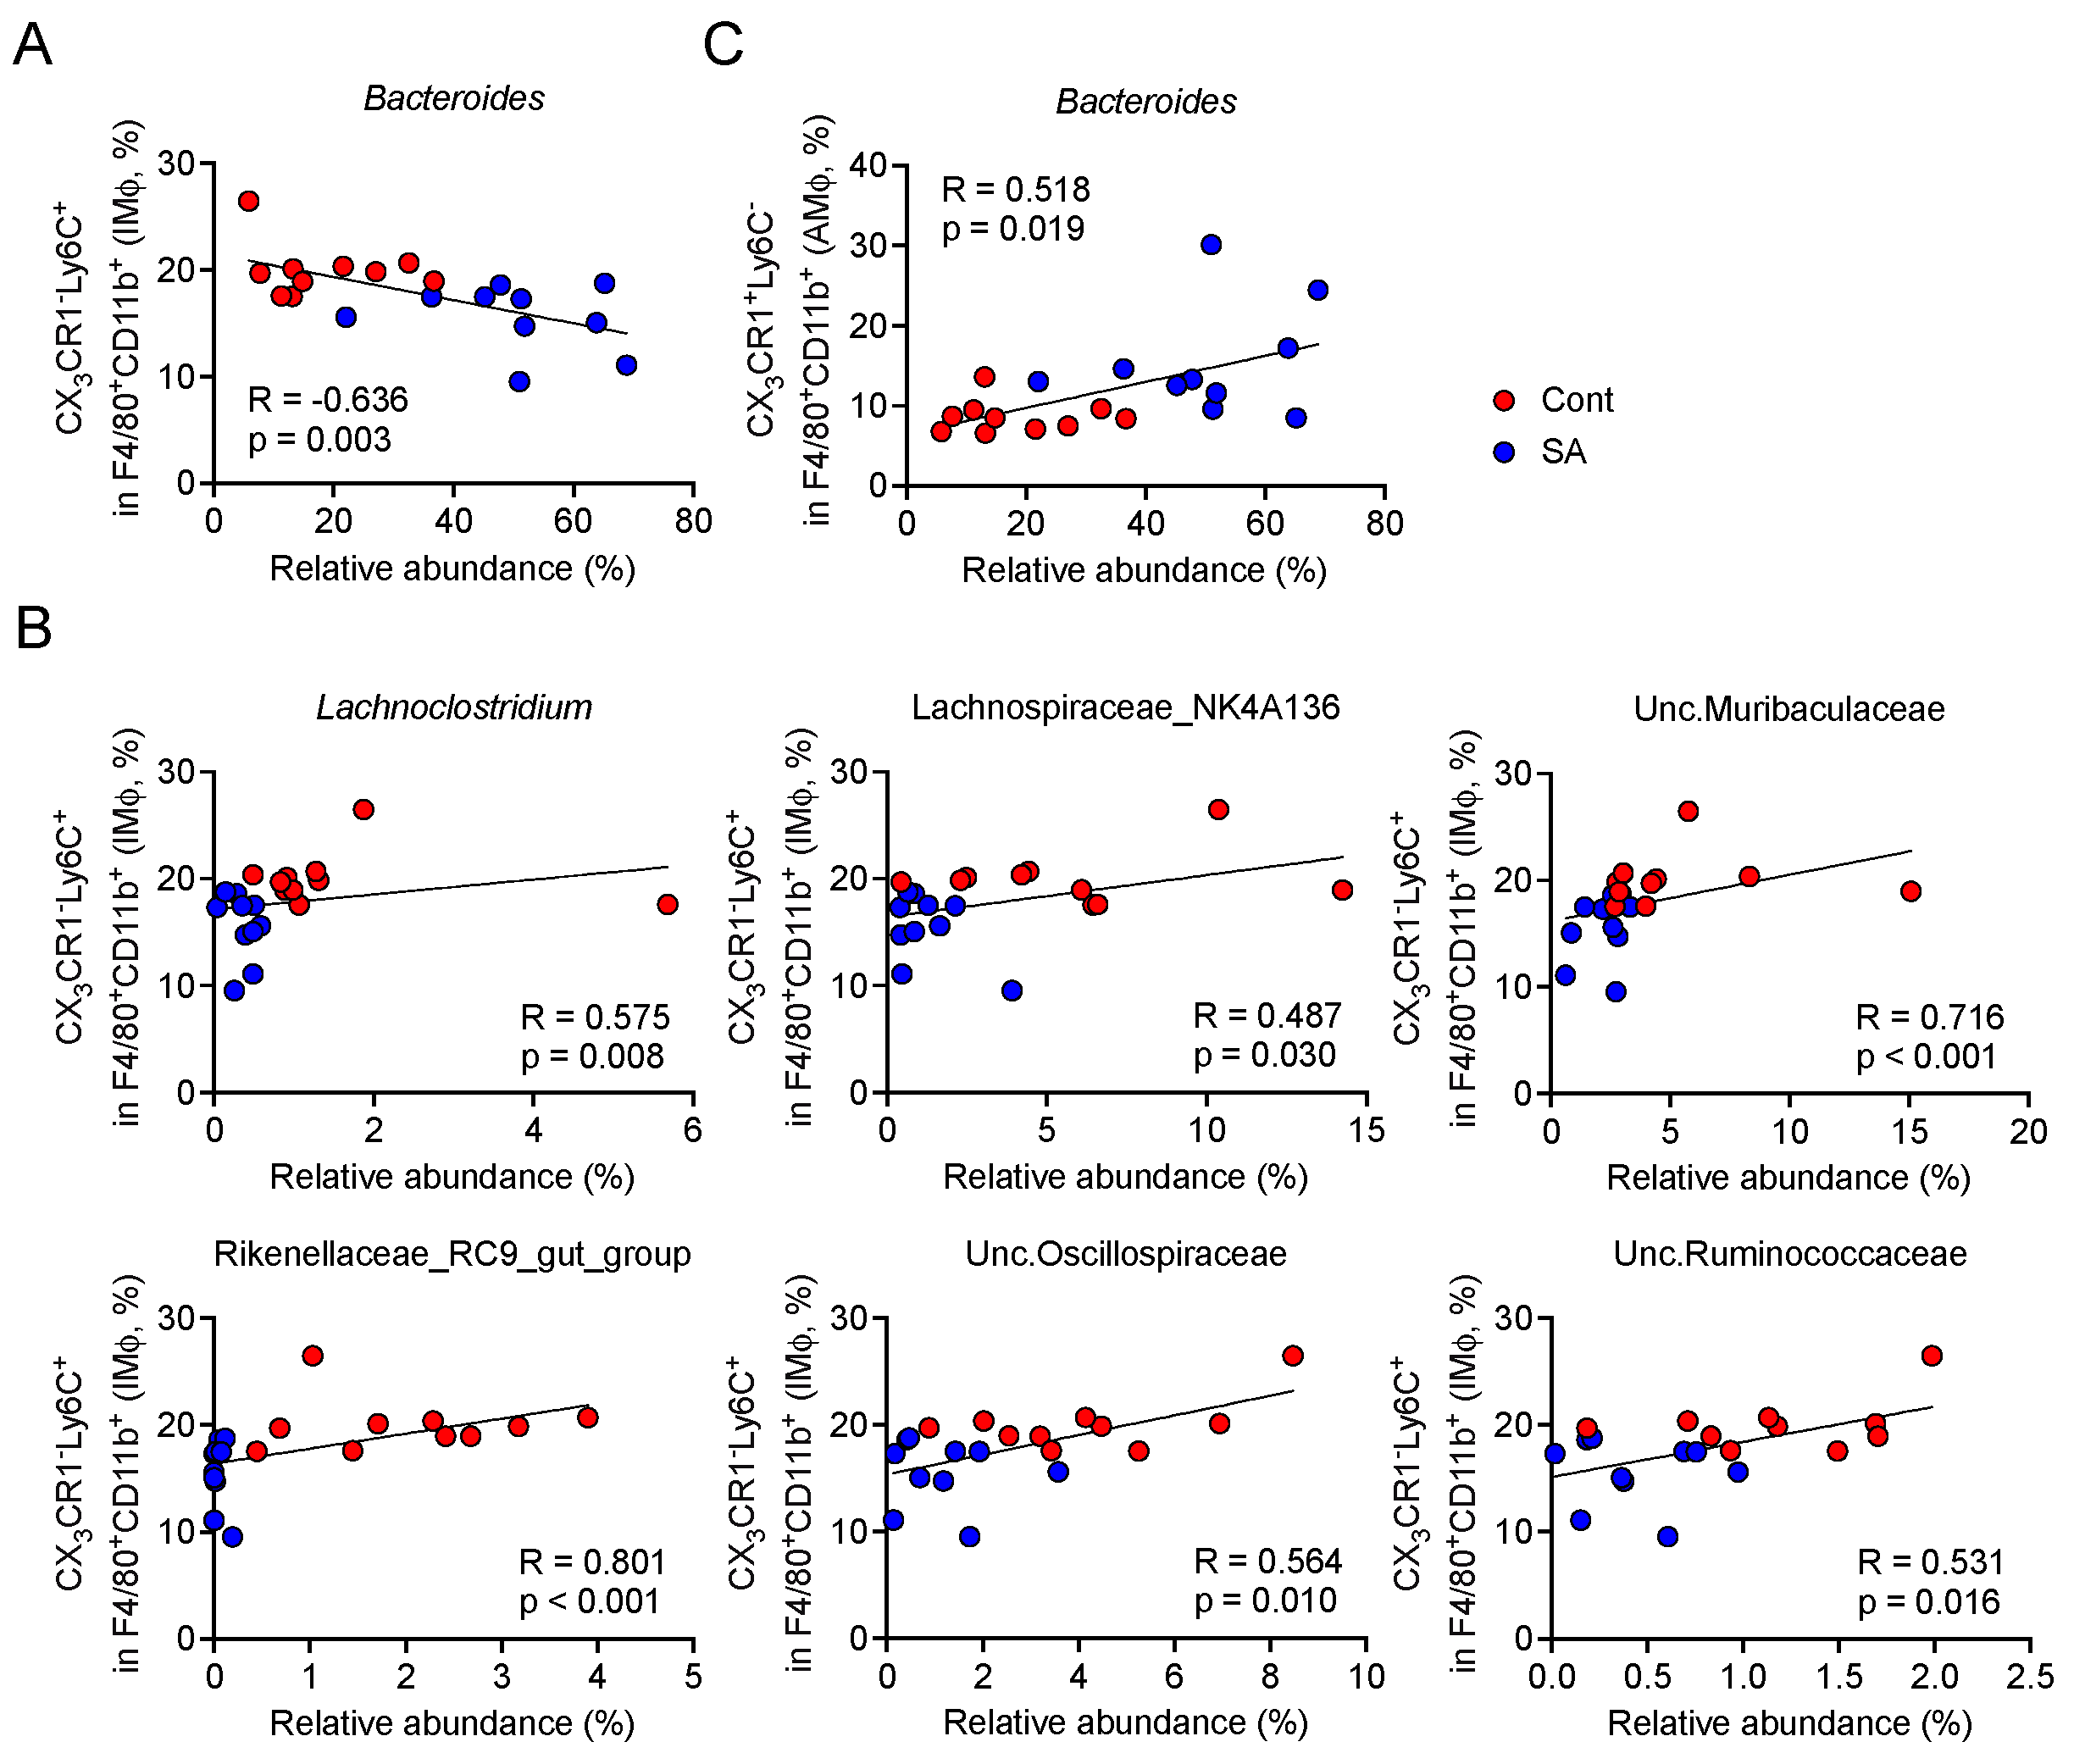
3.4. Increase in Bacteroides Is Negatively Correlated with the Abundance of Colonic Inflammatory Monocytes

We next explored which gut bacteria correlated with the abundance of colonic IMϕ. We observed that the SA-intake-dependent increase in Bacteroides was negatively correlated with IMϕ (Figure 5A), whereas that in the members of the Lachnospiraceae, Rikenellaceae, Ruminococcaceae, Muribaculaceae, and Oscillospiraceae families and the Lachnoclostridium genus was positively correlated with IMϕ (Figure 5B). In contrast, only Bacteroides showed a weak and positive correlation with the abundance of colonic AMϕ (Figure 5C).

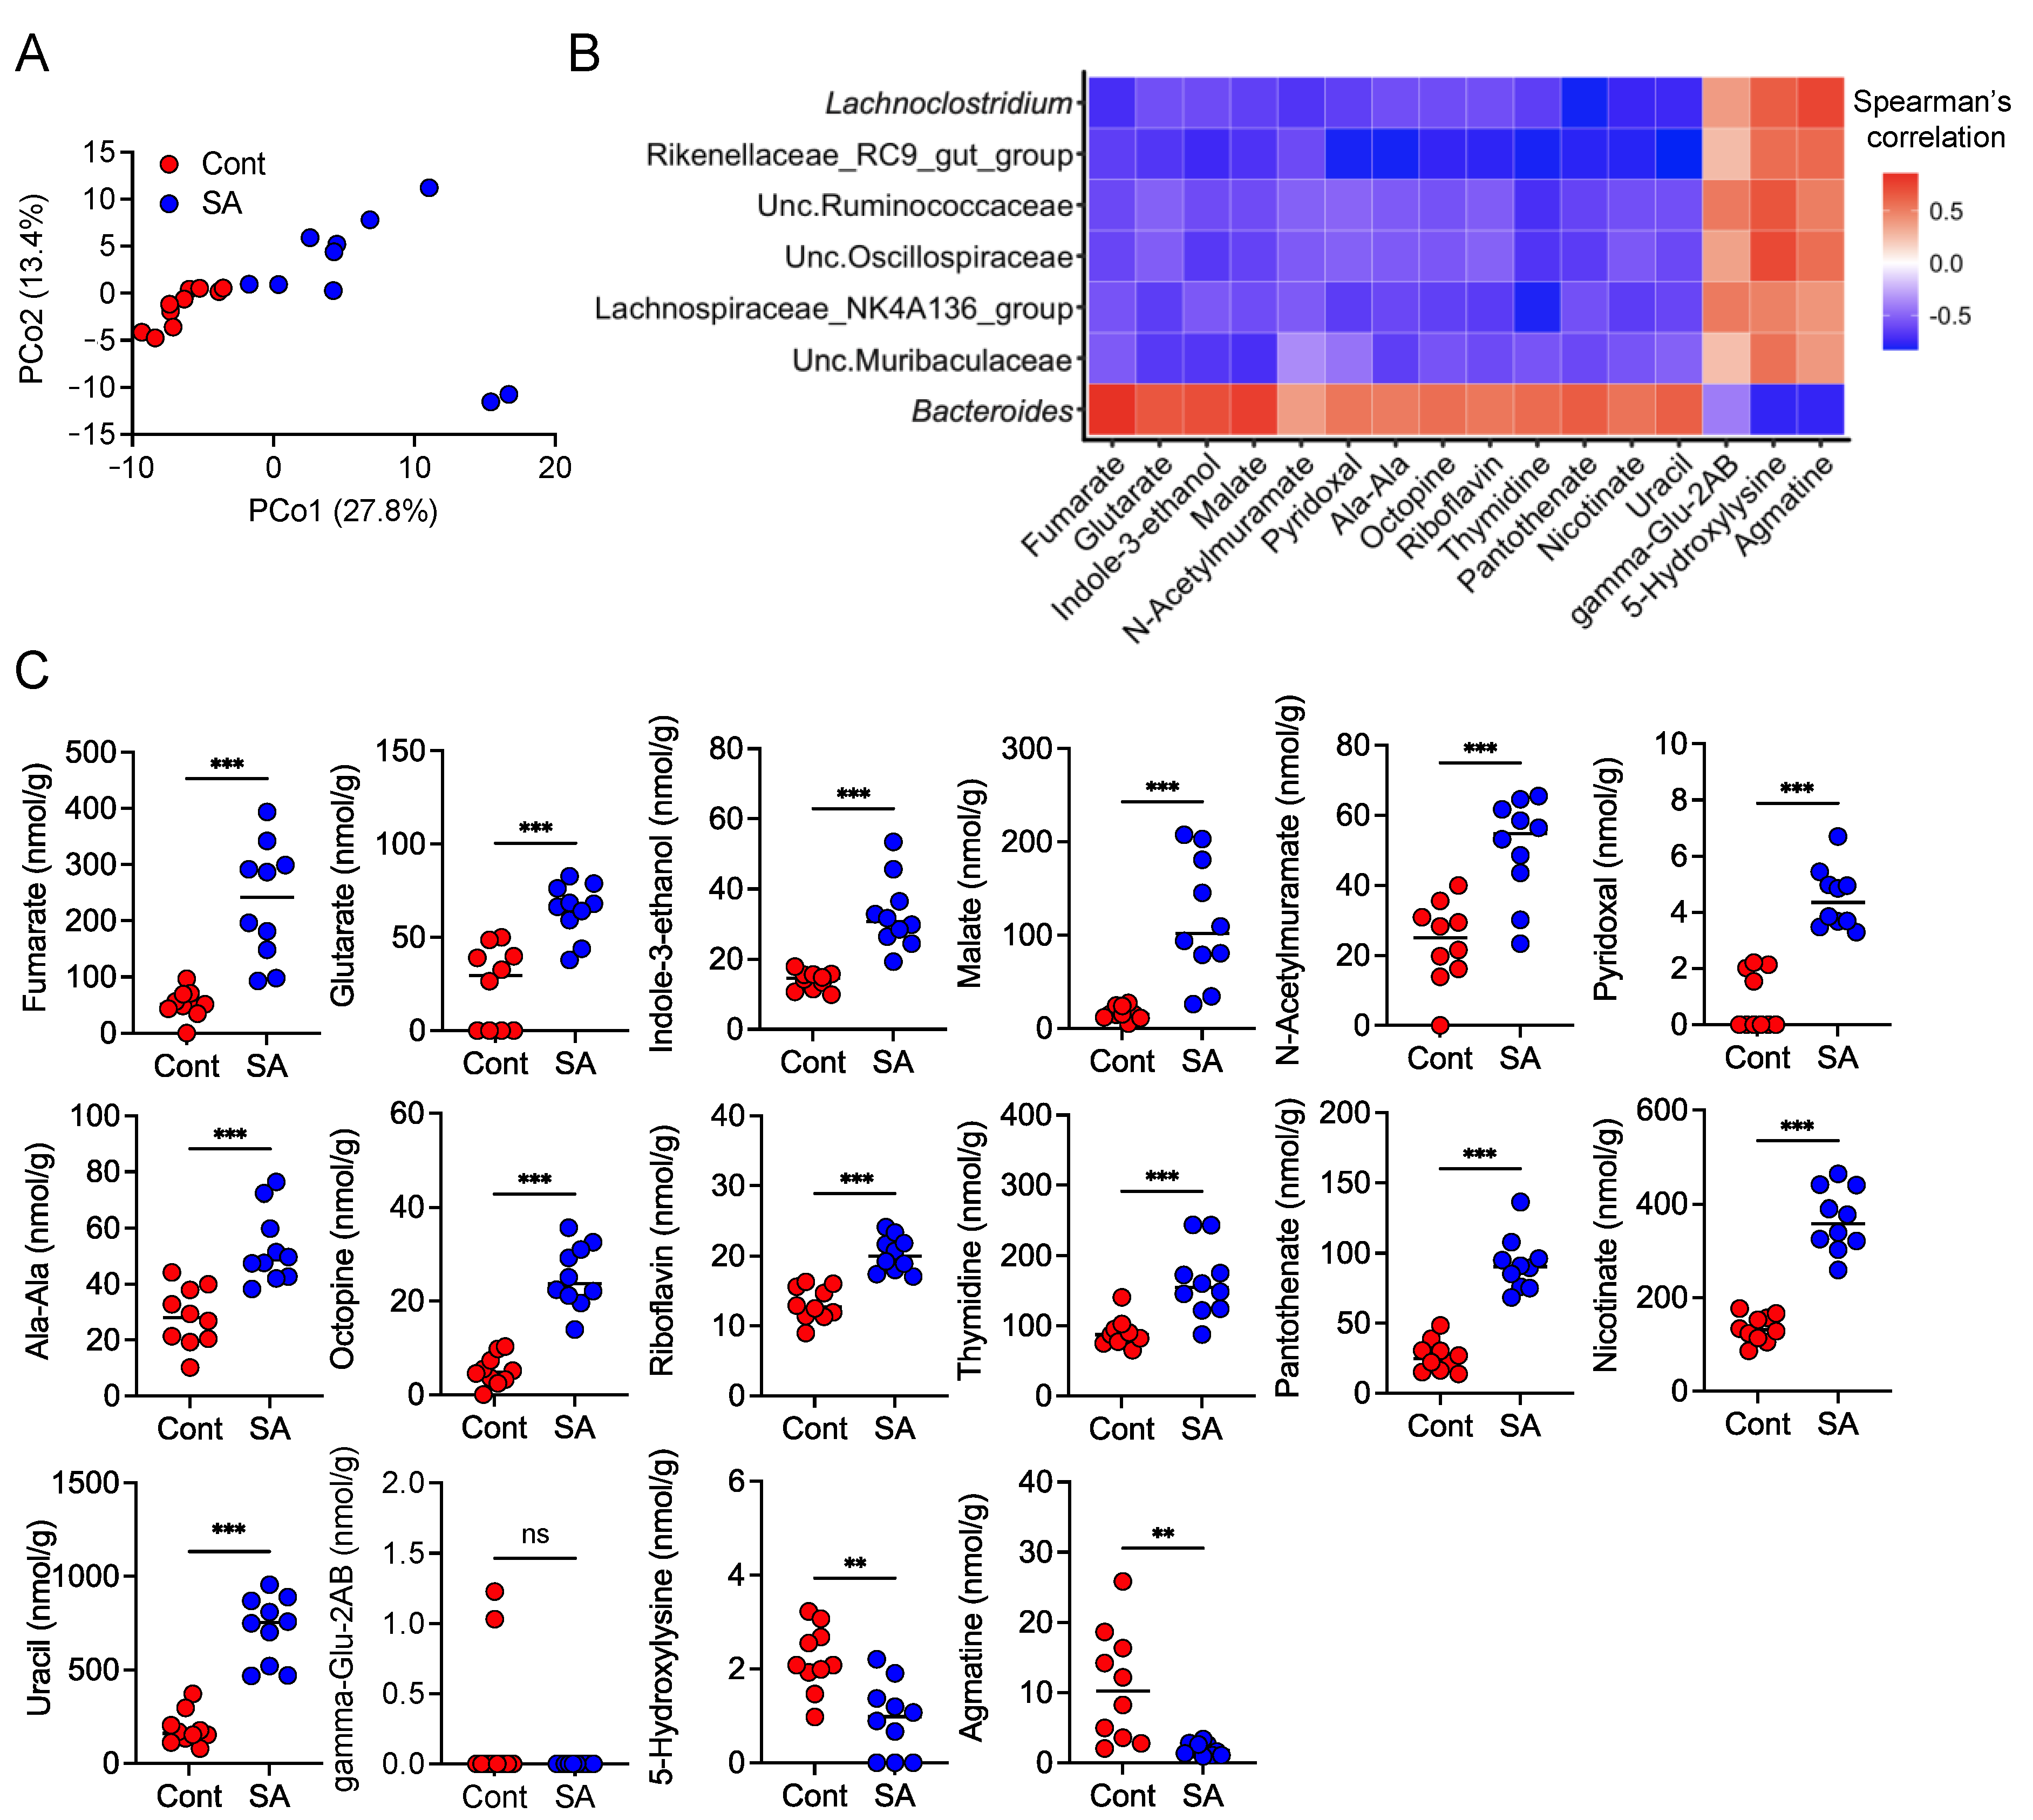
3.5. SA Increases Metabolites That Are Positively Correlated with the Abundance of Bacteroides

Finally, we performed fecal metabolomics to identify metabolites that were positively correlated with the abundance of Bacteroides. PCoA revealed that SA treatment significantly altered the composition of the fecal metabolites 4 weeks after HFD intake (Figure 6A). The abundance of Bacteroides, which was negatively correlated with the abundance of colonic IMϕ, showed a positive correlation with the fecal concentrations of fumarate, glutarate, indole-3-ethanol, malate, N-acetylmurate, pyridoxal, L-alanyl-L-alanine, octopine, riboflavin, thymidine, pantothenate, nicotinate, and uracil (Figure 6B). In contrast, the abundance of Lachnospiraceae, Rikenellaceae, Ruminococcaceae, Muribaculaceae, Oscillospiraceae, and Lachnoclostridium spp., which were positively correlated with the abundance of colonic IMϕ, showed a negative correlation with these metabolites and a positive correlation with gamma-Glu-2AB, 5-hydroxylysine, and agmatine (Figure 6B). Interestingly, the abundance of Bacteroides was negatively correlated with gamma-Glu-2AB, 5-hydroxylysine, and agmatine (Figure 6B). Consistently, SA intake increased the levels of metabolites that were positively correlated with the abundance of Bacteroides (Figure 6C). SA supplementation decreased the levels of metabolites that were negatively correlated with the abundance of Bacteroides, except gamma-Glu-2AB (Figure 6C).

4. Discussion

The present study demonstrated that the preventive effect of the seaweed dietary fiber SA on HFD-induced MetS was attributed to the gut microbiota. In addition, we found that SA supplementation reduced the abundance of colonic Ly6C+ inflammatory monocytes by changing the gut microbiota composition. The egress of Ly6Chi monocytes from the BM to the intestine is dependent on the chemokine receptor CCR2 [27]. In the steady state, intestinal Ly6Chi monocytes recruited from the BM give rise to CX3CR1hi resident macrophages, which retain their anti-inflammatory signature [27]. In contrast, during inflammation, the newly recruited Ly6Chi monocytes do not mature completely into anti-inflammatory CX3CR1hi macrophages and retain their ability to produce high levels of proinflammatory cytokines [27,29]. Abx treatment prevented the decrease in the abundance of Ly6Chi IMϕ caused by SA supplementation while still increasing the abundance of CX3CR1hi AMϕ. These results suggest that SA inhibits the migration of IMϕ into the intestine via the gut microbiota but promotes the shift from IMϕ to AMϕ in a partially dependent or independent manner. Consistent with this notion, we identified several gut bacteria that were positively or negatively correlated with the abundance of IMϕ, while Bacteroides were the only bacteria that correlated with the abundance of AMϕ.
HFD-induced MetS was suppressed after treatment with SA in WT mice, while the effect of SA was abolished in Ccr2–/– mice despite the significant increase in the abundance of Bacteroides. These results indicate that the CCL2–CCR2 axis is a critical factor regulating the preventive effects of SA against MetS. However, Ccr2–/– mice that were fed a HFD had significantly less severe MetS than the WT mice. Ccr2 deficiency has been reported to affect the nervous system and reduce food intake in mice [30]. Therefore, it is possible that the protective effects of SA on MetS in Ccr2–/– mice were abrogated by the insufficient intake of calories. Thus, macrophage-specific Ccr2 knockout mice will reveal more clearly whether preventive effects of SA on diet-induced MetS are dependent on IMϕ.
The abundance of Bacteroides correlated negatively with the abundance of IMϕ, suggesting that Bacteroides could contribute to the control of IMϕ accumulation in the colon and suppress HFD-induced MetS. Indeed, the relative abundance of Bacteroides increased with SA intake. In addition, treatment with erythromycin eliminated Bacteroides and abolished the preventive effect of SA on HFD-induced MetS. Furthermore, it decreased the abundance of IMϕ. Conversely, Lachnospiraceae, Rikenellaceae, Ruminococcaceae, Muribaculaceae, and Oscillospiraceae, which were positively correlated with the abundance of IMϕ, could promote HFD-induced gut inflammation and MetS.
The gut metabolites fumarate, glutarate, indole-3-ethanol, malate, N-acetylmurate, pyridoxal, L-alanyl-L-alanine, octopine, riboflavin, thymidine, pantothenate, nicotinate, and uracil, which were positively correlated with Bacteroides, may regulate colonic IMϕ accumulation. In contrast, gamma-Glu-2AB, 5-hydroxylysine, and agmatine, which were negatively correlated with Bacteroides, might have an opposite effect. However, we performed only correlation analysis among IMϕ, Bacteroides, and gut metabolites. Several reports have shown that Bacteroides species, including B. acidifaciens [31], B. uniformis [32,33], and B. xylanisolvens [34], ameliorate host metabolic dysfunction in mice fed a HFD. Hence, future studies are required to confirm the effects of Bacteroides and their correlated metabolites on colonic IMϕ accumulation and HFD-induced MetS.
Taken together, the present study revealed that SA suppressed colonic infiltration of IMϕ and diet-induced MetS in gut microbiota-dependent manner. These findings indicate that SA changes the gut environment, including gut microbiota composition, metabolites, and gut mucosal immunity, as a consequence, which modulates host metabolism. Thus, we propose a new concept that the use of specific dietary fiber can suppress gut inflammation to prevent diet-induced MetS.

Supplementary Materials

The following are available online at https://www.mdpi.com/article/10.3390/nu13082812/s1, Figure S1: Dietary treatment with sodium alginate (SA) did not suppress high fat diet (HFD)-induced MetS in Ccr2–/– mice, Figure S2: Dietary treatment with sodium alginate (SA) influenced the population of innate immune cells in the gut of high fat diet (HFD)-fed mice, Figure S3: Dietary treatment with sodium alginate (SA) did not alter the population of CD4+ T cells in the colon of high fat diet (HFD)-fed mice.

Author Contributions

R.E., M.A., and Y.-G.K. conceived the study and designed the experiments. R.E., M.A., H.S., S.T., K.Y., N.S., Y.F., A.H., S.F., and Y.-G.K. collected samples and conducted the experiments. R.E., M.A., H.S., S.T., T.K., K.Y., S.F., K.H., and Y.-G.K. analyzed the dat. R.E., M.A., and Y.-G.K. prepared the manuscript. Y.-G.K. supervised the project. All authors have read and agreed to the published version of the manuscript.

Funding

This work was supported by research grants from the JSPS KAKENHI (JP17H05068 and JP20H03490 to Y.-G.K.), AMED (JP20gm1010009 to S.F.; JP18gm6010004h0003 to Y.-G.K.), JST ERATO (JPMJER1902 to S.F.), the Food Science Institute Foundation (to S.F.), Takeda Science Foundation (to S.F. and Y.-G.K.), the Naito Foundation (to Y.-G.K.), Yakult Bio-Science Foundation (to Y.-G.K.), and Mochida Memorial Foundation for Medical and Pharmaceutical Research (to Y.-G.K.).

Institutional Review Board Statement

The study was conducted according to the guidelines of the Declaration of Helsinki and approved by the ethics committee of Keio University (approval number: 17014).

Informed Consent Statement

Not applicable.

Data Availability Statement

The data presented in this study will be made available by the corresponding author upon request.

Acknowledgments

We would like to thank Ikuo Kimura, Junki Miyamoto, and Daisuke Takahashi for the technical help and Naofumi Mukaida for providing Ccr2−/− mice. We would also like to acknowledge the Animal Facility at the Keio University Faculty of Pharmacy for the breeding and maintenance of our mouse strains and the Instrument Management Division. We are grateful to editage (https://www.editage.jp, accessed on 28 July 2021) for editing a draft of this manuscript. Graphical abstract was created using www.biorender.io (accessed on 27 July 2021).

Conflicts of Interest

H.S. is an employee of Kaigen Pharma Co., Ltd., Osaka, Japan. This study was funded by Kaigen Pharma Co., Ltd.

References

  1. Saklayen, M.G. The Global Epidemic of the Metabolic Syndrome. Curr. Hypertens Rep. 2018, 20, 12. [Google Scholar] [CrossRef] [Green Version]
  2. Rodriguez-Correa, E.; Gonzalez-Perez, I.; Clavel-Perez, P.I.; Contreras-Vargas, Y.; Carvajal, K. Biochemical and nutritional overview of diet-induced metabolic syndrome models in rats: What is the best choice? Nutr. Diabetes 2020, 10, 24. [Google Scholar] [CrossRef] [PubMed]
  3. Thaiss, C.A.; Zmora, N.; Levy, M.; Elinav, E. The microbiome and innate immunity. Nature 2016, 535, 65–74. [Google Scholar] [CrossRef]
  4. Cani, P.D. Metabolism in 2013: The gut microbiota manages host metabolism. Nat. Rev. Endocrinol. 2014, 10, 74–76. [Google Scholar] [CrossRef]
  5. Safari, Z.; Monnoye, M.; Abuja, P.M.; Mariadassou, M.; Kashofer, K.; Gerard, P.; Zatloukal, K. Steatosis and gut microbiota dysbiosis induced by high-fat diet are reversed by 1-week chow diet administration. Nutr. Res. 2019, 71, 72–88. [Google Scholar] [CrossRef] [PubMed] [Green Version]
  6. Murphy, E.A.; Velazquez, K.T.; Herbert, K.M. Influence of high-fat diet on gut microbiota: A driving force for chronic disease risk. Curr. Opin. Clin. Nutr. Metab. Care 2015, 18, 515–520. [Google Scholar] [CrossRef]
  7. Hibberd, A.A.; Yde, C.C.; Ziegler, M.L.; Honore, A.H.; Saarinen, M.T.; Lahtinen, S.; Stahl, B.; Jensen, H.M.; Stenman, L.K. Probiotic or synbiotic alters the gut microbiota and metabolism in a randomised controlled trial of weight management in overweight adults. Benef. Microbes 2019, 10, 121–135. [Google Scholar] [CrossRef]
  8. Park, D.Y.; Ahn, Y.T.; Park, S.H.; Huh, C.S.; Yoo, S.R.; Yu, R.; Sung, M.K.; McGregor, R.A.; Choi, M.S. Supplementation of Lactobacillus curvatus HY7601 and Lactobacillus plantarum KY1032 in diet-induced obese mice is associated with gut microbial changes and reduction in obesity. PLoS ONE 2013, 8, e59470. [Google Scholar] [CrossRef] [PubMed] [Green Version]
  9. Stenman, L.K.; Waget, A.; Garret, C.; Klopp, P.; Burcelin, R.; Lahtinen, S. Potential probiotic Bifidobacterium animalis ssp. lactis 420 prevents weight gain and glucose intolerance in diet-induced obese mice. Benef. Microbes 2014, 5, 437–445. [Google Scholar] [CrossRef] [Green Version]
  10. Everard, A.; Matamoros, S.; Geurts, L.; Delzenne, N.M.; Cani, P.D. Saccharomyces boulardii administration changes gut microbiota and reduces hepatic steatosis, low-grade inflammation, and fat mass in obese and type 2 diabetic db/db mice. mBio 2014, 5, e01011–e01014. [Google Scholar] [CrossRef] [Green Version]
  11. Gibson, G.R.; Probert, H.M.; Loo, J.V.; Rastall, R.A.; Roberfroid, M.B. Dietary modulation of the human colonic microbiota: Updating the concept of prebiotics. Nutr. Res. Rev. 2004, 17, 259–275. [Google Scholar] [CrossRef] [Green Version]
  12. Hay, I.D.; Ur Rehman, Z.; Moradali, M.F.; Wang, Y.; Rehm, B.H. Microbial alginate production, modification and its applications. Microb. Biotechnol. 2013, 6, 637–650. [Google Scholar] [CrossRef] [PubMed] [Green Version]
  13. Brownlee, I.A.; Allen, A.; Pearson, J.P.; Dettmar, P.W.; Havler, M.E.; Atherton, M.R.; Onsoyen, E. Alginate as a source of dietary fiber. Crit. Rev. Food Sci. Nutr. 2005, 45, 497–510. [Google Scholar] [CrossRef]
  14. Wang, X.; Liu, F.; Gao, Y.; Xue, C.H.; Li, R.W.; Tang, Q.J. Transcriptome analysis revealed anti-obesity effects of the Sodium Alginate in high-fat diet -induced obese mice. Int. J. Biol. Macromol. 2018, 115, 861–870. [Google Scholar] [CrossRef]
  15. Light, J.M.; Stookey, G.K.; Muhler, J.C. Effect of dietary sodium alginate on radiostrontium absorption and retention in rats. J. Dent. Res. 1970, 49, 442–453. [Google Scholar] [CrossRef]
  16. Fujii, H.; Baba, T.; Ishida, Y.; Kondo, T.; Yamagishi, M.; Kawano, M.; Mukaida, N. Ablation of the Ccr2 gene exacerbates polyarthritis in interleukin-1 receptor antagonist-deficient mice. Arthritis Rheum. 2011, 63, 96–106. [Google Scholar] [CrossRef] [PubMed] [Green Version]
  17. Kimizuka, T.; Seki, N.; Yamaguchi, G.; Akiyama, M.; Higashi, S.; Hase, K.; Kim, Y.G. Amino Acid-Based Diet Prevents Lethal Infectious Diarrhea by Maintaining Body Water Balance in a Murine Citrobacter rodentium Infection Model. Nutrients 2021, 13, 1896. [Google Scholar] [CrossRef] [PubMed]
  18. Bolyen, E.; Rideout, J.R.; Dillon, M.R.; Bokulich, N.A.; Abnet, C.C.; Al-Ghalith, G.A.; Alexander, H.; Alm, E.J.; Arumugam, M.; Asnicar, F.; et al. Reproducible, interactive, scalable and extensible microbiome data science using QIIME 2. Nat. Biotechnol. 2019, 37, 852–857. [Google Scholar] [CrossRef]
  19. Callahan, B.J.; McMurdie, P.J.; Rosen, M.J.; Han, A.W.; Johnson, A.J.; Holmes, S.P. DADA2: High-resolution sample inference from Illumina amplicon data. Nat. Methods 2016, 13, 581–583. [Google Scholar] [CrossRef] [Green Version]
  20. Pruesse, E.; Quast, C.; Knittel, K.; Fuchs, B.M.; Ludwig, W.; Peplies, J.; Glockner, F.O. SILVA: A comprehensive online resource for quality checked and aligned ribosomal RNA sequence data compatible with ARB. Nucleic Acids Res. 2007, 35, 7188–7196. [Google Scholar] [CrossRef] [Green Version]
  21. Camacho, C.; Coulouris, G.; Avagyan, V.; Ma, N.; Papadopoulos, J.; Bealer, K.; Madden, T.L. BLAST+: Architecture and applications. BMC Bioinform. 2009, 10, 421. [Google Scholar] [CrossRef] [PubMed] [Green Version]
  22. Weiss, S.; Xu, Z.Z.; Peddada, S.; Amir, A.; Bittinger, K.; Gonzalez, A.; Lozupone, C.; Zaneveld, J.R.; Vazquez-Baeza, Y.; Birmingham, A.; et al. Normalization and microbial differential abundance strategies depend upon data characteristics. Microbiome 2017, 5, 27. [Google Scholar] [CrossRef] [Green Version]
  23. Goodyear, A.W.; Kumar, A.; Dow, S.; Ryan, E.P. Optimization of murine small intestine leukocyte isolation for global immune phenotype analysis. J. Immunol. Methods 2014, 405, 97–108. [Google Scholar] [CrossRef]
  24. Hirayama, A.; Nakashima, E.; Sugimoto, M.; Akiyama, S.; Sato, W.; Maruyama, S.; Matsuo, S.; Tomita, M.; Yuzawa, Y.; Soga, T. Metabolic profiling reveals new serum biomarkers for differentiating diabetic nephropathy. Anal. Bioanal. Chem. 2012, 404, 3101–3109. [Google Scholar] [CrossRef] [PubMed]
  25. Sugimoto, M.; Wong, D.T.; Hirayama, A.; Soga, T.; Tomita, M. Capillary electrophoresis mass spectrometry-based saliva metabolomics identified oral, breast and pancreatic cancer-specific profiles. Metabolomics 2010, 6, 78–95. [Google Scholar] [CrossRef] [Green Version]
  26. Kawano, Y.; Nakae, J.; Watanabe, N.; Kikuchi, T.; Tateya, S.; Tamori, Y.; Kaneko, M.; Abe, T.; Onodera, M.; Itoh, H. Colonic Pro-inflammatory Macrophages Cause Insulin Resistance in an Intestinal Ccl2/Ccr2-Dependent Manner. Cell Metab. 2016, 24, 295–310. [Google Scholar] [CrossRef] [PubMed] [Green Version]
  27. Bain, C.C.; Scott, C.L.; Uronen-Hansson, H.; Gudjonsson, S.; Jansson, O.; Grip, O.; Guilliams, M.; Malissen, B.; Agace, W.W.; Mowat, A.M. Resident and pro-inflammatory macrophages in the colon represent alternative context-dependent fates of the same Ly6Chi monocyte precursors. Mucosal. Immunol. 2013, 6, 498–510. [Google Scholar] [CrossRef] [PubMed]
  28. Plantinga, M.; Guilliams, M.; Vanheerswynghels, M.; Deswarte, K.; Branco-Madeira, F.; Toussaint, W.; Vanhoutte, L.; Neyt, K.; Killeen, N.; Malissen, B.; et al. Conventional and monocyte-derived CD11b(+) dendritic cells initiate and maintain T helper 2 cell-mediated immunity to house dust mite allergen. Immunity 2013, 38, 322–335. [Google Scholar] [CrossRef] [Green Version]
  29. Zigmond, E.; Varol, C.; Farache, J.; Elmaliah, E.; Satpathy, A.T.; Friedlander, G.; Mack, M.; Shpigel, N.; Boneca, I.G.; Murphy, K.M.; et al. Ly6C hi monocytes in the inflamed colon give rise to proinflammatory effector cells and migratory antigen-presenting cells. Immunity 2012, 37, 1076–1090. [Google Scholar] [CrossRef] [Green Version]
  30. Weisberg, S.P.; Hunter, D.; Huber, R.; Lemieux, J.; Slaymaker, S.; Vaddi, K.; Charo, I.; Leibel, R.L.; Ferrante, A.W., Jr. CCR2 modulates inflammatory and metabolic effects of high-fat feeding. J. Clin. Investig. 2006, 116, 115–124. [Google Scholar] [CrossRef] [Green Version]
  31. Yang, J.Y.; Lee, Y.S.; Kim, Y.; Lee, S.H.; Ryu, S.; Fukuda, S.; Hase, K.; Yang, C.S.; Lim, H.S.; Kim, M.S.; et al. Gut commensal Bacteroides acidifaciens prevents obesity and improves insulin sensitivity in mice. Mucosal Immunol. 2017, 10, 104–116. [Google Scholar] [CrossRef] [PubMed] [Green Version]
  32. Gauffin Cano, P.; Santacruz, A.; Moya, A.; Sanz, Y. Bacteroides uniformis CECT 7771 ameliorates metabolic and immunological dysfunction in mice with high-fat-diet induced obesity. PLoS ONE 2012, 7, e41079. [Google Scholar] [CrossRef] [PubMed] [Green Version]
  33. Lopez-Almela, I.; Romani-Perez, M.; Bullich-Vilarrubias, C.; Benitez-Paez, A.; Gomez Del Pulgar, E.M.; Frances, R.; Liebisch, G.; Sanz, Y. Bacteroides uniformis combined with fiber amplifies metabolic and immune benefits in obese mice. Gut Microbes 2021, 13, 1–20. [Google Scholar] [CrossRef] [PubMed]
  34. Qiao, S.; Bao, L.; Wang, K.; Sun, S.; Liao, M.; Liu, C.; Zhou, N.; Ma, K.; Zhang, Y.; Chen, Y.; et al. Activation of a Specific Gut Bacteroides-Folate-Liver Axis Benefits for the Alleviation of Nonalcoholic Hepatic Steatosis. Cell Rep. 2020, 32, 108005. [Google Scholar] [CrossRef] [PubMed]
Figure 1. Dietary treatment with sodium alginate (SA) suppressed high fat diet (HFD)-induced metabolic syndrome (MetS). Mice were fed a HFD supplemented with or without 5% SA for 12 weeks (n = 10 mice per group). (A) Body weight gain. (B) Blood glucose levels, as measured via an oral glucose tolerance test (OGTT). (C) Cholesterol levels in plasma. (D) Total white adipose tissue (WAT) weight. (E) Mesenteric WAT weight. (F) Perirenal WAT weight. (G) Subcutaneous WAT weight. (H) Epididymal WAT weight. (I) Liver weight. (J) Representative images of lipid droplet-containing areas (white areas) and (K) percentage of lipid droplet-containing areas in hematoxylin and eosin (H&E)-stained liver sections. Scale bar, 100 μm. (L) Daily food intake of the mice. Each dot represents an individual mouse, and the horizontal bars indicate mean values. Statistical significance was assessed by unpaired Student’s t-test in (C,E,F,K,L); Welch’s t-test in (D,G,H,I); and two-way analysis of variance (ANOVA) with Sidak’s multiple comparisons test in (A,B). * p < 0.05; ** p < 0.01; *** p < 0.001; n.s., not significant; Cont: HFD diet; SA: HFD diet with 5% sodium alginate.
Nutrients 13 02812 g001
Figure 2. Dietary treatment with sodium alginate (SA) altered the gut microbiota composition of high fat diet (HFD)-fed mice. Mice were fed a HFD supplemented with or without 5% SA for 0, 4, or 12 weeks (n = 8–10 mice per group). (A) Principal component analysis (PCoA) of the microbiome in fecal samples was performed using unweighted UniFrac. (B,C) Relative abundance of amplicon sequence variants (ASVs). The different colors correspond to different bacterial phyla (B) and genera (C), as indicated. (D) Relative abundance of Bacteroides in the fecal samples. Each dot represents an individual mouse, and the horizontal bars indicate mean values. Statistical significance was assessed by Welch’s t-test (D). *** p < 0.001; n.s., not significant. Cont: HFD diet; SA: HFD diet with 5% sodium alginate.
Nutrients 13 02812 g002
Figure 3. Gut microbiota was involved in the sodium alginate (SA)-mediated suppression of high fat diet (HFD)-induced MetS. Mice were fed a HFD supplemented with or without 5% SA for 12 weeks and subjected to antibiotic (Abx) treatment (n = 10 mice per group). (A) Relative abundance of ASVs in feces of mice maintained on a HFD supplemented with or without 5% SA for 4 weeks. The different colors correspond to different bacterial genera, as indicated. (B) Body weight gain. (C) Blood glucose levels, as measured via an OGTT. (D) Plasma cholesterol levels. (E) Liver weight. (F) Representative images of lipid droplet-containing areas (white areas) and (G) percentage of lipid droplet-containing areas in H&E stained liver sections. Scale bar, 100 μm. (H) Daily food intake of the mice. Each dot represents an individual mouse, and the horizontal bars indicate mean values. Statistical significance was assessed by an unpaired Student’s t-test in (E,G), Mann–Whitney U-test in (D,H), and two-way analysis of variance (ANOVA) with Sidak’s multiple comparisons test in (B,C). * p < 0.05; n.s., not significant. Cont: HFD diet; SA: HFD diet with 5% sodium alginate; Abx: erythromycin treatment.
Nutrients 13 02812 g003
Figure 4. Dietary treatment with sodium alginate (SA) reduced the abundance of inflammatory monocytes in the colon by altering the gut microbiota composition. Mice were fed a HFD supplemented with or without 5% SA for 4 weeks in the absence (B,C) or presence (D,E) of antibiotic (Abx) treatment (n = 9 or 10 mice per group). The expression levels of CX3CR1 and Ly6C in CD11b+F4/80+ cells in the colon were analyzed via flow cytometry. (A) Representative flow cytometry images and frequencies of (B,D) CD11b+F4/80+CX3CR1lowLy6C+ (inflammatory monocytes, IMϕ) and (C,E) CD11b+F4/80+CX3CR1highLy6C cells (resident anti-inflammatory macrophages, AMϕ). Each dot represents an individual mouse, and the horizontal bars indicate mean values. Statistical significance was assessed by Mann–Whitney U-test in (BD), and unpaired Student’s t-test in (E). * p < 0.05; ** p < 0.01; *** p < 0.001; n.s., not significant. Cont: HFD diet; SA: HFD diet with 5% sodium alginate; Abx: erythromycin treatment.
Nutrients 13 02812 g004
Figure 5. Bacteroides were negatively correlated with the abundance of inflammatory monocytes in the colon. Mice were fed a HFD supplemented with or without 5% sodium alginate (SA) for 4 weeks (n = 10 mice per group). Spearman’s rank correlation coefficient was used to analyze the correlation between the relative abundance of gut microbiota and the percentage of colonic macrophages. (A,B) Scatter plots showing the (A) negative or (B) positive correlation between the gut microbiota and CD11b+F4/80+CX3CR1lowLy6C+ cells in the colon. (C) Scatter plots showing the positive correlation between gut microbiota and CD11b+F4/80+CX3CR1highLy6C cells in the colon. Cont: HFD diet; SA: HFD diet with 5% sodium alginate; R: spearman correlation coefficient; p: p-value.
Nutrients 13 02812 g005
Figure 6. Dietary treatment with sodium alginate (SA) increased the levels of metabolites that correlated positively with the abundance of Bacteroides. Metabolites in mouse feces were analyzed by CE-TOFMS. Metabolome analyses were perFigure 4. weeks after feeding the mice HFD supplemented with or without 5% SA (n = 10 mice per group). (A) PCoA for the fecal samples was performed using unweighted UniFrac. (B) Heat map shows correlations between gut bacteria abundance and levels of fecal metabolites by Spearman’s correlation analysis. Red and blue colors denote the positive and negative correlation values, respectively. (C) Measurement of the levels of metabolites in the feces of mice maintained on a HFD supplemented with or without 5% SA. Each dot represents an individual mouse, and the horizontal bars indicate mean values. Statistical significance in (C) was assessed by unpaired Student’s t-test for glutarate, N-acetylmurate, pyridoxal, Ala-Ala, riboflavin, and 5-hydroxylysine; Welch’s t-test for fumarate, indole-3-ethanol, malate, octopine, uracil, and agmatine; and Mann–Whitney U-test for thymidine, pantothenate, nicotinate, and gamma-Glu-2AB. ** p < 0.01; *** p < 0.001; n.s., not significant. Cont: HFD diet, SA: HFD diet with 5% sodium alginate.
Nutrients 13 02812 g006
Table 1. Composition of the diet used for the study.
Product #D12492D18102802
g%kcal%g%kcal%
Protein26202620
Carbohydrate26202620
Fat35603560
Total 100 100
kcal/g5.2 5.2
Ingredientgkcalgkcal
Casein200800200800
L-cystine312312
Maltodextrin 10125500125500
Sucrose68.827568.8275
Cellulose50011.30
Soybean oil2522525225
Lard24522052452205
Mineral mix, S10026100100
Dicalcium phosphate130130
Calcium carbonate5.505.50
Potassium citrate, 1 H2O16.5016.50
Vitamin mix, V1000110401040
Choline bitartrate2020
Sodium alginate0038.70
FD&C Yellow Dye #5000.0250
FD&C Red Dye #400000
FD&C Blue Dye #10.0500.0250
Total773.854057773.854057
Publisher’s Note: MDPI stays neutral with regard to jurisdictional claims in published maps and institutional affiliations.

