
Does Each Menstrual Cycle Elicit a Distinct Effect on Olfactory and Gustatory Perception?

 ,
,  ,
,
Abstract
1. Introduction
2. Materials and Methods
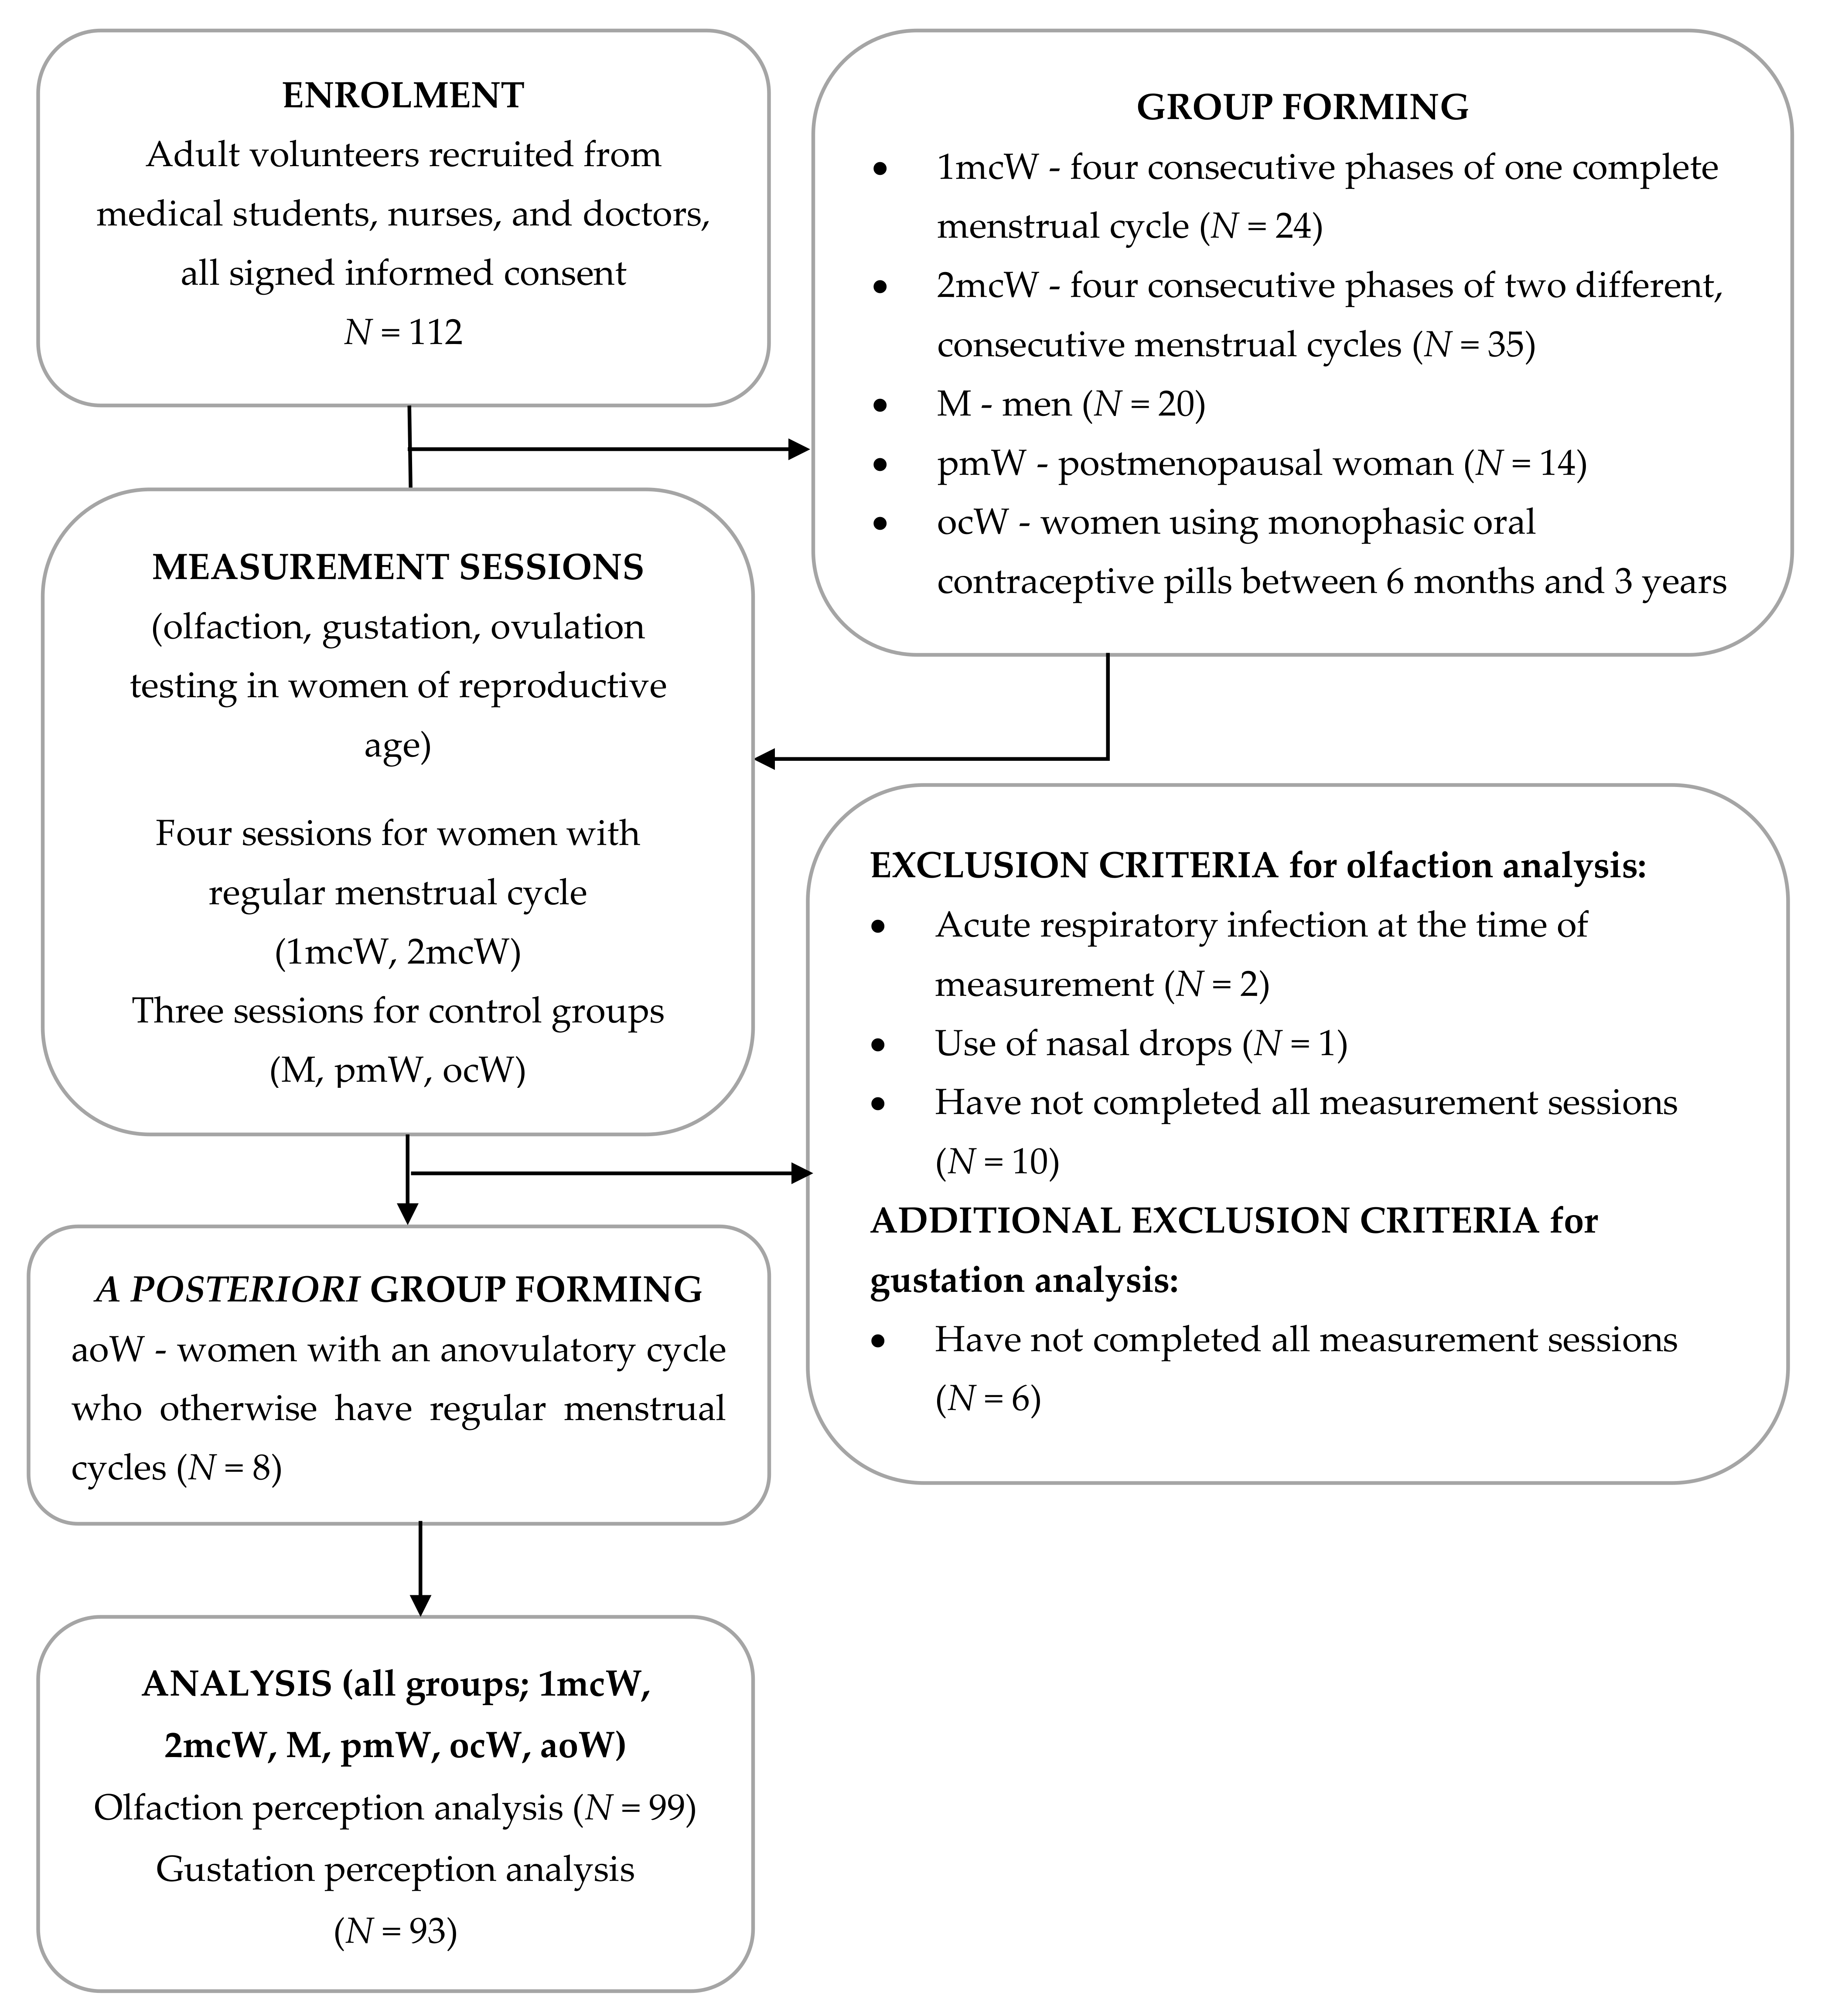
2.1. Participants
2.2. Measurements
2.3. Olfaction Measurement
2.4. Gustation Measurement
2.5. Ovulation Determination
2.6. Statistical Analysis
3. Results
3.1. Participants’ Characteristics
3.2. Olfaction Perception
3.2.1. Olfactory Threshold
3.2.2. Olfactory Discrimination
3.2.3. Olfactory Identification
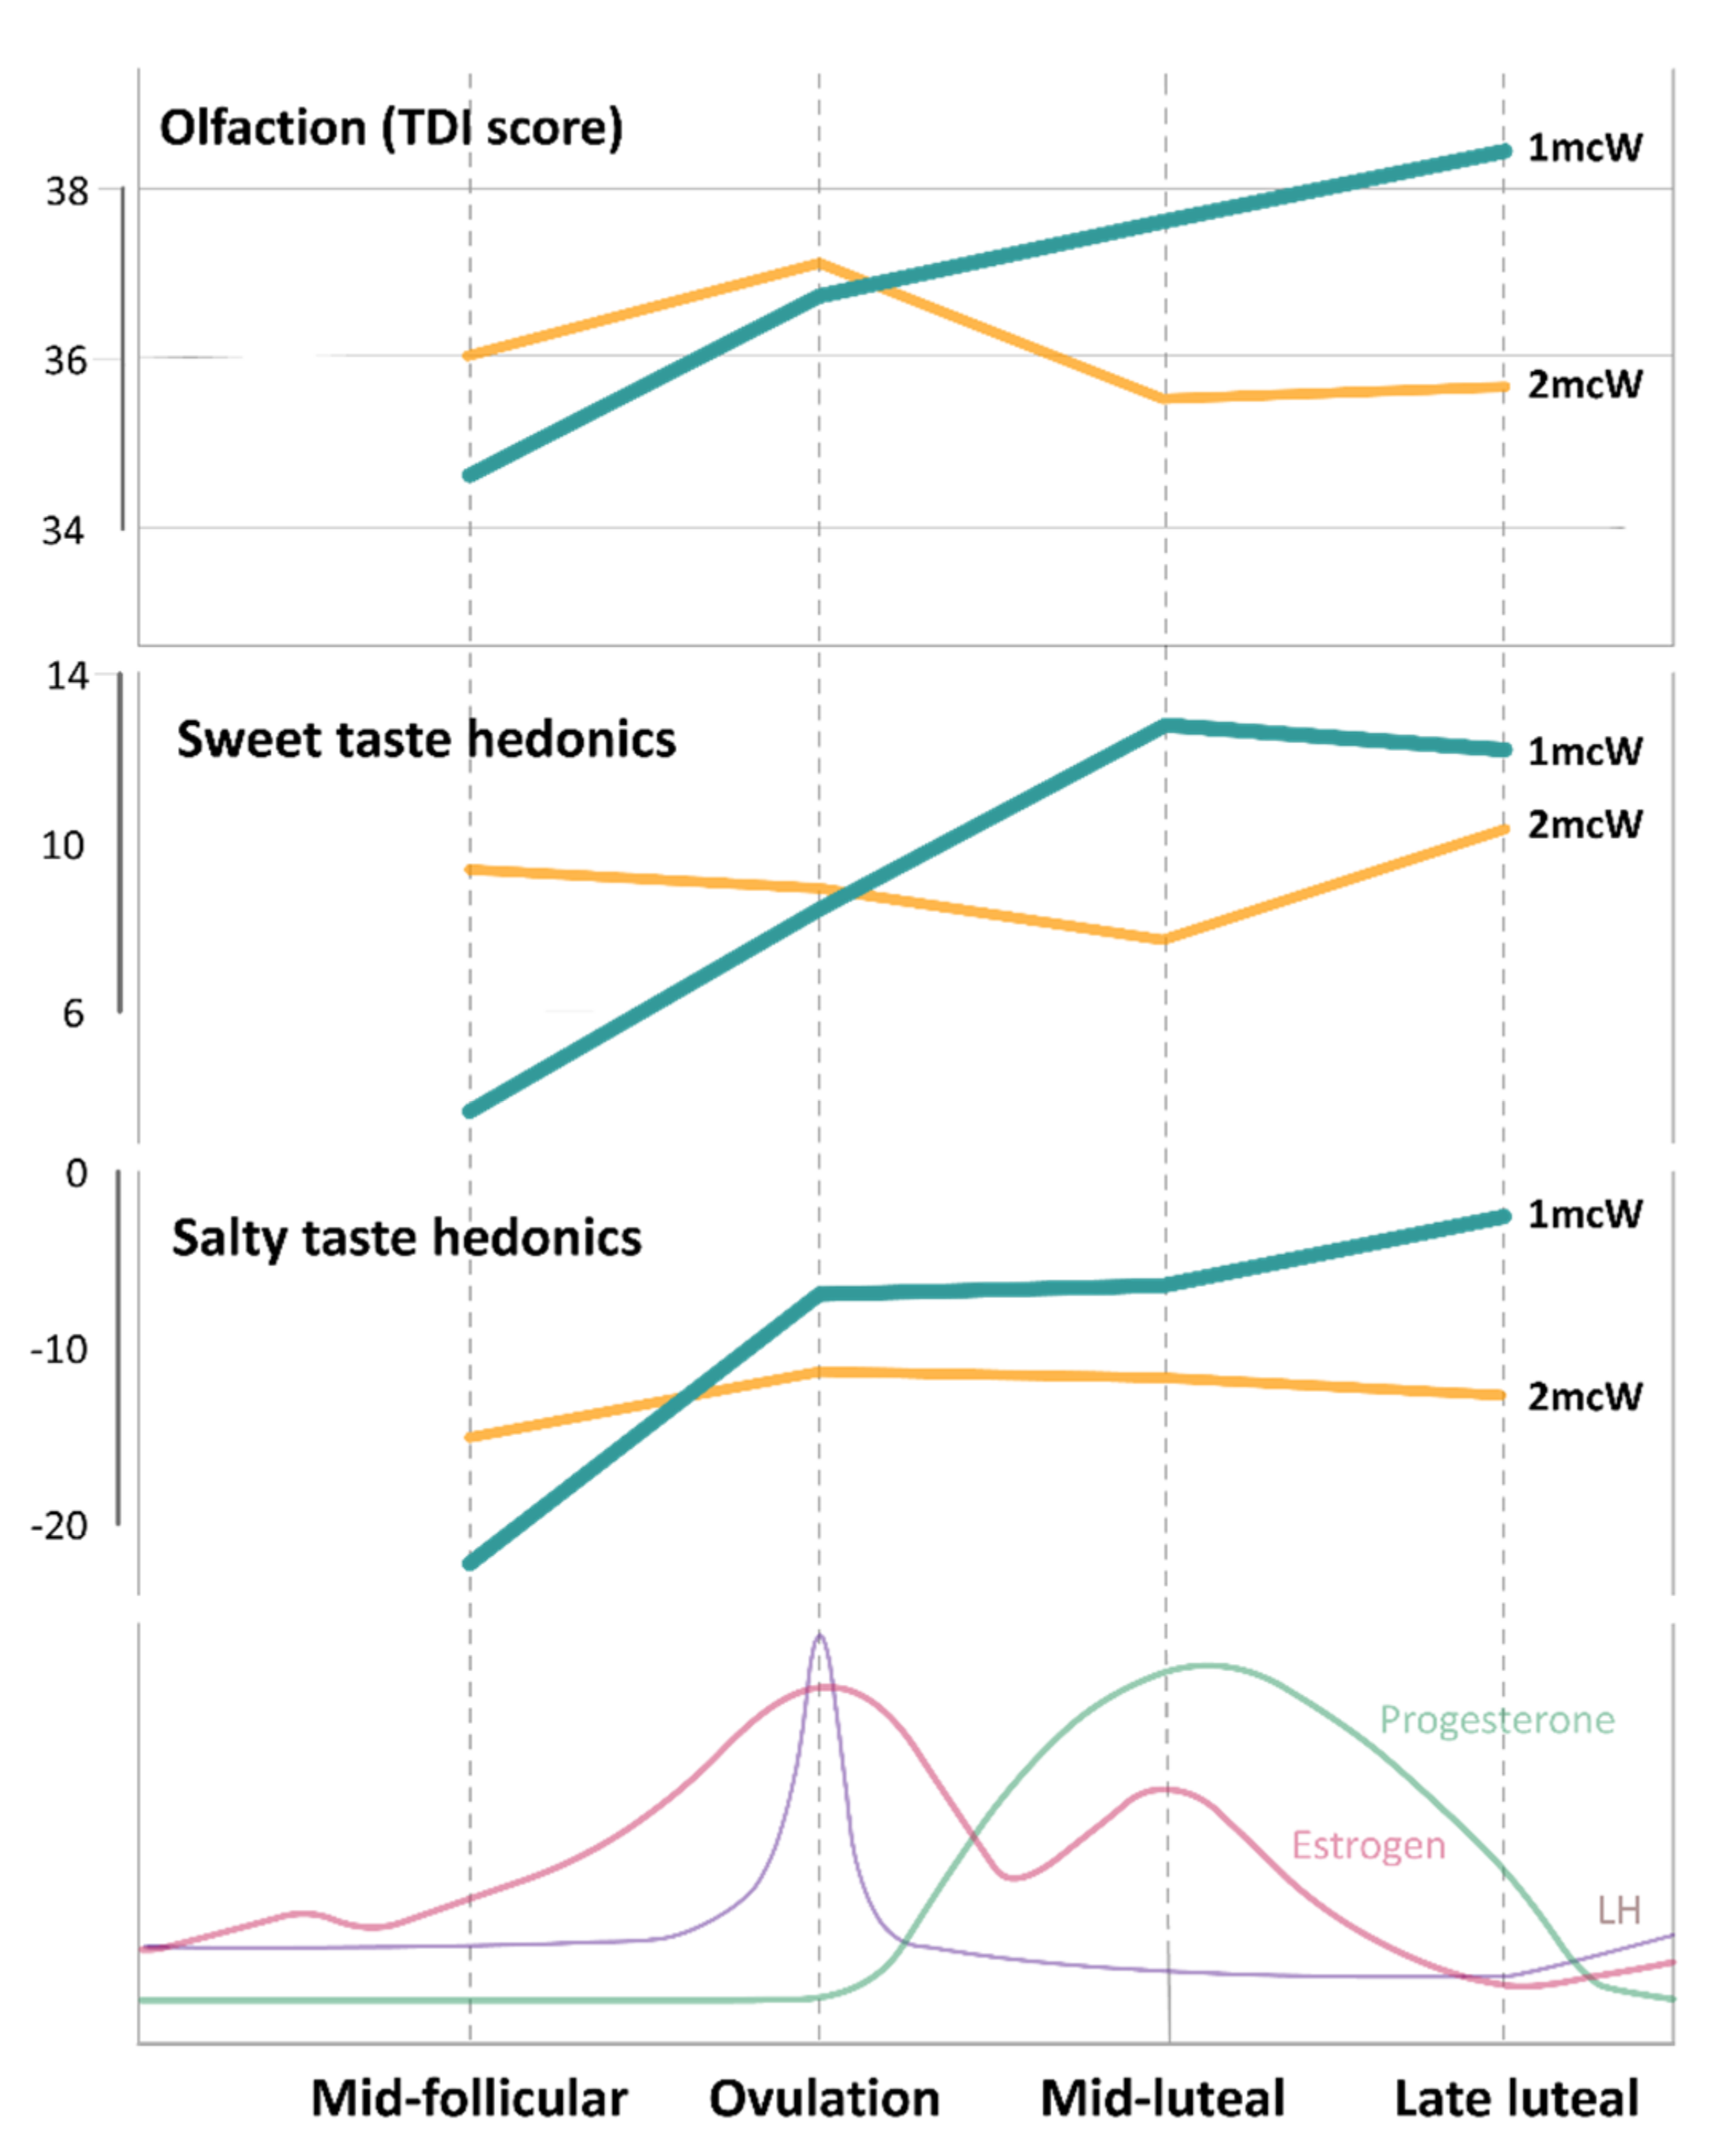
3.2.4. Overall Olfactory Performance—TDI Score (Threshold, Discrimination, and Identification)
3.3. Gustatory Perception
3.3.1. Sweet Taste
3.3.2. Salty Taste
3.3.3. Sour Taste
3.3.4. Bitter Taste
3.4. Assessment of the Learning Curve Effect
4. Discussion
5. Conclusions
Supplementary Materials
Author Contributions
Funding
Institutional Review Board Statement
Informed Consent Statement
Data Availability Statement
Acknowledgments
Conflicts of Interest
References
- Pinto, J.M. Olfaction. Proc. Am. Thorac. Soc. 2011, 8, 46–52. [Google Scholar] [CrossRef]
- Hoffmann, H. The aroma of arousal: Effects of menstrual cycle phase and women’s sexual arousal state on men’s responsiveness to women’s body odor. Biol. Psycho. 2019, 142, 54–61. [Google Scholar] [CrossRef] [PubMed]
- Patel, R.M.; Pinto, J.M. Olfaction: Anatomy, physiology, and disease. Clin. Anat. 2014, 27, 54–60. [Google Scholar] [CrossRef] [PubMed]
- Doty, R.L.; Kamath, V. The influences of age on olfaction: A review. Front. Psychol. 2014, 5, 20. [Google Scholar] [CrossRef] [PubMed]
- Cattaneo, C.; Riso, P.; Laureati, M.; Gargari, G.; Pagliarini, E. Exploring associations between interindividual differences in Taste perception, oral microbiota composition, and reported food intake. Nutrients 2019, 11, 1167. [Google Scholar] [CrossRef]
- Breslin, P.A. An evolutionary perspective on food review and human taste. Curr. Biol. 2013, 23, R409–R418. [Google Scholar] [CrossRef]
- Doty, R.L.; Cameron, E.L. Sex differences and reproductive hormone influences on human odor perception. Physiol. Behav. 2009, 97, 213–228. [Google Scholar] [CrossRef]
- Barragán, R.; Coltell, O.; Portolés, O.; Asensio, E.M.; Sorlí, J.V.; Ortega-Azorín, C.; González, J.I.; Sáiz, C.; Fernández-Carrión, R.; Ordovas, J.M.; et al. Bitter, sweet, salty, sour and umami taste perception decreases with age: Sex-Specific analysis, modulation by genetic variants and taste-preference associations in 18 to 80 year-old subjects. Nutrients 2018, 10, 1539. [Google Scholar] [CrossRef] [PubMed]
- Dong, J.; Wyss, A.; Yang, J.; Price, T.R.; Nicolas, A.; Nalls, M.; Tranah, G.; Franceschini, N.; Xu, Z.; Schulte, C.; et al. Genome-wide association analysis of the sense of smell in US older adults: Identification of novel risk loci in African-Americans and European-Americans. Mol. Neurobiol. 2017, 54, 8021–8032. [Google Scholar] [CrossRef] [PubMed]
- Williams, J.A.; Bartoshuk, L.M.; Fillingim, R.B.; Dotson, C.D. Exploring ethnic differences in taste perception. Chem. Senses 2016, 41, 449–456. [Google Scholar] [CrossRef]
- Pastor, A.; Fernandez-Aranda, F.; Fito, M.; Jimenez-Murcia, S.; Botella, C.; Fernandez-Real, J.M.; Fruhbeck, G.; Tinahones, F.J.; Fagundo, A.B.; Rodriguez, J.; et al. A lower olfactory capacity is related to higher circulating concentrations of endocannabinoid 2-arachidonoylglycerol and higher body mass index in women. PLoS ONE 2016, 11, e0148734. [Google Scholar] [CrossRef] [PubMed]
- Veček, N.N.; Mucalo, L.; Dragun, R.; Miličević, T.; Pribisalić, A.; Patarčić, I.; Hayward, C.; Polašek, O.; Kolčić, I. The association between salt taste perception, Mediterranean diet and metabolic syndrome: A cross-sectional study. Nutrients 2020, 12, 1164. [Google Scholar] [CrossRef]
- Chan, J.Y.K.; Garcia-Esquinas, E.; Ko, O.H.; Tong, M.C.F.; Lin, S.Y. The Association Between Diabetes and Olfactory Function in Adults. Chem. Senses 2017, 43, 59–64. [Google Scholar] [CrossRef] [PubMed]
- Poessel, M.; Freiherr, J.; Wiencke, K.; Villringer, A.; Horstmann, A. Insulin resistance is associated with reduced food odor sensitivity across a wide range of body weights. Nutrients 2020, 12, 2201. [Google Scholar] [CrossRef] [PubMed]
- Hanci, D.; Altun, H. Hunger state affects both olfactory abilities and gustatory sensitivity. Eur. Arch. Otorhinolaryngol. 2016, 273, 1637–1641. [Google Scholar] [CrossRef]
- Kochem, M.; Breslin, P.A. Lipid-Lowering pharmaceutical clofibrate inhibits human sweet taste. Chem. Senses 2017, 42, 79–83. [Google Scholar] [CrossRef]
- Baskoy, K.; Ay, S.A.; Altundag, A.; Kurt, O.; Salihoglu, M.; Deniz, F.; Tekeli, H.; Yonem, A.; Hummel, T. Is there any effect on smell and taste functions with levothyroxine treatment in subclinical hypothyroidism? PLoS ONE 2016, 11, e0149979. [Google Scholar] [CrossRef]
- Choo, E.; Dando, R. The impact of pregnancy on taste function. Chem. Senses 2017, 42, 279–286. [Google Scholar] [CrossRef]
- Derntl, B.; Schopf, V.; Kollndorfer, K.; Lanzenberger, R. Menstrual cycle phase and duration of oral contraception intake affect olfactory perception. Chem. Senses 2013, 38, 67–75. [Google Scholar] [CrossRef]
- Bignetti, E.; Sinesio, F.; Aiello, G.L.; Cannella, C. The amelioration of olfactory acuity upon sexual maturation might affect food preferences. Nutrients 2009, 1, 3–17. [Google Scholar] [CrossRef]
- Asarian, L.; Geary, N. Sex differences in the physiology of eating. Am. J. Physiol. Regul. Integr. Comp. Physiol. 2013, 305, R1215–R1267. [Google Scholar] [CrossRef] [PubMed]
- Pletzer, B.; Crone, J.S.; Kronbichler, M.; Kerschbaum, H. Menstrual cycle and hormonal contraceptive-dependent changes in intrinsic connectivity of resting-state brain networks correspond to behavioral changes due to hormonal status. Brain Connect. 2016, 6, 572–585. [Google Scholar] [CrossRef] [PubMed]
- Pletzer, B.; Harris, T.; Hidalgo-Lopez, E. Subcortical structural changes along the menstrual cycle: Beyond the hippocampus. Sci. Rep. 2018, 8, 16042. [Google Scholar] [CrossRef]
- Faas, M.M.; Melgert, B.N.; de Vos, P. A brief review on how pregnancy and sex hormones interfere with taste and food intake. Chemosens. Percept. 2010, 3, 51–56. [Google Scholar] [CrossRef] [PubMed]
- Martin, L.J.; Sollars, S.I. Contributory role of sex differences in the variations of gustatory function. J. Neurosci. Res. 2017, 95, 594–603. [Google Scholar] [CrossRef] [PubMed]
- Cameron, E.L. Pregnancy and olfaction: A review. Front. Psychol. 2014, 5. [Google Scholar] [CrossRef] [PubMed]
- Navarrete-Palacios, E.; Hudson, R.; Reyes-Guerrero, G.; Guevara-Guzman, R. Lower olfactory threshold during the ovulatory phase of the menstrual cycle. Biol. Psychol. 2003, 63, 269–279. [Google Scholar] [CrossRef]
- Caruso, S.; Grillo, C.; Agnello, C.; Maiolino, L.; Intelisano, G.; Serra, A. A prospective study evidencing rhinomanometric and olfactometric outcomes in women taking oral contraceptives. Hum. Reprod. 2001, 16, 2288–2294. [Google Scholar] [CrossRef]
- Lundstrom, J.N.; McClintock, M.K.; Olsson, M.J. Effects of reproductive state on olfactory sensitivity suggest odor specificity. Biol. Psychol. 2006, 71, 244–247. [Google Scholar] [CrossRef] [PubMed]
- Kuga, M.; Ikeda, M.; Suzuki, K. Gustatory changes associated with the menstrual cycle. Physiol. Behav. 1999, 66, 317–322. [Google Scholar] [CrossRef]
- Than, T.T.; Delay, E.R.; Maier, M.E. Sucrose threshold variation during the menstrual cycle. Physiol. Behav. 1994, 56, 237–239. [Google Scholar] [CrossRef]
- Barbosa, D.E.C.; de Souza, V.R.; dos Santos, L.A.S.; de Jesus Chiappini, C.C.; de Sa, S.A.; de Azeredo, V.B. Changes in taste and food intake during the menstrual cycle. J. Nutr. Food Sci. 2015, 5, 1000383. [Google Scholar]
- Verma, P.; Mahajan, K.K.; Mittal, S.; Ghildiyal, A. Salt preference across different phases of menstrual cycle. Indian J. Physiol. Pharmacol. 2005, 49, 99–102. [Google Scholar] [PubMed]
- Alberti-Fidanza, A.; Fruttini, D.; Servili, M. Gustatory and food habit changes during the menstrual cycle. Int. J. Vitam. Nutr. Res. 1998, 68, 149–153. [Google Scholar] [PubMed]
- Hummel, T.; Sekinger, B.; Wolf, S.R.; Pauli, E.; Kobal, G. ’Sniffin’ sticks’: Olfactory performance assessed by the combined testing of odor identification, odor discrimination and olfactory threshold. Chem. Senses 1997, 22, 39–52. [Google Scholar] [CrossRef] [PubMed]
- Croy, I.; Lange, K.; Krone, F.; Negoias, S.; Seo, H.S.; Hummel, T. Comparison between odor thresholds for phenyl ethyl alcohol and butanol. Chem. Senses 2009, 34, 523–527. [Google Scholar] [CrossRef] [PubMed]
- Webb, J.; Bolhuis, D.P.; Cicerale, S.; Hayes, J.E.; Keast, R. The relationships between common measurements of taste function. Chemosens. Percept. 2015, 8, 11–18. [Google Scholar] [CrossRef] [PubMed]
- Smutzer, G.; Lam, S.; Hastings, L.; Desai, H.; Abarintos, R.A.; Sobel, M.; Sayed, N. A Test for Measuring Gustatory Function. Laryngoscope 2008, 118, 1411–1416. [Google Scholar] [CrossRef]
- Rawal, S.; Hoffman, H.J.; Honda, M.; Huedo-Medin, T.B.; Duffy, V.B. The taste and smell protocol in the 2011–2014 US National Health and Nutrition Examination Survey (NHANES): Test—Retest reliability and validity testing. Chemosens. Percept. 2015, 8, 138–148. [Google Scholar] [CrossRef]
- Reed, D.R.; Zhu, G.; Breslin, P.A.; Duke, F.F.; Henders, A.K.; Campbell, M.J.; Montgomery, G.W.; Medland, S.E.; Martin, N.G.; Wright, M.J. The perception of quinine taste intensity is associated with common genetic variants in a bitter receptor cluster on chromosome 12. Hum. Mol. Genet. 2010, 19, 4278–4285. [Google Scholar] [CrossRef]
- Azoulay, A.; Garzon, P.; Eisenberg, M.J. Comparison of the mineral content of tap water and bottled waters. J. Gen. Intern. Med. 2001, 16, 168–175. [Google Scholar] [CrossRef]
- Green, B.G.; Dalton, P.; Cowart, B.; Shaffer, G.; Rankin, K.; Higgins, J. Evaluating the ’Labeled Magnitude Scale’ for measuring sensations of taste and smell. Chem. Senses 1996, 21, 323–334. [Google Scholar] [CrossRef] [PubMed]
- Green, B.G.; Shaffer, G.S.; Gilmore, M.M. Derivation and evaluation of a semantic scale of oral sensation magnitude with apparent ratio properties. Chem. Senses 1993, 18, 683–702. [Google Scholar] [CrossRef]
- Schutz, H.G.; Cardello, A.V. A labeled affective magnitude (LAM) scale for assessing food liking/disliking. J. Sens. Stud. 2001, 16, 117–159. [Google Scholar] [CrossRef]
- Leiva, R.A.; Bouchard, T.P.; Abdullah, S.H.; Ecochard, R. Urinary luteinizing hormone tests: Which concentration threshold best predicts ovulation? Front. Public Health 2017, 5. [Google Scholar] [CrossRef] [PubMed]
- Faul, F.; Erdfelder, E.; Buchner, A.; Lang, A.G. Statistical power analyses using G*Power 3.1: Tests for correlation and regression analyses. Behav. Res. Methods 2009, 41, 1149–1160. [Google Scholar] [CrossRef]
- Watanabe, K.; Umezu, K.; Kurahashi, T. Human olfactory contrast changes during the menstrual cycle. Jpn. J. Physiol. J. 2002, 52, 353–359. [Google Scholar] [CrossRef]
- Renfro, K.J.; Hoffmann, H. The relationship between oral contraceptive use and sensitivity to olfactory stimuli. Horm. Behav. 2013, 63, 491–496. [Google Scholar] [CrossRef]
- Pause, B.M.; Sojka, B.; Krauel, K.; Fehm-Wolfsdorf, G.; Ferstl, R. Olfactory information processing during the course of the menstrual cycle. Biol. Psychol. 1996, 44, 31–54. [Google Scholar] [CrossRef]
- Hummel, T.; Gollisch, R.; Wildt, G.; Kobal, G. Changes in olfactory perception during the menstrual cycle. Experientia 1991, 47, 712–715. [Google Scholar] [CrossRef]
- Doty, R.L.; Snyder, P.J.; Huggins, G.R.; Lowry, L.D. Endocrine, cardiovascular, and psychological correlated of olfactory sensitivity changes during the human menstrual cycle. J. Comp. Physiol. Psychol. 1981, 95, 45–60. [Google Scholar] [CrossRef] [PubMed]
- Speroff, L.; Fritz, M. Clinical Gynecologic Endocrinology and Infertility; Lippincott Williams & Wilkins: Philadelphia, PA, USA, 2011. [Google Scholar]
- Hambridge, H.L.; Mumford, S.L.; Mattison, D.R.; Ye, A.; Pollack, A.Z.; Bloom, M.S.; Mendola, P.; Lynch, K.L.; Wactawski-Wende, J.; Schisterman, E.F. The influence of sporadic anovulation on hormone levels in ovulatory cycles. Hum. Reprod. 2013, 28, 1687–1694. [Google Scholar] [CrossRef]
- McNeil, J.; Cameron, J.D.; Finlayson, G.; Blundell, J.E.; Doucet, E. Greater overall olfactory performance, explicit wanting for high fat foods and lipid intake during the mid-luteal phase of the menstrual cycle. Physiol. Behav. 2013, 113, 84–89. [Google Scholar] [CrossRef] [PubMed]
- Farage, M.A.; Osborn, T.W.; MacLean, A.B. Cognitive, sensory, and emotional changes associated with the menstrual cycle: A review. Arch. Gynecol. Obstet. 2008, 278, 299–307. [Google Scholar] [CrossRef] [PubMed]
- Dahir, N.S.; Calder, A.N.; McKinley, B.J.; Liu, Y.; Gilbertson, T.A. Sex differences in fat taste responsiveness are modulated by estradiol. Am. J. Physiol. Endocrinol. Metab. 2021, 320, E566–E580. [Google Scholar] [CrossRef] [PubMed]
- Almey, A.; Milner, T.A.; Brake, W.G. Estrogen receptors in the central nervous system and their implication for dopamine-dependent cognition in females. Horm. Behav. 2015, 74, 125–138. [Google Scholar] [CrossRef]
- Gorczyca, A.M.; Sjaarda, L.A.; Mitchell, E.M.; Perkins, N.J.; Schliep, K.C.; Wactawski-Wende, J.; Mumford, S.L. Changes in macronutrient, micronutrient, and food group intakes throughout the menstrual cycle in healthy, premenopausal women. Eur. J. Nutr. 2016, 55, 1181–1188. [Google Scholar] [CrossRef]
- Jayasinghe, S.N.; Kruger, R.; Walsh, D.C.I.; Cao, G.; Rivers, S.; Richter, M.; Breier, B.H. Is sweet taste perception associated with sweet food liking and intake? Nutrients 2017, 9, 750. [Google Scholar] [CrossRef]
- Venditti, C.; Musa-Veloso, K.; Lee, H.Y.; Poon, T.; Mak, A.; Darch, M.; Juana, J.; Fronda, D.; Noori, D.; Pateman, E.; et al. Determinants of sweetness preference: A scoping review of human studies. Nutrients 2020, 12, 718. [Google Scholar] [CrossRef]
- Alves, B.; Ibuki, F.; Goncalves, A.S.; Teixeira, M.J.; De Siqueira, S. Influence of sexual hormones on neural orofacial perception. Pain. Med. 2017, 18, 1549–1556. [Google Scholar] [CrossRef]
- Weizenbaum, F.; Benson, B.; Solomon, L.; Brehony, K. Relationship among reproductive variables, sucrose taste reactivity and feeding behavior in humans. Physiol. Behav. 1980, 24, 1053–1056. [Google Scholar] [CrossRef]
- Iatridi, V.; Armitage, R.M.; Yeomans, M.R.; Hayes, J.E. Effects of sweet-liking on body composition depend on age and lifestyle: A challenge to the simple sweet-liking—Obesity hypothesis. Nutrients 2020, 12, 2702. [Google Scholar] [CrossRef]
- Wenner, M.M.; Stachenfeld, N.S. Blood pressure and water regulation: Understanding sex hormone effects within and between men and women. J. Physiol. 2012, 590, 5949–5961. [Google Scholar] [CrossRef]
- White, C.P.; Hitchcock, C.L.; Vigna, Y.M.; Prior, J.C. Fluid retention over the menstrual cycle: 1-Year data from the prospective ovulation cohort. Obstet. Gynecol. Int. 2011, 2011, 138451. [Google Scholar] [CrossRef]
- Frye, C.A.; Demolar, G.L. Menstrual cycle and sex differences influence salt preference. Physiol. Behav. 1994, 55, 193–197. [Google Scholar] [CrossRef]
- Kanarek, R.B.; Ryu, M.; Przypek, J. Preferences for foods with varying levels of salt and fat differ as a function of dietary restraint and exercise but not menstrual cycle. Physiol. Behav. 1995, 57, 821–826. [Google Scholar] [CrossRef]
- Shin, Y.K.; Martin, B.; Kim, W.; White, C.M.; Ji, S.; Sun, Y.; Smith, R.G.; Sevigny, J.; Tschop, M.H.; Maudsley, S.; et al. Ghrelin is produced in taste cells and ghrelin receptor null mice show reduced taste responsivity to salty (NaCl) and sour (citric acid) tastants. PLoS ONE 2010, 5, e12729. [Google Scholar] [CrossRef] [PubMed]
- Tucci, S.A.; Murphy, L.E.; Boyland, E.J.; Dye, L.; Halford, J.C. Oral contraceptive effects on food choice during the follicular and luteal phases of the menstrual cycle. A laboratory based study. Appetite 2010, 55, 388–392. [Google Scholar] [CrossRef] [PubMed]
- Fletcher, M.L.; Ogg, M.C.; Lu, L.; Ogg, R.J.; Boughter, J.D., Jr. Overlapping representation of primary tastes in a defined region of the gustatory cortex. J. Neurosci. 2017, 37, 7595–7605. [Google Scholar] [CrossRef]
- De Araujo, I.E.; Rolls, E.T.; Kringelbach, M.L.; McGlone, F.; Phillips, N. Taste-olfactory convergence, and the representation of the pleasantness of flavour, in the human brain. Eur. J. Neurosci. 2003, 18, 2059–2068. [Google Scholar] [CrossRef] [PubMed]
- Maier, J.X. Single-neuron responses to intraoral delivery of odor solutions in primary olfactory and gustatory cortex. J. Neurophysiol. 2017, 117, 1293–1304. [Google Scholar] [CrossRef]
- Lorenzo, P.M.D. Neural Coding of Food Is a Multisensory, Sensorimotor Function. Nutrients 2021, 13. [Google Scholar] [CrossRef]
- Oberg, C.; Larsson, M.; Backman, L. Differential sex effects in olfactory functioning: The role of verbal processing. J. Int. Neuropsychol. Soc. 2002, 8, 691–698. [Google Scholar] [CrossRef]
- Mojet, J.; Heidema, J.; Christ-Hazelhof, E. Taste perception with age: Generic or specific losses in supra-threshold intensities of five taste qualities? Chem. Senses 2003, 28, 397–413. [Google Scholar] [CrossRef]
- Guido, D.; Perna, S.; Carrai, M.; Barale, R.; Grassi, M.; Rondanelli, M. Multidimensional evaluation of endogenous and health factors affecting food preferences, taste and smell perception. J. Nutr. Health Aging 2016, 20, 971–981. [Google Scholar] [CrossRef]
- Liu, G.; Zong, G.; Doty, R.L.; Sun, Q. Prevalence and risk factors of taste and smell impairment in a nationwide representative sample of the US population: A cross-sectional study. BMJ Open 2016, 6, e013246. [Google Scholar] [CrossRef]
- Ajmani, G.S.; Suh, H.H.; Wroblewski, K.E.; Pinto, J.M. Smoking and olfactory dysfunction: A systematic literature review and meta-analysis. Laryngoscope 2017, 127, 1753–1761. [Google Scholar] [CrossRef]
- Sato, K.; Endo, S.; Tomita, H. Sensitivity of three loci on the tongue and soft palate to four basic tastes in smokers and non-smokers. Acta Oto-Laryngologica 2002, 122, 74–82. [Google Scholar] [CrossRef] [PubMed]
- Ford, O.; Lethaby, A.; Roberts, H.; Mol, B.W. Progesterone for premenstrual syndrome. Cochrane Database Syst. Rev. 2012, CD003415. [Google Scholar] [CrossRef] [PubMed]
- Yen, J.Y.; Liu, T.L.; Chen, I.J.; Chen, S.Y.; Ko, C.H. Premenstrual appetite and emotional responses to foods among women with premenstrual dysphoric disorder. Appetite 2018, 125, 18–23. [Google Scholar] [CrossRef] [PubMed]


| Men (M) N = 17 | Postmenopausal Women (pmW) N = 14 | Women Taking Oral Contraceptives (ocW) N = 10 | Women with Anovulatory Cycle (aoW) N = 8 | Women Across 1 Menstrual Cycle (1mcW) N = 21 | Women Across 2 Menstrual Cycles (2mcW) N = 29 | Overall p Value (between-Group Comparison) | Post hoc p Value (between-Group Comparison) | |
|---|---|---|---|---|---|---|---|---|
| Age; median (IQR) | 24.02 (6.24) | 56.55 (3.45) | 24.51 (1.50) | 20.56 (16.26) | 27.27 (7.87) | 27.56 (12.49) | <0.001 | <0.001 1,2, <0.001 2,3, <0.001 2,4, <0.001 2,5, <0.001 2,6 |
| BMI; median (IQR) | 24.34 (2.38) | 26.96 (3.93) | 20.71 (3.79) | 21.90 (5.68) | 20.58 (2.09) | 21.41 (2.22) | <0.001 | 0.017 1,2, 0.009 1,3, <0.001 1,5, 0.001 1,6, 0.001 2,3, 0.017 2,4, <0.001 2,5, <0.001 2,6 |
| WHR; median (IQR) | 0.84 (0.05) | 0.86 (0.14) | 0.71 (0.05) | 0.76 (0.05) | 0.73 (0.03) | 0.73 (0.06) | <0.001 | <0.001 1,3, <0.001 1,4, <0.001 1,5, <0.001 1,6, <0.001 2,3, 0.006 2,4, <0.001 2,5, <0.001 2,6 |
| WtHR; median (IQR) | 0.46 (0.05) | 0.54 (0.09) | 0.41 (0.04) | 0.43 (0.08) | 0.42 (0.02) | 0.41 (0.07) | <0.001 | <0.001 1,2, 0.006 1,3, <0.001 1,5, 0.013 1,6, <0.001 2,3, 0.001 2,4, <0.001 2,5, <0.001 2,6 |
| SES; median (IQR) | 3.50 (1.00) | 4.00 (1.00) | 3.00 (1.00) | 3.00 (1.80) | 3.50 (1.00) | 4.00 (1.00) | 0.330 | Na |
| Smoking; n (%) | 0.064 | Na | ||||||
| Current | 3 (17.60) | 3 (21.40) | 1 (10.00) | 3 (37.50) | 12 (57.10) | 10 (34.50) | ||
| Never/ex-smokers | 14 (82.40) | 11 (78.60) | 9 (90.00) | 5 (62.50) | 9 (42.90) | 19 (65.50) |
| Men (M) N = 17 | Postmenopausal Women (pmW) N = 14 | Women Taking Oral Contraceptives (ocW) N = 10 | Women with Anovulatory Cycle (aoW) N = 8 | Women Across 1 Menstrual Cycle (1mcW) N = 21 | Women Across 2 Menstrual Cycles (2mcW) * N = 29 | Overall p Value (between-Groups Comparison) | Post hoc p Value (between-Group Comparison) | |
|---|---|---|---|---|---|---|---|---|
| Threshold; mean ± SD | ||||||||
| 1st measurement/mid-follicular | 9.38 ± 2.13 | 8.95 ± 1.83 | 10.35 ± 1.63 | 11.50 ± 2.82 | 10.00 ± 1.69 | 10.28 ± 2.68 | 0.124 | Na |
| 2nd measurement/ovulation | 10.71 ± 2.40 | 8.64 ± 2.81 | 10.60 ± 2.26 | 10.81 ± 1.96 | 10.58 ± 1.90 | 9.90 ± 2.94 | 0.183 | Na |
| 3rd measurement/mid-luteal | 9.93 ± 1.57 | 10.64 ± 1.81 | 9.65 ± 2.67 | 10.19 ± 1.72 | 11.26 ± 1.72 | 9.84 ± 2.69 | 0.205 | Na |
| 4th measurement/late luteal | 10.56 ± 1.80 | 9.60 ± 2.53 | 0.145 | Na | ||||
| Overall p value (within-group comparison) | 0.098 | F(2,26) = 5.84, partial ɳ2 = 0.31; 0.008 | 0.555 | 0.504 | 0.120 | 0.611 | ||
| Post hoc p value | Na | 0.0301st,3rd, 0.0122nd,3rd | Na | Na | Na | Na | ||
| Linear fit p value | 0.731 | 0.423 | 0.497 | 0.017 | 0.410 | 0.038 | ||
| Trigonometric fit p value | - | - | - | - | 0.366 | 0.432 | ||
| Discrimination; mean ± SD | ||||||||
| 1st measurement/mid-follicular | 12.24 ± 1.56 | 11.50 ± 1.65 | 12.60 ± 1.08 | 12.13 ± 1.89 | 12.05 ± 2.25 | 12.62 ± 1.92 | 0.530 | Na |
| 2nd measurement/ovulation | 13.12 ± 1.27 | 10.50 ± 1.74 | 13.20 ± 1.69 | 13.25 ± 1.28 | 12.62 ± 1.56 | 13.14 ± 1.30 | F(5,93) = 7.60, partial ɳ2 = 0.29; <0.001 | <0.001 1,2, <0.001 2,3, 0.001 2,4, 0.001 2,5, <0.001 2,6 |
| 3rd measurement/mid-luteal | 12.82 ± 1.81 | 11.00 ± 1.78 | 13.60 ± 1.65 | 13.50 ± 1.60 | 13.14 ± 1.01 | 12.62 ± 1.78 | F(5,93) = 4.39, partial ɳ2 = 0.19; 0.001 | 0.029 1,2, 0.003 2,3, 0.010 2,4, 0.003 2,5, 0.033 2,6 |
| 4th measurement/late luteal | 13.52 ± 1.25 | 12.76 ± 1.77 | 0.096 | Na | ||||
| Overall p value (within-group comparison) | 0.235 | 0.233 | 0.314 | 0.124 | F(3,60) = 3.87, partial ɳ2 = 0.16; 0.013 | 0.500 | ||
| Post hoc p value | Na | Na | Na | Na | - | Na | ||
| Linear fit p-value | 0.551 | 0.667 | 0.073 | 0.224 | 0.004 | 0.946 | ||
| Trigonometric fit p-value | - | - | - | - | 0.138 | 0.950 | ||
| Identification; mean ± SD | ||||||||
| 1st measurement/mid-follicular | 13.24 ± 1.25 | 11.57 ± 1.83 | 13.70 ± 1.83 | 13.88 ± 1.136 | 12.67 ± 1.98 | 13.34 ± 1.72 | F(5,93) = 3.20, partial ɳ2 = 0.15; 0.010 | 0.082 1,2, 0.037 2,3 |
| 2nd measurement/ovulation | 13.47 ± 1.13 | 11.43 ± 1.51 | 14.00 ± 1.63 | 14.50 ± 1.20 | 13.38 ± 1.66 | 13.83 ± 1.28 | F(5,93) = 7.35, partial ɳ2 = 0.28; <0.001 | 0.002 1,2, <0.001 2,3, <0.001 2,4, 0.002 2,5, <0.001 2,6 |
| 3rd measurement/mid-luteal | 13.53 ± 1.33 | 11.21 ± 2.08 | 14.90 ± 1.20 | 13.89 ± 1.55 | 13.52 ± 2.02 | 13.34 ± 1.40 | F(5,93) = 6.77, partial ɳ2 = 0.27; <0.001 | 0.002 1,2, <0.001 2,3, 0.005 2,4, 0.001 2,5, 0.002 2,6 |
| 4th measurement/late luteal | 14.19 ± 1.50 | 13.48 ± 1.70 | 0.135 | Na | ||||
| Overall p value (within-group comparison) | 0.647 | 0.766 | 0.036 | 0.360 | F(3,60) = 8.20, partial ɳ2 = 0.29; <0.001 | 0.342 | ||
| Post hoc p value | Na | Na | - | Na | 0.0011st,4th, 0.0282nd,4th | Na | ||
| Linear fit p value | 0.208 | 0.081 | 0.179 | 0.991 | 0.026 | 0.966 | ||
| Trigonometric fit p value | - | - | - | - | 0.435 | 0.957 | ||
| TDI score; mean ± SD | ||||||||
| 1st measurement/mid-follicular | 34.85 ± 3.36 | 32.02 ± 3.33 | 36.65 ± 2.30 | 37.50 ± 4.65 | 34.71 ± 3.99 | 36.09 ± 3.84 | F(5,93) = 3.48, partial ɳ2 = 0.16; 0.006 | 0.035 2,3, 0.014 2,4, 0.012 2,6 |
| 2nd measurement/ovulation | 37.29 ±3.21 | 30.57 ± 4.20 | 37.80 ± 3.84 | 38.56 ± 2.68 | 36.58 ± 3.79 | 36.86 ± 3.48 | F(5,93) = 8.47, partial ɳ2 = 0.31; <0.001 | <0.001 1,2, <0.001 2,3, <0.001 2,4, <0.001 2,5, <0.001 2,6 |
| 3rd measurement/mid-luteal | 36.28 ± 3.47 | 32.86 ± 4.47 | 38.15 ± 3.16 | 37.56 ± 3.01 | 37.93 ± 2.92 | 35.80 ± 3.06 | F(5,93) = 4944, partial ɳ2 = 0.21; <0.001 | 0.003 2,3, 0.024 2,4, <0.001 2,5, 0.003 2,6 |
| 4th measurement/late luteal | 38.27 ± 2.36 | 35.85 ± 3.57 | F(5,93) = 7.37, partial ɳ2 = 0.13; 0.009 | Na | ||||
| Overall p value (within-group comparison) | F(2,32) = 3.93, partial ɳ2 = 0.20; 0.030 | 0.085 | 0.430 | 0.797 | F(3,60) = 7.72, partial ɳ2 = 0.28; <0.001 | 0.425 | ||
| Post hoc p value | 0.0281st,2nd | Na | Na | Na | 0.0041st,3rd, 0.0051st,4th | Na | ||
| Linear fit p value | 0.605 | 0.764 | 0.192 | 0.966 | 0.039 | 0.532 | ||
| Trigonometric fit p value | - | - | - | - | 0.106 | 0.818 | ||
| Olfactory Threshold Estimate (95% CI); P | Olfactory Discrimination Estimate (95% CI); P | Olfactory Identification Estimate (95% CI); P | TDI Score Estimate (95% CI); P | |
|---|---|---|---|---|
| Group (women across 2 cycles are referent group) | ||||
| Men (M) | −0.05 (−1.43–1.34); 0.945 | 0.07 (−0.91–1.05); 0.893 | 0.49 (−0.44–1.42); 0.297 | 0.52 (−1.61–2.64); 0.632 |
| Postmenopausal women (pmW) | 1.33 (−1.06–3.74); 0.273 | −1.02 (−2.59–0.55); 0.203 | −2.53 (−4.22–−0.85); 0.004 | −2.21 (−5.94–1.51); 0.242 |
| Women taking oral contraceptives (ocW) | −0.07 (−1.75–1.63); 0.939 | 0.74 (−0.46–1.94); 0.225 | 1.79 (0.65–2.93); 0.002 | 2.47 (−1.13–5.06); 0.062 |
| Women with anovulatory cycle (aoW) | 0.43 (−1.40–2.26); 0.643 | 0.71 (0.59–2.01); 0.281 | 0.58 (−0.65–1.81); 0.352 | 1.73 (−1.08–4.54); 0.226 |
| Women across 1 menstrual cycle (1mcW) | 1.10 (−0.25–2.45); 0.109 | 0.84 (−1.12–1.79); 0.087 | 0.88 (−0.18–1.79); 0.055 | 2.81 (0.74–4.87); 0.008 |
| Time (last measurement is referent group) | ||||
| 1st measurement/mid-follicular | 0.90 (−0.04–1.84); 0.059 | −0.30 (−1.07–0.47); 0.448 | −0.14 (−0.70–0.41); 0.608 | 0.32 (−1.08–1.71); 0.655 |
| 2nd measurement/ovulation | 0.22 (−0.72–1.16); 0.641 | 0.36 (−0.41–1.13); 0.363 | 0.37 (−0.18–0.93); 0.189 | 0.96 (−0.43–2.36); 0.175 |
| 3rd measurement/mid-luteal | 0.34 (−0.60–1.28); 0.472 | −0.06 (−0.83–0.71); 0.886 | −0.07 (−0.63–0.48); 0.788 | 0.22 (−1.17–1.62); 0.754 |
| Group*time (the last measurement is referent group) | ||||
| Men*1st measurement | −0.85 (−2.36–0.65); 0.265 | −0.31 (−1.55–0.92); 0.617 | −0.38 (−1.26–0.51); 0.406 | −1.39 (−3.62–0.84); 0.222 |
| Men*2nd measurement | 1.26 (−0.24–2.76); 0.100 | −0.08 (−1.32–1.15); 0.898 | −0.61 (−1.50–0.27); 0.174 | 0.56 (−1.67–2.80); 0.619 |
| Postmenopausal women (pmW)*1st measurement | −2.21 (−3.88–−0.54); 0.010 | 0.86 (−0.52–2.23); 0.221 | 0.84 (−0.15–1.83); 0.096 | −0.36 (−2.85–2.12); 0.773 |
| Postmenopausal women (pmW)*2nd measurement | −1.96 (−3.63–−0.28); 0.022 | −0.64 (−2.02–0.73); 0.356 | 0.01 (−0.98–1.00); 0.979 | −2.59 (−5.07–−0.11); 0.041 |
| Women taking oral contraceptives (ocW)*1st measurement | 0.14 (−1.70–1.98); 0.881 | −0.76 (−2.27–0.75); 0.323 | −1.13 (−2.22–−0.04); 0.041 | −1.59 (−4.32–1.31); 0.250 |
| Women taking oral contraceptives (ocW)*2nd measurement | 1.07 (−0.76–2.91); 0.252 | −0.81 (−2.32–0.70); 0.289 | −1.35 (−2.43–−0.26); 0.015 | −1.09 (−3.82–1.64); 0.431 |
| Women with anovulatory cycle (aoW)*1st measurement | 0.75 (−1.25–2.75); 0.459 | −1.13 (−2.78–0.51); 0.176 | 0.07 (−1.11–1.25); 0.909 | −0.15 (−3.13–2.81); 0.917 |
| Women with anovulatory cycle (aoW)*2nd measurement | 0.75 (−1.25–2.74); 0.463 | −0.66 (−2.31–0.98); 0.427 | 0.18 (−1.00–1.36); 0.769 | 0.26 (−2.71–3.23); 0.864 |
| Women across 1 menstrual cycle (1mcW)*1st measurement | −1.47 (−2.91–−0.2); 0.047 | −1.26 (−2.45–−0.07); 0.038 | −1.37 (−2.22–−0.51); 0.002 | −3.93 (−6.08–−1.78); <0.001 |
| Women across 1 menstrual cycle (1mcW)*2nd measurement | −0.52 (−1.97–0.92); 0.477 | −1.37 (−2.56–−0.18); 0.024 | −1.16 (−2.01–−0.30); 0.008 | −3.04 (−5.19–−0.89); 0.006 |
| Women across 1 menstrual cycle (1mcW)*3rd measurement | 0.38 (−1.07–1.83); 0.606 | −0.41 (−1.60–0.78); 0.496 | −0.62 (−1.47–0.24); 0.157 | −0.64 (−2.79–1.51); 0.556 |
| Age | −0.02 (−0.08–0.04); 0.462 | −0.04 (−0.07–−0.01); 0.046 | 0.01 (−0.03–0.05); 0.677 | −0.05 (−0.14–0.04); 0.292 |
| Smoking (yes is referent group) | −0.14 (−0.96–0.67); 0.730 | 0.25 (−0.25–0.75); 0.319 | −0.57 (−1.17–0.17); 0.057 | −0.48 (−1.76–0.80); 0.455 |
| WtHR (elevated is referent group) | −0.18 (−1.23–0.87); 0.733 | −0.25 (−0.90–0.40); 0.443 | −0.09 (−0.75–0.67); 0.819 | −0.50 (−2.15–1.15); 0.547 |
| Men (M) N = 16 | Postmenopausal Women (pmW) N = 14 | Women Taking Oral Contraceptives (ocW) N = 8 | Women with Anovulatory Cycle (aoW) N = 8 | Women Across 1 Menstrual Cycle (1mcW) N = 18 | Women Across 2 Menstrual Cycles (2mcW) * N = 29 | Overall p Value (between-Group Comparison) | Post hoc p Value (between-Group Comparison) | |
|---|---|---|---|---|---|---|---|---|
| Sweet taste intensity (mm); mean ± SD | ||||||||
| 1st measurement/mid-follicular | 63.69 ± 26.79 | 38.50 ± 26.47 | 26.38 ± 26.75 | 44.25 ± 21.04 | 48.89 ± 17.58 | 55.14 ± 21.21 | F(5,87) = 4.34, partial ɳ2 = 0.20; 0.001 | 0.026 1,2, 0.002 1,3, 0.017 3,6 |
| 2nd measurement/ovulation | 62.56 ± 25.83 | 48.79 ± 30.29 | 34.38 ± 9.94 | 59.50 ± 32.81 | 53.56 ± 25.63 | 52.03 ± 23.32 | 0.200 | Na |
| 3rd measurement/mid-luteal | 60.31 ± 23.60 | 43.00 ± 15.47 | 45.88 ± 21.30 | 43.25 ± 28.57 | 61.83 ± 26.52 | 47.86 ± 20.02 | 0.068 | Na |
| 4th measurement/late luteal | 53.61 ± 26.25 | 54.62 ± 20.46 | 0.883 | Na | ||||
| Overall p value (within-group comparison) | 0.746 | 0.282 | F(2,14) = 8.87, partial ɳ2 = 0.56; 0.003 | 0.148 | 0.142 | 0.362 | ||
| Post hoc p value | Na | Na | 0.0181st,3rd | Na | Na | Na | ||
| Linear fit p value | 0.121 | 0.713 | 0.066 | 0.965 | 0.462 | 0.779 | ||
| Trigonometric fit p value | - | - | - | - | 0.507 | 0.535 | ||
| Sweet taste hedonics (mm); mean ± SD | ||||||||
| 1st measurement/mid-follicular | 20.31 ± 19.93 | −3.29 ± 22.29 | 12.00 ± 19.50 | 8.88 ± 18.07 | 3.56 ± 20.84 | 9.69 ± 20.15 | 0.051 | Na |
| 2nd measurement/ovulation | 24.13 ± 14.46 | 3.71 ± 18.61 | 15.00 ± 19.40 | 13.88 ± 16.94 | 8.50 ± 19.41 | 8.79 ± 20.36 | 0.051 | Na |
| 3rd measurement/mid-luteal | 24.25 ± 13.13 | 0.86 ± 19.37 | 13.50 ± 16.51 | 18.00 ± 10.93 | 12.67 ± 15.35 | 8.04 ± 18.78 | F(5,87) = 3.55, partial ɳ2 = 0.17; 0.006 | 0.003 1,2, 0.028 1,6 |
| 4th measurement/late luteal | 12.44 ± 10.97 | 10.41 ± 18.59 | 0.677 | Na | ||||
| Overall p value (within-group comparison) | 0.388 | 0.610 | 0.517 | 0.328 | 0.150 | 0.938 | ||
| Linear fit p value | 0.316 | 0.599 | 0.667 | 0.035 | 0.069 | 0.824 | ||
| Trigonometric fit p value | - | - | - | - | 0.011 | 0.486 | ||
| Salt taste intensity (mm); mean ± SD | ||||||||
| 1st measurement/mid-follicular | 83.81 ± 26.94 | 56.21 ± 22.33 | 59.00 ± 11.86 | 59.75 ± 31.83 | 63.83 ± 23.70 | 71.38 ± 26.90 | F(5,87) = 2.45, partial ɳ2 = 0.12; 0.040 | 0.041 1,2 |
| 2nd measurement/ovulation | 83.06 ± 25.64 | 54.00 ± 24.45 | 64.75 ± 14.45 | 71.38 ± 36.88 | 77.94 ± 26.52 | 75.38 ± 23.57 | F(5,87) = 2.43, partial ɳ2 = 0.12; 0.041 | 0.028 1,2 |
| 3rd measurement/mid-luteal | 73.00 ± 27.53 | 59.07 ± 26.57 | 73.00 ± 19.82 | 66.13 ± 27.46 | 82.33 ± 22.72 | 71.10 ± 28.01 | 0.256 | Na |
| 4th measurement/late luteal | 71.78 ± 25.18 | 78.48 ± 20.84 | 0.328 | Na | ||||
| Overall p value (within-group comparison) | 0.175 | 0.792 | 0.115 | 0.545 | F(3,51) = 5.20, partial ɳ2 = 0.23; 0.003 | 0.477 | ||
| Post hoc p value | Na | Na | Na | Na | 0.0191st,3rd | Na | ||
| Linear fit p value | 0.297 | 0.620 | 0.065 | 0.631 | 0.546 | 0.376 | ||
| Trigonometric fit p value | - | - | - | - | 0.033 | 0.899 | ||
| Salt taste hedonics (mm); mean ± SD | ||||||||
| 1st measurement/mid-follicular | −20.06 ± 21.64 | −11.88± 17.94 | −22.13 ± 16.69 | −9.63 ± 24.84 | −22.56 ± 21.51 | −14.66 ± 24.16 | 0.564 | Na |
| 2nd measurement/ovulation | −11.63 ± 22.23 | −16.14 ± 22.99 | −12.63 ± 23.76 | −8.38 ± 21.30 | −7.44 ± 26.75 | −11.45 ± 23.06 | 0.942 | Na |
| 3rd measurement/mid-luteal | −1.00 ± 25.83 | −22.07 ± 17.66 | −18.75 ± 16.70 | 0.25 ± 18.14 | −6.33 ± 26.37 | −11.69 ± 22.40 | 0.085 | Na |
| 4th measurement/late luteal | −3.17 ± 25.07 | −12.45 ± 24.95 | 0.222 | Na | ||||
| Overall p value (within-group comparison) | F(1.35,20.33) = 5.56, partial ɳ2 = 0.27; 0.020 | 0.350 | 0.357 | 0.303 | F(1.86,31.55) = 9.02, partial ɳ2 = 0.35; 0.001 | 0.727 | ||
| Post hoc p value | 0.0422nd,3rd | Na | Na | Na | 0.0231st,3rd, 0.0071st,4th | Na | ||
| Linear fit p value | 0.042 | 0.060 | 0.772 | 0.259 | 0.115 | 0.436 | ||
| Trigonometric fit p value | - | - | - | - | 0.435 | 0.410 | ||
| Sour taste intensity (mm); mean ± SD | ||||||||
| 1st measurement/mid-follicular | 65.56 ± 32.408 | 50.00 ± 23.57 | 56.38 ± 24.75 | 63.50 ± 34.42 | 62.11 ± 26.43 | 66.45 ± 25.95 | 0.550 | Na |
| 2nd measurement/ovulation | 75.81 ± 24.40 | 54.64 ± 22.38 | 66.00 ± 29.34 | 66.88 ± 29.56 | 77.11 ± 29.50 | 71.55 ± 24.47 | 0.205 | Na |
| 3rd measurement/mid-luteal | 69.19 ± 26.61 | 54.50 ± 23.56 | 77.25 ± 26.91 | 71.38 ± 25.81 | 74.39 ± 24.57 | 61.41 ± 21.91 | 0.135 | Na |
| 4th measurement/late luteal | 69.17 ± 31.86 | 71.69 ± 28.35 | 0.779 | Na | ||||
| Overall p value (within-group comparison) | 0.293 | 0.584 | 0.119 | 0.734 | F(3,51) = 3.00, partial ɳ2 = 0.15; 0.039 | 0.148 | ||
| Post hoc p value | Na | Na | Na | Na | 0.0481st,3rd | Na | ||
| Linear fit p value | 0.773 | 0.305 | 0.029 | 0.052 | 0.639 | 0.853 | ||
| Trigonometric fit p value | - | - | - | - | 0.425 | 0.987 | ||
| Sour taste hedonics (mm); mean ± SD | ||||||||
| 1st measurement/mid-follicular | 4.94 ± 21.33 | −9.21± 14.30 | −19.88 ± 19.59 | 0.63 ± 19.326 | −3.06 ± 29.97 | −5.93 ± 17.69 | 0.129 | Na |
| 2nd measurement/ovulation | 4.00 ± 23.06 | −9.64 ± 21.58 | −9.88 ± 28.63 | −3.63 ± 20.02 | −0.17 ± 25.40 | −2.45 ± 20.45 | 0.594 | Na |
| 3rd measurement/mid-luteal | 5.00 ± 22.21 | −1.79 ± 22.04 | −23.00 ± 18.72 | 3.87 ± 13.10 | 2.00 ± 28.20 | −6.04 ± 20.40 | 0.064 | Na |
| 4th measurement/late luteal | 5.83 ± 24.16 | −0.10 ± 21.99 | 0.391 | Na | ||||
| Overall p value (within-group comparison) | 0.954 | 0.436 | 0.405 | 0.331 | 0.243 | 0.169 | ||
| Linear fit p value | 0.965 | 0.364 | 0.854 | 0.716 | 0.006 | 0.377 | ||
| Trigonometric fit p value | - | - | - | - | 0.261 | 0.908 | ||
| Bitter taste intensity (mm); mean ± SD | ||||||||
| 1st measurement/mid-follicular | 74.25 ± 29.93 | 59.71 ± 35.76 | 45.00 ± 22.56 | 56.88 ± 27.73 | 67.50 ± 35.94 | 73.45 ± 33.68 | 0.232 | Na |
| 2nd measurement/ovulation | 84.06 ± 25.88 | 60.64 ± 35.22 | 58.38 ± 21.69 | 61.13 ± 33.05 | 70.94 ± 37.17 | 74.93 ± 33.96 | 0.288 | Na |
| 3rd measurement/mid-luteal | 80.69 ± 25.60 | 58.29 ± 36.51 | 65.88 ± 27.49 | 72.63 ± 33.98 | 72.06 ± 34.75 | 65.83 ± 36.05 | 0.558 | Na |
| 4th measurement/late luteal | 75.22 ± 28.23 | 72.38 ± 31.66 | 0.757 | Na | ||||
| Overall p value within-group comparison) | 0.254 | 0.968 | 0.247 | 0.270 | 0.669 | 0.414 | ||
| Linear fit p value | 0.553 | 0.589 | 0.103 | 0.165 | 0.016 | 0.604 | ||
| Trigonometric fit p value | - | - | - | - | 0.375 | 0.886 | ||
| Bitter taste hedonics (mm); mean ± SD | ||||||||
| 1st measurement/mid-follicular | −33.75 ± 11.13 | −21.54 ± 19.29 | −31.38 ± 10.85 | −27.88 ± 18.79 | −28.00 ± 18.48 | −33.79 ± 12.17 | 0.185 | Na |
| 2nd measurement/ovulation | −28.81 ± 16.71 | −28.36 ± 18.38 | −30.00 ± 16.18 | −25.50 ± 14.51 | −26.28 ± 24.53 | −33.79 ± 12.99 | 0.724 | Na |
| 3rd measurement/mid-luteal | −28.44 ± 16.90 | −24.43 ± 18.58 | −34.50 ± 11.75 | −34.13 ± 12.29 | −26.56 ± 23.07 | −24.28 ± 20.07 | 0.648 | Na |
| 4th measurement/late luteal | −25.89 ± 21.88 | −30.17 ± 14.92 | 0.429 | Na | ||||
| Overall p value (within-group comparison) | 0.107 | 0.571 | 0.543 | 0.255 | 0.893 | F(1.94,54.37) = 3.9, partial ɳ2 = 0.13; 0.025 | ||
| Post hoc p value | Na | Na | Na | Na | Na | - | ||
| Linear fit p value | 0.293 | 0.722 | 0.526 | 0.505 | 0.151 | 0.414 | ||
| Trigonometric fit p value | - | - | - | - | 0.627 | 0.752 | ||
| Sweet taste Intensity Estimate (95% CI); P | Salt Taste Intensity Estimate (95% CI); P | Sour Taste Intensity Estimate (95% CI); P | Bitter Taste Intensity Estimate (95% CI); P | |
|---|---|---|---|---|
| Group (Women across 2 menstrual cycles are referent group) | ||||
| Men (M) | 6.90 (−4.33–24.13); 0.171 | −0.85 (−16.60–14.90); 0.915 | 5.01 (−11.78–21.79); 0.557 | 12.63 (−7.05–32.31); 0.207 |
| Postmenopausal women (pmW) | −17.21 (−42.43–8.00); 0.179 | −14.03 (−41.70–13.65); 0.317 | −2.10 (−32.47–28.27); 0.891 | 1.57 (−34.11–37.25); 0.931 |
| Women taking oral contraceptives (ocW) | −1.47 (−19.66–16.72); 0.873 | 0.29 (−19.85–20.42); 0.978 | 12.84 (−8.62–34.30); 0.239 | −4.83 (−29.99–20.33); 0.705 |
| Women with anovulatory cycle (aoW) | −5.48 (−23.55–15.59); 0.550 | −7.16 (−27.17–12.84); 0.481 | 8.54 (−12.77–29.84); 0.430 | 6.66 (−18.32–31.63); 0.599 |
| Women across 1 menstrual cycle (1mcW) | 1.34 (−12.69–15.38); 0.850 | −5.29 (−20.82–10.25); 0.503 | 0.95 (−15.62–17.51); 0.910 | 9.61 (−9.81–29.03); 0.330 |
| Time (last measurement is referent group) | ||||
| 1st measurement/mid-follicular | 0.53 (−8.05–9.11); 0.902 | −7.32 (−17.06–2.42); 0.140 | −5.43 (−14.90–4.05); 0.260 | 1.18 (−9.84–12.20); 0.833 |
| 2nd measurement/ovulation | −3.43 (−12.01–5.15); 0.432 | −2.54 (−12.27–7.20); 0.608 | 0.46 (−9.01–9.94); 0.923 | 2.61 (−8.42–13.63); 0.642 |
| 3rd measurement/mid-luteal | −7.75 (−16.33–0.83); 0.076 | −6.89 (−16.63–2.84); 0.164 | −9.89 (−19.37–−0.42); 0.041 | −4.18 (−15.20–6.84); 0.456 |
| Group*time (the last measurement is referent group) | ||||
| Men*1st measurement | −4.91 (−19.14–9.32); 0.497 | 11.24 (−4.91–27.39); 0.171 | −8.09 (−23.80–7.62); 0.311 | −11.79 (−30.07–6.49); 0.205 |
| Men*2nd measurement | −2.07 (−16.30–12.15); 0.774 | 5.71 (−10.44–21.85); 0.487 | −3.73 (−19.44–11.98); 0.640 | −3.41 (−21.69–14.87); 0.713 |
| Postmenopausal women (pmW)*1st measurement | −11.67 (−26.91–3.57); 0.133 | −1.42 (−18.71–15.88); 0.872 | −9.39 (−26.21–7.44); 0.273 | −4.66 (−24.24–14.91); 0.639 |
| Postmenopausal women (pmW)*2nd measurement | −2.09 (−17.33–13.15); 0.787 | −12.43 (−29.73–4.86); 0.158 | −10.28 (−27.11–6.55); 0.230 | −5.09 (−24.67–14.48); 0.609 |
| Women taking oral contraceptives (ocW)*1st measurement | −27.78 (−45.99–−9.58); 0.003 | −13.57 (−34.23–7.08); 0.197 | −25.34 (−45.44–−5.24); 0.014 | −26.23 (−49.62–−2.85); 0.028 |
| Women taking oral contraceptives (ocW)*2nd measurement | −15.82 (−34.03–2.38); 0.088 | −12.61 (−33.26–8.05); 0.230 | −21.61 (−41.71–−1.51); 0.035 | −14.29 (−37.67–9.10); 0.230 |
| Women with anovulatory cycle (aoW)*1st measurement | −7.29 (−25.49–10.92); 0.431 | −5.95 (−26.60–14.71); 0.571 | −12.34 (−32.45–7.76); 0.228 | −21.11 (−44.49–2.28); 0.077 |
| Women with anovulatory cycle (aoW)*2nd measurement | 11.93 (−6.28–30.13); 0.198 | 0.89 (−19.76–21.55); 0.932 | −14.86 (−34.9–5.24); 0.147 | −18.29 (−41.67–5.10); 0.125 |
| Women across 1 menstrual cycle (1mcW)*1st measurement | −3.12 (−17.09–10.84); 0.660 | −1.09 (−16.93–14.75); 0.892 | −3.81 (−19.22–11.61); 0.627 | −9.36 (−27.29–8.58); 0.305 |
| Women across 1 menstrual cycle (1mcW)*2nd measurement | 4.55 (−9.42–18.51); 0.522 | 9.07 (−6.78–24.91); 0.261 | 4.18 (−11.23–19.60); 0.593 | −7.20 (−25.13–10.74); 0.430 |
| Women across 1 menstrual cycle (1mcW)*3rd measurement | 17.69 (3.73–31.65); 0.013 | 15.72 (−0.13–31.56); 0.052 | 14.19 (−1.23–29.60); 0.071 | 1.88 (−16.05–19.82); 0.836 |
| Age | 0.01 (−0.63–0.65); 0.982 | −0.23 (−0.93–0.47); 0.518 | −0.28 (−1.06–0.50); 0.472 | −0.10 (−1.02–0.81); 0.823 |
| Smoking (yes is referent group) | 8.91 (0.10–17.73); 0.047 | 4.31 (−5.31–13.92); 0.376 | 8.78 (−1.96–19.52); 0.108 | 11.73 (−0.90–24.36); 0.068 |
| WtHR (elevated is referent group) | −14.40 (−25.82–−2.99); 0.014 | −7.70 (−20.17–4.77); 0.223 | −3.84 (−17.74–10.06); 0.584 | 6.72 (−9.63–23.07); 0.416 |
| Sweet Taste Hedonics Estimate (95% CI); P | Salt Taste Hedonics Estimate (95% CI); P | Sour Taste Hedonics Estimate (95% CI); P | Bitter Taste Hedonics Estimate (95% CI); P | |
|---|---|---|---|---|
| Group (Women across 2 menstrual cycles are referent group) | ||||
| Men (M) | 14.05 (2.90–25.19); 0.014 | 9.33 (−4.89–23.55); 0.197 | 11.12 (−2.60–24.84); 0.111 | −6.54 (−16.94–3.86); 0.216 |
| Postmenopausal women (pmW) | −5.10 (−24.33–14.12); 0.600 | 1.74 (−24.72–28.20); 0.896 | 4.84 (−20.64–30.32); 0.707 | −8.26 (−27.01–10.48); 0.385 |
| Women taking oral contraceptives (ocW) | 3.97 (−10.27–18.22); 0.583 | −10.17 (−28.35–8.02); 0.271 | −15.67 (−33.21–1.87); 0.079 | −10.27 (−23.68–3.13); 0.132 |
| Women with anovulatory cycle (aoW) | 7.59 (−6.57–21.75); 0.292 | 11.37 (−6.66–29.41); 0.215 | 9.82 (−7.58–27.22); 0.266 | −11.07 (−24.74–2.59); 0.112 |
| Women across 1 menstrual cycle (1mcW) | 3.21 (−7.78–14.20); 0.565 | 11.05 (−2.99–25.09); 0.122 | 7.65 (−5.89–21.19); 0.266 | 1.16 (−8.95–11.27); 0.821 |
| Time (last measurement is referent group) | ||||
| 1st measurement/mid-follicular | 0.54 (−6.68–7.75); 0.884 | −1.29 (−8.46–5.88); 0.724 | −5.21 (−12.18–1.75); 0.141 | −3.05 (−9.02–2.91); 0.315 |
| 2nd measurement/ovulation | −0.07 (−7.29–7.15); 0.984 | 1.57 (−5.60–8.74); 0.666 | −2.11 (−9.07–4.86); 0.551 | −3.19 (−9.15–2.78); 0.294 |
| 3rd measurement/mid-luteal | −0.50 (−7.72–6.72); 0.891 | 1.43 (−5.74–8.60); 0.695 | −6.14 (−13.11–0.82); 0.083 | 6.18 (0.21–12.15); 0.042 |
| Group*time (the last measurement is referent group) | ||||
| Men*1st measurement | −4.97 (−16.94–6.99); 0.414 | −16.35 (−28.24–−4.46); 0.007 | −0.99 (−12.54–10.56); 0.866 | 4.12 (−5.64–13.88); 0.407 |
| Men*2nd measurement | −0.55 (−12.52–11.41); 0.927 | −10.77 (−22.66–1.12); 0.076 | −5.04 (−16.58–6.51); 0.391 | 9.30 (−0.46–19.06); 0.062 |
| Postmenopausal women (pmW)*1st measurement | −3.04 (−15.84–9.78); 0.641 | 16.10 (3.37–28.83); 0.013 | −6.39 (−18.76–5.98); 0.310 | 15.73 (4.99–26.47); 0.004 |
| Postmenopausal women (pmW)*2nd measurement | 2.65 (−10.17–15.46); 0.684 | 6.93 (−5.80–19.67); 0.284 | −12.57 (−24.94–−0.21); 0.046 | 6.83 (−3.91–17.57); 0.211 |
| Women taking oral contraceptives (ocW)*1st measurement | −2.54 (−17.84–12.77); 0.744 | −0.67 (−15.87–15.55); 0.932 | 2.20 (−12.57–16.97); 0.770 | 12.04 (−0.60–24.68); 0.062 |
| Women taking oral contraceptives (ocW)*2nd measurement | 1.07 (−14.24–16.38); 0.890 | 5.98 (−9.23–21.19); 0.439 | 9.09 (−5.68–23.86); 0.226 | 13.87 (10.00–26.73); 0.035 |
| Women with anovulatory cycle (aoW)*1st measurement | −10.16 (−25.47–5.15); 0.192 | −7.16 (−22.37–8.05); 0.354 | −4.18 (−18.95–10.59); 0.578 | 15.48 (2.62–28.35); 0.019 |
| Women with anovulatory cycle (aoW)*2nd measurement | −4.55 (−19.86–10.75); 0.558 | −8.77 (−23.98–6.44); 0.257 | −11.54 (−26.31–3.23); 0.125 | 17.99 (5.12–30.86); 0.006 |
| Women across 1 menstrual cycle (1mcW)*1st measurement | −9.95 (−21.69–1.79); 0.096 | −16.71 (−28.38–−5.05); 0.005 | −1.61 (−12.94–9.72); 0.780 | 3.63 (−5.74–13.01); 0.446 |
| Women across 1 menstrual cycle (1mcW)*2nd measurement | −5.11 (−16.85–6.64); 0.392 | −3.87 (−15.53–7.80); 0.514 | −1.78 (−13.10–9.55); 0.758 | 4.26 (−5.28–13.81); 0.380 |
| Women across 1 menstrual cycle (1mcW)*3rd measurement | −0.26 (−12.01–11.48); 0.965 | −2.90 (−14.56–8.77); 0.625 | 4.67 (−6.66–16.00); 0.417 | −6.37 (−15.75–3.00); 0.182 |
| Age | −0.18 (−0.66–0.30); 0.448 | −0.43 (−1.12–0.26); 0.219 | −0.16 (−0.83–0.50); 0.625 | 0.09 (−0.39–0.56); 0.721 |
| Smoking (yes is referent group) | −0.05 (−6.66–6.55); 0.987 | 6.67 (−2.83–16.17); 0.166 | 0.01 (−9.14–9.15); 0.999 | −0.86 (−7.48–5.76); 0.797 |
| WtHR (elevated is referent group) | −4.37 (−12.94–4.20); 0.313 | 1.43 (−10.85–13.71); 0.817 | −6.32 (−18.14–5.50); 0.291 | −5.00 (−13.37–3.37); 0.239 |
Publisher’s Note: MDPI stays neutral with regard to jurisdictional claims in published maps and institutional affiliations. |
© 2021 by the authors. Licensee MDPI, Basel, Switzerland. This article is an open access article distributed under the terms and conditions of the Creative Commons Attribution (CC BY) license (https://creativecommons.org/licenses/by/4.0/).
Share and Cite
Stanić, Ž.; Pribisalić, A.; Bošković, M.; Bućan Cvitanić, J.; Boban, K.; Bašković, G.; Bartulić, A.; Demo, S.; Polašek, O.; Kolčić, I. Does Each Menstrual Cycle Elicit a Distinct Effect on Olfactory and Gustatory Perception? Nutrients 2021, 13, 2509. https://doi.org/10.3390/nu13082509
Stanić Ž, Pribisalić A, Bošković M, Bućan Cvitanić J, Boban K, Bašković G, Bartulić A, Demo S, Polašek O, Kolčić I. Does Each Menstrual Cycle Elicit a Distinct Effect on Olfactory and Gustatory Perception? Nutrients. 2021; 13(8):2509. https://doi.org/10.3390/nu13082509
Chicago/Turabian StyleStanić, Žana, Ajka Pribisalić, Maria Bošković, Jasna Bućan Cvitanić, Kristina Boban, Gabriela Bašković, Antonija Bartulić, Suzana Demo, Ozren Polašek, and Ivana Kolčić. 2021. "Does Each Menstrual Cycle Elicit a Distinct Effect on Olfactory and Gustatory Perception?" Nutrients 13, no. 8: 2509. https://doi.org/10.3390/nu13082509
APA StyleStanić, Ž., Pribisalić, A., Bošković, M., Bućan Cvitanić, J., Boban, K., Bašković, G., Bartulić, A., Demo, S., Polašek, O., & Kolčić, I. (2021). Does Each Menstrual Cycle Elicit a Distinct Effect on Olfactory and Gustatory Perception? Nutrients, 13(8), 2509. https://doi.org/10.3390/nu13082509