
Maternal Diet, Nutritional Status, and Birth-Related Factors Influencing Offspring’s Bone Mineral Density: A Narrative Review of Observational, Cohort, and Randomized Controlled Trials


Abstract
1. Introduction
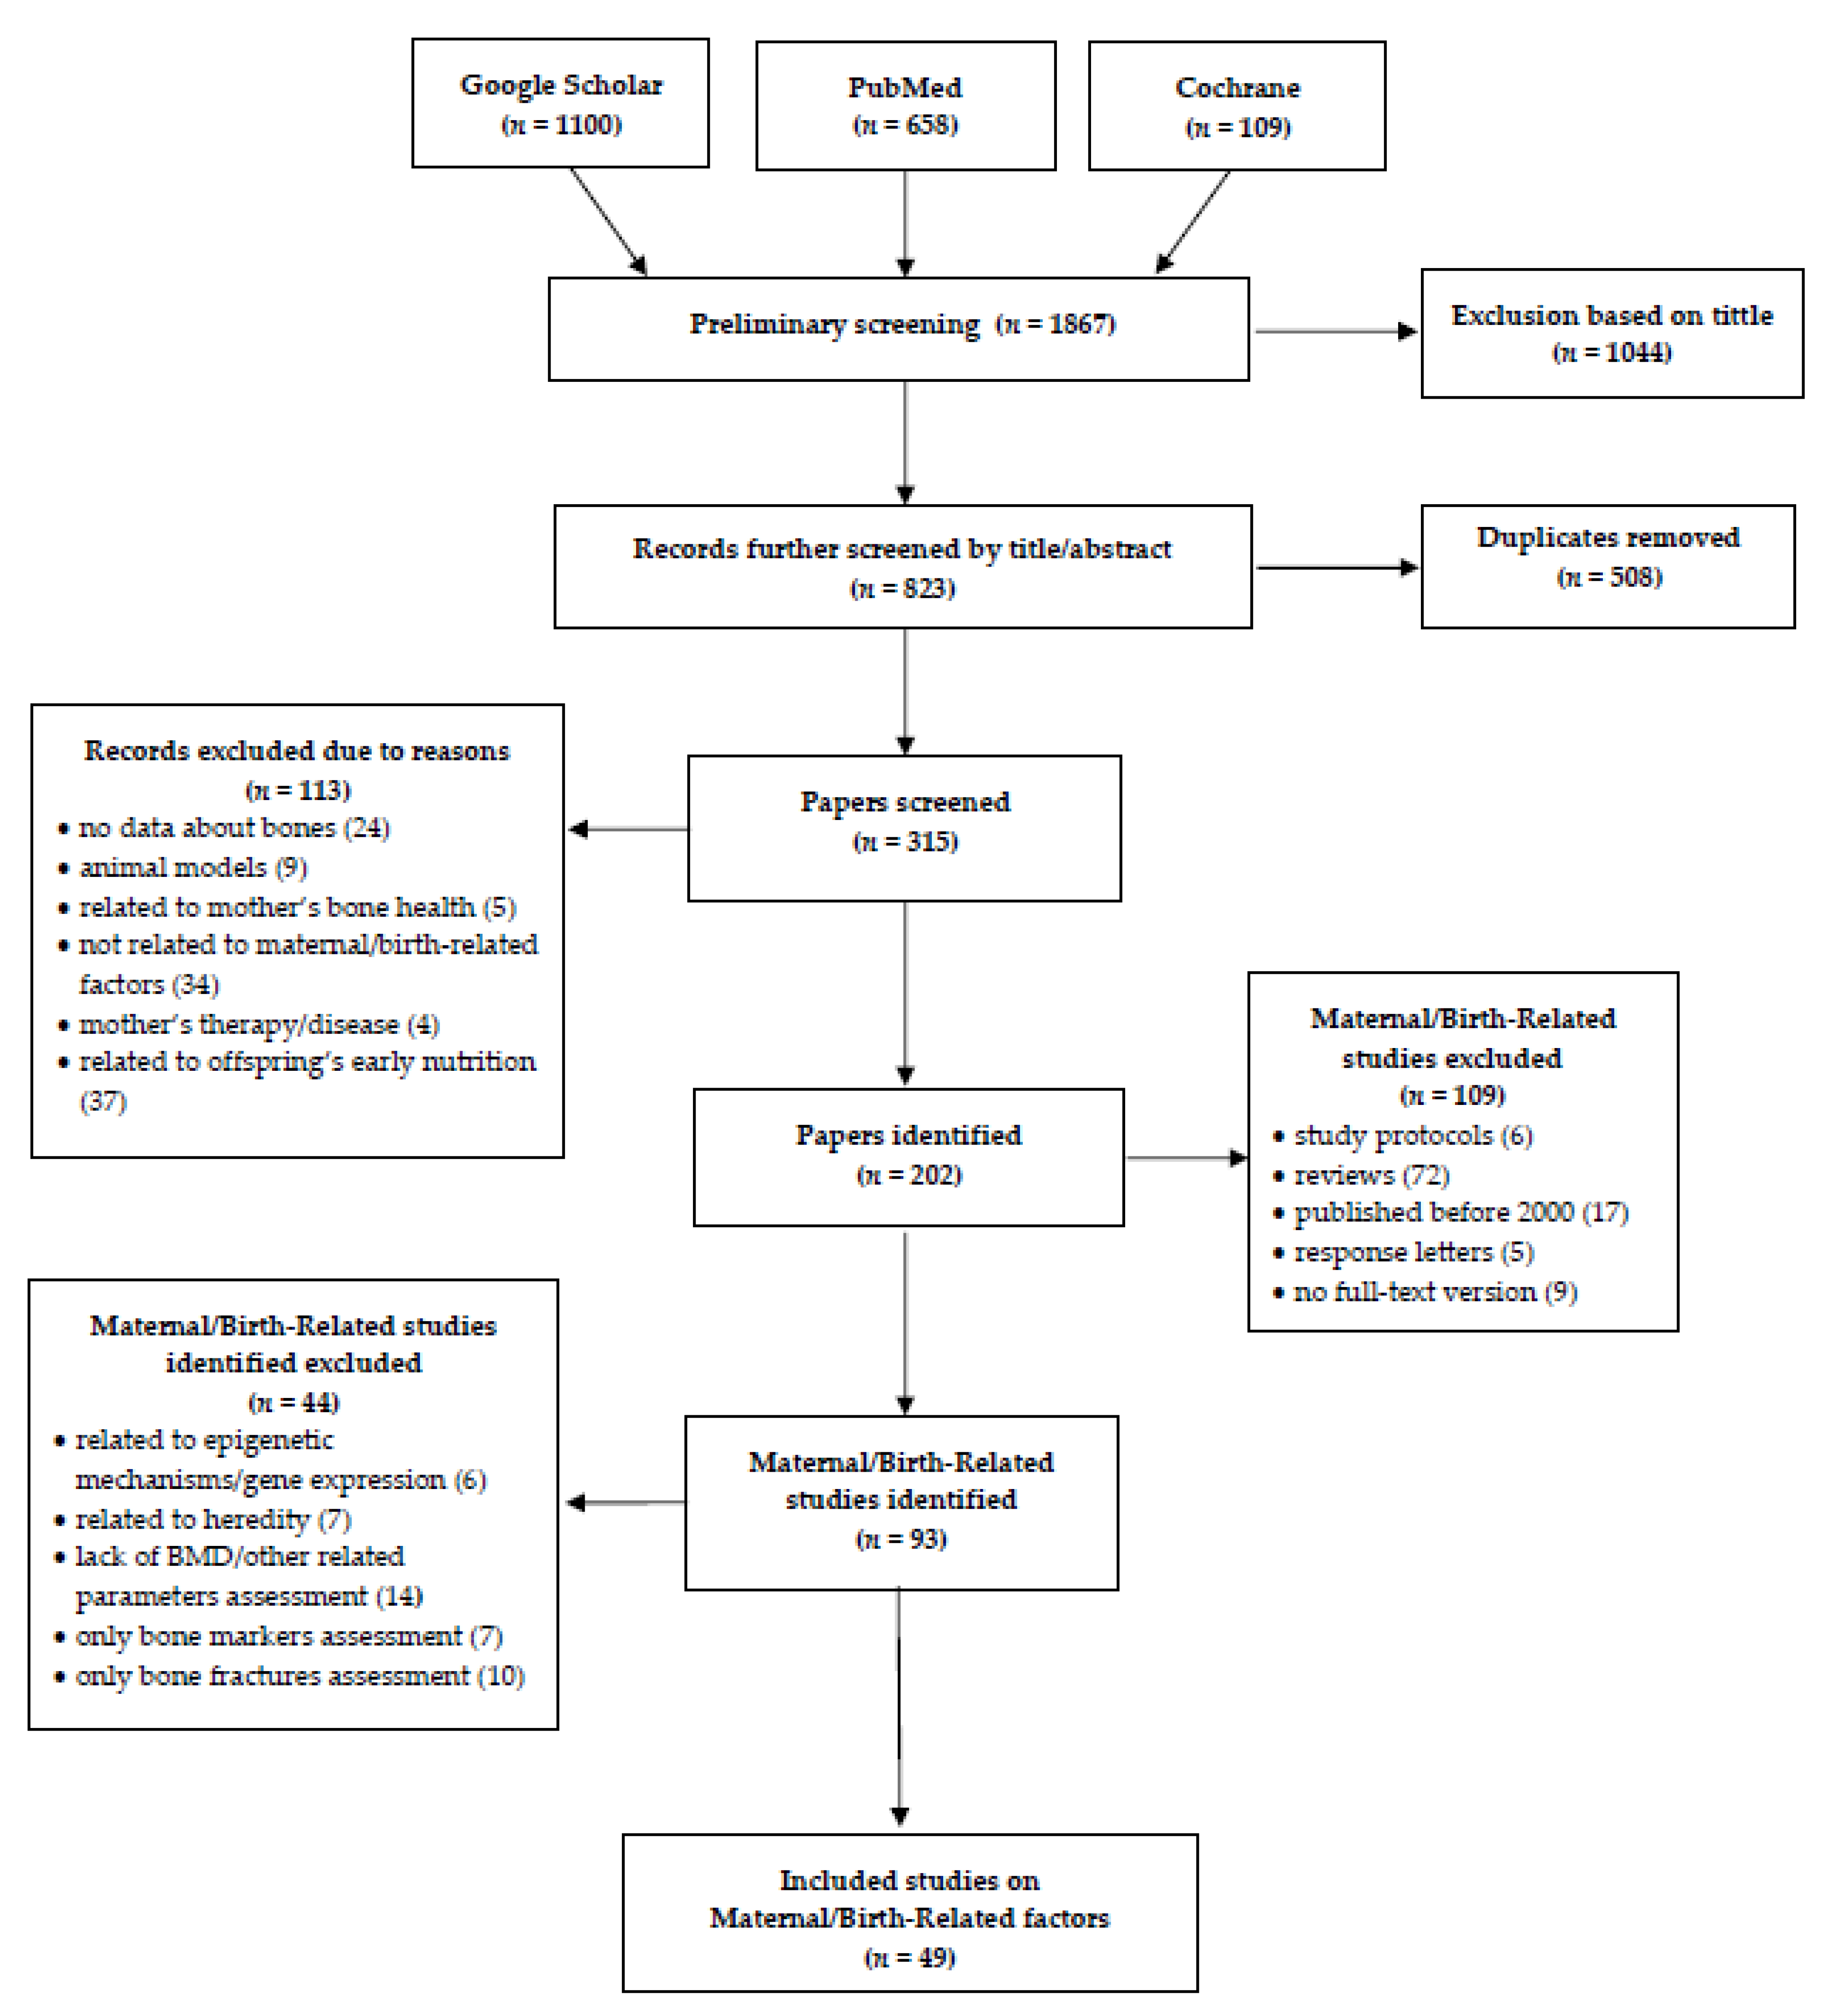
2. Methods
2.1. Search Strategy
2.2. Analysis of Included Studies
3. Findings and Discussion
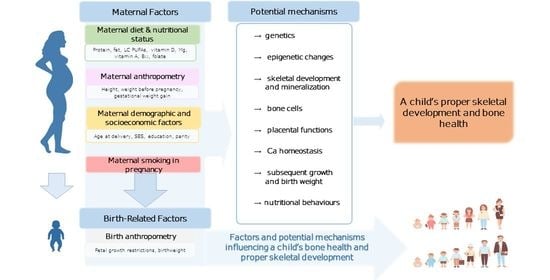
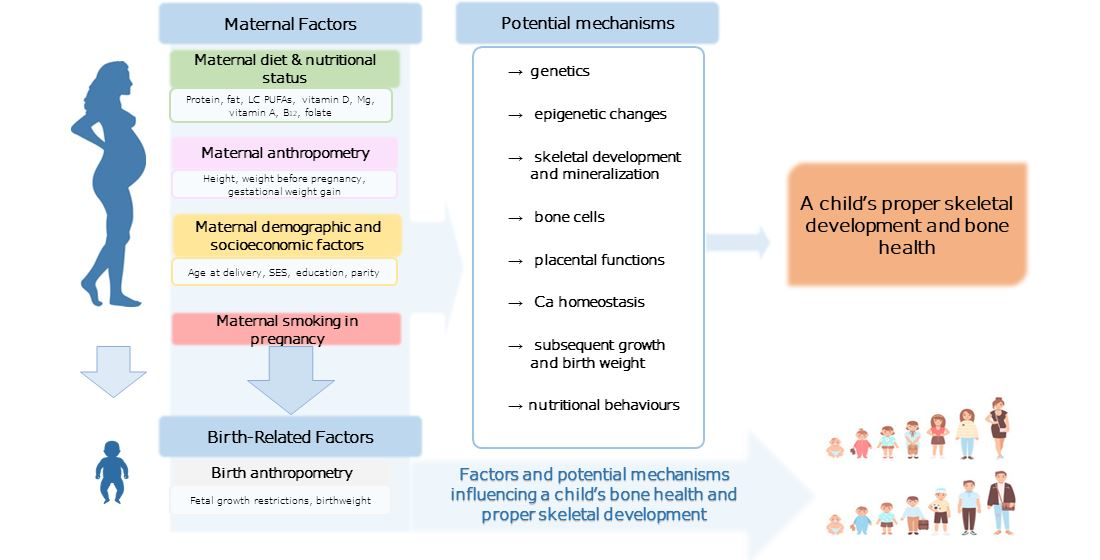
3.1. Maternal Factors
3.1.1. Dietary Intake
Macronutrients
Minerals
Group Products
Intervention Studies
3.1.2. Nutritional Status
Vitamin D Status
Other Nutrients
- Potential mechanisms of associations between maternal dietary intake, nutritional status and offspring bone outcomes
3.1.3. Maternal Anthropometry
- Potential Mechanisms of Associations between Maternal Anthropometry and Offspring Bone Outcomes
3.1.4. Maternal Demographic and Socioeconomic Factors
- Potential Mechanisms of Associations between Maternal Demographic, Socioeconomic Factors and Offspring Bone Outcomes
3.1.5. Maternal Smoking in Pregnancy
- Potential Mechanisms of Associations between Maternal Smoking in Pregnancy and Offspring Bone Outcomes
3.2. Birth-Related Factors
3.2.1. Birth Anthropometry
- Potential Mechanisms of Associations between Birth Anthropometry and Offspring Bone Outcomes
3.2.2. Gestational Age
3.3. Ambiguity in Analyzed Studies
3.4. Future Directions
Strengths and Limitations
4. Conclusions
Supplementary Materials
Author Contributions
Funding
Institutional Review Board Statement
Informed Consent Statement
Data Availability Statement
Conflicts of Interest
Abbreviations
| AA | arachidonic acid |
| aBMD | areal bone mineral density |
| AGA | appropriate for gestational age |
| ALSPAC | Avon Longitudinal Study of Parents and Children |
| BA | bone area |
| BMAD | bone mineral apparent density |
| BMC | bone mineral content |
| BMD | bone mineral density |
| BMI | body mass index |
| COPSAC2010 | Copenhagen Prospective Studies on Asthma in Childhood |
| d | days |
| DNA | deoxyribonucleic acid |
| DOHaD | Developmental Origins of the Health and Disease hypothesis |
| DPA | docosapentaenoic acid |
| DXA | dual-energy X-ray absorptiometry |
| EPA | eicosapentaenoic acid |
| F | female |
| FFQ | food frequency questionnaire |
| FN | femoral neck |
| FT | full-term |
| GH | growth hormone |
| GOOD | Gothenburg Osteoporosis and Obesity Determinants study |
| GWG | gestational weight gain |
| HRpQCT | high-resolution peripheral quantitative computed tomography |
| IGF-1 | insulin-like growth factor 1 |
| IU | International Units |
| JKB | Japan Kids Body-composition Study |
| LC PUFAs | long chain polyunsaturated fatty acids |
| LGA | large for gestational age |
| LP | late preterm |
| LS | lumbar spine |
| M | males |
| m | months |
| MAVIDOS | Maternal Vitamin D Osteoporosis Study |
| PDS | Prudent Diet Score |
| PMNS | Pune Maternal Nutrition Study |
| PRISMA | Preferred Reporting Items for Systematic Reviews and Meta-Analyses |
| PT | preterm |
| pQCT | peripheral quantitative computed tomography |
| QUS | quantitative ultrasound |
| SES | socioeconomic status |
| SGA | small for gestational age |
| SOS | speed of sound |
| SWS | Southampton Women’s Survey |
| TB | total body |
| TBLH | total body less head |
| WB | whole body |
| WBLH | whole body less head |
| wk | week |
| vBMD | volumetric bone mineral density |
| VIP | Vitamin D in Pregnancy study |
| y | years |
| 1,25(OH)2D | 1,25-dihydroxyvitamin D |
| 25(OH)D | 25-hydroxyvitamin D |
References
- Barker, D.J.P. In utero programming of chronic disease. Clin. Sci. 1998, 95, 115–128. [Google Scholar] [CrossRef]
- Schwarzenberg, S.J.; Georgieff, M.K. Advocacy for improving nutrition in the first 1000 days to support childhood development and adult health. Pediatrics 2018, 141, 1–10. [Google Scholar] [CrossRef]
- Lacagnina, S. The Developmental Origins of Health and Disease (DOHaD). Am. J. Lifestyle Med. 2020, 14, 47–50. [Google Scholar] [CrossRef]
- Zhu, Z.; Cao, F.; Li, X. Epigenetic programming and fetal metabolic programming. Front. Endocrinol. 2019, 10, 764. [Google Scholar] [CrossRef] [PubMed]
- Koletzko, B.; Brands, B.; Grote, V.; Kirchberg, F.F.; Prell, C.; Rzehak, P.; Uhl, O.; Weber, M. Long-term health impact of early nutrition: The power of programming. Ann. Nutr. Metab. 2017, 70, 161–169. [Google Scholar] [CrossRef] [PubMed]
- McDevitt, H.; McGowan, A.; Ahmed, S.F. Establishing good bone health in children. Paediatr. Child Health. 2014, 24, 78–82. [Google Scholar] [CrossRef]
- Harvey, N.; Dennison, E.; Cooper, C. Osteoporosis: A lifecourse approach. J. Bone Miner. Res. 2014, 29, 1917–1925. [Google Scholar] [CrossRef] [PubMed]
- Prentice, A.; Schoenmakers, I.; Ann Laskey, M.; de Bono, S.; Ginty, F.; Goldberg, G.R. Symposium on „Nutrition and health in children and adolescents” Session 1: Nutrition in growth and development. Nutrition and bone growth and development. Proc. Nutr. Soc. 2006, 65, 348–360. [Google Scholar] [CrossRef]
- Dennison, E.M.; Cooper, C.; Cole, Z.A. Early development and osteoporosis and bone health. J. Dev. Orig. Health Dis. 2010, 1, 142–149. [Google Scholar] [CrossRef]
- Heppe, D.H.M.; Medina-Gomez, C.; de Jongste, J.C.; Raat, H.; Steegers, E.A.P.; Hofman, A.; Rivadeneira, F.; Jaddoe, V.W.V. Fetal and childhood growth patterns associated with bone mass in school-age children: The Generation R study. J. Bone Miner. Res. 2014, 29, 2584–2593. [Google Scholar] [CrossRef]
- Cooper, C.; Harvey, N.C.; Bishop, N.J.; Kennedy, S.; Papageorghiou, A.T.; Schoenmakers, I.; Fraser, R.; Gandhi, S.V.; Carr, A.; D’Angelo, S.; et al. Maternal gestational vitamin D supplementation and offspring bone health: A multicentre, double-blind, randomised placebo-controlled trial (MAVIDOS). Lancet Diabetes Endocrinol. 2016, 4, 393–402. [Google Scholar] [CrossRef]
- Vaziri, F.; Dabbaghmanesh, M.H.; Samsami, A.; Nasiri, S.; Shirazi, P.T. Vitamin D supplementation during pregnancy on infant anthropometric measurements and bone mass of mother-infant pairs: A randomized placebo clinical trial. Early Hum. Dev. 2016, 103, 61–68. [Google Scholar] [CrossRef] [PubMed]
- Brustad, N.; Garland, J.; Thorsen, J.; Sevelsted, A.; Krakauer, M.; Vinding, R.K.; Stokholm, J.; Bønnelykke, K.; Bisgaard, H.; Chawes, B.L. Effect of high-dose vs standard-dose vitamin D supplementation in pregnancy on bone mineralization in offspring until age 6 years: A prespecified secondary analysis of a double-blinded, randomized clinical trial. JAMA Pediatr. 2020, 174, 419–427. [Google Scholar] [CrossRef] [PubMed]
- Ward, K.A.; Jarjou, L.; Prentice, A. Long-term effects of maternal calcium supplementation on childhood growth differ between males and females in a population accustomed to a low calcium intake. Bone 2017, 103, 31–38. [Google Scholar] [CrossRef] [PubMed]
- Sahoo, S.K.; Katam, K.K.; Das, V.; Agarwal, A.; Bhatia, V. Maternal vitamin D supplementation in pregnancy and offspring outcomes: A double-blind randomized placebo-controlled trial. J. Bone Miner. Metab. 2017, 35, 464–471. [Google Scholar] [CrossRef] [PubMed]
- Diogenes, M.E.L.; Bezerra, F.F.; Rezende, E.P.; Donangelo, C.M. Calcium plus vitamin d supplementation during third trimester of pregnancy in adolescents accustomed to low calcium diets did not affect infant bone mass at early lactation in a randomized controlled trial. J. Nutr. 2015, 145, 1515–1523. [Google Scholar] [CrossRef]
- Boghossian, N.S.; Koo, W.; Liu, A.; Mumford, S.L.; Tsai, M.Y.; Yeung, E.H. Longitudinal measures of maternal vitamin D and neonatal body composition. Eur. J. Clin. Nutr. 2019, 73, 424–431. [Google Scholar] [CrossRef]
- Javaid, M.K.; Crozier, S.R.; Harvey, N.C.; Gale, C.R.; Dennison, E.M.; Boucher, B.J.; Arden, N.K.; Godfrey, K.M.; Cooper, C. Maternal vitamin D status during pregnancy and childhood bone mass at age 9 years: A longitudinal study. Lancet 2006, 367, 36–43. [Google Scholar] [CrossRef]
- Heppe, D.H.M.; Medina-Gomez, C.; Hofman, A.; Franco, O.H.; Rivadeneira, F.; Jaddoe, V.W.V. Maternal first-trimester diet and childhood bone mass: The Generation R Study. Am. J. Clin. Nutr. 2013, 98, 224–232. [Google Scholar] [CrossRef]
- Jones, G.; Riley, M.D.; Dwyer, T. Maternal diet during pregnancy is associated with bone mineral density in children: A longitudinal study. Eur. J. Clin. Nutr. 2000, 54, 749–756. [Google Scholar] [CrossRef]
- Yin, J.; Dwyer, T.; Riley, M.; Cochrane, J.; Jones, G. The association between maternal diet during pregnancy and bone mass of the children at age 16. Eur. J. Clin. Nutr. 2010, 64, 131–137. [Google Scholar] [CrossRef]
- Händel, M.N.; Moon, R.J.; Titcombe, P.; Abrahamsen, B.; Heitmann, B.L.; Calder, P.C.; Dennison, E.M.; Robinson, S.M.; Godfrey, K.M.; Inskip, H.M.; et al. Maternal serum retinol and β-carotene concentrations and neonatal bone mineralization: Results from the Southampton Women’s Survey cohort. Am. J. Clin. Nutr. 2016, 104, 1183–1188. [Google Scholar] [CrossRef]
- Balasuriya, C.N.D.; Larose, T.L.; Mosti, M.P.; Evensen, K.A.I.; Jacobsen, G.W.; Thorsby, P.M.; Stunes, A.K.; Syversen, U. Maternal serum retinol, 25(OH)D and 1,25 (OH)2D concentrations during pregnancy and peak bone mass and trabecular bone score in adult offspring at 26-year follow-up. PLoS ONE 2019, 14, 1–15. [Google Scholar] [CrossRef]
- Ganpule, A.; Yajnik, C.S.; Fall, C.H.D.; Rao, S.; Fisher, D.J.; Kanade, A.; Cooper, C.; Naik, S.; Joshi, N.; Lubree, H.; et al. Bone mass in Indian children—Relationships to maternal nutritional status and diet during pregnancy: The Pune Maternal Nutrition Study. J. Clin. Endocrinol. Metab. 2006, 91, 2994–3001. [Google Scholar] [CrossRef] [PubMed]
- Weiler, H.A.; Yuen, C.K.; Seshia, M.M. Growth and bone mineralization of young adults weighing less than 1500 g at birth. Early Hum. Dev. 2002, 67, 101–112. [Google Scholar] [CrossRef]
- Foley, S.; Quinn, S.; Jones, G. Tracking of bone mass from childhood to adolescence and factors that predict deviation from tracking. Bone 2009, 44, 752–757. [Google Scholar] [CrossRef] [PubMed]
- Vierucci, F.; Saggese, G.; Cimaz, R. Osteoporosis in childhood. Curr. Opin. Rheumatol. 2017, 29, 535–546. [Google Scholar] [CrossRef]
- Baroncelli, G.I. Quantitative ultrasound methods to assess bone mineral status in children: Technical characteristics, performance, and clinical application. Pediatr. Res. 2008, 63, 220–228. [Google Scholar] [CrossRef]
- Jensen, K.H.; Riis, K.R.; Abrahamsen, B.; Händel, M.N. Nutrients, diet, and other factors in prenatal life and bone health in young adults: A systematic review of longitudinal studies. Nutrients 2020, 12, 2866. [Google Scholar] [CrossRef]
- Hyde, N.K.; Brennan-Olsen, S.L.; Wark, J.D.; Hosking, S.M.; Pasco, J.A. Maternal dietary nutrient intake during pregnancy and offspring linear growth and bone: The Vitamin D in Pregnancy Cohort Study. Calcif. Tissue Int. 2017, 100, 47–54. [Google Scholar] [CrossRef]
- Godfrey, K.; Walker-Bone, K.; Robinson, S.; Taylor, P.; Shore, S.; Wheeler, T.; Cooper, C. Neonatal bone mass: Influence of parental birthweight, maternal smoking, body composition, and activity during pregnancy. J. Bone Miner. Res. 2001, 16, 1694–1703. [Google Scholar] [CrossRef]
- Tobias, J.H.; Steer, C.D.; Emmett, P.M.; Tonkin, R.J.; Cooper, C.; Ness, A.R. Bone mass in childhood is related to maternal diet in pregnancy. Osteoporos. Int. 2005, 16, 1731–1741. [Google Scholar] [CrossRef]
- Cole, Z.A.; Gale, C.R.; Javaid, M.K.; Robinson, S.M.; Law, C.; Boucher, B.J.; Crozier, S.R.; Godfrey, K.M.; Dennison, E.M.; Cooper, C. Maternal dietary patterns during pregnancy and childhood bone mass: A longitudinal study. J. Bone Miner. Res. 2009, 24, 663–668. [Google Scholar] [CrossRef] [PubMed]
- Vinding, R.K.; Stokholm, J.; Sevelsted, A.; Sejersen, T.; Chawes, B.L.; Bønnelykke, K.; Thorsen, J.; Howe, L.D.; Krakauer, M.; Bisgaard, H. Effect of fish oil supplementation in pregnancy on bone, lean, and fat mass at six years: Randomised clinical trial. BMJ 2018, 362, 3312. [Google Scholar] [CrossRef] [PubMed]
- Velkavrh, M.; Paro-Panjan, D.; Benedik, E.; Mis, N.F.; Godnov, U.; Salamon, A.S. The influence of maternal levels of vitamin D and adiponectin on anthropometrical measures and bone health in offspring. Pril. Makedon. Akad. Nauk. Umet. Odd. Med. Nauk. 2019, 40, 91–98. [Google Scholar] [CrossRef] [PubMed][Green Version]
- Prentice, A.; Jarjou, L.M.A.; Goldberg, G.R.; Bennett, J.; Cole, T.J.; Schoenmakers, I. Maternal plasma 25-hydroxyvitamin D concentration and birthweight, growth and bone mineral accretion of Gambian infants. Acta Paediatr. 2009, 98, 1360–1362. [Google Scholar] [CrossRef] [PubMed]
- Viljakainen, H.T.; Korhonen, T.; Hytinantti, T.; Laitinen, E.K.A.; Andersson, S.; Mäkitie, O.; Lamberg-Allardt, C. Maternal vitamin D status affects bone growth in early childhood—A prospective cohort study. Osteoporos. Int. 2011, 22, 883–891. [Google Scholar] [CrossRef] [PubMed]
- Garcia, A.H.; Erler, N.S.; Jaddoe, V.W.V.; Tiemeier, H.; van den Hooven, E.H.; Franco, O.H.; Rivadeneira, F.; Voortman, T. 25-hydroxyvitamin D concentrations during fetal life and bone health in children aged 6 years: A population-based prospective cohort study. Lancet Diabetes Endocrinol. 2017, 5, 367–376. [Google Scholar] [CrossRef]
- Lawlor, D.A.; Wills, A.K.; Fraser, A.; Sayers, A.; Fraser, W.D.; Tobias, J.H. Association of maternal vitamin D status during pregnancy with bone-mineral content in offspring: A prospective cohort study. Lancet 2013, 381, 2176–2183. [Google Scholar] [CrossRef]
- Zhu, K.; Whitehouse, A.J.O.; Hart, P.H.; Kusel, M.; Mountain, J.; Lye, S.; Pennell, C.; Walsh, J.P. Maternal vitamin D status during pregnancy and bone mass in offspring at 20 years of age: A prospective cohort study. J. Bone Miner. Res. 2014, 29, 1088–1095. [Google Scholar] [CrossRef]
- Hyde, N.K.; Brennan-Olsen, S.L.; Mohebbi, M.; Wark, J.D.; Hosking, S.M.; Pasco, J.A. Maternal vitamin D in pregnancy and offspring bone measures in childhood: The Vitamin D in Pregnancy study. Bone 2019, 124, 126–131. [Google Scholar] [CrossRef] [PubMed]
- Liao, X.P.; Zhang, W.L.; Yan, C.H.; Zhou, X.J.; Wang, P.; Sun, J.H.; Yu, X.D.; Wu, M.Q. Reduced tibial speed of sound in Chinese infants at birth compared with Caucasian peers: The effects of race, gender, and vitamin D on fetal bone development. Osteoporos. Int. 2010, 21, 2003–2011. [Google Scholar] [CrossRef] [PubMed]
- Harvey, N.; Dhanwal, D.; Robinson, S.; Kim, M.; Inskip, H.; Godfrey, K.; Dennison, E.; Calder, P.; Cooper, C. Does maternal long chain polyunsaturated fatty acid status in pregnancy influence the bone health of children? The Southampton Women’s Survey. Osteoporos. Int. 2012, 23, 2359–2367. [Google Scholar] [CrossRef]
- Javaid, M.K.; Godfrey, K.M.; Taylor, P.; Shore, S.R.; Breier, B.; Arden, N.K.; Cooper, C. Umbilical venous IGF-1 concentration, neonatal bone mass, and body composition. J. Bone Miner. Res. 2004, 19, 56–63. [Google Scholar] [CrossRef] [PubMed]
- Corwin, R.L.; Hartman, T.J.; Maczuga, S.A.; Graubard, B.I. Dietary Saturated fat intake is inversely associated with bone density in humans: Analysis of NHANES III. J. Nutr. 2006, 136, 159–165. [Google Scholar] [CrossRef] [PubMed]
- Castiglioni, S.; Cazzaniga, A.; Albisetti, W.; Maier, J.A.M. Magnesium and osteoporosis: Current state of knowledge and future research directions. Nutrients 2013, 5, 3022–3033. [Google Scholar] [CrossRef]
- Amrein, K.; Scherkl, M.; Hoffmann, M.; Neuwersch-Sommeregger, S.; Köstenberger, M.; Tmava Berisha, A.; Martucci, G.; Pilz, S.; Malle, O. Vitamin D deficiency 2.0: An update on the current status worldwide. Eur. J. Clin. Nutr. 2020, 74, 1498–1513. [Google Scholar] [CrossRef]
- Rusińska, A.; Płudowski, P.; Walczak, M.; Borszewska-Kornacka, M.K.; Bossowski, A.; Chlebna-Sokół, D.; Czech-Kowalska, J.; Dobrzańska, A.; Franek, E.; Helwich, E.; et al. Vitamin D supplementation guidelines for general population and groups at risk of vitamin D deficiency in Poland—Recommendations of the Polish Society of Pediatric Endocrinology and Diabetes and the Expert Panel with participation of national specialist consultans and representatives of scientific societes—2018 update. Front. Endocrinol. 2018, 9, 1–21. [Google Scholar] [CrossRef]
- Longo, A.B.; Ward, W.E. PUFAs, bone mineral density, and fragility fracture: Findings from human studies. Adv. Nutr. 2016, 7, 299–312. [Google Scholar] [CrossRef]
- Tanumihardjo, S.A. Vitamin A and bone health: The balancing act. J. Clin. Densitom. 2013, 16, 414–419. [Google Scholar] [CrossRef]
- Fratoni, V.; Brandi, M.L. B vitamins, Homocysteine and Bone Health. Nutrients 2015, 7, 2176–2192. [Google Scholar] [CrossRef] [PubMed]
- Harvey, N.C.; Javaid, M.K.; Arden, N.K.; Poole, J.R.; Crozier, S.R.; Robinson, S.M.; Inskip, H.M.; Godfrey, K.M.; Dennison, E.M.; Cooper, C. Maternal predictors of neonatal bone size and geometry: The Southampton Women’s Survey. J. Dev. Orig. Health Dis. 2010, 1, 35–41. [Google Scholar] [CrossRef] [PubMed]
- Ay, L.; Jaddoe, V.W.V.; Hofman, A.; Moll, H.A.; Raat, H.; Steegers, E.A.P.; Hokken-Koelega, A.C.S. Foetal and postnatal growth and bone mass at 6 months: The Generation R Study. Clin. Endocrinol. 2011, 74, 181–190. [Google Scholar] [CrossRef] [PubMed]
- Rudäng, R.; Mellström, D.; Clark, E.; Ohlsson, C.; Lorentzon, M. Advancing maternal age is associated with lower bone mineral density in young adult male offspring. Osteoporos. Int. 2012, 23, 475–482. [Google Scholar] [CrossRef]
- Monjardino, T.; Henriques, A.; Moreira, C.; Rodrigues, T.; Adubeiro, N.; Nogueira, L.; Cooper, C.; Santos, A.C.; Lucas, R. Gestational weight gain and offspring bone mass: Different associations in healthy weight versus overweight women. J. Bone Miner. Res. 2019, 34, 38–48. [Google Scholar] [CrossRef]
- Xu, H.; Zhao, Z.; Wang, H.; Ding, M.; Zhou, A.; Wang, X.; Zhang, P.; Duggan, C.; Hu, F.B. Bone mineral density of the spine in 11,898 Chinese infants and young children: A cross-sectional study. PLoS ONE 2013, 8, 1–6. [Google Scholar] [CrossRef]
- Andres, A.; Hull, H.R.; Shankar, K.; Casey, P.H.; Cleves, M.A.; Badger, T.M. Longitudinal body composition of children born to mothers with normal weight, overweight, and obesity. Obesity 2015, 23, 1252–1258. [Google Scholar] [CrossRef]
- Fujita, Y.; Kouda, K.; Ohara, K.; Nakamura, H.; Iki, M. Maternal pre-pregnancy underweight is associated with underweight and low bone mass in school-aged children. J. Bone Miner. Metab. 2020, 38, 878–884. [Google Scholar] [CrossRef]
- Macdonald-Wallis, C.; Tobias, J.H.; Smith, G.D.; Lawlor, D.A. Relation of maternal prepregnancy body mass index with offspring bone mass in childhood: Is there evidence for an intrauterine effect? Am. J. Clin. Nutr. 2010, 92, 872–880. [Google Scholar] [CrossRef] [PubMed]
- Abou Samra, H.; Stevens, D.; Binkley, T.; Specker, B. Determinants of bone mass and size in 7-year-old former term, late-preterm, and preterm boys. Osteoporos. Int. 2009, 20, 1903–1910. [Google Scholar] [CrossRef]
- Nabulsi, M.; Mahfoud, Z.; Maalouf, J.; Arabi, A.; Fuleihan, G.E.H. Impact of maternal veiling during pregnancy and socioeconomic status on offspring’s musculoskeletal health. Osteoporos. Int. 2008, 19, 295–302. [Google Scholar] [CrossRef] [PubMed]
- Pereda, L.; Ashmeade, T.; Zaritt, J.; Carver, J.D. The use of quantitative ultrasound in assessing bone status in newborn preterm infants. J. Perinatol. 2003, 23, 655–659. [Google Scholar] [CrossRef]
- Yang, Y.; Wu, F.; Dwyer, T.; Antony, B.; Winzenberg, T.; Jones, G. Associations of breastfeeding, maternal smoking, and birth weight with bone density and microarchitecture in young adulthood: A 25-year birth-cohort study. J. Bone Miner. Res. 2020, 35, 1652–1659. [Google Scholar] [CrossRef]
- Jones, G.; Hynes, K.L.; Dwyer, T. The association between breastfeeding, maternal smoking in utero, and birth weight with bone mass and fractures in adolescents: A 16-year longitudinal study. Osteoporos. Int. 2013, 24, 1605–1611. [Google Scholar] [CrossRef] [PubMed]
- Martínez-Mesa, J.; Menezes, A.M.B.; Howe, L.D.; Wehrmeister, F.C.; Muniz, L.C.; González-Chica, D.A.; Assunção, M.C.; Gonçalves, H.; Barros, F.C. Lifecourse relationship between maternal smoking during pregnancy, birth weight, contemporaneous anthropometric measurements and bone mass at 18 years old. The 1993 Pelotas Birth Cohort. Early Hum. Dev. 2014, 90, 901–906. [Google Scholar] [CrossRef] [PubMed]
- Heppe, D.H.M.; Medina-Gomez, C.; Hofman, A.; Rivadeneira, F.; Jaddoe, V.W.V. Does fetal smoke exposure affect childhood bone mass? The Generation R Study. Osteoporos. Int. 2015, 26, 1319–1329. [Google Scholar] [CrossRef]
- Macdonald-Wallis, C.; Tobias, J.H.; Smith, G.D.; Lawlor, D.A. Parental smoking during pregnancy and offspring bone mass at age 10 years: Findings from a prospective birth cohort. Osteoporos. Int. 2011, 22, 1809–1819. [Google Scholar] [CrossRef]
- Shiverick, K.T.; Salafia, C. Cigarette smoking and pregnancy. I: Ovarian, uterine and placental effects. Placenta 1999, 20, 265–272. [Google Scholar] [CrossRef]
- Lin, F.J.; Fitzpatrick, J.W.; Iannotti, C.A.; Martin, D.S.; Mariani, B.D.; Tuan, R.S. Effects of cadmium on trophoblast calcium transport. Placenta 1997, 18, 341–356. [Google Scholar] [CrossRef]
- Jones, G.; Dwyer, T. Birth weight, birth length, and bone density in prepubertal children: Evidence for an association that may be mediated by genetic factors. Calcif. Tissue Int. 2000, 67, 304–308. [Google Scholar] [CrossRef]
- Akcakus, M.; Koklu, E.; Kurtoglu, S.; Kula, M.; Koklu, S.S. The relationship among intrauterine growth, insulinlike growth factor I (IGF-I), IGF-Binding Protein-3, and bone mineral status in newborn infants. Am. J. Perinatol. 2006, 23, 473–480. [Google Scholar] [CrossRef] [PubMed]
- Micklesfield, L.; Levitt, N.; Dhansay, M.; Norris, S.; van der Merwe, L.; Lambert, E. Maternal and early life influences on calcaneal ultrasound parameters and metacarpal morphometry in 7- to 9-year-old children. J. Bone Miner. Metab. 2006, 24, 235–242. [Google Scholar] [CrossRef]
- Setia, S.; Sridhar, M.G. Changes in GH/IGF-1 axis in intrauterine growth retardation: Consequences of fetal programming? Horm. Metab. Res. 2009, 41, 791–798. [Google Scholar] [CrossRef]
- Jones, I.E.; Williams, S.M.; Goulding, A. Associations of birth weight and length, childhood size, and smoking with bone fractures during growth: Evidence from a birth cohort study. Am. J. Epidemiol. 2004, 159, 343–350. [Google Scholar] [CrossRef]
- van Montfoort, N.; Finken, M.J.J.; le Cessie, S.; Dekker, F.W.; Wit, J.M. Could cortisol explain the association between birth weight and cardiovascular disease in later life? A meta-analysis. Eur. J. Endocrinol. 2005, 153, 811–817. [Google Scholar] [CrossRef]
- Cooper, C.; Westlake, S.; Harvey, N.; Javaid, K.; Dennison, E.; Hanson, M. Review: Developmental origins of osteoporotic fracture. Osteoporos. Int. 2006, 17, 337–347. [Google Scholar] [CrossRef] [PubMed]
- Baş, E.K.; Bülbül, A.; Şirzai, H.; Arslan, S.; Uslu, S.; Baş, V.; Zubarioglu, U.; Celik, M.; Dursun, M.; Güran, Ö.; et al. The long-term impacts of preterm birth and associated morbidities on bone health in preschool children: A prospective cross-sectional study from Turkey. J. Matern. Neonatal Med. 2020, 1–8. [Google Scholar] [CrossRef]
- Biró, G.; Hulsof, K.F.A.M.; Ovesen, L.; Amorim Cruz, J.A. Selection of methodology to assess food intake. Eur. J. Clin. Nutr. 2002, 56, 25–32. [Google Scholar] [CrossRef]
- Illner, A.K.; Freisling, H.; Boeing, H.; Huybrechts, I.; Crispim, S.P.; Slimani, N. Review and evaluation of innovative technologies for measuring diet in nutritional epidemiology. Int. J. Epidemiol. 2012, 41, 1187–1203. [Google Scholar] [CrossRef] [PubMed]
- Schlüssel, M.M.; dos Santos Vaz, J.; Kac, G. Birth weight and adult bone mass: A systematic literature review. Osteoporos. Int. 2010, 21, 1981–1991. [Google Scholar] [CrossRef] [PubMed]
- Baird, J.; Kurshid, M.A.; Kim, M.; Harvey, N.; Dennison, E.; Cooper, C. Does birthweight predict bone mass in adulthood? A systematic review and meta-analysis. Osteoporos. Int. 2011, 22, 1323–1334. [Google Scholar] [CrossRef]
- Choi, H.S.; Park, J.H.; Kim, S.H.; Shin, S.; Park, M.J. Strong familial association of bone mineral density between parents and offspring: KNHANES 2008–2011. Osteoporos. Int. 2017, 28, 955–964. [Google Scholar] [CrossRef]
- Borge, T.C.; Aase, H.; Brantsæter, A.L.; Biele, G. The importance of maternal diet quality during pregnancy on cognitive and behavioural outcomes in children: A systematic review and meta-analysis. BMJ Open 2017, 7, 1–14. [Google Scholar] [CrossRef] [PubMed]
- McGrath-Morrow, S.A.; Gorzkowski, J.; Groner, J.A.; Rule, A.M.; Wilson, K.; Tanski, S.E.; Collaco, J.M.; Klein, J.D. The effects of nicotine on development. Pediatrics 2020, 145, 1–12. [Google Scholar] [CrossRef] [PubMed]
- Shalof, H.; Dimitri, P.; Shuweihdi, F.; Offiah, A.C. Which skeletal imaging modality is best for assessing bone health in children and young adults compared to DXA? A systematic review and meta-analysis. Bone 2021, 150, 116013. [Google Scholar] [CrossRef] [PubMed]
- Khalatbari, H.; Binkovitz, L.A.; Parisi, M.T. Dual-energy X-ray absorptiometry bone densitometry in pediatrics: A practical review and update. Pediatr. Radiol. 2021, 51, 25–39. [Google Scholar] [CrossRef] [PubMed]
- Kalkwarf, H.J.; Zemel, B.S.; Yolton, K.; Heubi, J.E. Bone mineral content and density of the lumbar spine of infants and toddlers: Influence of age, sex, race, growth and human milk feeding. J. Bone Miner. Res. 2013, 28, 206–212. [Google Scholar] [CrossRef] [PubMed]
- Avila-Díaz, M.; Flores-Huerta, S.; Martínez-Muñiz, I.; Amato, D. Increments in whole body bone mineral content associated with weight and length in pre-term and full-term infants during the first 6 months of life. Arch. Med. Res. 2001, 32, 288–292. [Google Scholar] [CrossRef]
- Svedbom, A.; Hernlund, E.; Ivergård, M.; Compston, J.; Cooper, C.; Stenmark, J.; McCloskey, E.V.; Jönsson, B.; Kanis, J.A. Osteoporosis in the European Union: A compendium of country-specific reports. Arch. Osteoporos. 2013, 8, 1–218. [Google Scholar] [CrossRef]
- Klipstein-Grobusch, K.; den Breeijen, J.H.; Goldbohm, R.A.; Geleijnse, J.M.; Hofman, A.; Grobbee, D.E.; Witteman, J.C.M. Dietary assessment in the elderly: Validation of a semiquantitative food frequency questionnaire. Eur. J. Clin. Nutr. 1998, 52, 588–596. [Google Scholar] [CrossRef]
- Rogers, I.; Emmett, P. and the ALPSAC Study Team. Diet during pregnancy in a population of pregnant women in South West England. Eur. J. Clin. Nutr. 1998, 52, 246–250. [Google Scholar] [CrossRef]
- Robinson, S.; Godfrey, K.; Osmond, C.; Cox, V.; Barker, D. Evaluation of a food frequency questionnaire used to assess nutrient intakes in pregnant women. Eur. J. Clin. Nutr. 1996, 50, 302–308. [Google Scholar] [PubMed]
- Rao, S.; Yajnik, C.S.; Kanade, A.; Fall, C.H.D.; Margetts, B.M.; Jackson, A.A.; Shier, R.; Joshi, S.; Rege, S.; Lubree, H.; et al. Intake of micronutrient-rich foods in rural Indian mothers is associated with the size of their babies at birth: Pune Maternal Nutrition Study. J. Nutr. 2001, 131, 1217–1224. [Google Scholar] [CrossRef] [PubMed]
- Cancer Council Victoria. Dietary Questionnaires. Available online: https://www.cancervic.org.au/research/epidemiology/nutritional_assessment_services (accessed on 13 June 2020).


| Inclusion criteria | Studies which aimed to evaluate the association between maternal/birth-related factors and children’s bone outcome Articles available in the English language, in full-text versions Published between January 2000 and August 2020 |
| Exclusion criteria | Lack of data about bone health Animal studies Studies related to maternal bone health/heredity Studies not related to maternal/birth-related factors Studies where mothers were under treatment/had a disease Studies related to offspring’s early nutrition Reviews and meta-analyses Studies published before year 2000Study protocols, conference abstracts, response letters, articles with no full-text available Studies without assessment of BMD (or BMAD/vBMD/aBMD/SOS) |
| Study Details | Outcome | ||||||
|---|---|---|---|---|---|---|---|
| Country, Year [Reference] | Study Subjects | Study Design | Assessment Method (Age) | Parameters | Dietary Intake Assessment (Gestation) | Components/Nutrients | No Effect/Association (↔) Positive (↑) Negative (↓) |
| Netherlands, 2013 [19] | F = 1410, 6.14 y * M = 1409, 6.15 y * | Prospective cohort study | DXA (F: 6.14 y * M: 6.15 y *) | TBLH BMD | FFQ (1st trimester) | Macronutrients, Ca, P, Mg (dietary nutrient intake categorized into quintiles; lowest category as the reference category) | TBLH BMD: E from protein (kcal/d), Ca intake (g/d), P intake (g/d) (↑) E from carbohydrate (kcal/d) (↓) E from fat (kcal/d), Mg intake (g/d) (↔) |
| UK, 2005 [32] | F = 3032 M = 2942 (118 m *) | Prospective cohort study (ALSPAC) | DXA (9 y) | TB and spine BMD | FFQ (32 wk) | Fiber, carbohydrate, starch, sugar, intrinsic/milk sugar, extrinsic non-milk, total fat, saturates, monounsaturates, polyunsaturates, omega-3, protein, Ca, Na, Mg, P, K, total Zn, Fe, retinol, riboflavin, carotene, folate, thiamin, niacin, vitamin B6, vitamin C, D, E | Spine BMD: folate (↑) |
| Australia, 2000 [20] | N = 173 F = 28% M = 72% (8.2 y *) | Longitudinal study | DXA (8.2 y *) | TB, LS and FN BMD | FFQ applied after birth, the reference period was the 3rd trimester | Fat, protein, Mg, K, P density (divided estimated micronutrients intake by the estimated daily E intake or macronutrients intake as % contribution of estimated E intake; split into tertiles) | LS BMD: P density, fat density (↑) TB BMD, FN BMD (↔) |
| Australia, 2010 [21] | N = 216 F = 30% M = 70% (16.2 y *) | Prospective study | DXA (16.2 y *) | FN, LS and WB BMD | FFQ (3rd trimester) | Protein, fat, carbohydrate, fish, fruit, meat, milk, vegetable, Ca, Mg, P density (divided estimated daily nutrient intake or food intake by estimated total daily energy intake, split into tertiles) | WB BMD (↔) LS BMD: fat density (↓), milk density, Mg density, Ca density (↑) FN BMD: fat density (↓), Mg density (↑) |
| UK, 2009 [33] | F = 94 M = 104 9 y | Longitudinal study | DXA (9 y) | WB and LS BMD, aBMD | FFQ (15, 32 wk) | High prudent diet score (elevated intakes of fruit, vegetables, wholemeal bread, rice, yoghurt, breakfast cereals, pasta and low intakes of processed foods such as chips, roast potatoes, sugar, white bread, processed meat, crisps, tinned vegetables, soft drinks) | High PDS in early pregnancy: WB BMD (↔) High PDS in late pregnancy: WB BMD (↑) |
| India, 2006 [24] | F = 326 M = 369 6.2 y ** | Prospective cohort study (PMNS) | DXA (6.2 y **) | TB and total spine BMD | FFQ and 24-h recall (18, 28 wk) | Milk and milk products | 28 wk: TB BMD (↑), total spine BMD (↔) |
| UK, 2001 [31] | F = 64 M = 81 (neonates) | Cohort study | DXA (2 d **; 0–13 d) | WB and spine BMD | FFQ (in early and late pregnancy; in the preceding 3 months) | Ca, green vegetables | Early pregnancy Ca intake: spine BMD (↑) green vegetables intake: spine BMD (↓) |
| Australia, 2017 [30] | F = 177 M = 169 10.9 y | Cohort study (VIP) | DXA (10.9 y) | TBLH and LS BMD | FFQ (28–32 wk; food intake over the previous 12 m) | Protein, Mg, P, Zn, Ca, K | BMD (↔) |
| Study Details | Outcome | ||||||
|---|---|---|---|---|---|---|---|
| Country, Year [Reference] | Study Subjects | Study Design | Assessment Method (Age) | Parameters | Nutrients | Intervention (Duration, Dose) Dietary Intake Assessment of Analyzed Nutrients (If Available) | No Effect/Association (↔) Positive (↑) Negative (↓) |
| UK, 2016 [11] | F = 456 M = 509 (neonates) | Randomized, placebo-controlled trial (MAVIDOS) | DXA (7 d *—placebo; 8 d *—vitamin D) | WB BMD | Vitamin D |
| WB BMD (↔) |
| Iran, 2016 [12] | F = 53 M = 74 (neonates) | Randomized placebo clinical trial | DXA (21.7 d *—vitamin D, 24.5 d *—control) | BMD | Vitamin D |
| BMD (↔) |
| Denmark,2020 [13] | F = 256 M = 261 (3 y and 6 y) | Randomized clinical trial (COPSAC2010) | DXA (3 y and 6 y) | Total, head, TBLH BMD | Vitamin D |
| 2800 IU/d vs. 400 IU/d At the age 3 y: Total, head and TBLH BMD (↔) At the age 6 y: Head, total BMD (↑), TBLH BMD (↔) 3 y and 6 y combined: Head BMD (↑), TBLH BMD, total BMD (↔) |
| Gambia,2017 [14] | F = 231, 9.2 y * M = 216, 9.3 y * | Randomized controlled trial | pQCT | vBMD | Calcium |
| vBMD (↔) |
| India, 2017 [15] | Group 1,2—14 m ** Group 3—16 m ** | Randomized, placebo-controlled trial | DXA (12–16 m) | WB BMD | Vitamin D + Calcium |
| Group 3 vs. 1 and 2: WB BMD (↑) |
| Brazil, 2015 [16] | N = 56 adolescent mother-infant pairs 5 wk | Randomized controlled trial | DXA (5 wk) | TB BMD | Vitamin D + Calcium |
| TB BMD (↔) |
| Denmark, 2018 [34] | F = 337 M = 351 6.2 y * | Randomized clinical trial (COPSAC2010) | DXA (6.2 y *) | TBLH BMD | n-3 LC PUFAs |
| TBLH BMD (↔) |
| Study Details | Outcome | |||||
|---|---|---|---|---|---|---|
| Country, Year [Reference] | Study Subjects | Study Design | Assessment Method (Age) | Parameters | Pregnancy Vitamin D Measurement | No Effect/Association (↔) Positive (↑) Negative (↓) |
| USA, 2019 [17] | F = 118 M = 134 1.7 d * | Longitudinal study (CPEP) | DXA (1.7 d *) | Total, lumbar BMD | 25(OH)D in pregnancy (average from 3 measurements: at baseline, 26–29 and 36 wk) | Maternal deficiency vs. non-deficient: Total BMD (↓) Lumbar BMD (↔) |
| Slovenia, 2019 [35] | F = 34 M = 39 (neonates) | Observational study (My-MILK) | QUS (in the first 48 h after birth) | SOS | 25(OH)D in 3rd trimester | SOS (↔) |
| China, 2010 [42] | F = 119 M = 148 (neonates) | Cross-sectional study | QUS (2.9 d *) | SOS | 25(OH)D before delivery | SOS (↑) |
| Gambia, 2009 [36] | N = 44–52 2–52 wk | Randomized controlled trial (secondary analysis) | DXA (2, 13, 52 wk) | BMD | 25(OH)D in 20, 36 wk | BMD (↔) |
| Finland, 2011 [37] | N = 87 F = 37% M = 57% (14.8 m *) | Prospective cohort study (follow-up) | pQCT (14.8 m *) | left tibia BMD | 25(OH)D in 1st trimester | Low D vs. high D: BMD (↔) |
| Netherlands, 2017 [38] | F = 2663 M = 2631 6.1 y * | Prospective cohort study (the Generation R study) | DXA (6.1 y *) | TBLH BMD | 25(OH)D in 20.4 wk ** | BMD (↔) |
| UK, 2006 [18] | F = 94, 8.8 y * M = 104, 8.9 y * | Longitudinal study | DXA (9 y) | WB, LS aBMD | 25(OH)D in 34 wk * | WB and LS aBMD (↑) |
| UK, 2013 [39] | N = 3960 9.9 y * | Prospective cohort study (ALSPAC) | DXA (9.9 y *) | TBLH, spine BMD | 25(OH)D at any stage | TBLH, spine BMD (↔) |
| Australia, 2019 [41] | F = 88 M = 93 10.9 y ** | Observational study (VIP) | DXA (10.9 y **) | TBLH and spine BMD, BMAD | 25(OH)D at recruitment (<16 wk) and in 28–32 wk | at recruitment: F—BMD (↔) M—BMD (↑) 28-32 wk: BMD (↔) |
| Australia, 2014 [40] | F = 204, 20.1 y * M = 137, 20.2 y * | Prospective cohort study (the Raine study) | DXA (F: 20.1 y * M: 20.2 y *) | TB BMD | 25(OH)D in 18 wk * | BMD (↑) |
| Norway, 2019 [23] | F = 16 M = 25 26.1 y * | Prospective cohort study (follow-up) | DXA (26.1 y *) | LS, FN, total hip and WB BMD | 25(OH)D and 1,25(OH)2D in 17, 33, 37 wk | LS, FN, total hip and WB BMD (↔) |
| Study Details | Outcome | ||||||
|---|---|---|---|---|---|---|---|
| Country, Year [Reference] | Study Subjects | Study Design | Assessment Method (Age) | Parameters | Nutrients | Nutrient Status Assessment | No Effect/Association (↔) Positive (↑) Negative (↓) |
| Netherlands, 2013 [19] | F = 1410, 6.14 y * M = 1409, 6.15 y * | Prospective cohort study (the Generation R study) | DXA (F: 6.14 y * M: 6.15 y *) | TBLH BMD | Homocysteine, folate, vitamin B12 | Concentrations in venous blood (12.9 wk **) | TBLH BMD: Vitamin B12 concentration (↑) Homocysteine, folate concentration (↔) |
| UK, 2013 [43] | F = 342 M = 385 4.1 y ** | Prospective cohort study (SWS) | DXA (4.1 y **) | WB/WBMH, LS aBMD, vBMD | LC PUFAs | LC PUFAs (n-3, n-6, EPA, DPA, AA) composition of maternal plasma PC in late pregnancy (34 wk) | Maternal plasma PC concentration: WBMH aBMD: EPA, DPA (↑) LS aBMD: n-3, EPA, DPA, n-6 (↑) WBMH vBMD: EPA (↑) LS vBMD: EPA (↑) Maternal% fatty acids: WBMH aBMD: EPA, DPA (↑), AA (↓) LS aBMD: EPA (↑) WBMH vBMD: EPA (↑) LS vBMD: (↔) |
| UK, 2016 [22] | F = 241 M = 282 0–2 wk | Prospective birth-cohort study (SWS) | DXA (within 2 wk after birth) | WB BMD | Vitamin A | Blood sample—late pregnancy assessment (34 wk):
| Retinol: BMD (↔) β-carotene: BMD (↔) β-carotene:retinol ratio BMD (↔) |
| Norway, 2019 [23] | F = 16 M = 25 26.1 y * | Prospective cohort study (follow-up) | DXA (26.1 y *) | LS, FN, total hip and WB BMD | Vitamin A | Serum samples—all-trans retinol:
| 17 wk: WB, LS BMD (↑), FN, total hip BMD (↔) 33 wk: BMD at any site (↔) 37 wk: LS, total hip BMD (↑), WB, FN BMD (↔) Retinol in cord blood (↔) |
| UK, 2006 [18] | F = 94, 8.8 y * M = 104, 8.9 y * | Longitudinal study | DXA (9 y) | WB and LS aBMD | Calcium | Serum sample:
| LS aBMD (↑) WB aBMD (↔) |
| India, 2006 [24] | F = 326 M = 369 6.2 y ** | Prospective cohort study (PMNS) | DXA (6.2 y **) | TB and total spine BMD | Folate | Maternal erythrocyte folate concentrations (18, 28 wk) | 28 wk: TB and total spine BMD (↑) |
| Study Details | Outcome | |||||
|---|---|---|---|---|---|---|
| Country, Year [Reference] | Study Subjects | Study Design | Assessment Method (Age) | Parameters | Factors | No Effect/Association (↔) Positive (↑) Negative (↓) |
| UK, 2010 [52] | F = 398 M = 443 (neonates) | Prospective cohort study (SWS) | DXA (F: 4 d **, M: 5 d **) | WB aBMD | Maternal height | WB aBMD (↔) |
| UK, 2001 [31] | F = 64 M = 81 (neonates) | Cohort study | DXA (2 d **; 0–13 d) | WB and spine BMD | Maternal height | Spine BMD (↑) |
| Maternal BMI (first recorded weight in pregnancy) | WB and spine BMD (↔) | |||||
| Maternal triceps skinfold thickness (14 wk) | WB and spine BMD (↑) | |||||
| Netherlands, 2011 [53] | F = 107, 6.3 m * M = 145, 6.4 m * | Prospective cohort study (the Generation R study) | DXA (6 m) | TB and LS BMD, LS BMAD | Maternal height | LS BMAD (↓) TB and LS BMD (↔) |
| Maternal BMI (in pregnancy) | LS BMD (↑) TB BMD, LS BMAD (↔) | |||||
| Maternal pregnancy weight gain | TB BMD (↑) LS BMD, BMAD (↔) | |||||
| India, 2006 [24] | F = 326 M = 369 6.2 y ** | Prospective cohort study (PMNS) | DXA (6.2 y **) | TB and total spine BMD | Maternal height | TB and total spine BMD (↔) |
| Sweden, 2012 [54] | M = 1009 (18.9 y *) | Cohort study (GOOD) | DXA (18.9 y *) | LS aBMD (i.a.) | Maternal height | LS aBMD (↔) |
| Portugal, 2019 [55] | F = 1014 M = 1153 7 y | Birth-cohort study | DXA (7 y) | WBLH aBMD | Maternal BMI (self-reported weight at the beginning of pregnancy or on the first prenatal medical visit) GWG (the difference between the mother’s self-reported pre-delivery weight and her early pregnancy weight) | In under/normal weight mothers GWG (↑) WBLH aBMD In overweight/obese women GWG (↔) WBLH aBMD |
| China, 2013 [56] | F = 5306 M = 6592 9.3 m * | Cross-sectional study | DXA (6.7 m **) | LS BMD | Maternal pregnancy weight gain | LS BMD (↑) |
| Study Details | Outcome | |||||
|---|---|---|---|---|---|---|
| Country, Year [Reference] | Study Subjects | Study Design | Assessment Method (Age) | Parameters | Weight Assessment Details | No Effect/Association (↔) Positive (↑) Negative (↓) |
| USA, 2015 [57] | F = 167 M = 158 0–6 y | Longitudinal study | DXA (at 0.25, 0.5, 0.75, 1, 2, 3, 4, 5, and 6 y) | WB BMD | Prepregnancy weight self-reported | WB BMD (↔) |
| UK, 2010 [59] | F = 3591 M = 3530 118 m * | Prospective cohort study (ALSPAC) | DXA (9.9 y *) | TBLH and spine BMD | Reported by the mother in a questionnaire administered during pregnancy | TBLH and spine BMD (↔) |
| Japan, 2020 [58] | F = 375 M = 392 10 y | Retrospective cohort study (JKB) | DXA 10 y | TBLH aBMD | Weight at the beginning of pregnancy when not much weight had been gained | TBLH aBMD (↔) |
| Sweden, 2012 [54] | M = 1009 (18.9 y *) | Cohort study (GOOD) | DXA (18.9 y *) | LS aBMD (i.a.) | Maternal weight before pregnancy | LS aBMD (↑) |
| Study Details | Outcome | |||||
|---|---|---|---|---|---|---|
| Country, Year [Reference] | Study Subjects | Study Design | Assessment Method (Age) | Parameters | Factors | No Effect/Association (↔) Positive (↑) Negative (↓) |
| Sweden, 2012 [54] | M = 1009 (18.9 y *) | Cohort study (GOOD) | DXA, pQCT (18.9 y *) | DXA: TB, FN, LS and radius non-dominant aBMD pQCT: radius cortical and trabecular vBMD | Maternal age | LS aBMD (↓) TB, FN, radius non-dominant aBMD (↔) vBMD at any site (↔) |
| Parity | LS aBMD (↔) | |||||
| USA, 2009 [60] | M = 24 6.9–7.4 y * | Cross-sectional study | DXA, pQCT (6.9–7.4 y *) | DXA: hip, spine, FN aBMD pQCT: distal tibia cortical and trabecular vBMD | Maternal education | (↔) |
| Lebanon, 2008 [61] | F = 156 M = 170 13.1 y * | Observational study | DXA (~13.1 y *) | TB, LS, FN, total hip BMD | Maternal SES | F: BMD at any site (↑) M: TB, FN, total hip BMD (↑) LS BMD (↔) |
| UK, 2010 [52] | F = 398 M = 443 (neonates) | Prospective cohort study (SWS) | DXA (F: 4 d ** M: 5 d **) | WB aBMD | Parity | WB aBMD (↔) |
| USA, 2003 [62] | F = 50 M = 45 (neonates; born < 37 wk) | Prospective study | QUS (within the first 10 d of life) | SOS | Parity | SOS (↔) |
| India, 2006 [24] | F = 326 M = 369 6.2 y ** | Prospective cohort study (PMNS) | DXA (6.2 y **) | TB and total spine BMD | Parity | TB and total spine BMD (↔) |
| Study Details | Outcome | ||||
|---|---|---|---|---|---|
| Country, Year [Reference] | Study Subjects | Study Design | Assessment Method (Age) | Parameters | No Effect/Association (↔) Positive (↑) Negative (↓) |
| UK, 2001 [31] | F = 64 M = 81 (neonates) | Cohort study | DXA (2 d **; 0–13 d) | WB and spine BMD | WB BMD (↓) |
| UK, 2010 [52] | F = 398 M = 443 (neonates) | Prospective cohort study (SWS) | DXA (F: 4 d ** M: 5 d **) | WB aBMD | WB aBMD (↔) |
| Netherlands, 2015 [66] | F = 2520 M = 2466 6–6.1 y ** | Prospective cohort study (the Generation R study) | DXA (6–6.1 y **) | BMD | BMD (↔) |
| UK, 2011 [67] | F = 3589 M = 3532 9.9 y * | Prospective birth-cohort study (ALSPAC) | DXA (118.4 m **) | TBLH and spine BMD | TBLH and spine BMD (↔) |
| Australia, 2013 [64] | F = 150 M = 265 16.3 y * | Longitudinal study | DXA (16.3 y *) | Spine, hip, radius, TB BMD | BMD at any site (↔) |
| Brazil, 2014 [65] | F = 1563 M = 1512 (follow up at 18 y) | Birth-cohort study | DXA (18 y) | BMD | BMD (↔) |
| Sweden, 2012 [54] | M = 1009 (18.9 y *) | Cohort study (GOOD) | DXA (18.9 y *) | LS aBMD (i.a.) | LS aBMD (↔) |
| Australia, 2020 [63] | F = 74 M = 122 25.3 y *–25.6 y * | Birth-cohort study | DXA, HRpQCT (term—25.6 y *, preterm—25.3 y *) | aBMD, vBMD, bone microarchitecture | Preterm (↔) Term: Tb.N (↓) Inner TZ porosity (↑) |
| Study Details | Outcome | |||||
|---|---|---|---|---|---|---|
| Country, Year [Reference] | Factors | Study Subjects | Study Design | Assessment Method (Age) | Parameters | No Effect/Association (↔) Positive (↑) Negative (↓) |
| USA, 2003 [62] | Birth anthropometry | F = 50 M = 45 (neonates; born < 37 wk) | Prospective study | QUS (within the first 10 d of life) | SOS | SOS: Birth weight, length (↑) |
| UK, 2001 [31] | Birth anthropometry | F = 64 M = 81 (neonates) | Cohort study | DXA (2 d **; 0–13 d) | WB and spine BMD | Birth weight: WB, spine BMD (↑) Ponderal index: WB BMD (↑), spine BMD (↔) |
| China, 2013 [56] | Birth anthropometry | F = 5306 M = 6592 9.3 m * | Cross-sectional study | DXA (6.7 m **) | LS BMD | Birth weight: LS BMD (↑) Birth length: LS BMD (↔) |
| Australia, 2000 [70] | Birth anthropometry | F = 115, 8.26 y * M = 215, 8.17 y * | Longitudinal study | DXA (F: 8.26 y * M: 8.17 y *) | LS and FN BMD, BMAD | Birth weight: BMD and BMAD at any site (↔) Birth length: LS BMD (↑) FN BMD, BMAD at any site (↔) |
| India, 2006 [24] | Birth length | F = 326 M = 369 6.2 y ** | Prospective cohort study (PMNS) | DXA (6.2 y **) | TB and total spine BMD | TB and total spine BMD (↔) |
| Turkey, 2006 [71] | Birth weight | F = 50 M = 50 (neonates) | Cross-sectional study | DXA (within first 24 h after birth) | WB BMD | SGA < AGA < LGA |
| China, 2010 [42] | Birth weight | F = 119 M = 148 (neonates) | Cross-sectional study | QUS (2.9 d *) | SOS | <1500 g vs. ≥2500 g SOS (↓) |
| Netherlands, 2011 [53] | Birth weight | F = 107, 6.3 m * M = 145, 6.4 m * | Prospective cohort study (the Generation R study) | DXA (6 m) | TB and LS BMD, LS BMAD | TB BMD (↑) LS BMD, LS BMAD (↔) |
| Netherlands, 2014 [10] | Birth weight | F = 2732 M = 2718 (6 y **) | Prospective cohort study (the Generation T study) | DXA (6 y **) | WB/WBLH BMD | SGA, AGA, LGA: BMD (↔) ≥ 2500–3000 g vs. ≥ 3000–3500 g BMD (↓) |
| South Africa, 2006 [72] | Birth weight | F = 54 M = 55 8.1 y * | Cohort study (follow-up study) | QUS (8.1 y *) | SOS | SOS (↔) |
| Australia, 2013 [64] | Birth weight | F = 150 M = 265 16.3 y * | Longitudinal study | DXA (16.3 y *) | Spine, hip, radius, TB BMD | BMD at any site (↔) |
| Brazil, 2014 [65] | Birth weight | F = 1563 M = 1512 (follow up at 18 y) | Birth-cohort study (The 1993 Pelotas Birth Cohort) | DXA (18 y) | BMD | BMD (↑) |
| Sweden, 2012 [54] | Birth weight | M = 1009 (18.9 y *) | Cohort study | DXA (18.9 y *) | LS aBMD (i.a.) | LS aBMD (↔) |
| Australia, 2020 [63] | Birth weight | F = 74 M = 122 25.3 y *–25.6 y * | Birth-cohort study | DXA, HRpQCT (term–25.6 y *, preterm–25.3 y *) | aBMD, vBMD, bone microarchitecture | (↔) |
| Norway, 2019 [23] | Birth weight | F = 16 M = 25 26.1 y * | Prospective cohort study (follow-up) | DXA (26.1 y *) | LS, FN, total hip and WB BMD | BMD at any site (↔) |
Publisher’s Note: MDPI stays neutral with regard to jurisdictional claims in published maps and institutional affiliations. |
© 2021 by the authors. Licensee MDPI, Basel, Switzerland. This article is an open access article distributed under the terms and conditions of the Creative Commons Attribution (CC BY) license (https://creativecommons.org/licenses/by/4.0/).
Share and Cite
Masztalerz-Kozubek, D.; Zielinska-Pukos, M.A.; Hamulka, J. Maternal Diet, Nutritional Status, and Birth-Related Factors Influencing Offspring’s Bone Mineral Density: A Narrative Review of Observational, Cohort, and Randomized Controlled Trials. Nutrients 2021, 13, 2302. https://doi.org/10.3390/nu13072302
Masztalerz-Kozubek D, Zielinska-Pukos MA, Hamulka J. Maternal Diet, Nutritional Status, and Birth-Related Factors Influencing Offspring’s Bone Mineral Density: A Narrative Review of Observational, Cohort, and Randomized Controlled Trials. Nutrients. 2021; 13(7):2302. https://doi.org/10.3390/nu13072302
Chicago/Turabian StyleMasztalerz-Kozubek, Daria, Monika A. Zielinska-Pukos, and Jadwiga Hamulka. 2021. "Maternal Diet, Nutritional Status, and Birth-Related Factors Influencing Offspring’s Bone Mineral Density: A Narrative Review of Observational, Cohort, and Randomized Controlled Trials" Nutrients 13, no. 7: 2302. https://doi.org/10.3390/nu13072302
APA StyleMasztalerz-Kozubek, D., Zielinska-Pukos, M. A., & Hamulka, J. (2021). Maternal Diet, Nutritional Status, and Birth-Related Factors Influencing Offspring’s Bone Mineral Density: A Narrative Review of Observational, Cohort, and Randomized Controlled Trials. Nutrients, 13(7), 2302. https://doi.org/10.3390/nu13072302