
Evaluation of Body Composition, Physical Activity, and Food Intake in Patients with Inborn Errors of Intermediary Metabolism


 and
and 
Abstract
1. Introduction
2. Material and Methods
2.1. Study Design
2.2. Inclusion and Exclusion Criteria
2.3. Study Population
2.4. Objectives
2.5. Outcome Measures
2.5.1. Anthropometric Assessment
- -
- Weight was measured to the nearest 0.1 kg while the child was wearing light clothing and no shoes using a SECA 701 electronic medical scales with a class III digital display. Children were placed on the scale in a standard anatomical position without any support that could interfere with measurement. The values obtained were converted to z-scores according to the international reference values of the Centers for Disease Control and Prevention (CDC) [19].
- -
- Height was measured by using a Harpenden stadiometer (600–2100 mm), which is approved by the University of London Institute of Child Health. Height was measured while the child was standing without shoes, heavy outer garments, or hair ornaments. The values obtained were converted to z-scores according to the international reference values of the WHO [20].
- -
- BMI was calculated in kilograms per square meter (kg/m2), along with standardized scores and percentiles, which were scored using the international reference values of the WHO [20].
- -
- Body circumferences including MUAC, WrC, WC, HC, TC, and CC were measured with a flexible, non-extensible SECA 201 tape, which allows measurement of circumferences with millimeter precision. The tape is held at a right angle to the limb or body segment to be measured. All measures were converted to z-scores based on reference values for Spanish children and adolescents from the /enkid study [21].
- -
- Skinfold measurements (triceps, biceps, subscapular, and suprailiac skinfolds) were acquired using a Harpenden skinfold caliper. This device exerts a compression of 10 g/mm2 and has a measurement range of up to 80 mm in increments of 0.2. The exact point at which the skinfold measurement is taken must be carefully indicated using anatomical marking before evaluation. In this study, measurements were taken on the non-dominant side of the body [22].
2.5.2. Body Composition Assessment
2.5.3. Physical Activity and Feeding Questionnaires
2.5.4. Biochemical Analysis
2.6. Statistical Analyses
3. Results
3.1. General Characteristics of the Study Population
3.2. Assessment of Anthropometric Characteristics
3.2.1. Anthropometric Characteristics: IEiM Patients vs. Controls
3.2.2. Anthropometric Characteristics: Intermediary Metabolism Disorders
3.3. Body Composition Assessment
3.3.1. Body Composition Assessment: IEiM Patients vs. Controls
3.3.2. Body Composition Assessment: IEiM Subtypes
3.4. Assessment of Patterns of Physical Activity
3.5. Food intake Assessment
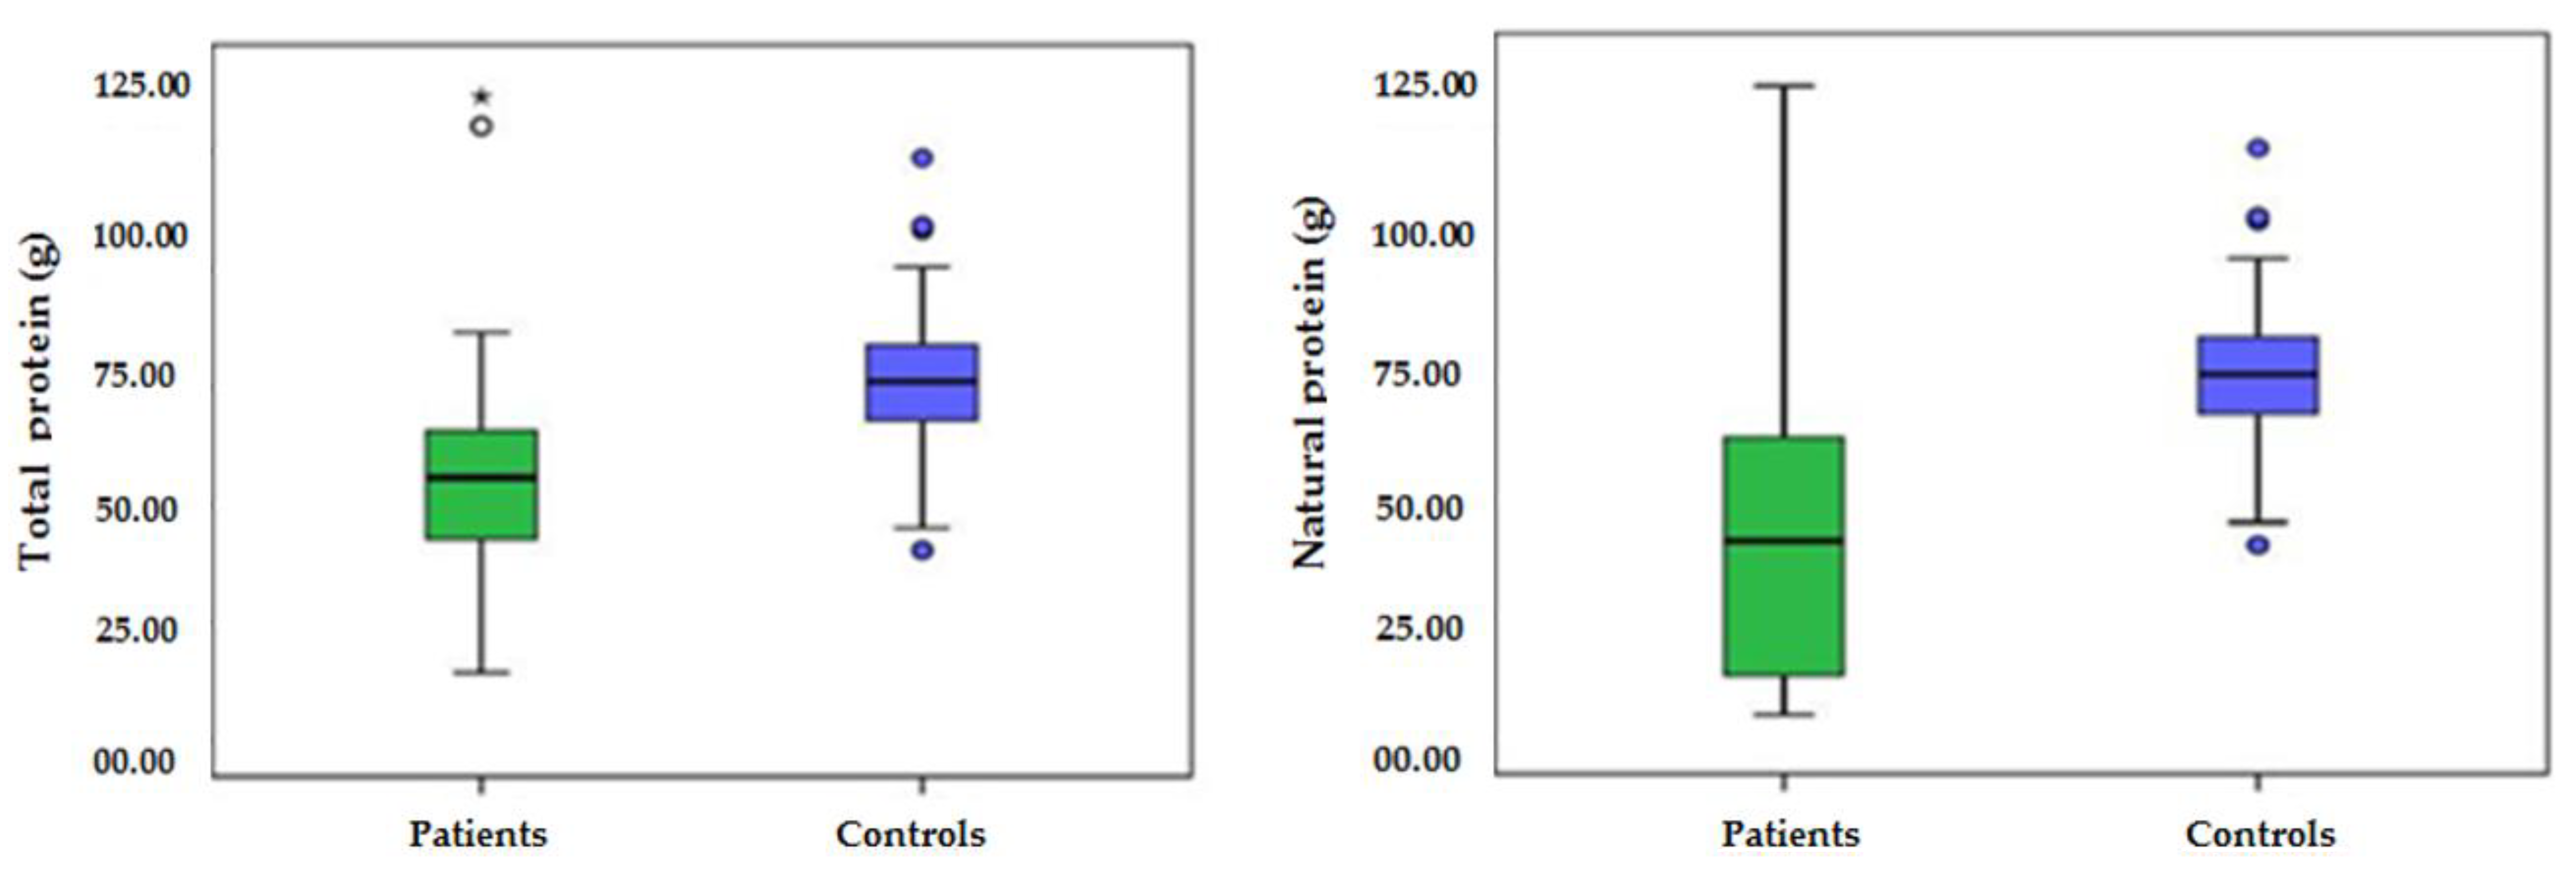
3.5.1. Food Intake: IEiM Patients vs. Controls
3.5.2. Food Intake: IEiM Subtypes
4. Discussion
4.1. Anthropometric Characteristics
4.2. Body Composition Assessment
4.3. Physical Activity in IEiM Patients
4.4. Dietary Intake in IEiM Patients
5. Conclusions
Supplementary Materials
Author Contributions
Funding
Institutional Review Board Statement
Informed Consent Statement
Data Availability Statement
Conflicts of Interest
References
- Saudubray, J.; Mochel, F.; Lamari, F.; Garcia-Cazorla, A. Proposal for a simplified classification of IMD based on a pathophysiological approach: A practical guide for clinicians. J. Inherit. Metab. Dis. 2019, 42, 706–727. [Google Scholar] [CrossRef]
- Loeber, J.; Platis, D.; Zetterström, R.; Almashanu, S.; Boemer, F.; Bonham, J.; Borde, P.; Brincat, I.; Cheillan, D.; Dekkers, E.; et al. Neonatal Screening in Europe Revisited: An ISNS Perspective on the Current State and Developments Since 2010. Int. J. Neonatal Screen. 2021, 7, 15. [Google Scholar] [CrossRef]
- De Jesus, V.R.; Mei, J.V.; Cordovado, S.K.; Cuthbert, C.D. The Newborn Screening Quality Assurance Program at the Centers for Disease Control and Prevention: Thirty-five Year Experience Assuring Newborn Screening Laboratory Quality. Int. J. Neonatal. Screen. 2015, 1, 13–26. [Google Scholar] [CrossRef]
- MacDonald, A.; van Wegberg, A.M.J.; Ahring, K.; Beblo, S.; Belanger-Quintana, A.; Burlina, A.; Campistol, J.; Coşkun, T.; Feillet, F.; Giżewska, M.; et al. PKU dietary handbook to accompany PKU guidelines. Orphanet J. Rare Dis. 2020, 15, 171. [Google Scholar] [CrossRef]
- Fraser, J.L.; Venditti, C.P. Methylmalonic and propionic acidemias: Clinical management update. Curr. Opin. Pediatr. 2016, 28, 682–693. [Google Scholar] [CrossRef] [PubMed]
- Häberle, J.; Burlina, A.; Chakrapani, A.; Dixon, M.; Karall, D.; Lindner, M.; Mandel, H.; Martinelli, D.; Pintos-Morell, G.; Santer, R.; et al. Suggested guidelines for the diagnosis and management of urea cycle disorders: First revision. J. Inherit. Metab. Dis. 2019, 42, 1192–1230. [Google Scholar] [CrossRef]
- Welling, L.; Berry, G.T.; Burlina, A.B.; Eyskens, F.; Gautschi, M.; Grünewald, S.; Gubbels, C.S.; Knerr, I.; Labrune, P.; van der Lee, J.H.; et al. International clinical guideline for the management of classical galactosemia: Diagnosis, treatment, and follow-up. J. Inherit. Metab. Dis. 2017, 40, 171–176. [Google Scholar] [CrossRef] [PubMed]
- Schiergens, K.A.; Weiss, K.J.; Dokoupil, K.; Fleissner, S.; Maier, E.M. Dietary treatment of inborn errors of metabolism-a balancing act between indulgence and therapy. Bundesgesundheitsblatt Gesundh. Gesundh. 2020, 63, 864–871. [Google Scholar] [CrossRef] [PubMed]
- Camp, K.M.; Lloyd-Puryear, M.A.; Huntington, K.L. Nutritional treatment for inborn errors of metabolism: Indications, regulations, and availability of medical foods and dietary supplements using phenylketonuria as an example. Mol. Genet. Metab. 2012, 107, 3–9. [Google Scholar] [CrossRef]
- Gambello, M.J.; Li, H. Current strategies for the treatment of inborn errors of metabolism. J. Genet. Genom. 2018, 45, 61–70. [Google Scholar] [CrossRef] [PubMed]
- Langeveld, M.; Hollak, C.E.M. Bone health in patients with inborn errors of metabolism. Rev. Endocr. Metab. Disord. 2018, 19, 81–92. [Google Scholar] [CrossRef] [PubMed]
- Evans, M.; Truby, H.; Boneh, A. The Relationship between Dietary Intake, Growth, and Body Composition in Inborn Errors of Intermediary Protein Metabolism. J. Pediatr. 2017, 188, 163–172. [Google Scholar] [CrossRef]
- Boyer, S.W.; Barclay, L.J.; Burrage, L.C. Inherited Metabolic Disorders: Aspects of Chronic Nutrition Management. Nutr. Clin. Pract. 2015, 30, 502–510. [Google Scholar] [CrossRef]
- De Castro, M.J.; de Lamas, C.; Sanchez-Pintos, P.; Gonzalez-Lamuno, D.; Couce, M.L. Bone Status in Patients with Phenylketonuria: A Systematic Review. Nutrients 2020, 12, 2154. [Google Scholar] [CrossRef]
- Montoya Parra, G.A.; Singh, R.H.; Cetinyurek-Yavuz, A.; Kuhn, M.; MacDonald, A. Status of nutrients important in brain function in phenylketonuria: A systematic review and meta-analysis. Orphanet J. Rare Dis. 2018, 13, 101. [Google Scholar] [CrossRef]
- Camatta, G.C.; Kanufre, V.D.C.; Alves, M.R.A.; Soares, R.D.L.; Norton, R.D.C.; De Aguiar, M.J.B.; Starling, A.L.P. Body fat percentage in adolescents with phenylketonuria and associated factors. Mol. Genet. Metab. Rep. 2020, 23, 100595. [Google Scholar] [CrossRef] [PubMed]
- Francini-Pesenti, F.; Gugelmo, G.; Lenzini, L.; Vitturi, N. Nutrient Intake and Nutritional Status in Adult Patients with Inherited Metabolic Diseases Treated with Low-Protein Diets: A Review on Urea Cycle Disorders and Branched Chain Organic Acidemias. Nutrients 2020, 12, 3331. [Google Scholar] [CrossRef]
- Molema, F.; Gleich, F.; Burgard, P.; Van Der Ploeg, A.T.; Summar, M.L.; Chapman, K.A.; Lund, A.M.; Rizopoulos, D.; Kölker, S.; Williams, M.; et al. Decreased plasma l-arginine levels in organic acidurias (MMA and PA) and decreased plasma branched-chain amino acid levels in urea cycle disorders as a potential cause of growth retardation: Options for treatment. Mol. Genet. Metab. 2019, 126, 397–405. [Google Scholar] [CrossRef]
- Ogden, C.L.; Kuczmarski, R.J.; Flegal, K.M.; Mei, Z.; Guo, S.; Wei, R.; Grummer-Strawn, L.M.; Curtin, L.R.; Roche, A.F.; Johnson, C.L. Centers for Disease Control and Prevention 2000 Growth Charts for the United States: Improvements to the 1977 National Center for Health Statistics Version. Pediatrics 2002, 109, 45–60. [Google Scholar] [CrossRef] [PubMed]
- Zanchetta, J.R.; Plotkin, H.; Alvarez Filgueira, M.L. Bone mass in children: Normative values for the 2-20-year-old population. Bone 1995, 16 (Suppl. 4), 393S–399S. [Google Scholar]
- Serra-Majem, L.; Ribas, L.; Pérez-Rodrigo, C.; García-Closas, R.; Peña-Quintana, L.; Aranceta, J. Determinants of nutrient intake among children and adolescents: Results from the enKid Study. Ann. Nutr. Metab. 2002, 46, 31–38. [Google Scholar] [CrossRef]
- Bassett, D.R., Jr. International physical activity questionnaire: 12-country reliability and validity. Med. Sci. Sports Exerc. 2003, 35, 1396. [Google Scholar] [CrossRef]
- Rake, J.P.; Visser, G.; Huismans, D.; Huitema, S.; Van Der Veer, E.; Piers, D.A.; Smit, G.P.A. Bone mineral density in children, adolescents and adults with glycogen storage disease type Ia: A cross-sectional and longitudinal study. J. Inherit. Metab. Dis. 2003, 26, 371–384. [Google Scholar] [CrossRef] [PubMed]
- Dos Santos, B.B.; Nalin, T.; Grokoski, K.C.; Perry, I.D.S.; Refosco, L.F.; Vairo, F.P.; Souza, C.F.M.; Schwartz, I.V.D. Nutritional Status and body composition in patients with hepatic glycogen storage disease treated with uncooked cornstarch—A controlled study. J. Inborn Errors Metab. 2017, 5, 1–7. [Google Scholar] [CrossRef]
- Waggoner, D.D.; Buist, N.R.M.; Donnell, G.N. Long-term prognosis in galactosaemia: Results of a survey of 350 cases. J. Inherit. Metab. Dis. 1990, 13, 802–818. [Google Scholar] [CrossRef] [PubMed]
- Schweitzer, S.; Shin, Y.; Jakobs, C.; Brodehl, J. Long-term outcome in 134 patients with galactosaemia. Eur. J. Nucl. Med. Mol. Imaging 1993, 152, 36–43. [Google Scholar] [CrossRef] [PubMed]
- Rubio-Gozalbo, M.E.; Haskovic, M.; Bosch, A.M.; Burnyte, B.; Coelho, A.I.; Cassiman, D.; Couce, M.L.; Dawson, C.; Demirbas, D.; Derks, T.; et al. The natural history of classic galactosemia: Lessons from the GalNet registry. Orphanet J. Rare Dis. 2019, 14, 1–11. [Google Scholar] [CrossRef] [PubMed]
- Pronicka, E.; Adamowicz, M.; Kowalik, A.; Płoski, R.; Radomyska, B.; Rogaszewska, M.; Rokicki, D.; Sykut-Cegielska, J. Elevated Carbohydrate-Deficient Transferrin (CDT) and Its Normalization on Dietary Treatment as a Useful Biochemical Test for Hereditary Fructose Intolerance and Galactosemia. Pediatr. Res. 2007, 62, 101–105. [Google Scholar] [CrossRef] [PubMed]
- Bertoli, S.; Masnada, S.; De Amicis, R.; Sangiorgio, A.; Leone, A.; Gambino, M.; Lessa, C.; Tagliabue, A.; Ferraris, C.; De Giorgis, V.; et al. Glucose transporter 1 deficiency syndrome: Nutritional and growth pattern phenotypes at diagnosis. Eur. J. Clin. Nutr. 2020, 74, 1290–1298. [Google Scholar] [CrossRef] [PubMed]
- Ferraris, C.; Guglielmetti, M.; Pasca, L.; De Giorgis, V.; Ferraro, O.E.; Brambilla, I.; Leone, A.; De Amicis, R.; Bertoli, S.; Veggiotti, P.; et al. Impact of the Ketogenic Diet on Linear Growth in Children: A Single-Center Retrospective Analysis of 34 Cases. Nutrients 2019, 11, 1442. [Google Scholar] [CrossRef]
- White, J.E.; Kronmal, R.A.; Acosta, P.B. Excess weight among children with phenylketonuria. J. Am. Coll. Nutr. 1982, 1, 293–303. [Google Scholar] [CrossRef] [PubMed]
- Allen, J.R.; McCauley, J.C.; Waters, D.L.; O’Connor, J.; Roberts, D.C.; Gaskin, K.J. Resting energy expenditure in children with phenylketonuria. Am. J. Clin. Nutr. 1995, 62, 797–801. [Google Scholar] [CrossRef] [PubMed]
- Adamczyk, P.; Morawiec-Knysak, A.; Płudowski, P.; Banaszak, B.; Karpe, J.; Pluskiewicz, W. Bone metabolism and the muscle–bone relationship in children, adolescents and young adults with phenylketonuria. J. Bone Miner. Metab. 2010, 29, 236–244. [Google Scholar] [CrossRef] [PubMed]
- Bélanger-Quintana, A.; Martínez-Pardo, M. Physical development in patients with phenylketonuria on dietary treatment: A retrospective study. Mol. Genet. Metab. 2011, 104, 480–484. [Google Scholar] [CrossRef]
- Hauser, N.S.; Manoli, I.; Graf, J.C.; Sloan, J.; Venditti, C.P. Variable dietary management of methylmalonic acidemia: Metabolic and energetic correlations. Am. J. Clin. Nutr. 2010, 93, 47–56. [Google Scholar] [CrossRef]
- Batshaw, M.L.; Tuchman, M.; Summar, M.; Seminara, J.; Members of the Urea Cycle Disorders Consortium. A longitudinal study of urea cycle disorders. Mol. Genet. Metab. 2014, 113, 127–130. [Google Scholar] [CrossRef]
- Aldámiz-Echevarría, L.; Bueno, M.A.; Couce, M.L.; Lage, S.; Dalmau, J.; Vitoria, I.; Andrade, F.; Blasco, J.; Alcalde, C.; Gil, D.; et al. Anthropometric characteristics and nutrition in a cohort of PAH-deficient patients. Clin. Nutr. 2014, 33, 702–717. [Google Scholar] [CrossRef]
- Couce, M.L.; Guler, I.; Anca-Couce, A.; Lojo, M.; Mirás, A.; Leis, R.; Pérez-Muñuzuri, A.; Fraga, J.M.; Gude, F. New insights in growth of phenylketonuric patients. Eur. J. Nucl. Med. Mol. Imaging 2014, 174, 651–659. [Google Scholar] [CrossRef]
- Manoli, I.; Myles, J.G.; Sloan, J.L.; Shchelochkov, O.A.; Venditti, C.P. A critical reappraisal of dietary practices in methylmalonic acidemia raises concerns about the safety of medical foods. Part 1: Isolated methylmalonic acidemias. Genet. Med. 2016, 18, 386–395. [Google Scholar] [CrossRef]
- Couce, M.L.; Sánchez-Pintos, P.; Vitoria, I.; De Castro, M.-J.; Aldámiz-Echevarría, L.; Correcher, P.; Fernandez-Marmiesse, A.; Roca, I.; Hermida, A.; Martínez-Olmos, M.; et al. Carbohydrate status in patients with phenylketonuria. Orphanet J. Rare Dis. 2018, 13, 103. [Google Scholar] [CrossRef]
- Serra, D.; Mera, P.; Malandrino, M.I.; Mir, J.F.; Herrero, L. Mitochondrial Fatty Acid Oxidation in Obesity. Antioxid. Redox Signal. 2013, 19, 269–284. [Google Scholar] [CrossRef]
- Yazıcı, D.; Sezer, H. Insulin Resistance, Obesity and Lipotoxicity. Adv. Exp. Med. Biol. 2017, 960, 277–304. [Google Scholar] [CrossRef]
- Clark, E.M.; Ness, A.R.; Tobias, J.H. Adipose Tissue Stimulates Bone Growth in Prepubertal Children. J. Clin. Endocrinol. Metab. 2006, 91, 2534–2541. [Google Scholar] [CrossRef]
- Leonard, M.B.; Shults, J.; A Wilson, B.; Tershakovec, A.M.; Zemel, B.S. Obesity during childhood and adolescence augments bone mass and bone dimensions. Am. J. Clin. Nutr. 2004, 80, 514–523. [Google Scholar] [CrossRef] [PubMed]
- Timpson, N.J.; Sayers, A.; Davey-Smith, G.; Tobias, J.H. How Does Body Fat Influence Bone Mass in Childhood? A Mendelian Randomization Approach. J. Bone Miner. Res. 2009, 24, 522–533. [Google Scholar] [CrossRef]
- Koura, H.M.; Ismail, N.A.; Kamel, A.F.; Ahmed, A.M.; Saad-Hussein, A.; Effat, L.K. A long-term study of bone mineral density in patients with phenylketonuria under diet therapy. Arch. Med. Sci. 2011, 3, 493–500. [Google Scholar] [CrossRef]
- Zeman, J.; Bayer, M.; Stepán, J. Bone mineral density in patients with phenylketonuria. Acta Paediatr. 1999, 88, 1348–1351. [Google Scholar] [CrossRef] [PubMed]
- Touati, G.; Valayannopoulos, V.; Mention, K.; De Lonlay, P.; Jouvet, P.; Depondt, E.; Assoun, M.; Souberbielle, J.C.; Rabier, D.; De Baulny, H.O.; et al. Methylmalonic and propionic acidurias: Management without or with a few supplements of specific amino acid mixture. J. Inherit. Metab. Dis. 2006, 29, 288–298. [Google Scholar] [CrossRef] [PubMed]
- Wilcox, G.; Strauss, B.J.G.; Francis, D.E.M.; Upton, H.; Boneh, A. Body composition in young adults with inborn errors of protein metabolism—A pilot study. J. Inherit. Metab. Dis. 2005, 28, 613–626. [Google Scholar] [CrossRef] [PubMed]
- Mirás, A.; Bóveda, M.D.; Leis, M.R.; Mera, A.; Aldámiz-Echevarría, L.; Fernández-Lorenzo, J.R.; Fraga, J.M.; Couce, M.L. Risk factors for developing mineral bone disease in phenylketonuric patients. Mol. Genet. Metab. 2013, 108, 149–154. [Google Scholar] [CrossRef]
- Van Erven, B.; Welling, L.; van Calcar, S.C.; Doulgeraki, A.; Eyskens, F.; Gribben, J.; Treacy, E.P.; Vos, R.; Waisbren, S.E.; Rubio-Gozalbo, M.E.; et al. Bone Health in Classic Galactosemia: Systematic Review and Meta-Analysis. JIMD Rep. 2017, 35, 87–96. [Google Scholar]
- Rubio-Gozalbo, M.; Hamming, S.; Van Kroonenburgh, M.; Bakker, J.A.; Vermeer, C.; Forget, P.P. Bone mineral density in patients with classic galactosaemia. Arch. Dis. Child. 2002, 87, 57–60. [Google Scholar] [CrossRef]
- Schwahn, B.; Rauch, F.; Wendel, U.; Schönau, E. Low bone mass in glycogen storage disease type 1 is associated with reduced muscle force and poor metabolic control. J. Pediatr. 2002, 141, 350–356. [Google Scholar] [CrossRef] [PubMed][Green Version]
- Rake, J.P.; Visser, G.; Labrune, P.; Leonard, J.V.; Ullrich, K.; Smit, G.P. Glycogen storage disease type I: Diagnosis, management, clinical course and outcome. Results of the European Study on Glycogen Storage Disease Type I (ESGSD I). Eur. J. Pediatr. 2002, 161 (Suppl. 1), S20–S34. [Google Scholar] [CrossRef] [PubMed]
- Mundy, H.R.; Hindmarsh, P.C.; Matthews, D.R.; Leonard, J.V.; Lee, P.J. The regulation of growth in glycogen storage disease type 1. Clin. Endocrinol. 2003, 58, 332–339. [Google Scholar] [CrossRef]
- Batey, L.A.; Welt, C.K.; Rohr, F.; Wessel, A.; Anastasoaie, V.; Feldman, H.A.; Guo, C.-Y.; Rubio-Gozalbo, E.; Berry, G.; Gordon, C.M. Skeletal health in adult patients with classic galactosemia. Osteoporos. Int. 2012, 24, 501–509. [Google Scholar] [CrossRef]
- Waisbren, S.E.; Potter, N.L.; Gordon, C.M.; Green, R.C.; Greenstein, P.; Gubbels, C.S.; Rubio-Gozalbo, E.; Schomer, D.; Welt, C.; Anastasoaie, V.; et al. The adult galactosemic phenotype. J. Inherit. Metab. Dis. 2011, 35, 279–286. [Google Scholar] [CrossRef]
- Melis, D.; Pivonello, R.; Cozzolino, M.; Della Casa, R.; Balivo, F.; Del Puente, A.; Dionisi-Vici, C.; Cotugno, G.; Zuppaldi, C.; Rigoldi, M.; et al. Impaired Bone Metabolism in Glycogen Storage Disease Type 1 Is Associated with Poor Metabolic Control in Type 1a and with Granulocyte Colony-Stimulating Factor Therapy in Type 1b. Horm. Res. Paediatr. 2014, 81, 55–62. [Google Scholar] [CrossRef]
- Wong, E.M.; Lehman, A.; Acott, P.; Gillis, J.; Metzger, D.L.; Sirrs, S.; Baumgartner, M.R.; Patterson, M.; Rahman, S.; Peters, V.; et al. Hypogonadotropic Hypogonadism in Males with Glycogen Storage Disease Type 1. JIMD Rep. 2017, 36, 79–84. [Google Scholar] [CrossRef]
- Bull, F.C.; Al-Ansari, S.S.; Biddle, S.; Borodulin, K.; Buman, M.P.; Cardon, G.; Carty, C.; Chaput, J.-P.; Chastin, S.; Chou, R.; et al. World Health Organization 2020 guidelines on physical activity and sedentary behaviour. Br. J. Sports Med. 2020, 54, 1451–1462. [Google Scholar] [CrossRef] [PubMed]
- World Health Organization. Global Action Plan on Physical Activity 2018–2030: More Active People for a Healthier World; World Health Organization: Geneva, Switzerland, 2018. [Google Scholar]
- Serrano, M.; Vilaseca, A.; Campistol, J. Errores congénitos del metabolismo y práctica deportiva. Med. Esport 2010, 45, 185–189. [Google Scholar] [CrossRef]
- Van Wegberg, A.M.J.; Macdonald, A.; Ahring, K.; BãLanger-Quintana, A.; Blau, N.; Bosch, A.M.; Burlina, A.; Campistol, J.; Feillet, F.; Giżewska, M.; et al. The complete European guidelines on phenylketonuria: Diagnosis and treatment. Orphanet J. Rare Dis. 2017, 12, 1–56. [Google Scholar] [CrossRef] [PubMed]
- Rubio-Agusti, I.; Carecchio, M.; Bhatia, K.P.; Kojovic, M.; Parees, I.; Chandrashekar, H.S.; Footitt, E.J.; Burke, D.; Edwards, M.J.; Lachmann, R.H.; et al. Movement Disorders in Adult Patients with Classical Galactosemia. Mov. Disord. 2013, 28, 804–810. [Google Scholar] [CrossRef] [PubMed]
- Gubbels, C.S.; Maurice-Stam, H.; Berry, G.; Bosch, A.M.; Waisbren, S.; Rubio-Gozalbo, M.E.; Grootenhuis, M.A. Psychosocial developmental milestones in men with classic galactosemia. J. Inherit. Metab. Dis. 2011, 34, 415–419. [Google Scholar] [CrossRef]
- Tarnopolsky, M.A. Myopathies Related to Glycogen Metabolism Disorders. Neurotherapeutics 2018, 15, 915–927. [Google Scholar] [CrossRef] [PubMed]
- Preisler, N.; Haller, R.G.; Vissing, J. Exercise in muscle glycogen storage diseases. J. Inherit. Metab. Dis. 2014, 38, 551–563. [Google Scholar] [CrossRef]
- Fong, C.T. Principles of inborn errors of metabolism: An exercise. Pediatr. Rev. 1995, 16, 390–395. [Google Scholar] [CrossRef]
- Hannan, M.T.; Mangano, K.M.; Sahni, S. Do nutrients influence bone health? A commentary on new findings in the field. J. Bone Miner. Res. 2015, 30, 967–969. [Google Scholar] [CrossRef] [PubMed]
- Demirdas, S.; Coakley, K.E.; Bisschop, P.H.; Hollak, C.E.M.; Bosch, A.M.; Singh, R.H. Bone health in phenylketonuria: A systematic review and meta-analysis. Orphanet J. Rare Dis. 2015, 10, 17. [Google Scholar] [CrossRef]


| Patients | ||||
|---|---|---|---|---|
| Females | Males | |||
| N | % | N | % | |
| Aminoacidopathies | ||||
| Mild HPA | 12 | 27.9 | 9 | 26.5 |
| PKU | 14 | 32.5 | 11 | 32.4 |
| Hypermethioninemia by MAT I/III deficiency | 4 | 9.3 | 5 | 14.7 |
| MSUD | 4 | 9.3 | 2 | 5.8 |
| Tyrosinemia type 1 | 2 | 4.7 | 2 | 5.8 |
| Glutaric aciduria type 1 | 3 | 7 | 3 | 8.8 |
| Citrulinemia type I | 1 | 2.3 | 0 | 0 |
| OTC deficiency | 0 | 0 | 1 | 2.9 |
| 3-Hydroxy-3-methylglutaric aciduria | 0 | 0 | 1 | 2.9 |
| Methylmalonic aciduria | 2 | 4.7 | 0 | 0 |
| Nonketotic hyperglycinemia | 1 | 2.3 | 0 | 0 |
| Carbohydrate disorders and defects of transport of carbohydrates | ||||
| Classic galactosemia | 2 | 28.6 | 1 | 16.7 |
| Hereditary fructose intolerance | 2 | 28.6 | 3 | 50 |
| Glycogen storage disease type 1 | 2 | 28.6 | 2 | 33.3 |
| Glucose transporter 1 deficiency | 1 | 14.2 | 0 | 0 |
| Fatty acid β-oxidation disorders | ||||
| MCADD | 3 | 42.9 | 3 | 100 |
| SCADD | 4 | 57.1 | 0 | 0 |
| Patients | Controls | ||||
|---|---|---|---|---|---|
| N | % | N | % | p | |
| BMI PERCENTILE | |||||
| Underweight (p < 5) | 8 | 8.1 | 4 | 4.1 | 0.039 |
| Normal weight (P5–85) | 56 | 56.6 | 64 | 65.3 | 0.000 |
| Overweight and obesity (p > 85) | 35 | 35.4 | 30 | 30.6 | 0.000 |
| BMI Z-SCORE | |||||
| −3.090 to ≤ −1.645 | 8 | 8.08 | 4 | 4.1 | 0.044 |
| −1.645 to ≤ 1.030 | 56 | 56.6 | 64 | 65.3 | 0.037 |
| 1.030 to ≤ 1.645 | 9 | 9.09 | 25 | 25.5 | 0.017 |
| 1.645 to 3.090 | 24 | 24.2 | 5 | 5.1 | 0.044 |
| ≥3.090 | 2 | 2.02 | 0 | 0 | 0.614 |
| HEIGHT PERCENTILE | |||||
| p < 5 | 11 | 11.1 | 0 | 0 | 0.001 |
| P5–95 | 81 | 81.8 | 93 | 94.9 | 0.007 |
| p > 95 | 7 | 7.1 | 5 | 5.1 | 0.812 |
| HEIGHT Z-SCORE | |||||
| ≤2 | 8 | 8.1 | 0 | 0 | 0.001 |
| −2 to −1 | 15 | 15.2 | 12 | 12.2 | 0.511 |
| −1 to 1 | 61 | 61.6 | 64 | 65.4 | 0.322 |
| 1 to 2 | 10 | 10.1 | 17 | 17.3 | 0.056 |
| ≥2 | 5 | 5 | 5 | 5.1 | 0.849 |
| WC PERCENTILE | |||||
| P10–85 | 62 | 62.6 | 64 | 65.3 | 0.884 |
| P85–95 | 11 | 11.1 | 5 | 5.1 | 0.035 |
| p > 95 | 10 | 10.1 | 0 | 0 | 0.002 |
| WC Z-SCORE | |||||
| ≤−2 | 6 | 6.1 | 11 | 11.2 | 0.041 |
| −2 to −1 | 23 | 24.2 | 23 | 23.5 | 0.741 |
| −1 to 1 | 49 | 48.5 | 58 | 60.2 | 0.037 |
| 1 to 2 | 12 | 12.1 | 6 | 5.1 | 0.047 |
| ≥2 | 9 | 9.1 | 0 | 0 | 0.003 |
| Total | 99 | 100 | 98 | 100 | |
| BMI Category | AA | FAOD | CHD | |||
|---|---|---|---|---|---|---|
| N | % | N | % | N | % | |
| Underweight (p < 5) | 5 | 6.5 | 1 | 10 | 2 | 16.7 |
| Normal weight (P5–85) | 44 | 57.1 | 6 | 60 | 6 | 50 |
| Overweight and obesity (p > 85) | 28 | 36.4 | 3 | 30 | 4 | 33.3 |
| Total | 77 | 100 | 10 | 100 | 12 | 100 |
| Patients | Controls | |||||
|---|---|---|---|---|---|---|
| Anthropometric Parameter (z-Score) | IEiM Subtype | N | Mean ± SD | N | Mean ± SD | p |
| Weight | AA | 77 | 0.469 ± 1.12 | 98 | 0.486 ± 0.86 | 0.913 |
| FAOD | 10 | 0.935 ± 0.98 | 20 | 0.297 ± 0.94 | 0.136 | |
| CHDs | 12 | −0.349 ± 1.39 | 20 | 0.248 ± 0.76 | 0.179 | |
| Height | AA | 77 | −0.267 ± 1.18 | 98 | 0.148 ± 0.95 | 0.012 |
| FAOD | 10 | 0.711 ± 1.16 | 20 | −0.13 ± 0.82 | 0.061 | |
| CHD | 12 | −1.173 ± 1.04 | 20 | −0.03 ± 0.92 | 0.007 | |
| BMI | AA | 77 | 0.662 ± 1.22 | 98 | −0.373 ± 0.95 | 0.000 |
| FAOD | 10 | 0.64 ± 1.33 | 20 | −0.68 ± 0.98 | 0.014 | |
| CHD | 12 | −0.033 ± 1.73 | 20 | −0.379 ± 0.83 | 0.447 | |
| Mid-arm circumference | AA | 77 | −0.242 ± 1.14 | 98 | −0.373 ± 0.99 | 0.417 |
| FAOD | 10 | −0.15 ± 1.3 | 20 | −0.68 ± 0.98 | 0.287 | |
| CHD | 12 | −0.9 ± 1.45 | 20 | −0.379 ± 0.83 | 0.339 | |
| Waist circumference | AA | 77 | −0.075 ± 1.35 | 98 | −0.588 ± 1.11 | 0.008 |
| FAOD | 10 | −0.285 ± 1.57 | 20 | −0.794 ± 1.09 | 0.382 | |
| CHD | 12 | 0.052 ± 1.2 | 20 | −0.363 ± 0.69 | 0.251 | |
| HIP circumference | AA | 77 | −0.635 ± 1.08 | 98 | −0.821 ± 0.88 | 0.319 |
| FAOD | 10 | 0.219 ± 1.19 | 20 | −1.014 ± 0.83 | 0.080 | |
| CHD | 12 | −1.16 ± 1.23 | 20 | −0.778 ± 0.84 | 0.443 | |
| Biceps skinfold | AA | 77 | 0.778 ± 1.57 | 98 | 0.288 ± 1.44 | 0.036 |
| FAOD | 10 | 0.241 ± 2.44 | 20 | 0.109 ± 1.28 | 0.672 | |
| CHD | 12 | 0.443 ± 1.52 | 20 | 0.787 ± 125 | 0.726 | |
| Triceps skinfold | AA | 77 | 0.131 ± 1.25 | 92 | 0.015 ± 1.4 | 0.547 |
| FAOD | 10 | −0.215 ± 1.59 | 12 | 0.022 ± 1.33 | 0.708 | |
| CHD | 12 | −0.052 ± 1.28 | 15 | 0.298 ± 1.03 | 0.514 | |
| Subscapular skinfold | AA | 77 | 1.1 ± 2.38 | 98 | 0.578 ± 1.79 | 0.106 |
| FAO | 10 | 1.293 ± 1.95 | 20 | 0.82 ± 1.84 | 0.811 | |
| CHD | 12 | 0.817 ± 2.15 | 20 | 0.792 ± 1.46 | 0.930 | |
| Suprailiac skinfold | AA | 77 | 1.38 ± 1.86 | 98 | 1.03 ± 1.66 | 0.201 |
| FAOD | 10 | 1.293 ± 1.95 | 20 | 0.82 ± 1.84 | 0.565 | |
| CHD | 12 | 1.363 ± 2.04 | 20 | 1.176 ± 1.12 | 0.755 | |
| Patients | Controls | ||
|---|---|---|---|
| z-Score | Mean ± SD | Mean ± SD | p |
| Muscle mass | 0.09 ± 1.6 | 0.29 ± 1.3 | 0.317 |
| Fat mass | 0.26 ± 1.8 | −0.07 ± 1.3 | 0.159 |
| BMD total | 0.89 ± 0.95 | 1.6 ± 1.5 | 0.001 |
| Lumbar spine L2-L4 | 0.65 ± 0.69 | 0.8 ± 0.64 | 0.117 |
| Femur neck | 0.45 ± 0.76 | 0.67 ± 0.75 | 0.044 |
| Femur trochanter | 0.5 ± 0.98 | 0.84 ± 0.89 | 0.012 |
| Ward’s triangle | −0.21 ± 0.71 | 0.04 ± 0.8 | 0.023 |
| Patients | Controls | |||||
|---|---|---|---|---|---|---|
| z-Score | IEiM Subtype | N | Mean ± SD | N | Mean ± SD | p |
| Muscle mass | AA | 77 | 0.023 ± 1.39 | 98 | 0.297 ± 1.26 | 0.383 |
| FAOD | 10 | 1.515 ± 2.3 | 20 | 0.24 ± 1.16 | 0.110 | |
| CHD | 12 | −0.687 ± 1.39 | 20 | 0.046 ± 1.24 | 0.254 | |
| Fat mass | AA | 77 | 0.315 ± 1.83 | 98 | −0.071 ± 1.35 | 0.026 |
| FAOD | 10 | −0.021 ± 2.34 | 20 | −0.35 ± 1.22 | 0.676 | |
| CHD | 12 | 0.162 ± 1.65 | 20 | 0.086 ± 0.73 | 0.940 | |
| BMD total | AA | 77 | 0.833 ± 0.92 | 98 | 1.66 ± 1.56 | 0.000 |
| FAOD | 10 | 1.38 ± 0.76 | 20 | 1.493 ± 1.06 | 0.780 | |
| CHD | 12 | 0.863 ± 1.26 | 20 | 1.639 ± 1.63 | 0.213 | |
| BMD spine L2–L4 | AA | 77 | 0.641 ± 0.68 | 98 | 0.88 ± 0.64 | 0.321 |
| FAOD | 10 | 1.024 ± 0.59 | 20 | 0.935 ± 0.78 | 0.818 | |
| CHD | 12 | 0.38 ± 0.71 | 20 | 0.88 ± 0.76 | 0.206 | |
| BMD femur trochanter | AA | 77 | 0.491 ± 095 | 98 | 0.84 ± 0.89 | 0.013 |
| FAOD | 10 | 1.06 ± 1.16 | 20 | 0.45 ± 1.25 | 0.753 | |
| CHD | 12 | 0.11 ± 0.85 | 20 | 0.49 ± 1.15 | 0.350 | |
| BMD femur neck | AA | 77 | 0.424 ± 0.79 | 98 | 0.67 ± 0.75 | 0.039 |
| FAOD | 10 | 0.528 ± 1.33 | 20 | 0.867 ± 0.76 | 0.473 | |
| CHD | 12 | 0.26 ± 0.56 | 20 | 0.36 ± 0.89 | 0.733 | |
| BMD Ward’s triangle | AA | 77 | −0.252 ± 0.71 | 98 | 0.04 ± 0.8 | 0.013 |
| FAOD | 10 | 0.283 ± 0.66 | 20 | −0.25 ± 1.2 | 0.229 | |
| CHD | 12 | −0.33 ± 0.59 | 20 | −0.33 ± 0.84 | 0.994 | |
| Patients | Controls | |||||
|---|---|---|---|---|---|---|
| Dietary Intake/Day | IEiM Subtype | N | Mean ± SD | N | Mean ± SD | p |
| Protein, total (g) | AA | 77 | 50.38 ± 15.9 | 98 | 75.67 ± 14.6 | 0.000 |
| FAOD | 10 | 83.29 ± 27.26 | 20 | 74.55 ± 14.97 | 0.753 | |
| CHD | 12 | 67.21 ± 24.9 | 20 | 79.17 ± 15.3 | 0.821 | |
| Protein, natural (g) | AA | 77 | 32.18 ± 23.57 | 98 | 75.67 ± 14.6 | 0.000 |
| FAOD | 10 | 83.29 ± 27.26 | 20 | 74.55 ± 14.97 | 0.658 | |
| CHD | 12 | 67.21 ± 24.9 | 20 | 79.17 ± 15.3 | 0.835 | |
| Protein (g/kg) | AA | 77 | 1.23 ± 0.45 | 98 | 2.08 ± 0.89 | 0.000 |
| FAOD | 10 | 2.03 ± 0.58 | 20 | 2.297 ± 0.95 | 0.432 | |
| CHD | 12 | 2.08 ± 1.02 | 20 | 1.99 ± 0.64 | 0.421 | |
| Fat, total (g) | AA | 77 | 47.67 ± 18.11 | 98 | 47.73 ± 10.86 | 0.954 |
| FAOD | 10 | 38.09 ± 13.11 | 20 | 49.04 ± 9.27 | 0.033 | |
| CHD | 12 | 60.48 ± 32.24 | 20 | 44.58 ± 9.3 | 0.002 | |
| CH, total (g) | AA | 77 | 237.63 ± 127.95 | 98 | 201.79 ± 39.26 | 0.012 |
| FAOD | 10 | 243.73 ± 94.66 | 20 | 209.92 ± 41.22 | 0.654 | |
| CHD | 12 | 216.12 ± 78.46 | 20 | 199.31 ± 34.55 | 0.004 | |
| Energy, total (Kcal) | AA | 77 | 1541.75 ± 386.65 | 98 | 1540.83 ± 224.77 | 0.945 |
| FAOD | 10 | 1695.64 ± 480.22 | 20 | 1587.58 ± 237.04 | 0.854 | |
| CHD | 12 | 1678.12 ± 406.34 | 20 | 1516.69 ± 200.7 | 0.027 | |
| Energy (Kcal/kg) | AA | 77 | 39.34 ± 16.39 | 98 | 43.09 ± 19.49 | 0.843 |
| FAOD | 10 | 42.4712.89 | 20 | 49.12 ± 17.88 | 0.895 | |
| CHD | 12 | 52.48 ± 22.56 | 20 | 38.67 ± 13.37 | 0.756 | |
Publisher’s Note: MDPI stays neutral with regard to jurisdictional claims in published maps and institutional affiliations. |
© 2021 by the authors. Licensee MDPI, Basel, Switzerland. This article is an open access article distributed under the terms and conditions of the Creative Commons Attribution (CC BY) license (https://creativecommons.org/licenses/by/4.0/).
Share and Cite
de Castro, M.-J.; Sánchez-Pintos, P.; Abdelaziz-Salem, N.; Leis, R.; Couce, M.L. Evaluation of Body Composition, Physical Activity, and Food Intake in Patients with Inborn Errors of Intermediary Metabolism. Nutrients 2021, 13, 2111. https://doi.org/10.3390/nu13062111
de Castro M-J, Sánchez-Pintos P, Abdelaziz-Salem N, Leis R, Couce ML. Evaluation of Body Composition, Physical Activity, and Food Intake in Patients with Inborn Errors of Intermediary Metabolism. Nutrients. 2021; 13(6):2111. https://doi.org/10.3390/nu13062111
Chicago/Turabian Stylede Castro, María-José, Paula Sánchez-Pintos, Nisreem Abdelaziz-Salem, Rosaura Leis, and María L. Couce. 2021. "Evaluation of Body Composition, Physical Activity, and Food Intake in Patients with Inborn Errors of Intermediary Metabolism" Nutrients 13, no. 6: 2111. https://doi.org/10.3390/nu13062111
APA Stylede Castro, M.-J., Sánchez-Pintos, P., Abdelaziz-Salem, N., Leis, R., & Couce, M. L. (2021). Evaluation of Body Composition, Physical Activity, and Food Intake in Patients with Inborn Errors of Intermediary Metabolism. Nutrients, 13(6), 2111. https://doi.org/10.3390/nu13062111