
Association of Maternal Dietary Patterns during Pregnancy and Offspring Weight Status across Infancy: Results from a Prospective Birth Cohort in China

 , ,
, ,
Abstract
1. Introduction
2. Materials and Methods
2.1. Study Population and Design
2.2. Exposures
2.3. Outcomes
2.4. Covariates
2.5. Statistical Analysis
3. Results
3.1. Participant Characteristics
3.2. Dietary Patterns
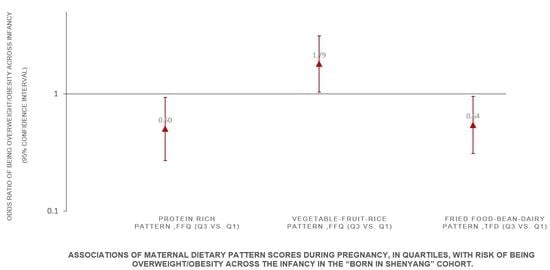
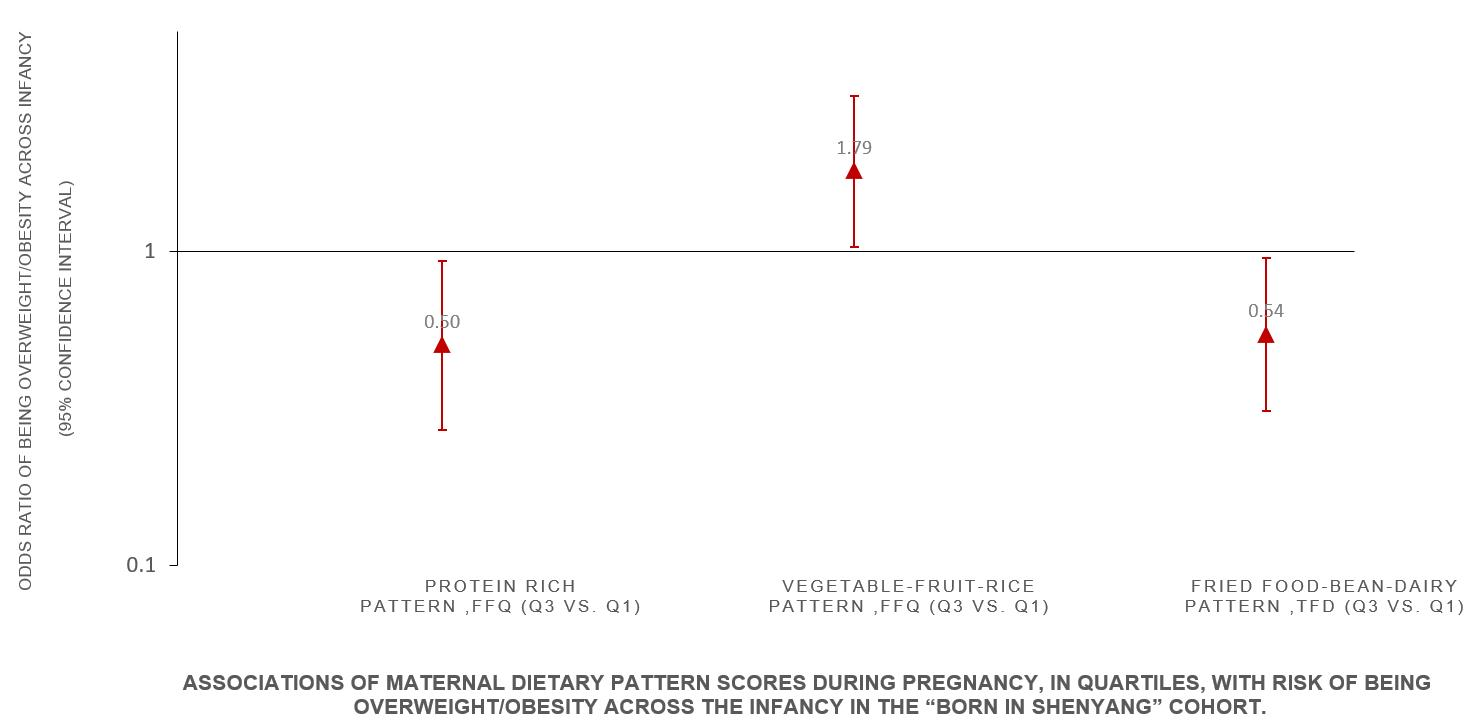
3.3. Associations of Maternal Dietary Patterns and Infant Weight Status
4. Discussion
5. Conclusions
Supplementary Materials
Author Contributions
Funding
Institutional Review Board Statement
Informed Consent Statement
Data Availability Statement
Acknowledgments
Conflicts of Interest
References
- NCD Risk Factor Collaboration (NCD-RisC). Worldwide trends in body-mass index, underweight, overweight, and obesity from 1975 to 2016: A pooled analysis of 2416 population-based measurement studies in 128·9 million children, adolescents, and adults. Lancet 2017, 390, 2627–2642. [Google Scholar] [CrossRef]
- Friend, A.; Craig, L.; Turner, S. The prevalence of metabolic syndrome in children: A systematic review of the literature. Metab. Syndr. Relat. Disord. 2013, 11, 71–80. [Google Scholar] [CrossRef] [PubMed]
- Cathaoir, K. Childhood Obesity and the Right to Health. Health Hum. Rights 2016, 18, 249–262. [Google Scholar] [PubMed]
- Liang, Y.; Hou, D.; Zhao, X.; Wang, L.; Hu, Y.; Liu, J.; Cheng, H.; Yang, P.; Shan, X.; Yan, Y.; et al. Childhood obesity affects adult metabolic syndrome and diabetes. Endocrine 2015, 50, 87–92. [Google Scholar] [CrossRef] [PubMed]
- Lloyd, L.J.; Langley-Evans, S.C.; McMullen, S. Childhood obesity and risk of the adult metabolic syndrome: A systematic review. Int. J. Obes. 2012, 36, 1–11. [Google Scholar] [CrossRef] [PubMed]
- Giles, L.C.; Whitrow, M.J.; Davies, M.J.; Davies, C.E.; Rumbold, A.R.; Moore, V.M. Growth trajectories in early childhood, their relationship with antenatal and postnatal factors, and development of obesity by age 9 years: Results from an Australian birth cohort study. Int. J. Obes. 2015, 39, 1049–1056. [Google Scholar] [CrossRef]
- East, P.; Delker, E.; Blanco, E.; Lozoff, B.; Correa, P.; Burrows, R.; Gahagan, S. BMI Trajectories from Birth to 23 Years by Cardiometabolic Risks in Young Adulthood. Obesity 2020, 28, 813–821. [Google Scholar] [CrossRef]
- Nishtar, S.; Gluckman, P.; Armstrong, T. Ending childhood obesity: A time for action. Lancet 2016, 387, 825–827. [Google Scholar] [CrossRef]
- Van den Broek, M.; Leermakers, E.T.; Jaddoe, V.W.; Steegers, E.A.; Rivadeneira, F.; Raat, H.; Horman, A.; Franco, O.H.; Kiefte-de Jong, J.C. Maternal dietary patterns during pregnancy and body composition of the child at age 6 y: The Generation R Study. Am. J. Clin. Nutr. 2015, 102, 873–880. [Google Scholar] [CrossRef]
- Yang, Z.; Huffman, S.L. Nutrition in pregnancy and early childhood and associations with obesity in developing countries. Matern. Child. Nutr. 2013, 9 (Suppl. 1), 105–119. [Google Scholar] [CrossRef]
- Martin, C.L.; Siega-Riz, A.M.; Sotres-Alvarez, D.; Robinson, W.R.; Daniels, J.L.; Perrin, E.M.; Stuebe, A.M. Maternal Dietary Patterns during Pregnancy Are Associated with Child Growth in the First 3 Years of Life. J. Nutr. 2016, 146, 2281–2288. [Google Scholar] [CrossRef] [PubMed]
- Chen, L.W.; Aris, I.M.; Bernard, J.Y.; Tint, M.T.; Chia, A.; Colega, M.; Gluckman, P.D.; Shek, L.P.; Saw, S.M.; Chong, Y.M.; et al. Associations of Maternal Dietary Patterns during Pregnancy with Offspring Adiposity from Birth Until 54 Months of Age. Nutrients 2016, 9, 2. [Google Scholar] [CrossRef] [PubMed]
- Hu, Z.; Tylavsky, F.A.; Kocak, M.; Fowke, J.H.; Han, J.C.; Davis, R.L.; Lewinn, K.Z.; Bush, N.R.; Sathyanarayana, S.; Karr, C.J.; et al. Effects of Maternal Dietary Patterns during Pregnancy on Early Childhood Growth Trajectories and Obesity Risk: The CANDLE Study. Nutrients 2020, 12, 465. [Google Scholar] [CrossRef] [PubMed]
- Biagi, C.; Nunzio, M.D.; Bordoni, A.; Gori, D.; Lanari, M. Effect of Adherence to Mediterranean Diet during Pregnancy on Children’s Health: A Systematic Review. Nutrients 2019, 11, 997. [Google Scholar] [CrossRef]
- Xu, Z.; Zhang, W. The Changing Pattern of Nutrition Intake by Social Class in Contemporary China, 1991–2011. Am. J. Public Health 2017, 107, 1809–1811. [Google Scholar] [CrossRef]
- Munthali, R.J.; Kagura, J.; Lombard, Z.; Norris, S.A. Early Life Growth Predictors of Childhood Adiposity Trajectories and Future Risk for Obesity: Birth to Twenty Cohort. Child. Obes. 2017, 13, 384–391. [Google Scholar] [CrossRef]
- Crozier, S.R.; Inskip, H.M.; Godfrey, K.M.; Robinson, S.M. Dietary patterns in pregnant women: A comparison of food-frequency questionnaires and 4 d prospective diaries. Br. J. Nutr. 2008, 99, 869–875. [Google Scholar] [CrossRef] [PubMed]
- Hu, J.; Oken, E.; Aris, I.M.; Lin, P.D.; Ma, Y.; Ding, N.; Gao, M.; Wei, X.; Wen, D. Dietary Patterns during Pregnancy Are Associated with the Risk of Gestational Diabetes Mellitus: Evidence from a Chinese Prospective Birth Cohort Study. Nutrients 2019, 11, 405. [Google Scholar] [CrossRef] [PubMed]
- Sempos, C.T. Invited Commentary: Some Limitations of Semiquantitative Food Frequency Questionnaires. Am. J. Epidemiol. 1992, 135, 1133–1136. [Google Scholar] [CrossRef]
- Robinson, S.M.; Godfrey, K.M.; Osmond, C.; Cox, V.; Barker, D. Evaluation of a food frequency questionnaire used to assess nutrient intakes in pregnant women. Eur. J. Clin. Nutr. 1996, 50, 302–308. [Google Scholar]
- Hu, J.; Aris, I.M.; Oken, E.; Ma, Y.; Ding, N.; Gao, M.; Wei, X.; Wen, D. Association of Total and Trimester-Specific Gestational Weight Gain Rate with Early Infancy Weight Status: A Prospective Birth Cohort Study in China. Nutrients 2019, 11, 280. [Google Scholar] [CrossRef]
- Yang, Y.; Wang, G.; Pan, X. Chinese Food Composition Book 1, 2nd ed.; Peking University Medical Press: Beijing, China, 2009; pp. 45–192. ISBN 9787811167276. [Google Scholar]
- WHO; Multicentre Growth Reference Study Group. WHO Child Growth Standards based on length/height, weight and age. Acta. Paediatr. Suppl. 2006, 450, 76–85. [Google Scholar]
- Xiang, M.; Konishi, M.; Hu, H.; Takahashi, M.; Fan, W.; Nishimaki, M.; Ando, K.; Kim, H.K.; Tabata, H.; Arao, T. Reliability and Validity of a Chinese-Translated Version of a Pregnancy Physical Activity Questionnaire. Matern. Child. Health J. 2016, 20, 1940–1947. [Google Scholar] [CrossRef]
- WHO Expert Consultation. Appropriate body-mass index for Asian populations and its implications for policy and intervention strategies. Lancet 2004, 363, 157–163. [Google Scholar] [CrossRef]
- Wang, S.S.; Lay, S.; Yu, H.N.; Shen, S.R. Dietary Guidelines for Chinese Residents (2016): Comments and comparisons. J. Zhejiang Univ. Sci. B 2016, 17, 649–656. [Google Scholar] [CrossRef] [PubMed]
- Hehua, Z.; Yang, X.; Qing, C.; Shanyan, G.; Yuhong, Z. Dietary patterns and associations between air pollution and gestational diabetes mellitus. Environ. Int. 2021, 147, 106347. [Google Scholar] [CrossRef]
- Geraghty, A.A.; O’Brien, E.C.; Alberdi, G.; Horan, M.K.; Donnelly, J.; Larkin, E.; Segurado, R.; Mehegan, J.; Molloy, E.J.; Mcauliffe, F.M. Maternal protein intake during pregnancy is associated with child growth up to 5 years of age, but not through insulin-like growth factor-1: Findings from the ROLO study. Br. J. Nutr. 2018, 120, 1252–1261. [Google Scholar] [CrossRef] [PubMed]
- Sun, Y.; Liu, B.; Snetselaar, L.G.; Robinson, J.G.; Wallace, R.B.; Peterson, L.L.; Bao, W. Association of fried food consumption with all cause, cardiovascular, and cancer mortality: Prospective cohort study. BMJ 2019, 364, k5420. [Google Scholar] [CrossRef]
- Herring, C.M.; Bazer, F.W.; Johnson, G.A.; Wu, G. Impacts of maternal dietary protein intake on fetal survival, growth, and development. Exp. Biol. Med. 2018, 243, 525–533. [Google Scholar] [CrossRef]
- Wu, G.; Imhoff-Kunsch, B.; Girard, A.W. Biological mechanisms for nutritional regulation of maternal health and fetal development. Paediatr. Perinat. Epidemiol. 2012, 26 (Suppl. 1), 4–26. [Google Scholar] [CrossRef]
- Farajian, P.; Panagiotakos, D.B.; Risvas, G.; Karasouli, K.; Bountziouka, V.; Voutzourakis, N.; Zampelas, A. Socio-economic and demographic determinants of childhood obesity prevalence in Greece: The GRECO (Greek Childhood Obesity) study. Public Health Nutr. 2013, 16, 240–247. [Google Scholar] [CrossRef] [PubMed]
- Switkowski, K.M.; Jacques, P.F.; Must, A.; Kleinman, K.P.; Gillman, M.W.; Oken, E. Maternal protein intake during pregnancy and linear growth in the offspring. Am. J. Clin. Nutr. 2016, 104, 1128–1136. [Google Scholar] [CrossRef] [PubMed]
- Davis, J.N.; Gunderson, E.P.; Gyllenhammer, L.E.; Goran, M.I. Impact of gestational diabetes mellitus on pubertal changes in adiposity and metabolic profiles in Latino offspring. J. Pediatr. 2013, 162, 741–745. [Google Scholar] [CrossRef]
- Martin, M.J.; Manzano, M.; Bueno-Vargas, P.; Rueda, R.; Salto, R.; Giron, M.D.; Vilchez, J.D.; Cabrera, E.; Cano, A.; Castro, A.; et al. Feeding a slowly digestible carbohydrate diet during pregnancy of insulin-resistant rats prevents the excess of adipogenesis in their offspring. J. Nutr. Biochem. 2018, 61, 183–196. [Google Scholar] [CrossRef]
- Zhu, Y.; Olsen, S.F.; Mendola, P.; Halldorsson, T.I.; Yeung, E.H.; Granström, C.; Bjerregaard, A.A.; Wu, J.; Rawal, S.; Chavarro, J.E.; et al. Maternal dietary intakes of refined grains during pregnancy and growth through the first 7 y of life among children born to women with gestational diabetes. Am. J. Clin. Nutr. 2017, 106, 96–104. [Google Scholar] [CrossRef] [PubMed]
- Fernández-Barrés, S.; Romaguera, D.; Valvi, D.; Martínez, D.; Vioque, J.; Navarrete-Muñoz, E.M.; Amiano, P.; Gonzalez-Palacios, S.; Guxens, M.; Pereda, E.; et al. Mediterranean dietary pattern in pregnant women and offspring risk of overweight and abdominal obesity in early childhood: The INMA birth cohort study. Pediatr. Obes. 2016, 11, 491–499. [Google Scholar] [CrossRef] [PubMed]
- He, J.; Yuan, M.; Chen, N.; Lu, J.; Hu, C.; Mai, W.; Zhang, R.; Pan, Y.; Qiu, L.; Wu, Y.; et al. Maternal dietary patterns and gestational diabetes mellitus: A large prospective cohort study in China. Br. J. Nutr. 2015, 113, 1292–1330. [Google Scholar] [CrossRef]
- Mark, K.L.J.; Pham, N.M.; Lee, A.H.; Tang, L.; Pan, X.; Binns, C.W.; Sun, X. Dietary patterns during pregnancy and risk of gestational diabetes: A prospective cohort study in Western China. Nutr. J. 2018, 17, 107. [Google Scholar]
- Guo, Q.; Zhao, L.; He, Y.; Fang, Y.; Fang, H.; Xu, X.; Jia, F.; Yu, D. Survey on dietary nutrients intake of Chinese residents between 2010 and 2012. Zhonghua Yu Fang Yi Xue Za Zhi 2017, 51, 519–522. [Google Scholar]
- Cucó, G.; Fernández-Ballart, J.; Sala, J.; Viladrich, C.; Iranzo, R.; Vila, J.; Arija, V. Dietary patterns and associated lifestyles in preconception, pregnancy and postpartum. Eur. J. Clin. Nutr. 2006, 60, 364–371. [Google Scholar] [CrossRef]

| Characteristics | Mean ± SD or n (%) |
|---|---|
| Mothers | |
| Age at enrollment (Years) | |
| <25 | 53 (5.7) |
| 25–29 | 399 (42.6) |
| 30–34 | 344 (36.7) |
| ≥35 | 141 (15.1) |
| Ethnicity | |
| Han | 787 (84.0) |
| Others | 150 (16.0) |
| Educational attainment | |
| Middle school or below | 76 (8.1) |
| High school | 146 (15.6) |
| College | 628 (67.0) |
| Graduate or above | 87 (9.3) |
| Household income per year, CNY | |
| <30,000 | 247 (26.4) |
| 30,000 to <50,000 | 256 (27.3) |
| 50,000 to <70,000 | 210 (22.4) |
| ≥70,000 | 224 (23.9) |
| Parity | |
| Primiparous | 739 (78.9) |
| Multiparous | 198 (21.1) |
| Smoking status | |
| Yes | 4 (0.4) |
| No | 933 (99.6) |
| Prepregnancy BMI category | |
| <18.5, kg/m2 | 123 (13.1) |
| 18.5 to <24.0, kg/m2 | 566 (60.4) |
| 24.0 to <28.0, kg/m2 | 186 (19.9) |
| ≥28.0, kg/m2 | 62 (6.6) |
| Physical Activity | |
| <100 MET-hour/week | 230 (24.6) |
| 100 to <200 MET-hour/week | 527 (56.2) |
| ≥200 MET-hour/week | 180 (19.2) |
| Calorie intake | |
| <2100 kcal/d | 576 (61.5) |
| ≥2100 kcal/d | 361 (38.5) |
| Fathers | |
| BMI at enrollment (n = 903) | |
| <18.5, kg/m2 | 22 (2.4) |
| 18.5 to <24.0, kg/m2 | 344 (38.1) |
| 24.0 to <28.0, kg/m2 | 341 (37.8) |
| ≥28.0, kg/m2 | 196 (21.7) |
| Infants | |
| Sex | |
| Male | 447 (47.7) |
| Female | 490 (52.3) |
| BMIZ at birth, SD units (n = 698) | −0.36 ± 1.14 |
| BMIZ at 1-month visit, SD units (n = 781) | 0.02 ± 0.95 |
| BMIZ at 3-month visit, SD units (n = 772) | 0.30 ± 1.04 |
| BMIZ at 6-month visit, SD units (n = 724) | 0.35 ± 1.05 |
| BMIZ at 8-month visit, SD units (n = 817) | 0.35 ± 0.99 |
| BMIZ at 12-month visit, SD units (n = 819) | 0.53 ± 0.95 |
| Dietary Patterns | Food | Factor Loading Coefficient | Variance Explained (%) |
|---|---|---|---|
| Food Frequency Questionnaire | |||
| Fish–seafood pattern (FFQ) | 13.12 | ||
| Marine fish | 0.83 | ||
| Shrimps, crabs and mussels | 0.79 | ||
| Freshwater fish | 0.77 | ||
| Seaweed | 0.62 | ||
| Haslet | 0.54 | ||
| Protein-rich pattern (FFQ) | 10.32 | ||
| Dairy products | 0.73 | ||
| Milk | 0.73 | ||
| Eggs and products | 0.64 | ||
| Beans and products | 0.54 | ||
| Nuts | 0.45 | ||
| Vegetable–fruit–rice pattern (FFQ) | 8.83 | ||
| Vegetables | 0.83 | ||
| Fruits | 0.81 | ||
| Rice | 0.57 | ||
| Three-Day Food Dairies | |||
| Traditional pattern (TFD) | 7.83 | ||
| Tubers | 0.73 | ||
| Vegetables | 0.57 | ||
| Fruits | 0.53 | ||
| Red meat | 0.41 | ||
| Rice | 0.40 | ||
| Sweet foods pattern (TFD) | 6.30 | ||
| Pastry and candy | 0.67 | ||
| Sweet Beverages | 0.66 | ||
| Shrimps, crabs and mussels | 0.42 | ||
| Fried food–bean–dairy pattern (TFD) | 6.12 | ||
| Fried foods | 0.75 | ||
| Beans and products | 0.66 | ||
| Dairy products | 0.36 | ||
| Whole grain–seafood pattern (TFD) | 6.06 | ||
| Coarse grains | 0.67 | ||
| Shrimps, crabs and mussels | 0.34 | ||
| Eggs | −0.35 | ||
| Rice | −0.48 |
| Characteristics | Dietary Pattern Scores, Mean (SD) | ||||||
|---|---|---|---|---|---|---|---|
| Food Frequency Questionnaire | Three-Day Food Dairies | ||||||
| Fish–Seafood Pattern (FFQ) | Protein-Rich Pattern (FFQ) | Vegetable–Fruit–Rice Pattern (FFQ) | Traditional Pattern (TFD) | Sweet Foods Pattern (TFD) | Fried Food–Bean–Dairy Pattern (TFD) | Whole Grain–Seafood Pattern (TFD) | |
| Maternal | |||||||
| Age at enrollment (Years) | |||||||
| <25 | −0.56 (1.83) | −0.56 (2.31) | −0.37 (1.73) | 0.46 (1.63) | 0.23 (1.67) | 0.16 (1.91) | −0.27 (1.21) |
| 25–29 | 0.18 (3.43) | 0.30 (2.63) | 0.15 (2.06) | 0.11 (1.76) | 0.05 (1.40) | 0.04 (1.31) | −0.11 (1.14) |
| 30–34 | −0.10 (2.58) | −0.17 (2.17) | −0.12 (2.04) | −0.10 (1.61) | −0.04 (1.16) | 0.09 (1.27) | 0.11 (1.46) |
| ≥35 | 0.03 (2.79) | −0.20 (2.33) | 0.08 (2.02) | −0.12 (1.79) | −0.11 (1.49) | −0.21 (1.18) | 0.13 (1.34) |
| p | 0.297 | 0.009 | 0.136 | 0.066 | 0.358 | 0.115 | 0.030 |
| Ethnicity | |||||||
| Han | 0.05 (2.97) | −0.19 (2.37) | −0.01 (2.01) | 0.00 (1.70) | 0.01 (1.34) | 0.04 (1.34) | 0.02 (1.29) |
| Others | −0.19 (2.96) | 0.11 (2.65) | 0.12 (2.13) | 0.10 (1.74) | −0.01 (1.39) | −0.02 (1.21) | −0.11 (1.39) |
| p | 0.354 | 0.553 | 0.480 | 0.488 | 0.917 | 0.624 | 0.264 |
| Educational attainment | |||||||
| Middle school or below | −0.60 (2.47) | −0.89 (2.32) | −0.18 (2.19) | 0.29 (1.66) | −0.26 (1.02) | −0.10 (1.27) | −0.27 (1.01) |
| High school | −0.17 (2.77) | 0.01 (2.46) | −0.10 (2.15) | 0.17 (1.76) | −0.12 (1.19) | −0.09 (1.19) | 0.00 (1.16) |
| College | 0.10 (3.08) | 0.04 (2.49) | 0.03 (2.01) | 0.00 (1.71) | 0.07 (1.35) | 0.08 (1.37) | −0.05 (1.30) |
| Graduate or above | 0.23 (2.87) | 0.48 (1.86) | 0.20 (1.86) | −0.33 (1.56) | −0.01 (1.77) | −0.02 (1.20) | 0.55 (1.62) |
| p | 0.191 | 0.003 | 0.585 | 0.081 | 0.132 | 0.390 | <0.001 |
| Household income per year, CNY | |||||||
| <30,000 | −0.14 (2.65) | −0.13 (2.51) | −0.22 (1.97) | 0.07 (1.78) | −0.16 (1.14) | −0.11 (1.12) | −0.10 (1.17) |
| 30,000 to <50,000 | −0.21 (2.27) | −0.16 (2.08) | −0.02 (1.96) | 0.12 (1.70) | −0.04 (1.10) | 0.11 (1.44) | −0.09 (1.20) |
| 50,000 to <70,000 | 0.04 (2.82) | 0.05 (2.64) | −0.05 (2.02) | 0.00 (1.60) | 0.12 (1.62) | 0.06 (1.38) | −0.19 (1.31) |
| ≥70,000 | 0.42 (3.96) | 0.29 (2.43) | 0.24 (2.18) | −0.14 (1.73) | 0.12 (1.62) | 0.07 (1.33) | 0.21 (1.52) |
| p | 0.096 | 0.166 | 0.018 | 0.387 | 0.067 | 0.254 | 0.042 |
| Parity | |||||||
| primiparous | 0.07 (3.07) | 0.13 (2.50) | 0.00 (2.01) | 0.01 (1.70) | 0.03 (1.40) | 0.05 (1.33) | 0.02 (1.32) |
| multiparous | −0.20 (2.59) | −0.49 (2.08) | 0.06 (2.10) | 0.03 (1.73) | −0.11 (1.11) | −0.07 (1.27) | −0.06 (1.23) |
| p | 0.259 | 0.001 | 0.694 | 0.920 | 0.184 | 0.249 | 0.488 |
| Smoking status | |||||||
| No | −1.96 (0.71) | −0.70 (2.30) | −0.54 (1.89) | −0.96 (1.99) | 0.65 (2.22) | 0.14 (0.88) | −0.24 (0.83) |
| Yes | 0.02 (2.98) | 0.00 (2.42) | 0.01 (2.03) | 0.02 (1.70) | 0.00 (1.35) | 0.03 (1.32) | 0.00 (1.31) |
| p | 0.184 | 0.560 | 0.585 | 0.252 | 0.338 | 0.864 | 0.718 |
| Prepregnancy BMI category | |||||||
| <18.5, kg/m2 | 0.12 (4.29) | 0.15 (2.76) | 0.36 (1.91) | −0.07 (1.75) | 0.00 (1.25) | 0.03 (1.35) | −0.20 (1.11) |
| 18.5 to <24.0, kg/m2 | 0.03 (2.67) | 0.06 (2.38) | 0.11 (2.08) | 0.07 (1.70) | −0.03 (1.24) | 0.01 (1.34) | −0.02 (1.29) |
| 24.0 to <28.0, kg/m2 | 0.00 (2.86) | −0.22 (2.29) | −0.33 (1.95) | −0.16 (1.46) | 0.13 (1.67) | 0.08 (1.27) | 0.15 (1.40) |
| ≥28.0, kg/m2 | −0.32 (2.73) | −0.20 (2.42) | −0.55 (1.78) | 0.20 (2.28) | −0.05 (1.45) | 0.02 (1.27) | 0.04 (1.48) |
| p | 0.818 | 0.408 | 0.002 | 0.313 | 0.578 | 0.956 | 0.131 |
| Physical Activity | |||||||
| <100 MET-hour/week | 0.02 (3.10) | −0.18 (2.15) | −0.24 (2.09) | −0.01 (1.68) | 0.10 (1.71) | 0.04 (1.49) | 0.00 (1.45) |
| 100 to <200 MET-hour/week | −0.02 (3.08) | 0.02 (2.41) | 0.01 (1.92) | 0.06 (1.69) | −0.02 (1.20) | 0.06 (1.26) | −0.01 (1.25) |
| ≥200 MET-hour/week | 0.10 (2.45) | 0.18 (2.75) | 0.36 (2.24) | −0.07 (1.78) | −0.03 (1.24) | −0.07 (1.27) | 0.03(1.26) |
| p | 0.904 | 0.312 | 0.012 | 0.679 | 0.493 | 0.532 | 0.942 |
| Calorie intake | |||||||
| <2100 kcal/d | 0.00 (2.74) | 0.06 (2.49) | 0.00 (2.06) | −0.69 (1.21) | −0.17 (1.13) | −0.21 (1.14) | −0.14 (1.06) |
| ≥2100 kcal/d | 0.04 (3.31) | −0.09 (2.30) | 0.03 (1.99) | 1.13 (1.78) | 0.28 (1.60) | 0.41 (1.49) | 0.22 (1.59) |
| p | 0.860 | 0.381 | 0.792 | <0.001 | <0.001 | <0.001 | <0.001 |
| Paternal | |||||||
| BMI category at enrollment | |||||||
| <18.5, kg/m2 | −0.49 (1.79) | −0.34 (2.37) | 0.29 (2.01) | −0.40 (1.53) | 0.43 (1.77) | −0.07(1.10) | −0.11 (0.97) |
| 18.5 to <24.0, kg/m2 | 0.12 (3.53) | 0.11 (2.38) | 0.17 (1.93) | −0.06 (1.67) | 0.04 (1.37) | 0.06 (1.34) | 0.06 (1.26) |
| 24.0 to <28.0, kg/m2 | −0.09 (2.51) | 0.01 (2.50) | −0.07 (2.01) | 0.07 (1.77) | 0.01 (1.39) | −0.02 (1.34) | 0.05 (1.41) |
| ≥28.0, kg/m2 | 0.03 (2.73) | −0.25 (2.23) | −0.15 (2.16) | 0.15 (1.69) | −0.11 (1.21) | 0.10 (1.31) | −0.14 (1.20) |
| p | 0.684 | 0.346 | 0.231 | 0.320 | 0.293 | 0.699 | 0.335 |
| Child | |||||||
| Sex | |||||||
| Male | 0.05 (3.03) | −0.05 (2.46) | 0.01 (2.13) | −0.01 (1.77) | −0.07 (1.26) | −0.06 (1.24) | −0.09 (1.18) |
| Female | −0.02 (2.92) | 0.05 (2.38) | 0.01 (1.94) | 0.04 (1.65) | 0.07 (1.42) | 0.11 (1.39) | 0.07 (1.41) |
| p | 0.710 | 0.545 | 0.976 | 0.624 | 0.098 | 0.064 | 0.064 |
| Maternal Dietary Patterns | Mean Difference in Predicted BMIZ, SD Units | |||||||||||
|---|---|---|---|---|---|---|---|---|---|---|---|---|
| n | Birth | 3 Months | 6 Months | 8 Months | 12 Months | |||||||
| β | 95% CI | β | 95% CI | β | 95% CI | β | 95% CI | β | 95% CI | |||
| Food Frequency Questionnaire | ||||||||||||
| Fish–seafood pattern (FFQ) | ||||||||||||
| Q1 | 234 | ref | ref | ref | ref | ref | ref | ref | ref | ref | ref | |
| Q2 | 231 | 0.02 | (−0.16, 0.19) | 0.01 | (−0.14, 0.16) | 0.00 | (−0.14, 0.15) | 0.00 | (−0.17, 0.16) | −0.01 | (−0.22, 0.19) | |
| Q3 | 235 | 0.10 | (−0.09, 0.28) | 0.06 | (−0.09, 0.22) | 0.03 | (−0.12, 0.18) | 0.00 | (−0.18, 0.17) | −0.04 | (−0.25, 0.18) | |
| Q4 | 237 | 0.12 | (−0.08, 0.31) | 0.08 | (−0.09, 0.25) | 0.04 | (−0.12, 0.20) | 0.00 | (−0.19, 0.19) | −0.04 | (−0.27, 0.19) | |
| Protein-rich pattern (FFQ) | ||||||||||||
| Q1 | 237 | ref | ref | ref | ref | ref | ref | ref | ref | ref | ref | |
| Q2 | 231 | −0.20 | (−0.37, −0.02) | −0.17 | (−0.32, −0.03) | −0.15 | (−0.30, −0.01) | −0.13 | (−0.30, 0.03) | −0.11 | (−0.31, 0.09) | |
| Q3 | 235 | −0.17 | (−0.35, 0.02) | −0.15 | (−0.31, 0.01) | −0.13 | (−0.29, 0.02) | −0.11 | (−0.29, 0.06) | −0.10 | (−0.31, 0.12) | |
| Q4 | 234 | −0.16 | (−0.36, 0.04) | −0.16 | (−0.33, 0.01) | −0.16 | (−0.33, 0.00) | −0.17 | (−0.35, 0.02) | −0.17 | (−0.40, 0.06) | |
| Vegetable–fruit–rice pattern (FFQ) | ||||||||||||
| Q1 | 229 | ref | ref | ref | ref | ref | ref | ref | ref | ref | ref | |
| Q2 | 236 | 0.13 | (−0.03, 0.30) | 0.10 | (−0.05, 0.24) | 0.06 | (−0.08, 0.20) | 0.02 | (−0.14, 0.18) | −0.02 | (−0.21, 0.18) | |
| Q3 | 236 | 0.18 | (0.01, 0.35) | 0.17 | (0.03, 0.31) | 0.16 | (0.02, 0.30) | 0.15 | (−0.01, 0.30) | 0.13 | (−0.06, 0.33) | |
| Q4 | 236 | 0.15 | (−0.03, 0.32) | 0.11 | (−0.03, 0.26) | 0.08 | (−0.07, 0.22) | 0.04 | (−0.12, 0.21) | 0.01 | (−0.19, 0.20) | |
| Three-day food dairies | ||||||||||||
| Traditional pattern (TFD) | ||||||||||||
| Q1 | 233 | ref | ref | ref | ref | ref | ref | ref | ref | ref | ref | |
| Q2 | 236 | 0.09 | (−0.08, 0.26) | 0.07 | (−0.07, 0.21) | 0.06 | (−0.08, 0.20) | 0.04 | (−0.12, 0.20) | 0.03 | (−0.17, 0.22) | |
| Q3 | 231 | 0.15 | (−0.03, 0.32) | 0.13 | (−0.03, 0.28) | 0.10 | (−0.05, 0.25) | 0.08 | (−0.09, 0.25) | 0.06 | (−0.14, 0.26) | |
| Q4 | 237 | 0.12 | (−0.08, 0.32) | 0.08 | (−0.10, 0.25) | 0.03 | (−0.14, 0.20) | −0.01 | (−0.20, 0.18) | −0.05 | (−0.27, 0.16) | |
| Sweet foods pattern (TFD) | ||||||||||||
| Q1 | 232 | ref | ref | ref | ref | ref | ref | ref | ref | ref | ref | |
| Q2 | 238 | 0.08 | (−0.08, 0.25) | 0.08 | (−0.05, 0.22) | 0.09 | (−0.05, 0.22) | 0.09 | (−0.07, 0.24) | 0.09 | (−0.10, 0.28) | |
| Q3 | 230 | 0.08 | (−0.09, 0.25) | 0.05 | (−0.09, 0.19) | 0.02 | (−0.12, 0.16) | −0.01 | (−0.17, 0.15) | −0.04 | (−0.23, 0.16) | |
| Q4 | 237 | 0.03 | (−0.14, 0.21) | 0.05 | (−0.09, 0.19) | 0.06 | (−0.08, 0.20) | 0.08 | (−0.08, 0.24) | 0.09 | (−0.10, 0.29) | |
| Fried food–bean–dairy pattern (TFD) | ||||||||||||
| Q1 | 231 | ref | ref | ref | ref | ref | ref | ref | ref | ref | ref | |
| Q2 | 230 | −0.09 | (−0.26, 0.08) | −0.10 | (−0.25, 0.04) | −0.12 | (−0.25, 0.02) | −0.13 | (−0.29, 0.03) | −0.14 | (−0.34, 0.05) | |
| Q3 | 233 | −0.16 | (−0.33, 0.01) | −0.17 | (−0.31, −0.02) | −0.18 | (−0.32, −0.04) | −0.19 | (−0.35, −0.03) | −0.19 | (−0.39, 0.00) | |
| Q4 | 243 | −0.16 | (−0.33, 0.01) | −0.18 | (−0.33, −0.03) | −0.20 | (−0.34, −0.05) | −0.22 | (−0.38, −0.05) | −0.24 | (−0.44, −0.04) | |
| Whole grain–seafood pattern (TFD) | ||||||||||||
| Q1 | 235 | ref | ref | ref | ref | ref | ref | ref | ref | ref | ref | |
| Q2 | 237 | −0.15 | (−0.32, 0.02) | −0.14 | (−0.28, 0.00) | −0.14 | (−0.27, 0.00) | −0.13 | (−0.29, 0.02) | −0.13 | (−0.32, 0.06) | |
| Q3 | 231 | −0.09 | (−0.26, 0.08) | −0.07 | (−0.21, 0.07) | −0.05 | (−0.19, 0.09) | −0.04 | (−0.20, 0.12) | −0.02 | (−0.22, 0.18) | |
| Q4 | 234 | 0.01 | (−0.16, 0.18) | 0.03 | (−0.11, 0.18) | 0.06 | (−0.08, 0.20) | 0.09 | (−0.07, 0.25) | 0.12 | (−0.07, 0.32) | |
| Maternal Dietary Patterns during Pregnancy | Risk of Being Overweight/Obesity across Infancy (ref. = Non Overweight/Obesity, n = 937) | ||||||||
|---|---|---|---|---|---|---|---|---|---|
| Q1 | Reference | Q2 | OR | Q3 | OR | Q4 | OR | p for Trend | |
| (95% CI) | (95% CI) | (95% CI) | |||||||
| Food Frequency Questionnaire | |||||||||
| Fish–seafood pattern (FFQ) | |||||||||
| Model 1 | 1.00 | 0.82 (0.49, 1.36) | 0.98 (0.58, 1.66) | 0.67 (0.40, 1.12) | 0.177 | ||||
| Model 2 | 1.00 | 1.01 (0.58, 1.74) | 1.22 (0.70, 2.12) | 0.89 (0.48, 1.63) | 0.623 | ||||
| Model 3 | 1.00 | 0.75 (0.45, 1.26) | 0.93 (0.54, 1.60) | 0.62 (0.36, 1.08) | 0.147 | ||||
| Model 4 | 1.00 | 0.90 (0.52, 1.55) | 1.12 (0.65, 1.92) | 0.88 (0.41, 1.46) | 0.435 | ||||
| Protein-rich pattern (FFQ) | |||||||||
| Model 1 | 1.00 | 0.65 (0.39, 1.08) | 0.49 (0.29, 0.81) | 0.71 (0.42, 1.20) | 0.169 | ||||
| Model 2 | 1.00 | 0.62 (0.36, 1.06) | 0.47 (0.26, 0.84) | 0.71 (0.39, 1.31) | 0.296 | ||||
| Model 3 | 1.00 | 0.66 (0.39, 1.13) | 0.50 (0.29, 0.87) | 0.75 (0.43, 1.30) | 0.273 | ||||
| Model 4 | 1.00 | 0.65 (0.38, 1.12) | 0.50 (0.27, 0.93) | 0.79 (0.43, 1.47) | 0.458 | ||||
| Vegetable–fruit–rice pattern (FFQ) | |||||||||
| Model 1 | 1.00 | 1.29 (0.73, 2.29) | 1.62 (0.97, 2.70) | 1.13 (0.65, 1.96) | 0.515 | ||||
| Model 2 | 1.00 | 1.36 (0.76, 2.41) | 1.70 (1.01, 2.87) | 1.22 (0.69, 2.17) | 0.468 | ||||
| Model 3 | 1.00 | 1.29 (0.70, 2.34) | 1.73 (1.00, 2.98) | 1.38 (0.77, 2.48) | 0.166 | ||||
| Model 4 | 1.00 | 1.35 (0.74, 2.45) | 1.79 (1.03, 3.12) | 1.48 (0.81, 2.71) | 0.166 | ||||
| Three-day food dairies | |||||||||
| Traditional pattern (TFD) | |||||||||
| Model 1 | 1.00 | 0.77 (0.43, 1.37) | 1.11 (0.67, 1.84) | 0.82 (0.48, 1.39) | 0.685 | ||||
| Model 2 | 1.00 | 0.77 (0.43, 1.37) | 1.05 (0.62, 1.79) | 0.78 (0.45, 1.36) | 0.633 | ||||
| Model 3 | 1.00 | 0.77 (0.42, 1.42) | 1.18 (0.70, 1.99) | 0.84 (0.44, 1.60) | 0.834 | ||||
| Model 4 | 1.00 | 0.76 (0.42, 1.40) | 1.07 (0.62, 1.86) | 0.74 (0.38, 1.45) | 0.552 | ||||
| Sweet foods pattern (TFD) | |||||||||
| Model 1 | 1.00 | 1.57 (0.89, 2.76) | 1.13 (0.61, 2.08) | 1.33 (0.74, 2.39) | 0.671 | ||||
| Model 2 | 1.00 | 1.69 (0.97, 2.95) | 1.28 (0.69, 2.36) | 1.47 (0.83, 2.61) | 0.683 | ||||
| Model 3 | 1.00 | 1.46 (0.83, 2.58) | 1.02 (0.53, 1.93) | 1.42 (0.76, 2.63) | 0.454 | ||||
| Model 4 | 1.00 | 1.56 (0.89, 2.75) | 1.12 (0.59, 2.16) | 1.51 (0.83, 2.76) | 0.663 | ||||
| Fried food–bean–dairy pattern (TFD) | |||||||||
| Model 1 | 1.00 | 0.63 (0.37, 1.05) | 0.58 (0.34, 0.99) | 0.66 (0.39, 1.11) | 0.279 | ||||
| Model 2 | 1.00 | 0.62 (0.38, 1.02) | 0.56 (0.33, 0.94) | 0.63 (0.37, 1.07) | 0.277 | ||||
| Model 3 | 1.00 | 0.70 (0.42, 1.16) | 0.58 (0.33, 1.00) | 0.65 (0.36, 1.17) | 0.401 | ||||
| Model 4 | 1.00 | 0.68 (0.41, 1.12) | 0.54 (0.31, 0.95) | 0.63 (0.35, 1.14) | 0.392 | ||||
| Whole grain–seafood pattern (TFD) | |||||||||
| Model 1 | 1.00 | 0.71 (0.41, 1.23) | 0.79 (0.47, 1.35) | 0.84 (0.50, 1.43) | 0.660 | ||||
| Model 2 | 1.00 | 0.72 (0.40, 1.27) | 0.82 (0.48, 1.38) | 0.94 (0.55, 1.61) | 0.651 | ||||
| Model 3 | 1.00 | 0.70 (0.39, 1.24) | 0.72 (0.42, 1.23) | 0.86 (0.50, 1.49) | 0.659 | ||||
| Model 4 | 1.00 | 0.74 (0.40, 1.34) | 0.74 (0.43, 1.28) | 0.93 (0.54, 1.60) | 0.501 | ||||
Publisher’s Note: MDPI stays neutral with regard to jurisdictional claims in published maps and institutional affiliations. |
© 2021 by the authors. Licensee MDPI, Basel, Switzerland. This article is an open access article distributed under the terms and conditions of the Creative Commons Attribution (CC BY) license (https://creativecommons.org/licenses/by/4.0/).
Share and Cite
Hu, J.; Aris, I.M.; Lin, P.-I.D.; Wan, N.; Liu, Y.; Wang, Y.; Wen, D. Association of Maternal Dietary Patterns during Pregnancy and Offspring Weight Status across Infancy: Results from a Prospective Birth Cohort in China. Nutrients 2021, 13, 2040. https://doi.org/10.3390/nu13062040
Hu J, Aris IM, Lin P-ID, Wan N, Liu Y, Wang Y, Wen D. Association of Maternal Dietary Patterns during Pregnancy and Offspring Weight Status across Infancy: Results from a Prospective Birth Cohort in China. Nutrients. 2021; 13(6):2040. https://doi.org/10.3390/nu13062040
Chicago/Turabian StyleHu, Jiajin, Izzuddin M. Aris, Pi-I D. Lin, Ningyu Wan, Yilin Liu, Yinuo Wang, and Deliang Wen. 2021. "Association of Maternal Dietary Patterns during Pregnancy and Offspring Weight Status across Infancy: Results from a Prospective Birth Cohort in China" Nutrients 13, no. 6: 2040. https://doi.org/10.3390/nu13062040
APA StyleHu, J., Aris, I. M., Lin, P.-I. D., Wan, N., Liu, Y., Wang, Y., & Wen, D. (2021). Association of Maternal Dietary Patterns during Pregnancy and Offspring Weight Status across Infancy: Results from a Prospective Birth Cohort in China. Nutrients, 13(6), 2040. https://doi.org/10.3390/nu13062040