
Internet Access and Nutritional Intake: Evidence from Rural China


Abstract
1. Introduction
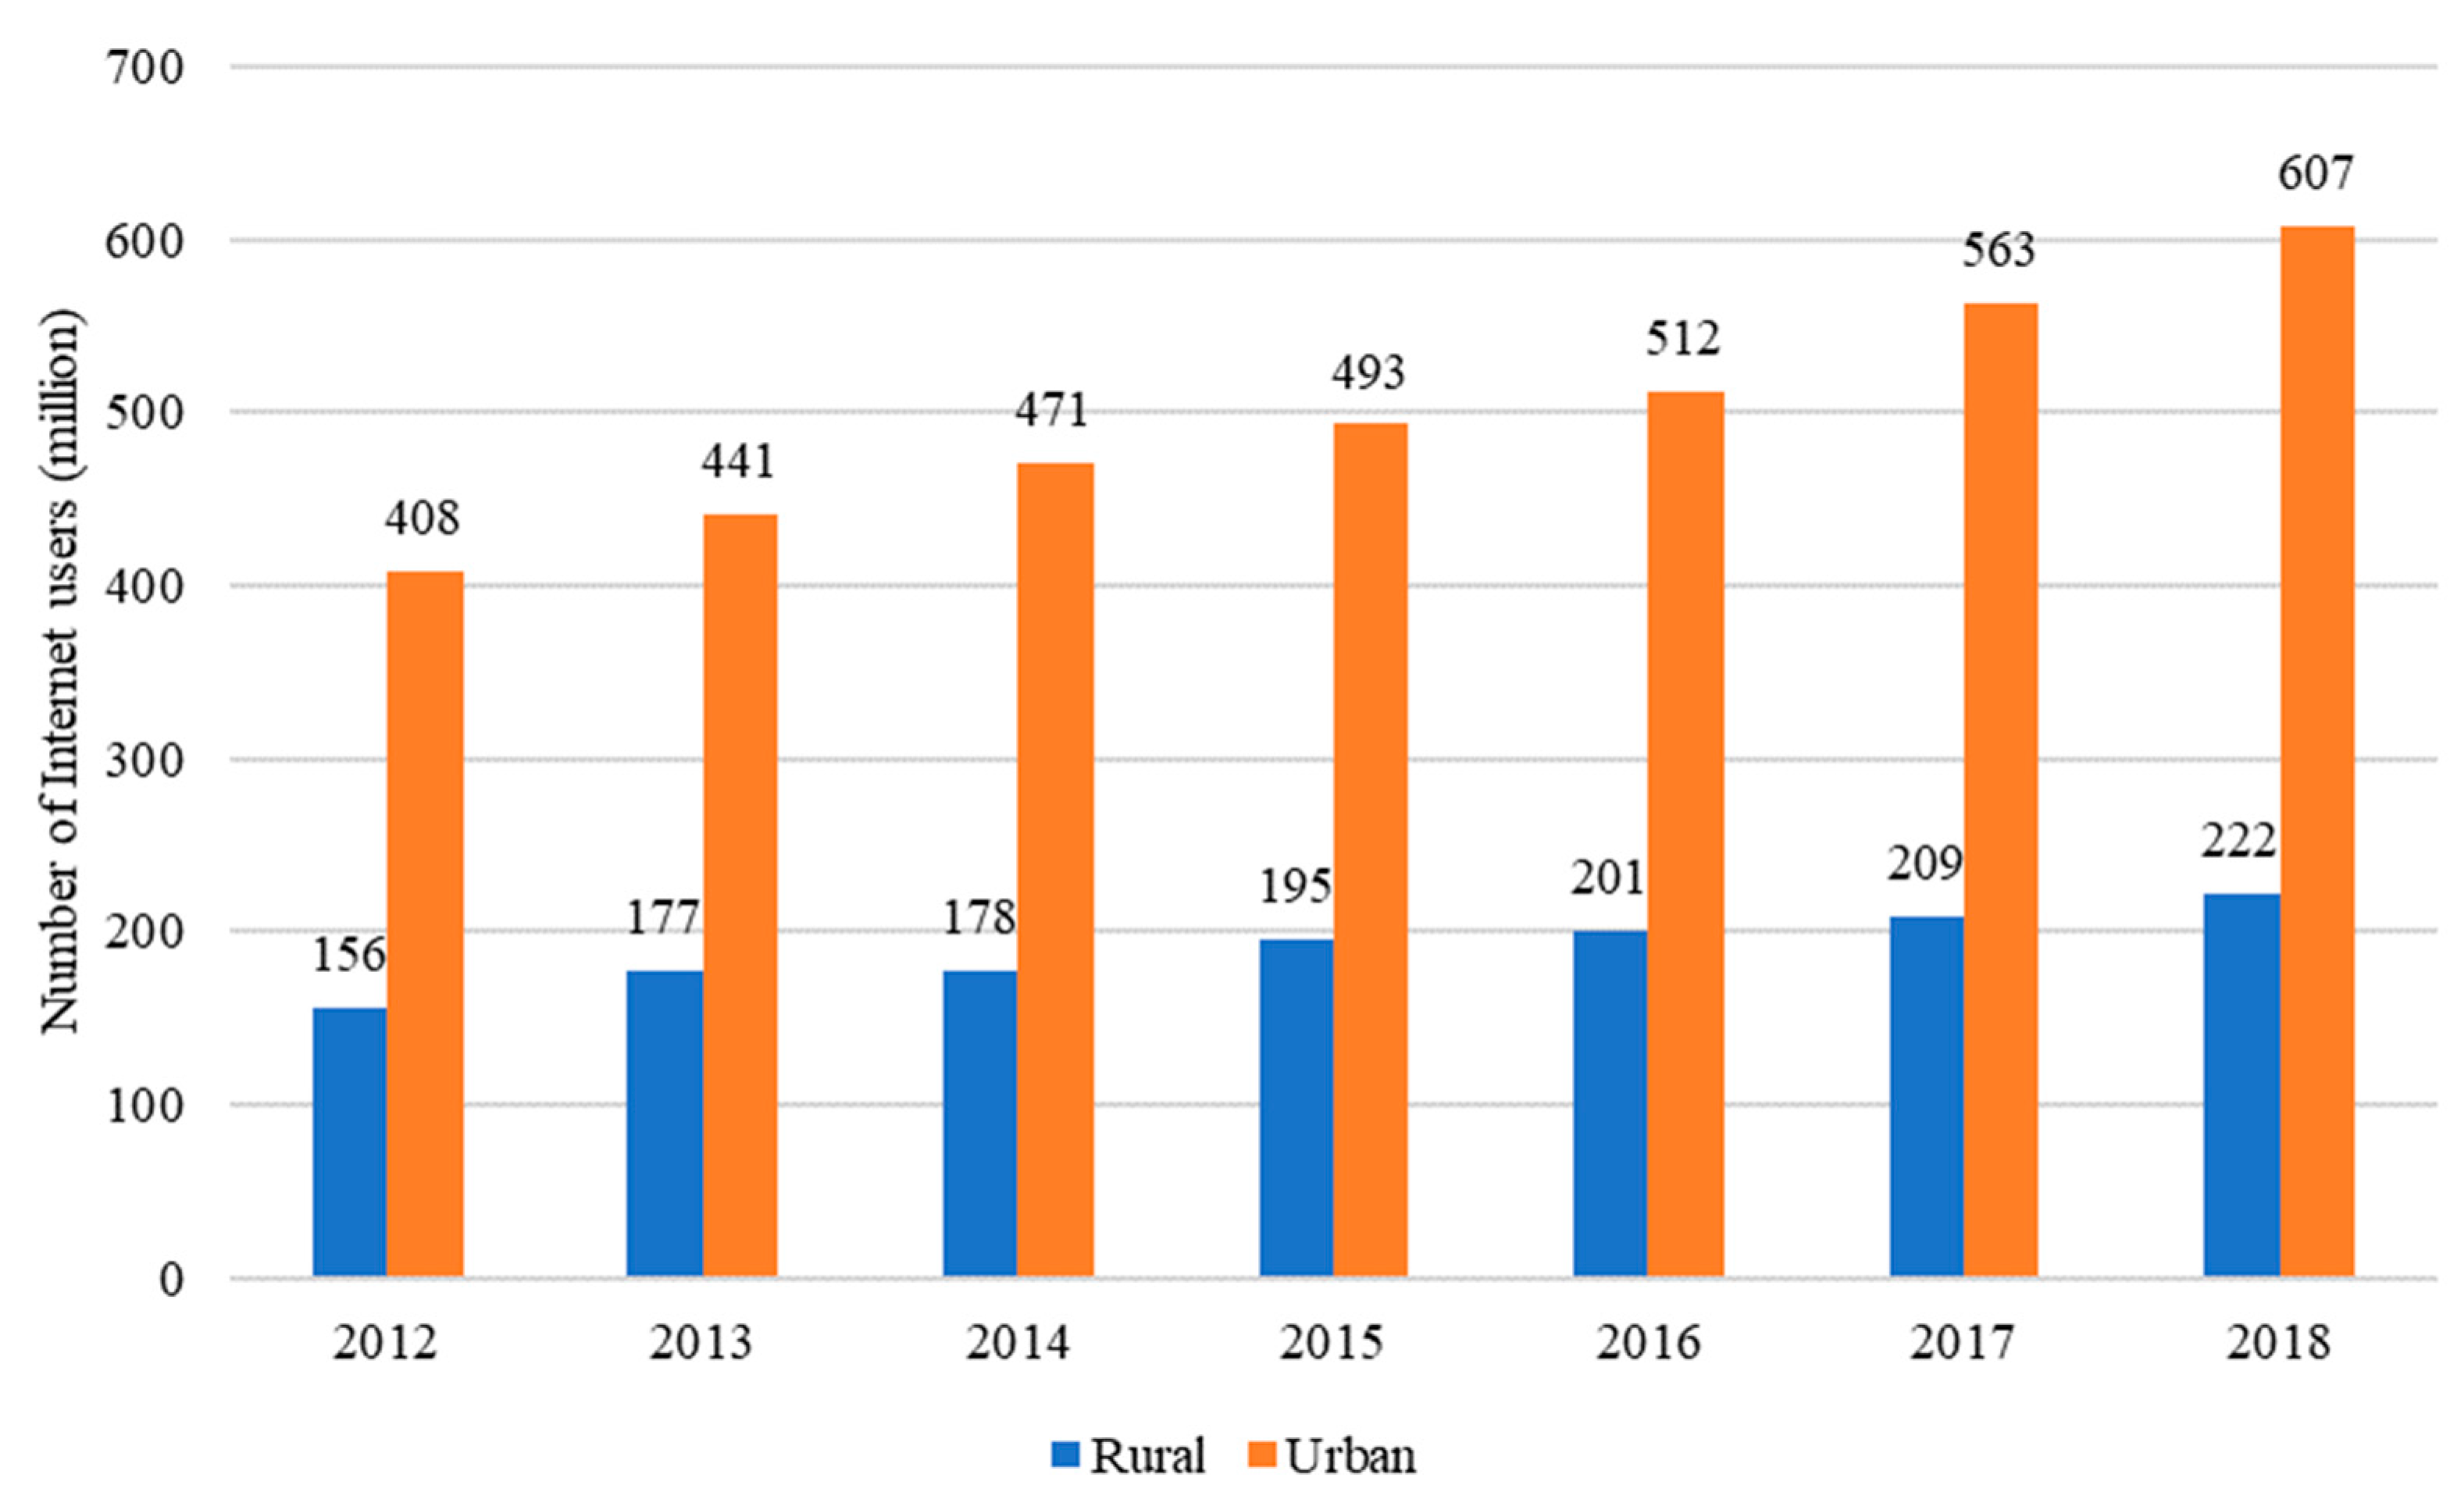
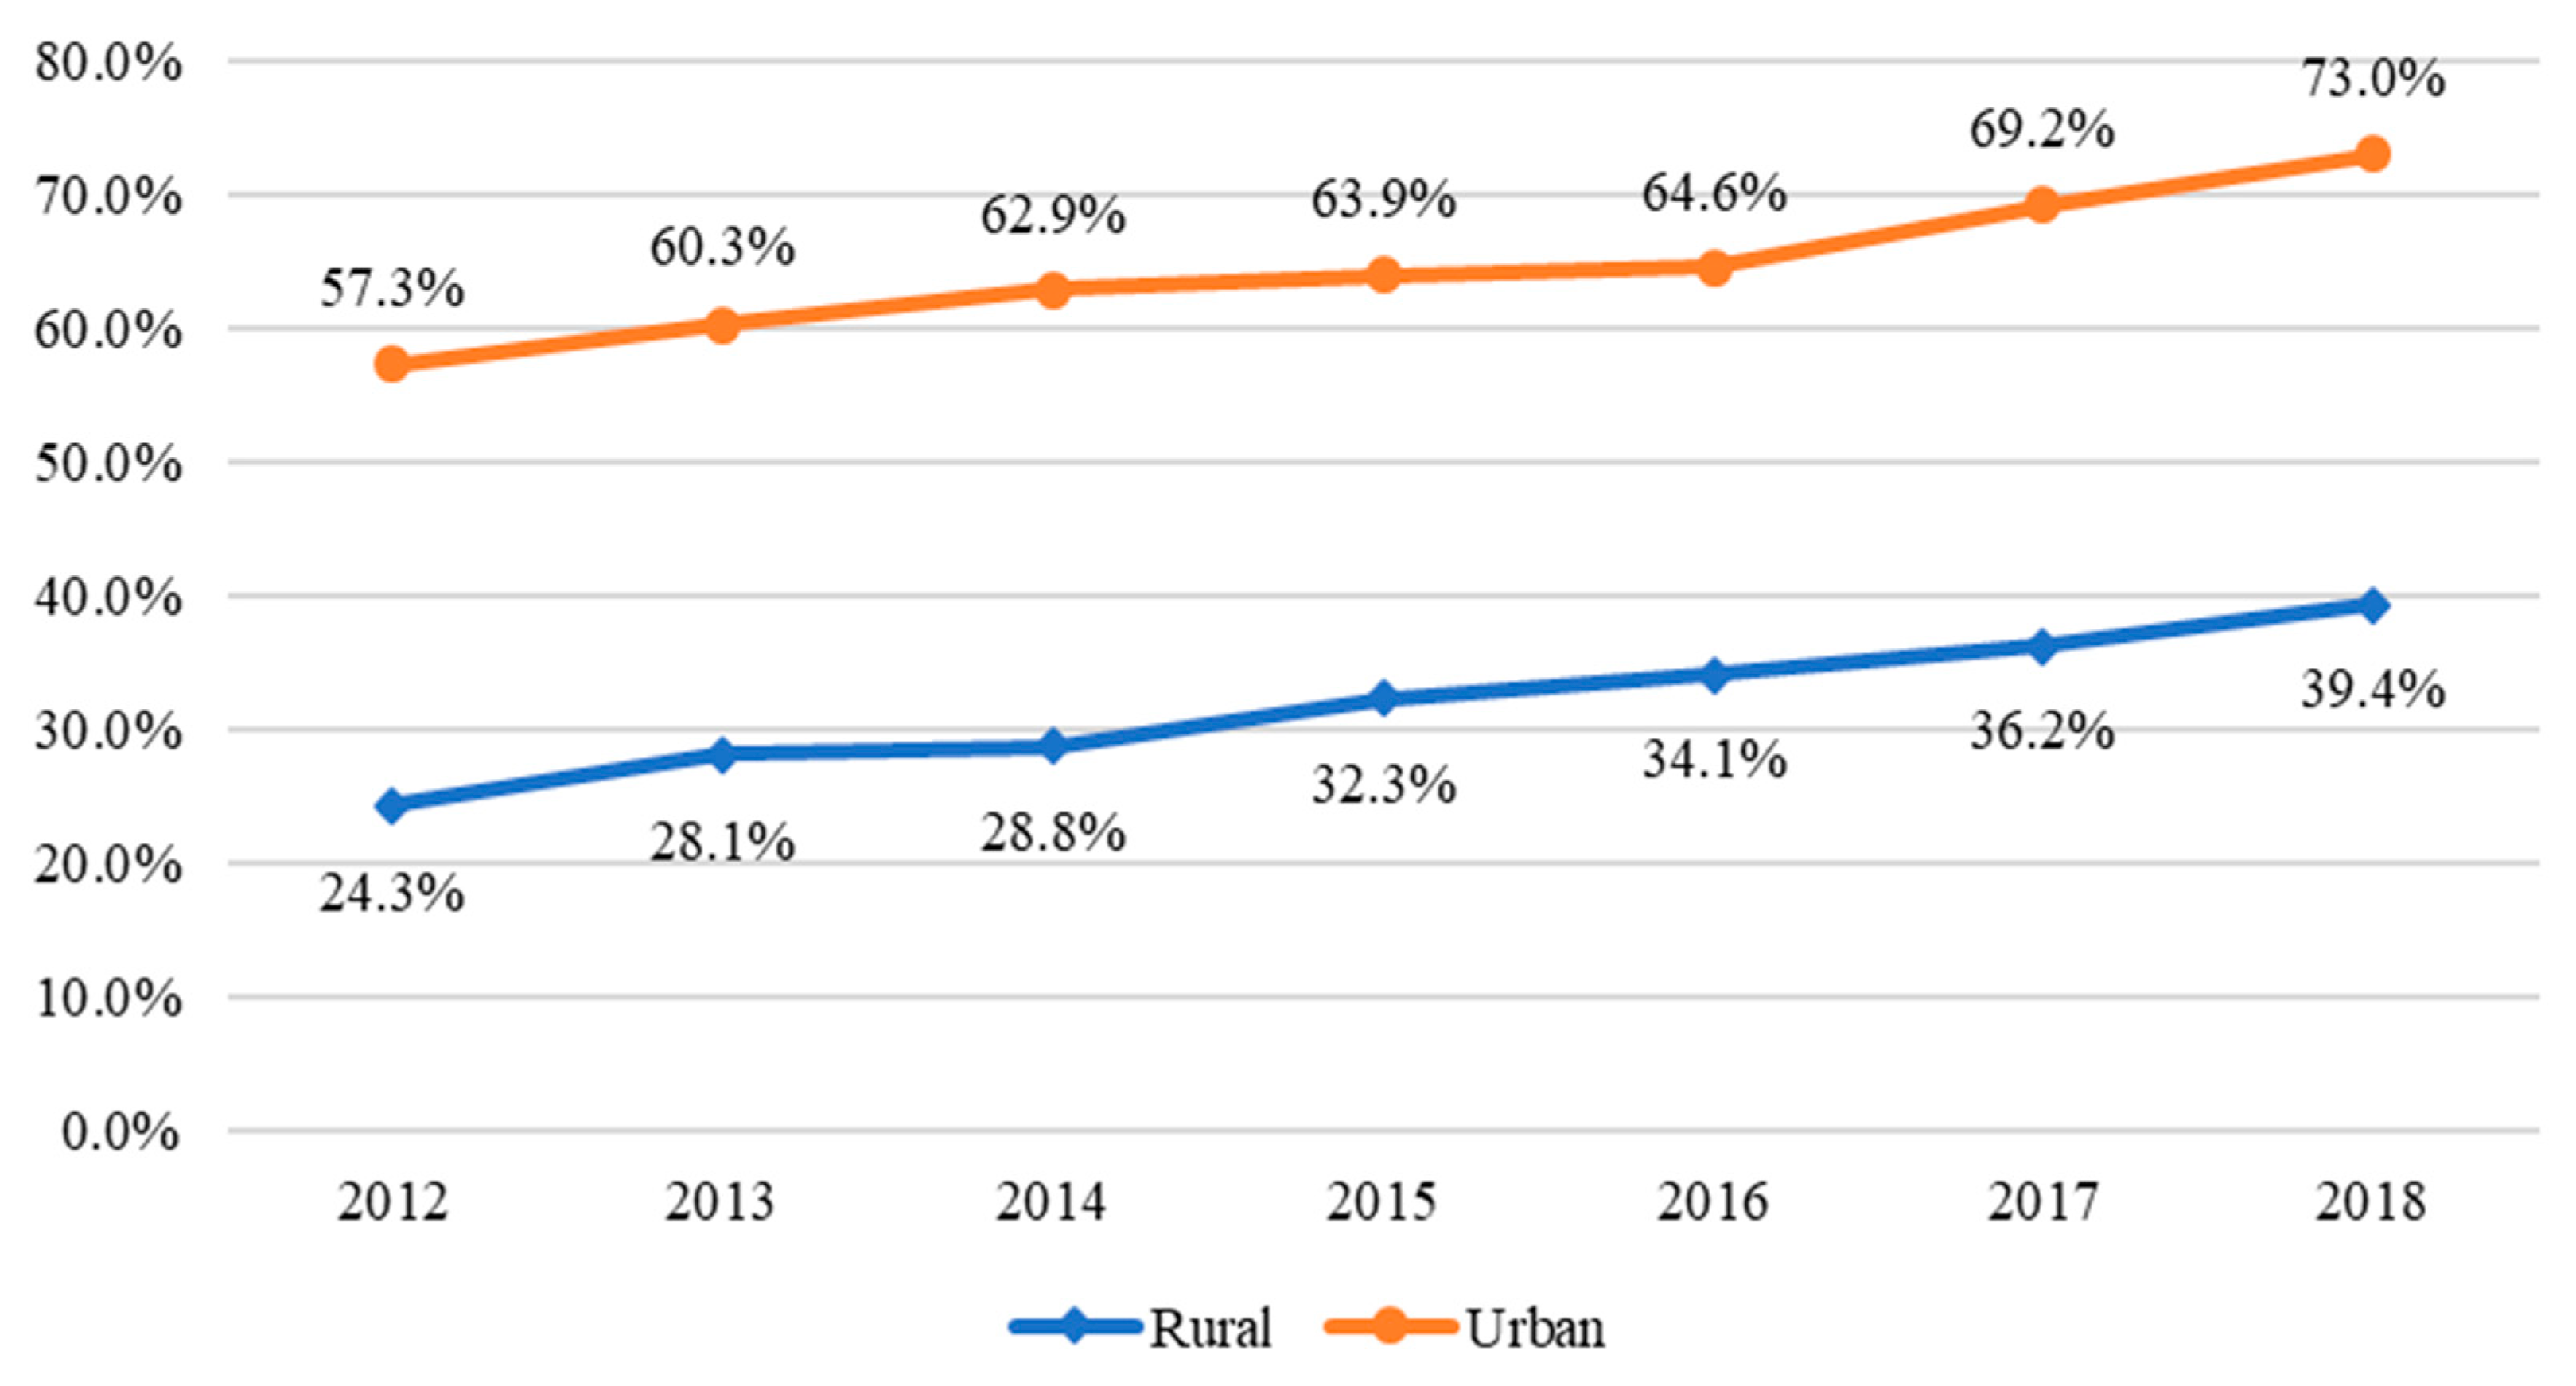
2. The Use of the Internet in China
3. Materials and Methods
3.1. Study Type
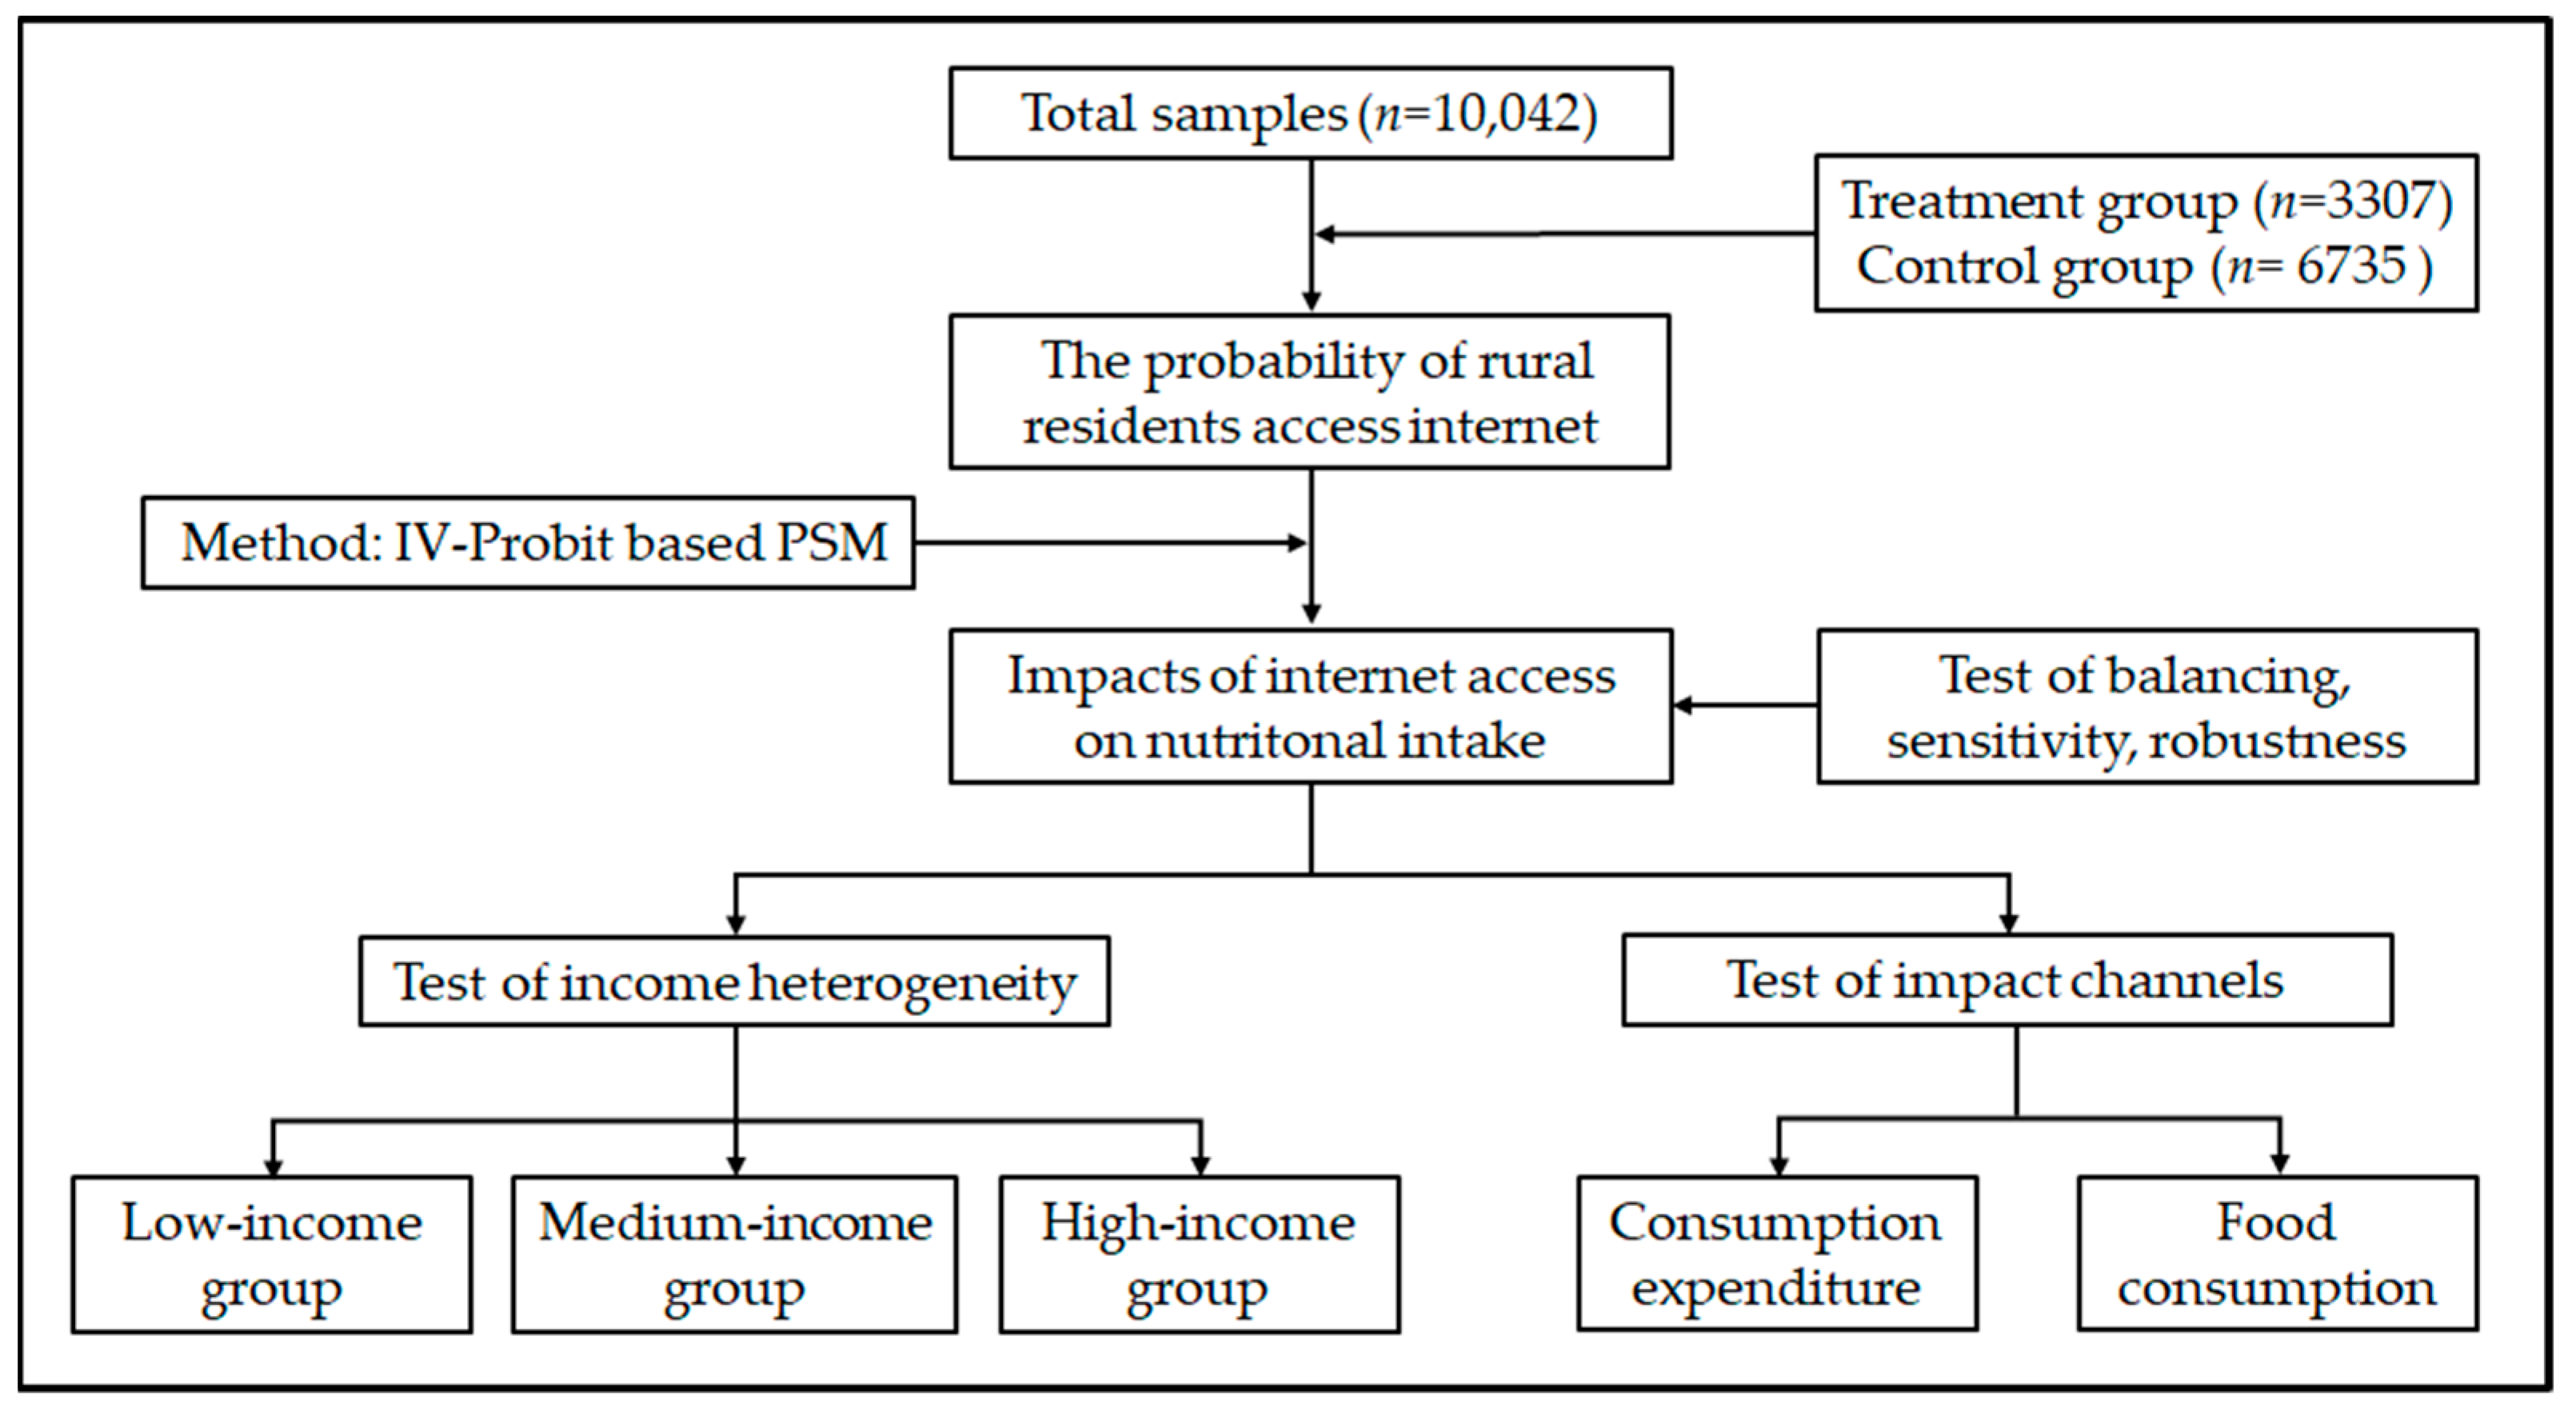
3.2. Study Design
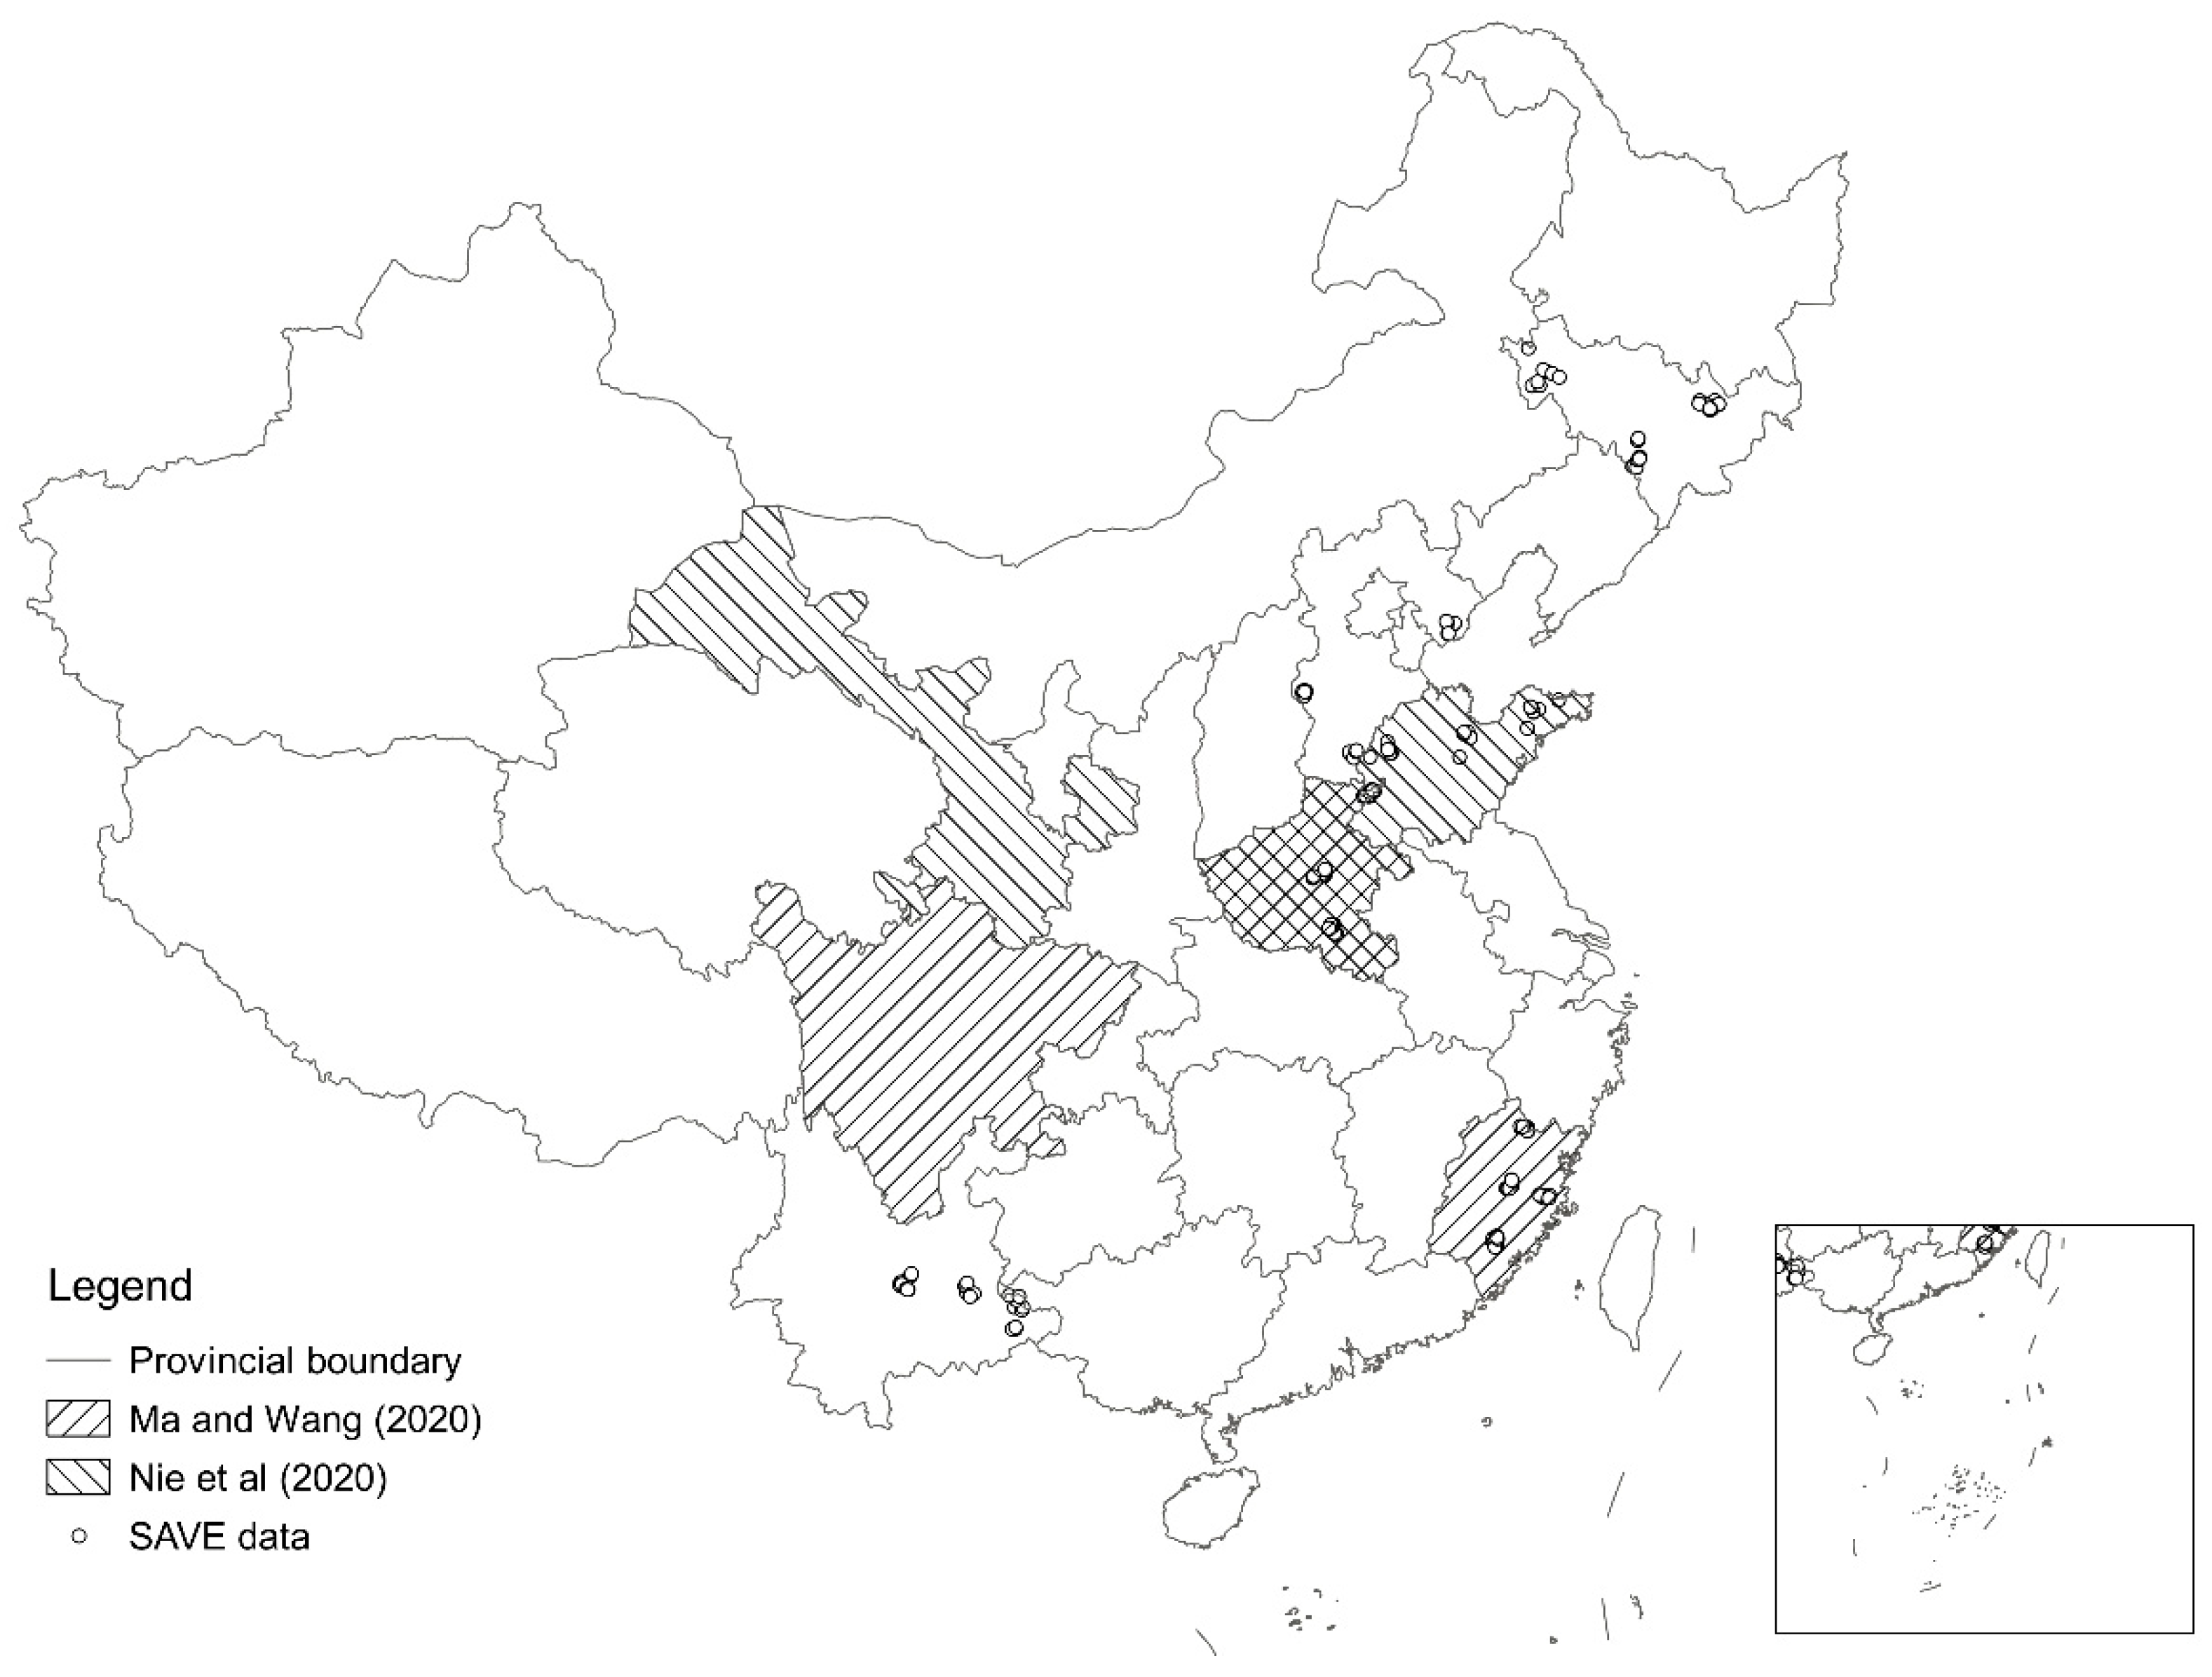
3.3. Data Collection
3.4. Sample Grouping
3.5. Data Analysis
3.6. Data Quality
4. Results
4.1. Results of the PSM
4.2. Balancing, Sensitivity, and Robustness Tests
4.3. Test of Heterogeneity
5. Impact Channels
5.1. The Channel of Expenditure
5.2. The Channel of Food Consumption
6. Discussion
7. Conclusions
Author Contributions
Funding
Data Availability Statement
Acknowledgments
Conflicts of Interest
Appendix A

| Variables | Coefficients | Robust Standard Error |
|---|---|---|
| Per capita per annual income (CNY) | 0.68 *** | 0.13 |
| Gender of HH (1 = Male, 0 = Female) | 0.14 | 0.13 |
| Age of HHs | 0.05 * | 0.03 |
| Square of age of HHs | −0.00 * | 0.00 |
| Years of education of HHs | 0.04 ** | 0.02 |
| Occupations of HHs: only engaged in agriculture (1 = Yes; 0 = No) | 0.40 *** | 0.11 |
| Agricultural training (1 = Yes; 0 = No) | 0.17 *** | 0.06 |
| The proportion of children under the age of 14 | 0.59 *** | 0.23 |
| The proportion of seniors over the age of 65 | 0.29 | 0.33 |
| Dummy of year (Year = 2013) | 0.13 | 0.10 |
| Dummy of year (Year = 2014) | 0.13 | 0.09 |
| Dummy of year (Year = 2015) | 0.27 ** | 0.12 |
| Dummy of year (Year = 2016) | 0.23 | 0.20 |
| Dummy of year (Year = 2017) | 0.16 | 0.21 |
| Dummy of year (Year = 2018) | 0.31 | 0.20 |
| Constant | −8.37 *** | 1.17 |
| Log likelihood | −22,033.97 | |
| N | 10,042 | |
| Wald test of exogeneity | 5.23 ** | |
| F (1410027) | 99.56 | |
| Variables | |
|---|---|
| Energy | 1.23 - |
| Carbohydrate | 1.23 - |
| Fat | 1.15 - |
| Protein | 1.02 - |
| Nutritional Intake/ Food Consumption | Description | Full Sample | Low-Income Group | Medium-Income Group | High-Income Group | ||||
|---|---|---|---|---|---|---|---|---|---|
| Mean | SD | Mean | SD | Mean | SD | Mean | SD | ||
| Energy | kcal | 2100.53 | 786.07 | 1994.58 | 753.87 | 2036.91 | 774.75 | 2270.13 | 800.93 |
| Carbohydrate | g | 307.43 | 119.06 | 303.14 | 116.85 | 301.82 | 118.60 | 317.34 | 121.10 |
| Fat | g | 75.50 | 48.42 | 66.69 | 45.68 | 71.58 | 48.19 | 88.23 | 48.68 |
| Protein | g | 52.47 | 20.74 | 50.27 | 19.91 | 51.04 | 20.34 | 56.11 | 21.46 |
| Staple food | kg | 138.12 | 51.88 | 138.70 | 52.27 | 135.28 | 50.75 | 140.37 | 52.48 |
| Edible oil | kg | 14.50 | 8.78 | 13.23 | 8.61 | 13.71 | 8.32 | 16.55 | 9.03 |
| Red meat | kg | 25.27 | 24.09 | 20.35 | 21.19 | 23.31 | 22.81 | 32.16 | 26.39 |
| Poultry | kg | 4.76 | 6.61 | 3.97 | 6.12 | 4.46 | 5.90 | 5.85 | 7.56 |
| Eggs | kg | 10.36 | 12.35 | 9.70 | 11.57 | 9.83 | 12.22 | 11.56 | 13.14 |
| Aquatic products | kg | 6.74 | 8.94 | 5.77 | 7.96 | 6.27 | 9.31 | 8.19 | 9.29 |
| Dairy products | kg | 4.80 | 13.20 | 4.25 | 12.96 | 4.48 | 12.36 | 5.66 | 14.18 |
| Vegetables | kg | 65.02 | 66.08 | 59.54 | 61.28 | 64.22 | 64.92 | 71.51 | 71.34 |
| Fruits | kg | 23.15 | 25.10 | 22.02 | 24.51 | 22.53 | 24.15 | 24.99 | 26.55 |
| Number of observations | 10,042 | 3348 | 3347 | 3347 | |||||
References
- The United Nations. The Sustainable Development Goals Report 2020; United Nations Publications: New York, NY, USA, 2020. [Google Scholar]
- Popkin, B.M. The nutrition transition and obesity in the developing world. J. Nutr. 2001, 131, 871s–873s. [Google Scholar] [CrossRef]
- Fan, S.; Yosef, S.; Pandya-Lorch, R. Linking agriculture to nutrition: The evolution of policy. China Agric. Econ. Rev. 2020, 12, 595–604. [Google Scholar] [CrossRef]
- Chen, K.; Liu, C.; Liu, X.; Wang, Z.; Luo, R.; Li, S.; Yu, Y.; Alderman, H. Nutrition, Cognition, and Social Emotion among Preschoolers in Poor, Rural Areas of South Central China: Status and Correlates. Nutrients 2021, 13, 1322. [Google Scholar] [CrossRef] [PubMed]
- Ren, Y.; Castro Campos, B.; Peng, Y.; Glauben, T. Nutrition Transition with Accelerating Urbanization? Empirical Evidence from Rural China. Nutrients 2021, 13, 921. [Google Scholar] [CrossRef] [PubMed]
- Tian, X.; Yu, X. Using semiparametric models to study nutrition improvement and dietary change with different indices: The case of China. Food Policy 2015, 53, 67–81. [Google Scholar] [CrossRef]
- Wang, Q.; Jensen, H.H.; Johnson, S.R. China’s nutrient availability and sources, 1950–1991. Food Policy 1993, 18, 403–413. [Google Scholar] [CrossRef][Green Version]
- Gao, Y.; Zheng, Z.H.; Henneberry, S.R. Is nutritional status associated with income growth? Evidence from Chinese adults. China Agric. Econ. Rev. 2020, 12, 507–525. [Google Scholar] [CrossRef]
- Wang, L.; Wang, H.; Zhang, B.; Popkin, B.M.; Du, S. Elevated Fat Intake Increases Body Weight and the Risk of Overweight and Obesity among Chinese Adults: 1991–2015 Trends. Nutrients 2020, 12, 3272. [Google Scholar] [CrossRef]
- Liu, Y.; Renwick, A.; Fu, X. Off-farm income and food expenditure of rural households in China. Br. Food J. 2019, 121, 1088–1100. [Google Scholar] [CrossRef]
- Colen, L.; Melo, P.C.; Abdul-Salam, Y.; Roberts, D.; Mary, S.; Paloma, S.G.Y. Income elasticities for food, calories and nutrients across Africa: A meta-analysis. Food Policy 2018, 77, 116–132. [Google Scholar] [CrossRef]
- Lentz, E.C.; Barrett, C.B. The economics and nutritional impacts of food assistance policies and programs. Food Policy 2013, 42, 151–163. [Google Scholar] [CrossRef]
- Reimer, J.J.; Weerasooriya, S. Macroeconomic Impacts of U.S. Farm and Nutrition Programs. J. Agric. Resour. Econ. 2019, 44, 624–645. [Google Scholar]
- Rossi, L.; Ferrari, M.; Martone, D.; Benvenuti, L.; De Santis, A. The Promotions of Sustainable Lunch Meals in School Feeding Programs: The Case of Italy. Nutrients 2021, 13, 1571. [Google Scholar] [CrossRef] [PubMed]
- Ogutu, S.O.; Gödecke, T.; Qaim, M. Agricultural Commercialisation and Nutrition in Smallholder Farm Households. J. Agric. Econ. 2019, 71, 534–555. [Google Scholar] [CrossRef]
- You, J. The role of microcredit in older children’s nutrition: Quasi-experimental evidence from rural China. Food Policy 2013, 43, 167–179. [Google Scholar] [CrossRef]
- Zeng, D.; Alwang, J.; Norton, G.W.; Shiferaw, B.; Jaleta, M.; Yirga, C. Agricultural technology adoption and child nutrition enhancement: Improved maize varieties in rural Ethiopia. Agric. Econ. 2017, 48, 573–586. [Google Scholar] [CrossRef]
- Ecker, O. Agricultural transformation and food and nutrition security in Ghana: Does farm production diversity (still) matter for household dietary diversity? Food Policy 2018, 79, 271–282. [Google Scholar] [CrossRef]
- Jäckering, L.; Gödecke, T.; Wollni, M. Agriculture–nutrition linkages in farmers’ communication networks. Agric. Econ. 2019, 50, 657–672. [Google Scholar] [CrossRef]
- Chang, H.H.; Just, D.R. Internet Access and Farm Household Income—Empirical Evidence using a Semi-parametric Assessment in Taiwan. J. Agric. Econ. 2009, 60, 348–366. [Google Scholar] [CrossRef]
- Chang, H.H.; Lambert, D.M.; Mishra, A.K. Does participation in the conservation reserve program impact the economic well-being of farm households? Agric. Econ. 2008, 38, 201–212. [Google Scholar] [CrossRef]
- Ma, W.; Grafton, R.Q.; Renwick, A. Smartphone use and income growth in rural China: Empirical results and policy implications. Electron. Commer. Res. 2020, 20, 713–736. [Google Scholar] [CrossRef]
- Ma, W.; Nie, P.; Zhang, P.; Renwick, A. Impact of Internet use on economic well-being of rural households: Evidence from China. Rev. Dev. Econ. 2020, 24, 503–523. [Google Scholar] [CrossRef]
- Ma, W.; Wang, X. Internet Use, Sustainable Agricultural Practices and Rural Incomes: Evidence from China. Aust. J. Agric. Resour. Econ. 2020, 64, 1087–1112. [Google Scholar] [CrossRef]
- Nie, P.; Ma, W.; Sousa-Poza, A. The relationship between smartphone use and subjective well-being in rural China. Electron. Commer. Res. 2020. [Google Scholar] [CrossRef]
- Hitt, L.; Tambe, P. Broadband adoption and content consumption. Inf. Econ. Policy 2007, 19, 362–378. [Google Scholar] [CrossRef]
- Beuermann, D.W.; McKelvey, C.; Vakis, R. Mobile Phones and Economic Development in Rural Peru. J. Dev. Stud. 2012, 48, 1617–1628. [Google Scholar] [CrossRef]
- Nakasone, E.; Torero, M. A text message away: ICTs as a tool to improve food security. Agric. Econ. 2016, 47, 49–59. [Google Scholar] [CrossRef]
- Hou, J. Does computer usage change farmers’ production and consumption? Evidence from China. China Agric. Econ. Rev. 2018, Volume 11, 387–410. [Google Scholar] [CrossRef]
- Mishra, A.K.; Kumar, A.; Joshi, P.K.; D’Souza, A.; Tripathi, G. How can organic rice be a boon to smallholders? Evidence from contract farming in India. Food Policy 2018, 75, 147–157. [Google Scholar] [CrossRef]
- CNNIC. The 44th China Statistical Report on Internet Development; China Internet Network Information Center (CNNIC): Beijing, China, 2019. [Google Scholar]
- Parlasca, M.C.; Mußhoff, O.; Qaim, M. Can mobile phones improve nutrition among pastoral communities? Panel data evidence from Northern Kenya. Agric. Econ. 2020, 51, 475–488. [Google Scholar] [CrossRef]
- NBSC. Statistical Communiqué on the Third National Agricultural Census (No.4). Available online: http://www.stats.gov.cn/tjsj/tjgb/nypcgb/qgnypcgb/201712/t20171215_1563634.html (accessed on 10 January 2021).
- Ren, Y.J.; Li, H.; Wang, X.B. Family income and nutrition-related health: Evidence from food consumption in China. Soc. Sci. Med. 2019, 232, 58–76. [Google Scholar] [CrossRef] [PubMed]
- Yuan, M.; Seale, J.L.; Wahl, T.; Bai, J.F. The changing dietary patterns and health issues in China. China Agric. Econ. Rev. 2019, 11, 143–159. [Google Scholar] [CrossRef]
- Gao, C.; Xu, J.; Liu, Y.; Yang, Y.X. Nutrition Policy and Healthy China 2030 Building. Eur. J. Clin. Nutr. 2021, 75, 238–246. [Google Scholar] [CrossRef] [PubMed]
- NBSC. China Statistical Yearbook 2019; China Statistics Press: Beijing, China, 2019. [Google Scholar]
- CNNIC. The 39th China Statistical Report on Internet Development; China Internet Network Information Center (CNNIC): Beijing, China, 2017. [Google Scholar]
- Elahi, E.; Abid, M.; Zhang, L.; ul Haq, S.; Sahito, J.G.M. Agricultural advisory and financial services; farm level access, outreach and impact in a mixed cropping district of Punjab, Pakistan. Land Use Pol. 2018, 71, 249–260. [Google Scholar] [CrossRef]
- Elahi, E.; Weijun, C.; Zhang, H.; Nazeer, M. Agricultural intensification and damages to human health in relation to agrochemicals: Application of artificial intelligence. Land Use Pol. 2019, 83, 461–474. [Google Scholar] [CrossRef]
- Han, X.; Yang, S.; Chen, Y.; Wang, Y. Urban segregation and food consumption. China Agric. Econ. Rev. 2019, 11, 583–599. [Google Scholar] [CrossRef]
- Crown, W.H. Propensity-score matching in economic analyses: Comparison with regression models, instrumental variables, residual inclusion, differences-in-differences, and decomposition methods. Appl. Health Econ. Health Policy 2014, 12, 7–18. [Google Scholar] [CrossRef] [PubMed]
- Paudel, G.P.; Krishna, V.V.; McDonald, A.J. Apparent Gains, Hidden Costs: Examining Adoption Drivers, Yield, and Profitability Outcomes of Rotavator Tillage in Wheat Systems in Nepal. J. Agric. Econ. 2020, 71, 199–218. [Google Scholar] [CrossRef]
- Mayen, C.D.; Balagtas, J.V.; Alexander, C.E. Technology Adoption and Technical Efficiency: Organic and Conventional Dairy Farms in the United States. Am. J. Agr. Econ. 2010, 92, 181–195. [Google Scholar] [CrossRef]
- Rosenbaum, P.R.; Rubin, D.B. The central role of the propensity score in observational studies for causal effects. Biometrika 1983, 70, 41–55. [Google Scholar] [CrossRef]
- Rosenbaum, P.R. Observational Studies; Springer: New York, NY, USA, 2002. [Google Scholar]
- Tian, X.; Wang, H. The Impact of Having One Parent Absent on Children’ Food Consumption and Nutrition in China. Nutrients 2019, 11, 3077. [Google Scholar] [CrossRef]
- Hosseini, S.H.; Jones, J.M.; Vatanparast, H. Association between Grain Intake, Nutrient Intake, and Diet Quality of Canadians: Evidence from the Canadian Community Health Survey–Nutrition 2015. Nutrients 2019, 11, 1937. [Google Scholar] [CrossRef]
- Giannini, S.; Passeri, G.; Tripepi, G.; Sella, S.; Fusaro, M.; Arcidiacono, G.; Torres, M.O.; Michielin, A.; Prandini, T.; Baffa, V.; et al. Effectiveness of In-Hospital Cholecalciferol Use on Clinical Outcomes in Comorbid COVID-19 Patients: A Hypothesis-Generating Study. Nutrients 2021, 13, 219. [Google Scholar] [CrossRef]
- Rotondi, V.; Stanca, L.; Tomasuolo, M. Connecting alone: Smartphone use, quality of social interactions and well-being. J. Econ. Psychol. 2017, 63, 17–26. [Google Scholar] [CrossRef]
- Wellalage, N.; Locke, S. Access to credit by SMEs in South Asia: Do women entrepreneurs face discrimination. Res. Int. Bus. Financ. 2017, 41, 336–346. [Google Scholar] [CrossRef]
- Yang, Y.X.; Wang, G.Y.; Pan, X.C. China Food Composition, 2nd ed.; Book 1; Peking University Medical Press: Beijing, China, 2009. [Google Scholar]
- Staiger, D.; Stock, J.H. Instrumental Variables Regression with Weak Instruments. Econometrica 1997, 65, 557–586. [Google Scholar] [CrossRef]
- Nemecek, T.; Jungbluth, N.; i Canals, L.M.; Schenck, R. Environmental impacts of food consumption and nutrition: Where are we and what is next? Int. J. Life Cycle Assess. 2016, 21, 607–620. [Google Scholar] [CrossRef]
- Lokuge, M.N.; Zivkovic, S.; Lange, K.; Chidmi, B. Estimation of a censored food demand system and nutrient elasticities: A cross-sectional analysis of Sri Lanka. Int. Food Agribus. Manag. Rev. 2019, 22, 717–729. [Google Scholar] [CrossRef]
- Huang, Y.; Tian, X. Food accessibility, diversity of agricultural production and dietary pattern in rural China. Food Policy 2019, 84, 92–102. [Google Scholar] [CrossRef]
- Wang, O.; Somogyi, S. Consumer adoption of online food shopping in China. Br. Food J. 2018, 120, 2868–2884. [Google Scholar] [CrossRef]
- Yu, X.; Abler, D. The Demand for Food Quality in Rural China. Am. J. Agr. Econ. 2009, 91, 57–69. [Google Scholar] [CrossRef]
- Chen, K.; Wang, Z. China’s Road to a Nutrition-driven Agricultural and Food System. In Agriculture for Improved Nutrition: Seizing the Momentum; Fan, S., Yosef, S., Pandya-Lorch, R., Eds.; International Food Policy Research Institute (IFPRI) and CABI: Wallingford, UK, 2019. [Google Scholar]
- The State Council of China. Food and Nutrition Development Outline in China (2014–2020); People’s Publishing House: Beijing, China, 2014. [Google Scholar]
- The Chinese Nutrition Society. Dietary Guidelines for Chinese Residents (2016); People’s Medical Publishing House: Beijing, China, 2016. [Google Scholar]
- Serra-Majem, L.; Tomaino, L.; Dernini, S.; Berry, E.M.; Lairon, D.; de la Ngo Cruz, J.; Bach-Faig, A.; Donini, L.M.; Medina, F.-X.; Belahsen, R.; et al. Updating the Mediterranean Diet Pyramid towards Sustainability: Focus on Environmental Concerns. Int. J. Environ. Res. Public Health 2020, 17, 8758. [Google Scholar] [CrossRef] [PubMed]
- Fernandez, M.L.; Raheem, D.; Ramos, F.; Carrascosa, C.; Saraiva, A.; Raposo, A. Highlights of Current Dietary Guidelines in Five Continents. Int. J. Environ. Res. Public Health 2021, 18, 2814. [Google Scholar] [CrossRef]
- Bai, J.; Seale Jr, J.L.; Wahl, T.I. Meat demand in China: To include or not to include meat away from home? Aust. J. Agric. Resour. Econ. 2020, 64, 150–170. [Google Scholar] [CrossRef]


| Variables | Description | Full Sample | Treatment | Control | Diff. | |||
|---|---|---|---|---|---|---|---|---|
| Mean | SD | Mean | SD | Mean | SD | |||
| Household heads (HHs) characteristics | ||||||||
| Gender | 1 = Male, 0 = Female | 0.95 | 0.22 | 0.96 | 0.20 | 0.94 | 0.23 | 0.01 ** |
| Age | Years | 51.43 | 10.32 | 49.83 | 9.14 | 52.22 | 10.77 | −2.39 *** |
| Years of education | 7.73 | 2.40 | 8.30 | 2.26 | 7.45 | 2.42 | 0.86 *** | |
| Occupation: only engaged in agriculture | 1 = Yes; 0 = No | 0.65 | 0.48 | 0.62 | 0.49 | 0.66 | 0.47 | −0.04 *** |
| Agricultural training | 1 = Yes; 0 = No | 0.31 | 0.46 | 0.36 | 0.48 | 0.28 | 0.45 | 0.08 *** |
| Household characteristics | ||||||||
| The proportion of children under the age of 14 | % | 11.22 | 16.09 | 12.50 | 15.78 | 10.59 | 16.21 | 1.90 *** |
| The proportion of seniors over the age of 65 | % | 10.22 | 24.63 | 5.35 | 14.48 | 12.61 | 28.01 | −7.26 *** |
| Income (per capita per annum) | CNY 1000 | 11.04 | 10.78 | 13.43 | 12.48 | 9.87 | 9.63 | 3.56 *** |
| Village characteristics | ||||||||
| Income (per capita per annum per village) | CNY 1000 | 8.47 | 5.51 | 9.79 | 6.14 | 7.83 | 5.04 | 1.96 *** |
| Located in the town | 1 = Yes; 0 = No | 0.14 | 0.35 | 0.15 | 0.36 | 0.14 | 0.34 | 0.02 * |
| Nutritional intake (per capita per day) | ||||||||
| Energy | kcal | 2100.53 | 786.07 | 2142.55 | 806.74 | 2079.89 | 774.95 | 62.66 *** |
| Carbohydrate | g | 307.43 | 119.06 | 306.29 | 121.57 | 307.99 | 117.81 | −1.70 |
| Fat | g | 75.50 | 48.42 | 79.66 | 48.30 | 73.45 | 48.34 | 6.20 *** |
| Protein | g | 52.47 | 20.74 | 54.65 | 21.80 | 51.40 | 20.12 | 3.24 *** |
| Quantities of food consumption (per capita per annum) | ||||||||
| Staple food | kg | 138.12 | 51.88 | 135.43 | 51.01 | 139.44 | 52.25 | −4.01 *** |
| Edible oil | kg | 14.50 | 8.78 | 14.97 | 8.67 | 14.26 | 8.83 | 0.71 *** |
| Red meat | kg | 25.27 | 24.09 | 27.96 | 25.16 | 23.95 | 23.44 | 4.01 *** |
| Poultry | kg | 4.76 | 6.61 | 4.99 | 6.82 | 4.64 | 6.51 | 0.35 * |
| Eggs | kg | 10.36 | 12.35 | 11.83 | 12.96 | 9.64 | 11.98 | 2.19 *** |
| Aquatic products | kg | 6.74 | 8.94 | 7.91 | 9.64 | 6.16 | 8.51 | 1.75 *** |
| Dairy products | kg | 4.80 | 13.20 | 5.52 | 13.13 | 4.44 | 13.22 | 1.08 *** |
| Vegetables | kg | 65.02 | 66.08 | 67.45 | 67.91 | 63.83 | 65.14 | 3.62 * |
| Fruits | kg | 23.15 | 25.10 | 25.93 | 28.34 | 21.78 | 23.22 | 4.15 *** |
| Number of observations | 10,042 | 3307 | 6735 | |||||
| Daily Intake of Nutrition | PSM 1 | PSM 2 | OLS | ||||||
|---|---|---|---|---|---|---|---|---|---|
| NN5 Matching a | Kernel Matching b | RD Matching c | NN5 Matching a | ||||||
| Change | Change (%) | Change | Change (%) | Change | Change (%) | Change | Change (%) | Change (%) | |
| Energy (kcal) | 28.62 * | 1.35 * | 32.50 ** | 1.54 ** | 61.36 *** | 2.95 *** | 29.47 * | 1.40 * | 1.91 |
| Carbohydrate (g) | −2.90 | −0.94 | −1.58 | −0.51 | −1.77 | −0.57 | −3.39 | −1.09 | −0.73 |
| Fat (g) | 3.30 *** | 4.33 *** | 3.13 *** | 4.09 *** | 6.10 *** | 8.29 *** | 3.46 *** | 4.55 *** | 6.90 * |
| Protein (g) | 2.61 *** | 5.02 *** | 2.70 *** | 5.20 *** | 3.22 *** | 6.27 *** | 2.88 *** | 5.55 *** | 5.77 ** |
| Variables | Percentage of Bias after | ||
|---|---|---|---|
| NN5 Matching a | Kernel Matching b | RD Matching c | |
| Gender of HHs (1 = Male, 0 = Female) | 3.9 | 4.4 * | 5.5 ** |
| Age of HHs | −2.8 | −2.3 | −22.3 *** |
| Square of age of HHs | −3.0 | −2.6 | −24.5 *** |
| Years of education of HHs | 0.1 | 1.6 | 35.0 *** |
| Occupation of HHs: only engaged in agriculture (1 = Yes, 0 = No) | −0.1 | 1.1 | −8.2 *** |
| Agricultural training (1 = Yes, 0 = No) | −0.7 | −0.1 | 16.5 *** |
| The proportion of children under the age of 14 | −1.4 | −2.1 | 11.4 *** |
| The proportion of seniors over the age of 65 | 0.3 | −0.2 | −29.7 *** |
| Per capita per annual income (CNY) | −0.4 | −0.1 | 23.2 *** |
| Pseudo-R2 | 0.001 | 0.001 | 0.045 |
| Daily Nutritional Intake | Change (%) | |||
|---|---|---|---|---|
| Full Sample | Low-Income Group | Medium-Income Group | High-Income Group | |
| Energy (kcal) | 1.35 * | 3.52 ** | 1.28 | 0.16 |
| Carbohydrate (g) | −0.94 | −0.43 | −0.78 | −1.17 |
| Fat (g) | 4.33 *** | 10.42 *** | 3.79 * | 1.59 |
| Protein (g) | 5.02 *** | 7.40 *** | 5.82 *** | 2.59 ** |
| N | 10,042 | 3348 | 3347 | 3347 |
| Channels of Expenditure | Consumption Expenditure per Capita per Annum | Channel of Food Consumption | Quantities of Food Consumption | Prices of Food Consumption | |||
|---|---|---|---|---|---|---|---|
| Change (CNY) | Change % | Change (kg) | Change % | Change (CNY/kg) | Change % | ||
| Food | 188.97 *** | 6.35 *** | Staple food | −3.28 * | −2.36 * | −0.05 | −1.29 |
| Clothing | 77.97 *** | 12.90 *** | Edible oil | 0.43 ** | 2.93 ** | −0.12 | −0.97 |
| Residence | 22.17 * | 16.17 * | Red meat | 1.52 *** | 5.74 *** | 0.12 | 0.46 |
| HFAS | 26.23 ** | 19.68 ** | Poultry | 0.05 | 1.08 | −0.48 * | −2.80 * |
| Transport and communication | 112.13 *** | 23.36 *** | Eggs | 2.10 *** | 21.53 *** | −0.12 | −1.29 |
| ECR | 33.18 * | 5.03 * | Aquatic products | 1.01 *** | 14.55 *** | 0.66 ** | 4.29 ** |
| HCMS | −27.13 * | −9.35 * | Dairy products | 1.05 *** | 23.35 *** | 0.13 | 1.16 |
| MGS | 49.66 *** | 33.79 *** | Vegetables | 2.07 | 3.16 | 0.16 ** | 3.64 ** |
| Total | 483.18 *** | 8.90 *** | Fruits | 3.32 *** | 14.70 *** | 0.14 | 1.75 |
Publisher’s Note: MDPI stays neutral with regard to jurisdictional claims in published maps and institutional affiliations. |
© 2021 by the authors. Licensee MDPI, Basel, Switzerland. This article is an open access article distributed under the terms and conditions of the Creative Commons Attribution (CC BY) license (https://creativecommons.org/licenses/by/4.0/).
Share and Cite
Xue, P.; Han, X.; Elahi, E.; Zhao, Y.; Wang, X. Internet Access and Nutritional Intake: Evidence from Rural China. Nutrients 2021, 13, 2015. https://doi.org/10.3390/nu13062015
Xue P, Han X, Elahi E, Zhao Y, Wang X. Internet Access and Nutritional Intake: Evidence from Rural China. Nutrients. 2021; 13(6):2015. https://doi.org/10.3390/nu13062015
Chicago/Turabian StyleXue, Ping, Xinru Han, Ehsan Elahi, Yinyu Zhao, and Xiudong Wang. 2021. "Internet Access and Nutritional Intake: Evidence from Rural China" Nutrients 13, no. 6: 2015. https://doi.org/10.3390/nu13062015
APA StyleXue, P., Han, X., Elahi, E., Zhao, Y., & Wang, X. (2021). Internet Access and Nutritional Intake: Evidence from Rural China. Nutrients, 13(6), 2015. https://doi.org/10.3390/nu13062015