
The Speed of Ingestion of a Sugary Beverage Has an Effect on the Acute Metabolic Response to Fructose

 , , , ,
Abstract
1. Introduction
2. Materials and Methods
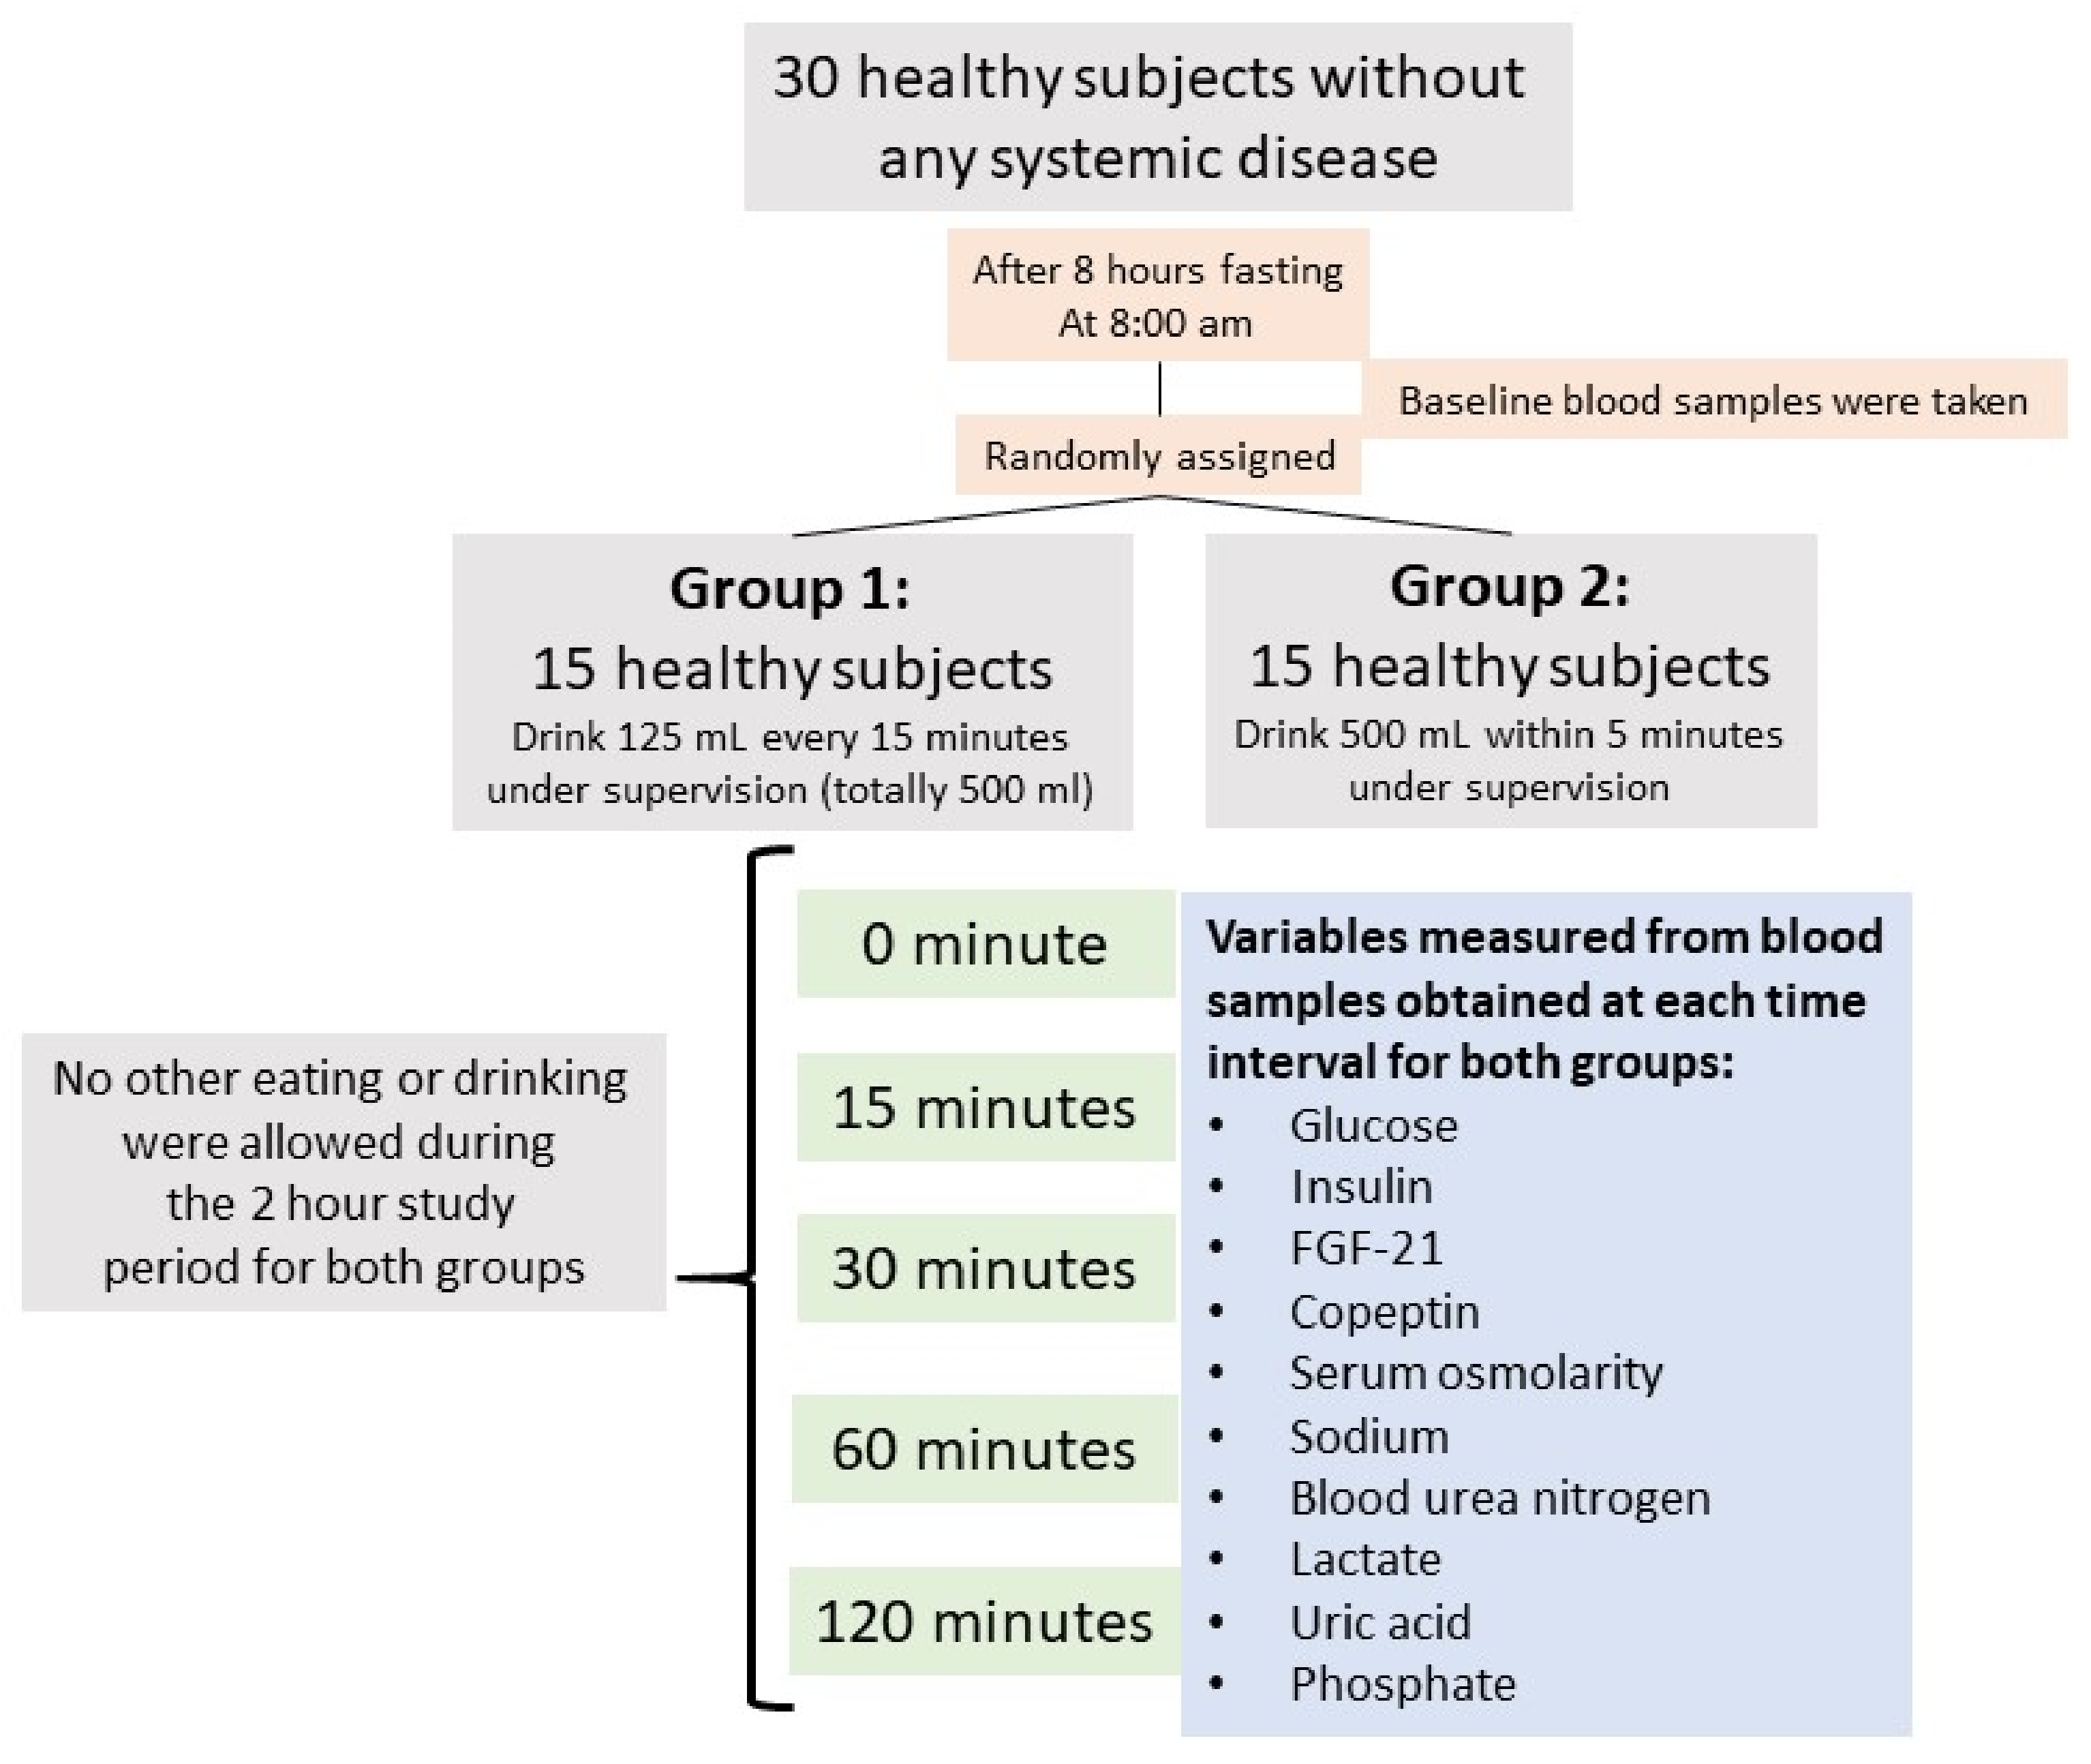
2.1. Characteristics of the Study Population
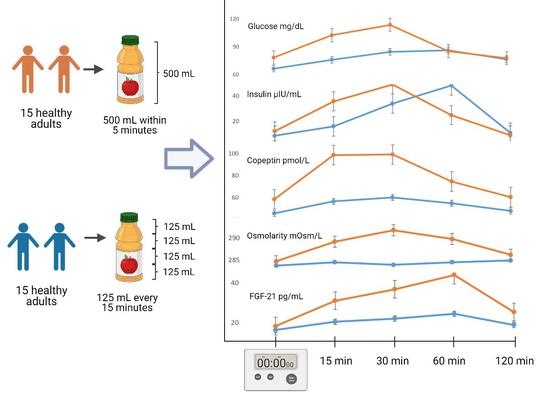
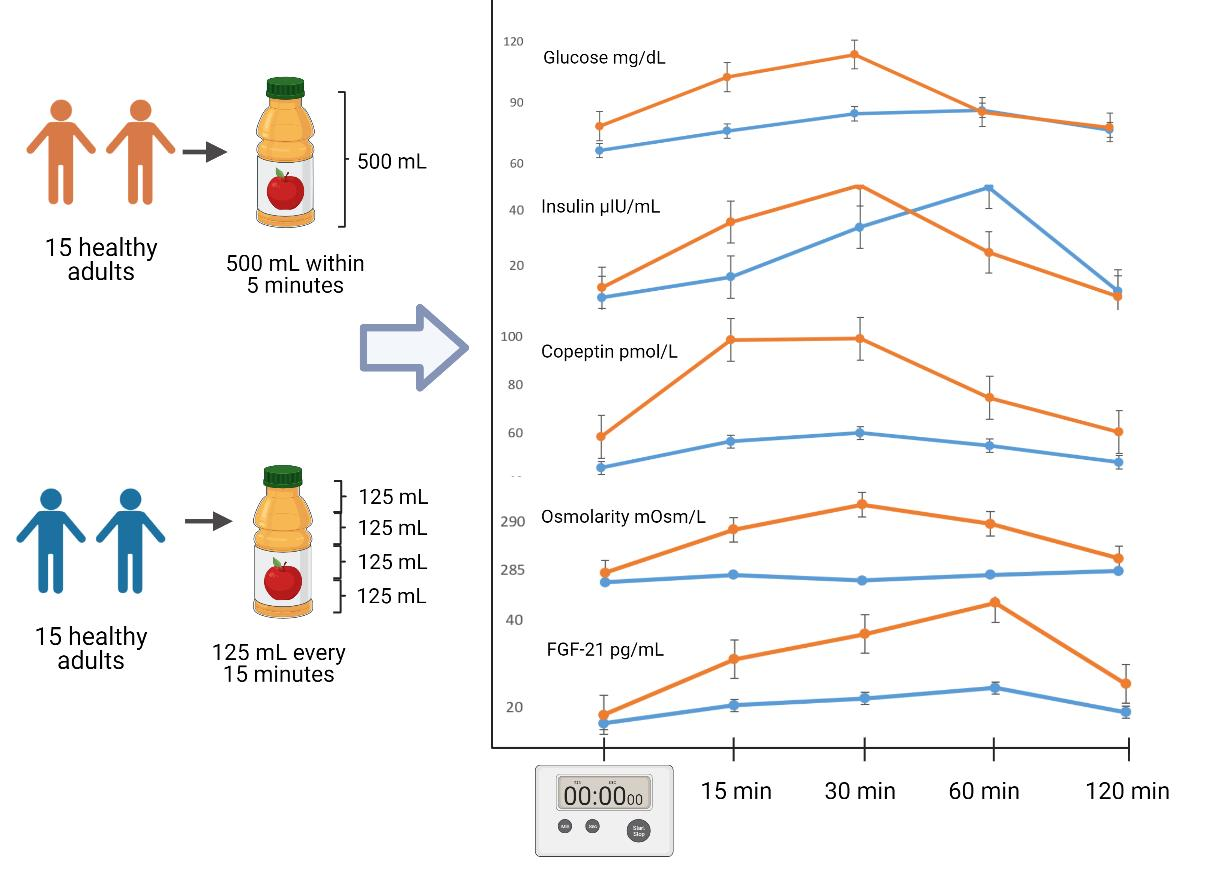
2.2. Study Protocol
2.3. Serum Measurements
2.4. Statistical Analysis
3. Results
3.1. Characteristics of the Study Population
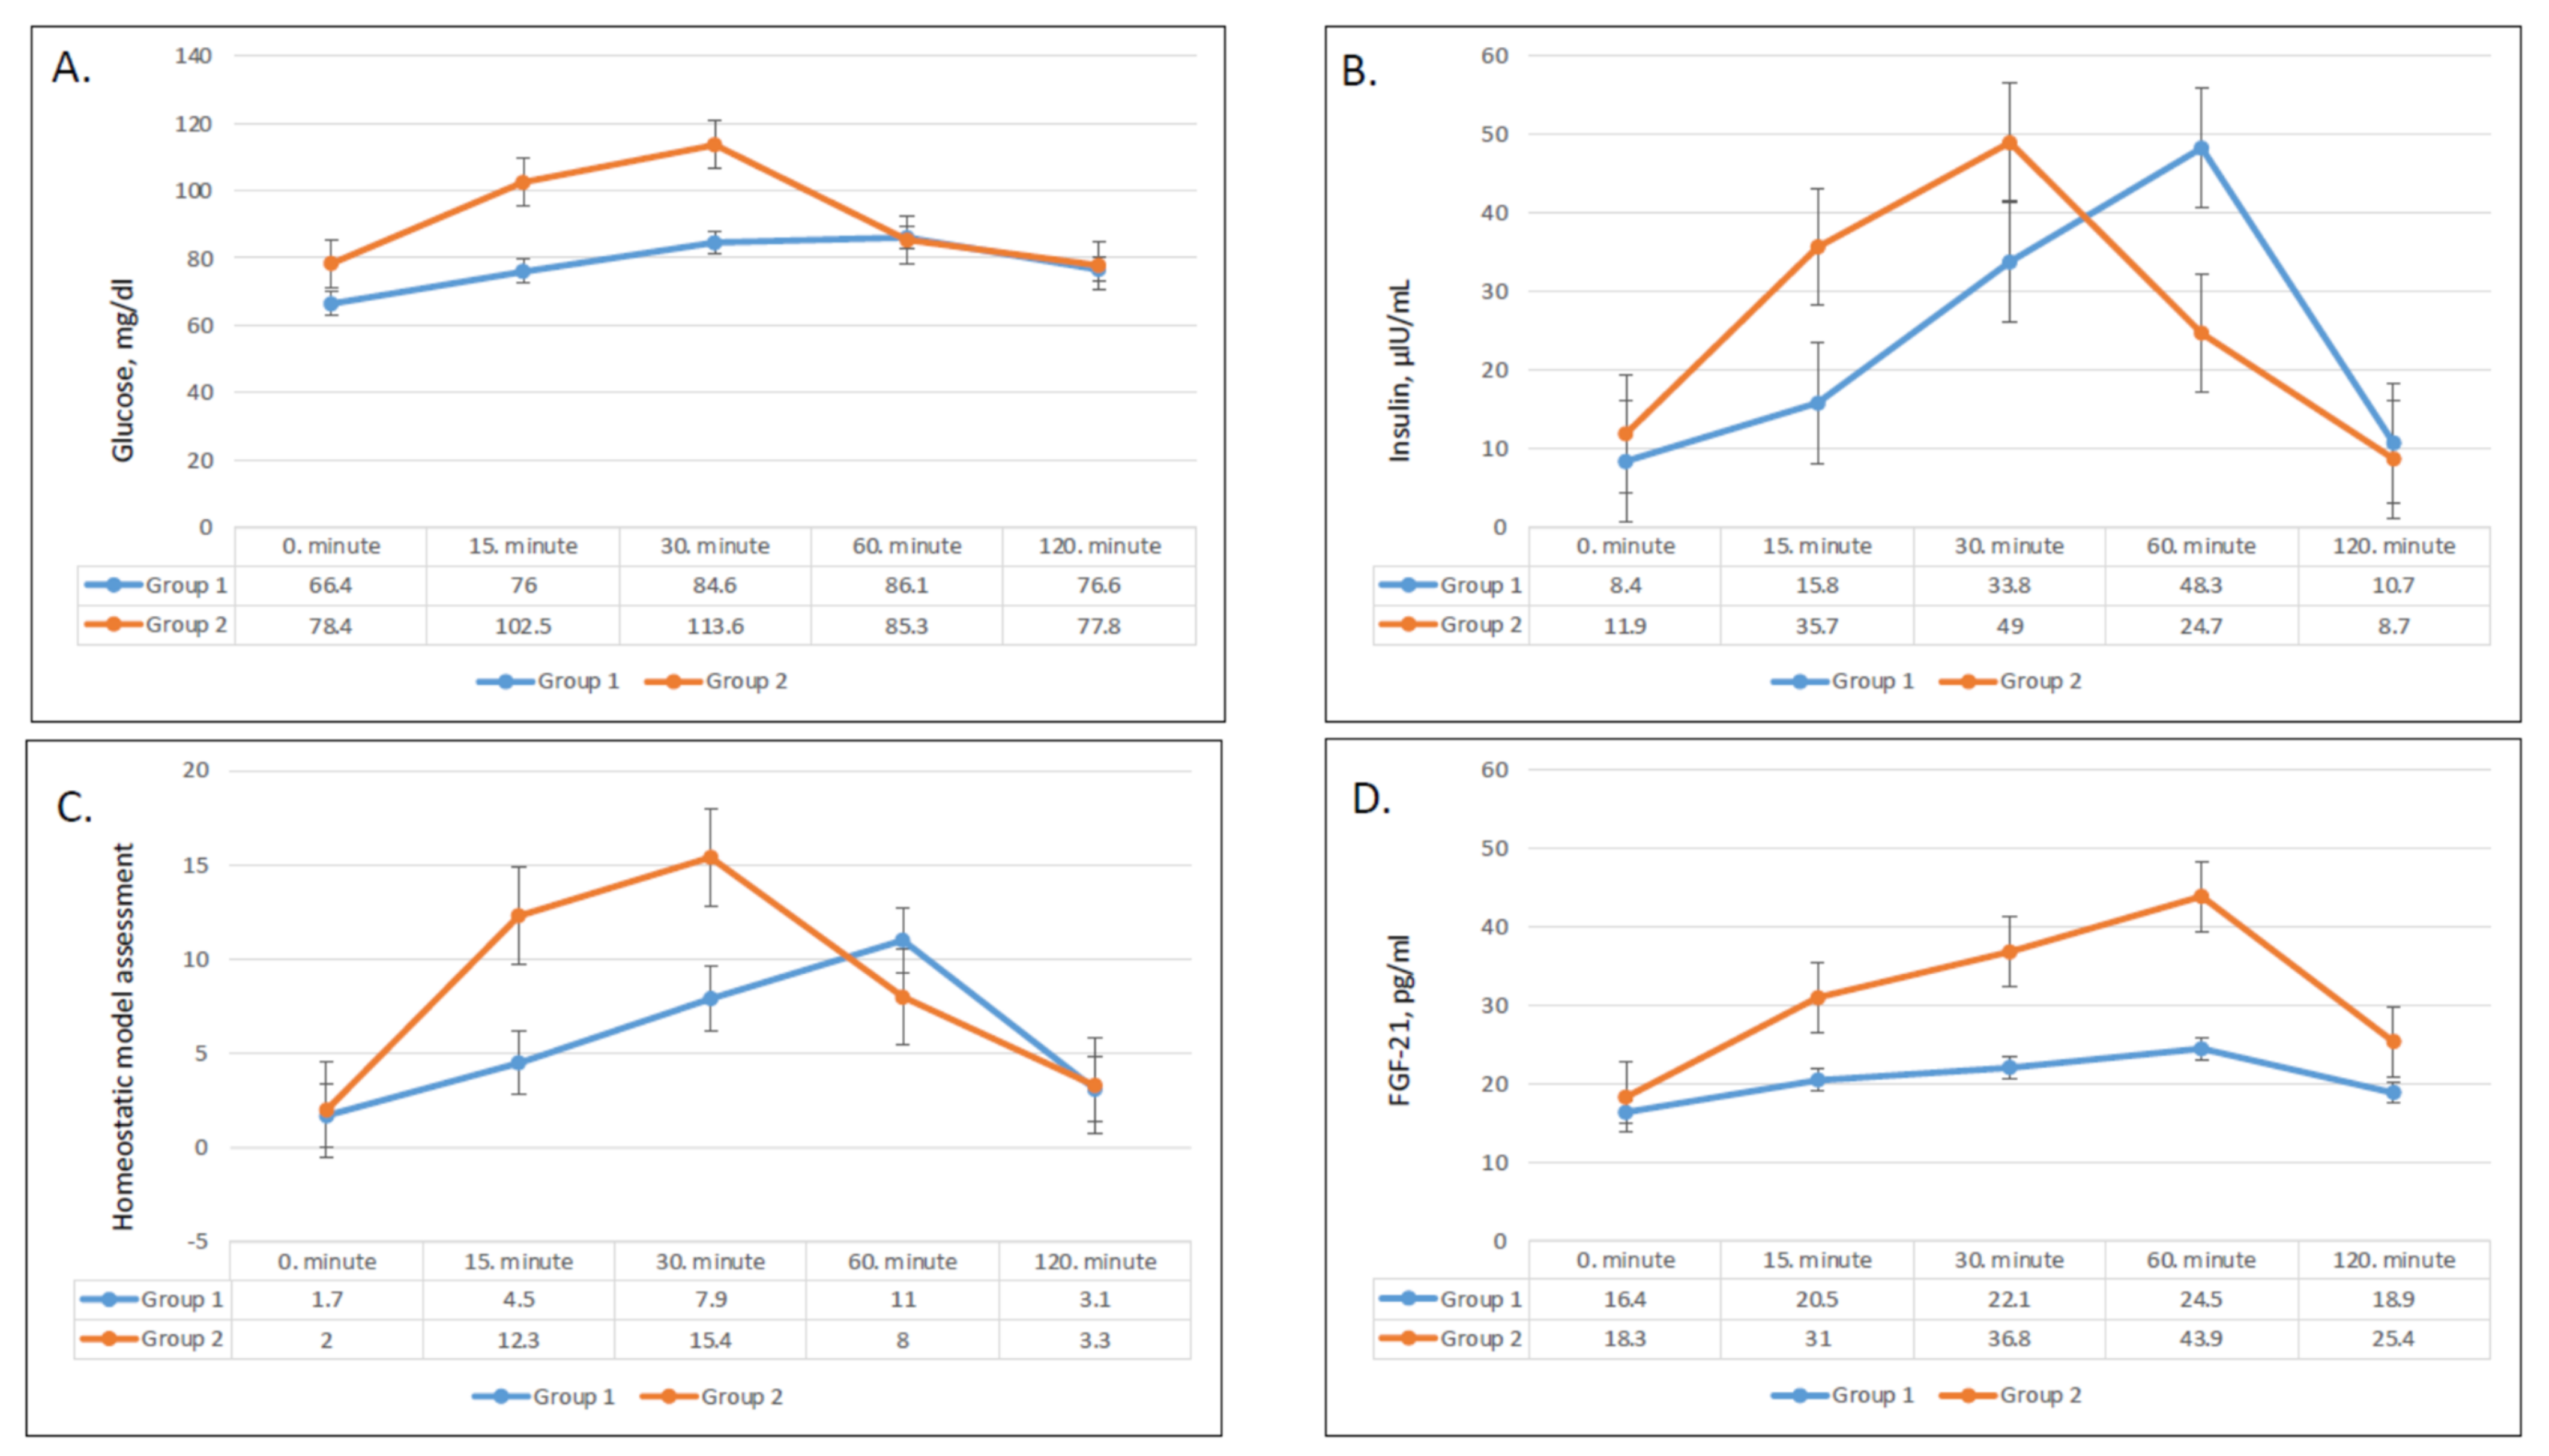
3.2. Effect of Intervention on Serum Glucose, Insulin, and HOMA-IR
3.3. Effect on FGF-21
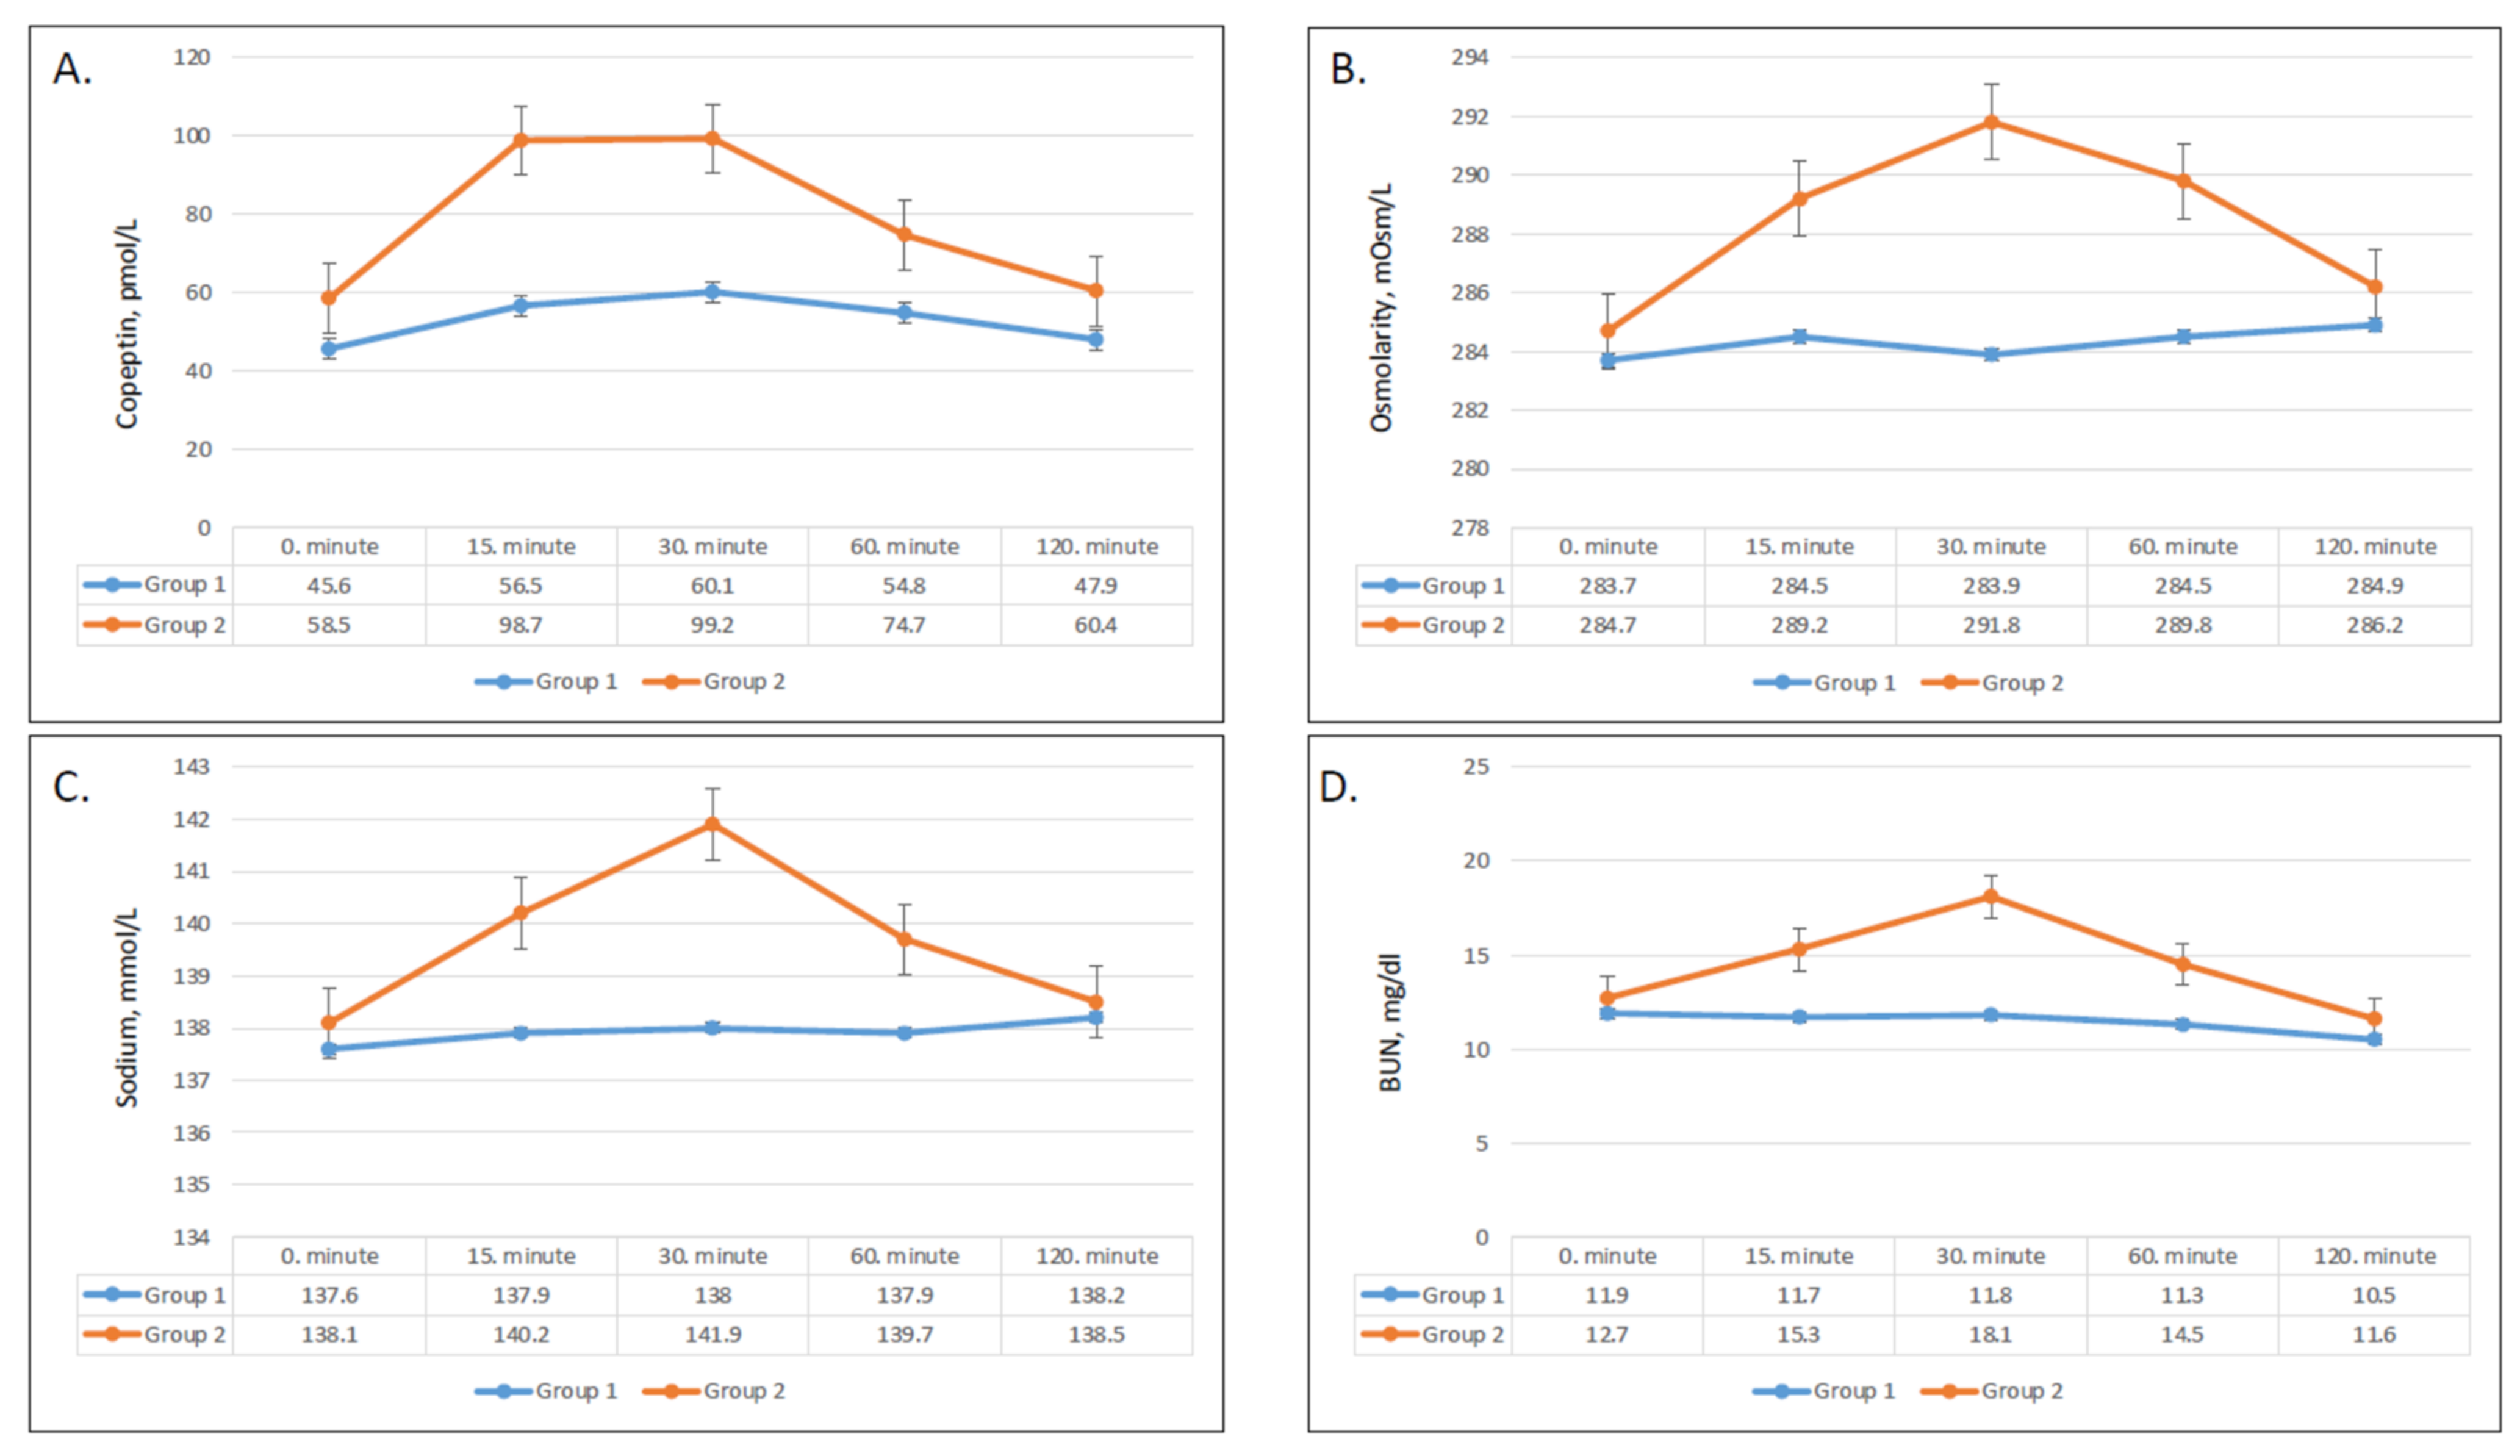
3.4. Effect of on Serum Copeptin, Sodium, BUN, and Osmolarity
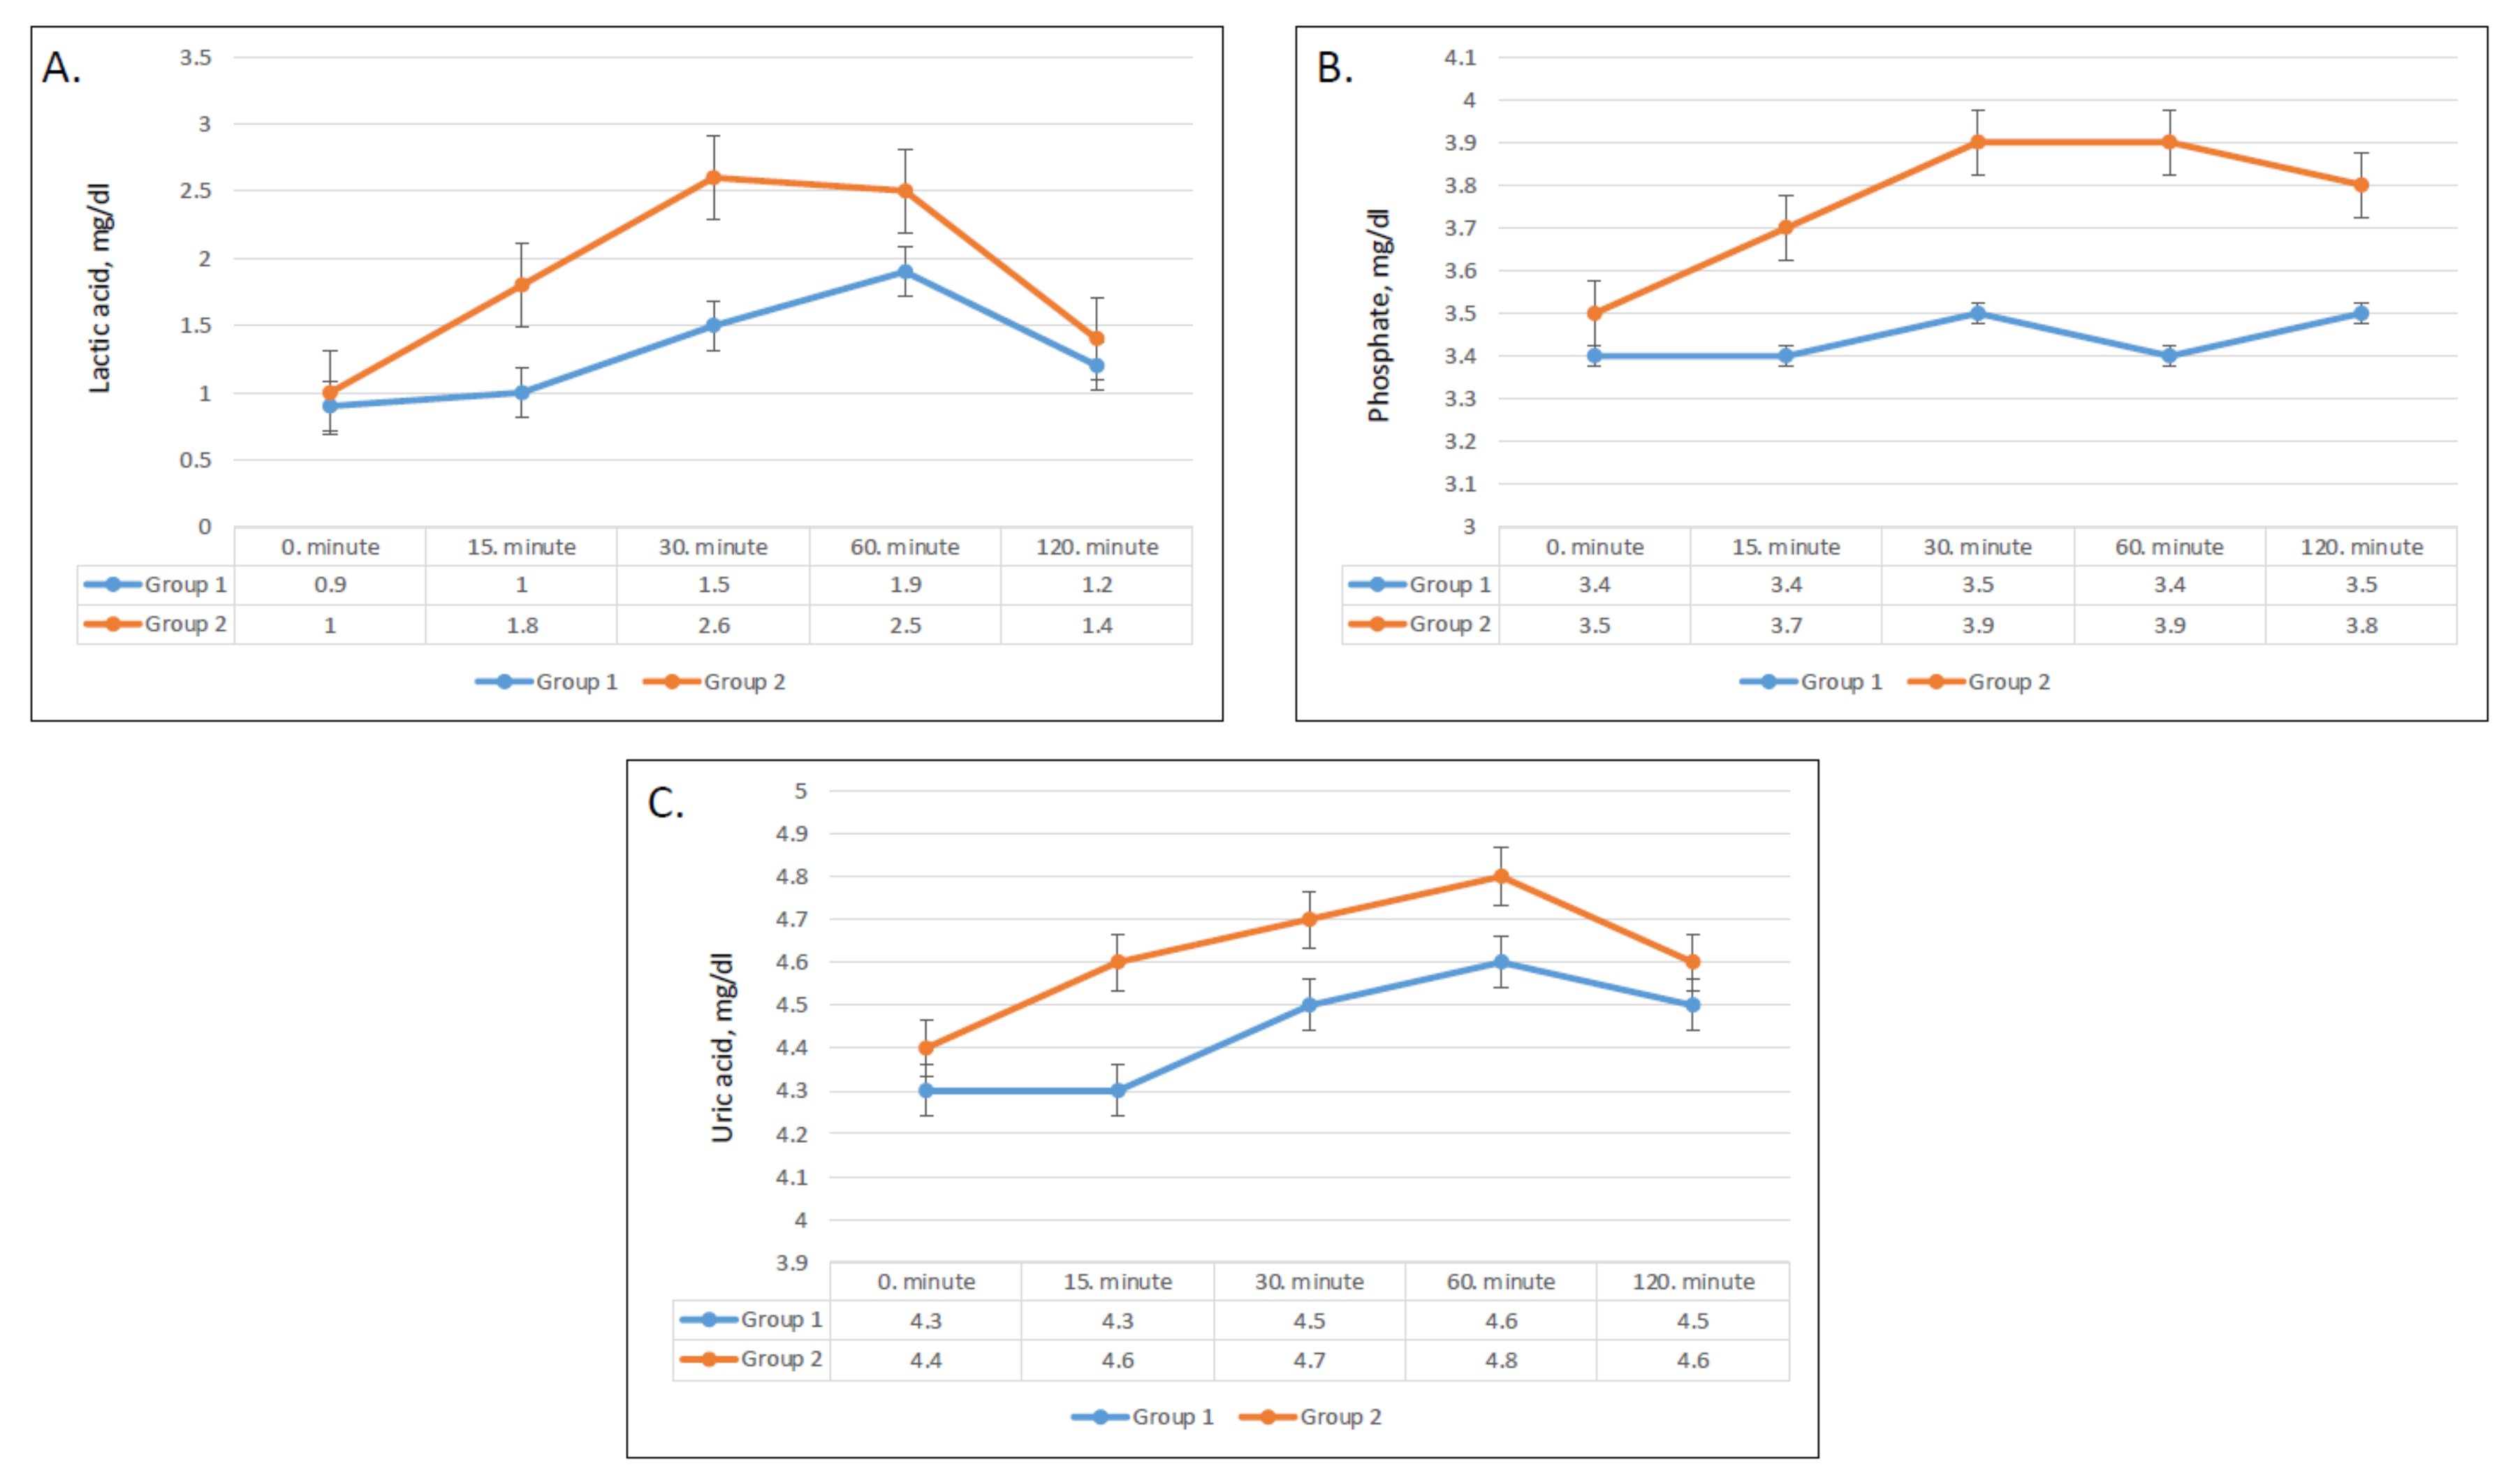
3.5. Effect on Plasma Lactic Acid, Uric Acid, and Phosphate
4. Discussion
Author Contributions
Funding
Institutional Review Board Statement
Informed Consent Statement
Data Availability Statement
Acknowledgments
Conflicts of Interest
References
- Herrick, K.A.; Terry, A.L.; Afful, J. Beverage Consumption among Youth in the United States, 2013–2016; NCHS Data Brief, no 320; National Center for Health Statistics: Hyattsville, MD, USA, 2018.
- Malik, V.S.; Hu, F.B. Sugar-sweetened beverages and cardiometabolic health: An update of the evidence. Nutrients 2019, 11, 1840. [Google Scholar] [CrossRef]
- Yerlikaya, A.; Dagel, T.; King, C.; Kuwabara, M.; Lanaspa, M.A.; Andres-Hernando, A.; Covic, A.; Manitius, J.; Sag, A.A.; Kanbay, M. Dietary and commercialized fructose: Sweet or sour? Int. Urol. Nephrol. 2017, 49, 1611–1620. [Google Scholar] [CrossRef]
- Mullee, A.; Romaguera, D.; Pearson-Stuttard, J.; Viallon, V.; Stepien, M.; Freisling, H.; Fagherazzi, G.; Mancini, F.R.; Boutron-Ruault, M.C.; Kühn, T.; et al. Association between soft drink consumption and mortality in 10 European countries. JAMA Intern. Med. 2019, 179, 1479–1490. [Google Scholar] [CrossRef]
- Walker, R.W.; Dumke, K.A.; Goran, M.I. Fructose content in popular beverages made with and without high-fructose corn syrup. Nutrition 2014, 30, 928–935. [Google Scholar] [CrossRef] [PubMed]
- Stanhope, K.L.; Schwarz, J.M.; Keim, N.L.; Griffen, S.C.; Bremer, A.A.; Graham, J.L.; Hatcher, B.; Cox, C.L.; Dyachenko, A.; Zhang, W.; et al. Consuming fructose-sweetened, not glucose-sweetened, beverages increases visceral adiposity and lipids and decreases insulin sensitivity in overweight/obese humans. J. Clin. Investig. 2009, 119, 1322–1334. [Google Scholar] [CrossRef]
- Jang, C.; Hui, S.; Lu, W.; Cowan, A.J.; Morscher, R.J.; Lee, G.; Liu, W.; Tesz, G.J.; Birnbaum, M.J.; Rabinowitz, J.D. The small intestine converts dietary fructose into glucose and organic acids. Cell Metab. 2018, 27, 351–361. [Google Scholar] [CrossRef] [PubMed]
- Lanaspa, M.A.; Sanchez-Lozada, L.G.; Choi, Y.J.; Cicerchi, C.; Kanbay, M.; Roncal-Jimenez, C.A.; Ishimoto, T.; Li, N.; Marek, G.; Duranay, M.; et al. Uric acid induces hepatic steatosis by generation of mitochondrial oxidative stress: Potential role in fructose-dependent and -independent fatty liver. J. Biol. Chem. 2012, 287, 40732–40744. [Google Scholar] [CrossRef] [PubMed]
- Tappy, L.; Le, K.A. Metabolic effects of fructose and the worldwide increase in obesity. Physiol. Rev. 2010, 90, 23–46. [Google Scholar] [CrossRef]
- Kanbay, M.; Bulbul, M.C.; Copur, S.; Afsar, B.; Sag, A.A.; Siriopol, D.; Kuwabara, M.; Badarau, S.; Covic, A.; Ortiz, A. Therapeutic implications of shared mechanisms in non-alcoholic fatty liver disease and chronic kidney disease. J. Nephrol. 2020. [Google Scholar] [CrossRef] [PubMed]
- Hannou, S.A.; Haslam, D.E.; McKeown, N.M.; Herman, M.A. Fructose metabolism and metabolic disease. J. Clin. Investig. 2018, 128, 545–555. [Google Scholar] [CrossRef]
- Sánchez-Lozada, L.G.; Tapia, E.; Jiménez, A.; Bautista, P.; Cristóbal, M.; Nepomuceno, T.; Soto, V.; Ávila-Casado, C.; Nakagawa, T.; Johnson, R.J.; et al. Fructose-induced metabolic syndrome is associated with glomerular hypertension and renal microvascular damage in rats. Am. J. Physiol. Renal Physiol. 2007, 292, F423–F429. [Google Scholar] [CrossRef]
- Abdulla, M.H.; Sattar, M.A.; Johns, E.J. The relation between fructose-induced metabolic syndrome and altered renal haemodynamic and excretory function in the rat. Int. J. Nephrol. 2011, 2011, 934659. [Google Scholar] [CrossRef] [PubMed]
- Lanaspa, M.A.; Andres-Hernando, A.; Orlicky, D.J.; Cicerchi, C.; Jang, C.; Li, N.; Milagres, T.; Kuwabara, M.; Wempe, M.F.; Rabinowitz, J.D.; et al. Ketohexokinase C blockade ameliorates fructose-induced metabolic dysfunction in fructose-sensitive mice. J. Clin. Investig. 2018, 128, 2226–2238. [Google Scholar] [CrossRef]
- Lanaspa, M.A.; Epperson, L.E.; Li, N.; Cicerchi, C.; Garcia, G.E.; Roncal-Jimenez, C.A.; Trostel, J.; Jain, S.; Mant, C.T.; Rivard, C.J.; et al. Opposing activity changes in AMP deaminase and AMP-activated protein kinase in the hibernating ground squirrel. PLoS ONE 2015, 10, e0123509. [Google Scholar] [CrossRef]
- Andres-Hernando, A.; Orlicky, D.J.; Kuwabara, M.; Ishimoto, T.; Nakagawa, T.; Johnson, R.J.; Lanaspa, M.A. Deletion of fructokinase in the liver or in the intestine reveals differential effects on sugar-induced metabolic dysfunction. Cell Metab. 2020, 32, 117–127. [Google Scholar] [CrossRef]
- Togo, J.; Hu, S.; Li, M.; Niu, C.; Speakman, J.R. Impact of dietary sucrose on adiposity and glucose homeostasis in C57BL/6J mice depends on mode of ingestion: Liquid or solid. Mol. Metab. 2019, 27, 22–32. [Google Scholar] [CrossRef]
- Sundborn, G.; Thornley, S.; Merriman, T.R.; Lang, B.; King, C.; Lanaspa, M.A.; Johnson, R.J. Are liquid sugars different from solid sugar in their ability to cause metabolic syndrome? Obesity 2019, 27, 879–887. [Google Scholar] [CrossRef]
- Enhörning, S.; Hedblad, B.; Nilsson, P.M.; Engström, G.; Melander, O. Copeptin is an independent predictor of diabetic heart disease and death. Am. Heart J. 2015, 169, 549–556.e1. [Google Scholar] [CrossRef]
- Zhu, F.X.; Wu, H.L.; Tu, K.S.; Chen, J.X.; Zhang, M.; Shi, C. Serum levels of copeptin are associated with type 2 diabetes and diabetic complications in Chinese population. J. Diabetes Complicat. 2016, 30, 1566–1570. [Google Scholar] [CrossRef]
- Morgenthaler, N.G. Copeptin: A biomarker of cardiovascular and renal function. Congest. Heart Fail. 2010, 16 (Suppl. 1), S37–S44. [Google Scholar] [CrossRef]
- Song, Z.; Roncal-Jimenez, C.A.; Lanaspa-Garcia, M.A.; Oppelt, S.A.; Kuwabara, M.; Jensen, T.; Milagres, T.; Andres-Hernando, A.; Ishimoto, T.; Garcia, G.E.; et al. Role of fructose and fructokinase in acute dehydration-induced vasopressin gene expression and secretion in mice. J. Neurophysiol. 2017, 117, 646–654. [Google Scholar] [CrossRef]
- Chapman, C.L.; Johnson, B.D.; Sackett, J.R.; Parker, M.D.; Schlader, Z.J. Soft drink consumption during and following exercise in the heat elevates biomarkers of acute kidney injury. Am. J. Physiol. Regul. Integr. Comp. Physiol. 2019, 316, 189–198. [Google Scholar] [CrossRef] [PubMed]
- Andres-Hernando, A.; Jensen, T.J.; Kuwabara, M.; Orlicky, D.J.; Cicerchi, C.; Li, N.; Roncal-Jimenez, C.A.; Garcia, G.E.; Ishimoto, T.; Maclean, P.S.; et al. Vasopressin mediates Fructose-induced Metabolic Syndrome by activating the V1b Receptor. JCI Insight 2021, 6, e140848. [Google Scholar] [CrossRef]
- Kim, M.; Doridot, L.; Cunniff, J.C.; Parker, T.S.; Levine, D.M.; Hellerstein, M.K.; Hudgins, L.C.; Maratos-Flier, E.; Herman, M.A. A critical role for ChREBP-mediated FGF21 secretion in hepatic fructose metabolism. Mol. Metab. 2017, 6, 14–21. [Google Scholar]
- Matthews, D.R.; Hosker, J.P.; Rudenski, A.S.; Naylor, B.A.; Treacher, D.F.; Turner, R.C. Homeostasis model assessment: Insulin resistance and beta-cell function from fasting plasma glucose and insulin concentrations in man. Diabetologia 1985, 28, 412–419. [Google Scholar] [CrossRef]
- Samms, R.J.; Lewis, J.E.; Norton, L.; Stephens, F.B.; Gaffney, C.J.; Butterfield, T.; Smith, D.P.; Cheng, C.C.; Perfield, J.W.; Adams, A.C.; et al. FGF21 Is an Insulin-Dependent Postprandial Hormone in Adult Humans. J. Clin. Endocrinol. Metab. 2017, 102, 3806–3813. [Google Scholar] [CrossRef]
- Dushay, J.R.; Toschi, E.; Mitten, E.K.; Fisher, F.M.; Herman, M.A.; Maratos-Flier, E. Fructose ingestion acutely stimulates circulating FGF21 levels in humans. Mol. Metab. 2015, 4, 51–57. [Google Scholar] [CrossRef]
- Markan, K.R.; Naber, M.C.; Ameka, M.K.; Anderegg, M.D.; Mangelsdorf, D.J.; Kliewer, S.A.; Potthoff, M.J. Circulating FGF21 is liver derived and enhances glucose uptake during refeeding and overfeeding. Diabetes 2014, 63, 4057–4063. [Google Scholar] [CrossRef] [PubMed]
- Fisher, F.M.; Maratos-Flier, E. Understanding the Physiology of FGF21. Annu. Rev. Physiol. 2016, 78, 223–241. [Google Scholar] [CrossRef]
- Zhao, C.; Liu, L.; Liu, Q.; Li, F.; Zhang, L.; Zhu, F.; Shao, T.; Barve, S.; Chen, Y.; Li, X.; et al. Fibroblast growth factor 21 is required for the therapeutic effects of Lactobacillus rhamnosus GG against fructose-induced fatty liver in mice. Mol. Metab. 2019, 29, 145–157. [Google Scholar] [CrossRef]
- Chavez, A.O.; Molina-Carrion, M.; Abdul-Ghani, M.A.; Folli, F.; Defronzo, R.A.; Tripathy, D. Circulating fibroblast growth factor-21 is elevated in impaired glucose tolerance and type 2 diabetes and correlates with muscle and hepatic insulin resistance. Diabetes Care 2009, 32, 1542–1546. [Google Scholar] [CrossRef]
- Zhang, X.; Yeung, D.C.; Karpisek, M.; Stejskal, D.; Zhou, Z.G.; Liu, F.; Wong, R.L.; Chow, W.S.; Tso, A.W.; Lam, K.S.; et al. Serum fgf21 levels are increased in obesity and are independently associated with the metabolic syndrome in humans. Diabetes 2008, 57, 1246–1253. [Google Scholar] [CrossRef]
- Dushay, J.; Chui, P.C.; Gopalakrishnan, G.S.; Varela–Rey, M.; Crawley, M.; Fisher, F.M.; Badman, M.K.; Martinez–Chantar, M.L.; Maratos–Flier, E. Increased fibroblast growth factor 21 in obesity and nonalcoholic fatty liver disease. Gastroenterology 2010, 139, 456–463. [Google Scholar] [CrossRef]
- Johnson, R.J.; Stenvinkel, P.; Andrews, P.; Sánchez-Lozada, L.G.; Nakagawa, T.; Gaucher, E.; Andres-Hernando, A.; Rodriguez-Iturbe, B.; Jimenez, C.R.; Garcia, G.; et al. Fructose metabolism as a common evolutionary pathway of survival associated with climate change, food shortage and droughts. J. Intern. Med. 2020, 287, 252–262. [Google Scholar] [CrossRef]
- García-Arroyo, F.E.; Cristóbal, M.; Arellano-Buendía, A.S.; Osorio, H.; Tapia, E.; Soto, V.; Madero, M.; Lanaspa, M.A.; Roncal-Jiménez, C.; Bankir, L.; et al. Rehydration with soft drink-like beverages exacerbates dehydration and worsens dehydration-associated renal injury. Am. J. Physiol. Regul. Integr. Comp. Physiol. 2016, 311, 57–65. [Google Scholar] [CrossRef]
- García-Arroyo, F.E.; Tapia, E.; Blas-Marron, M.G.; Gonzaga, G.; Silverio, O.; Cristóbal, M.; Osorio, H.; Arellano-Buendía, A.S.; Zazueta, C.; Aparicio-Trejo, O.E.; et al. Vasopressin mediates the renal damage induced by limited fructose rehydration in recurrently dehydrated rats. Int. J. Biol. Sci. 2017, 13, 961–975. [Google Scholar] [CrossRef]
- Wolf, J.P.; Nguyen, N.U.; Dumoulin, G.; Berthelay, S. Influence of hypertonic monosaccharide infusions on the release of plasma arginine vasopressin in normal humans. Horm. Metab. Res. 1992, 24, 379–383. [Google Scholar] [CrossRef] [PubMed]
- Afsar, B.; Turkmen, K.; Covic, A.; Kanbay, M. An update on coronary artery disease and chronic kidney disease. Int. J. Nephrol. 2014, 2014, 767424. [Google Scholar] [CrossRef] [PubMed]
- Cirillo, P.; Gersch, M.S.; Mu, W.; Scherer, P.M.; Kim, K.M.; Gesualdo, L.; Henderson, G.N.; Johnson, R.J.; Sautin, Y.Y. Ketohexokinase-dependent metabolism of fructose induces proinflammatory mediators in proximal tubular cells. J. Am. Soc. Nephrol. 2009, 20, 545–553. [Google Scholar] [CrossRef] [PubMed]
- Johnson, R.J.; Sanchez-Lozada, L.G.; Nakagawa, T. The Effect of Fructose on Renal Biology and Disease. J. Am. Soc. Nephrol. 2010, 21, 2036–2039. [Google Scholar] [CrossRef]
- Capes, S.E.; Hunt, D.; Malmberg, K.; Gerstein, H.C. Stress hyperglycaemia and increased risk of death after myocardial infarction in patients with and without diabetes: A systematic overview. Lancet 2000, 355, 773–778. [Google Scholar] [CrossRef]
- Kanbay, M.; Yilmaz, S.; Dincer, N.; Ortiz, A.; Sag, A.A.; Covic, A.; Sánchez-Lozada, L.G.; Lanaspa, M.A.; Cherney, D.Z.; Johnson, R.J.; et al. Antidiuretic hormone and serum osmolarity physiology and related outcomes: What is old, what is new, and what is unknown? J. Clin. Endocrinol. Metab. 2019, 104, 5406–5420. [Google Scholar] [CrossRef]
- Kanbay, M.; Siriopol, D.; Ozdogan, E.; Afsar, B.; Ertuglu, L.A.; Grigore, M.; Sag, A.A.; Kuwabara, M.; Lanaspa, M.A.; Ortiz, A.; et al. Serum osmolarity as a potential predictor for contrast-induced nephropathy following elective coronary angiography. Int. Urol. Nephrol. 2020, 52, 541–547. [Google Scholar] [CrossRef]
- Kuwabara, M.; Kanbay, M.; Niwa, K.; Ae, R.; Andres-Hernando, A.; Roncal-Jimenez, C.A.; Garcia, G.; Sánchez-Lozada, L.G.; Rodriguez-Iturbe, B.; Hisatome, I.; et al. Hyperosmolarity and increased serum sodium concentration are risks for developing hypertension regardless of salt intake: A five-year cohort study in Japan. Nutrients 2020, 12, 1422. [Google Scholar] [CrossRef] [PubMed]
- Kanbay, M.; Aslan, G.; Afsar, B.; Dagel, T.; Siriopol, D.; Kuwabara, M.; Incir, S.; Camkiran, V.; Rodriguez-Iturbe, B.; Lanaspa, M.A.; et al. Acute effects of salt on blood pressure are mediated by serum osmolality. J. Clin. Hypertens. 2018, 20, 1447–1454. [Google Scholar] [CrossRef] [PubMed]
- Stookey, J.D.; Kavouras, S.; Suh, H.; Lang, F. Underhydration is associated with obesity, Chronic Diseases, and Death within 3 to 6 Years in the U.S. Population Aged 51–70 Years. Nutrients 2020, 12, 905. [Google Scholar] [CrossRef] [PubMed]
- Enhörning, S.; Bankir, L.; Bouby, N.; Struck, J.; Hedblad, B.; Persson, M.; Morgenthaler, N.G.; Nilsson, P.M.; Melander, O. Copeptin, a marker of vasopressin, in abdominal obesity, diabetes and microalbuminuria: The prospective Malmo Diet and Cancer Study cardiovascular cohort. Int. J. Obes. 2013, 37, 598–603. [Google Scholar] [CrossRef]
- Enhorning, S.; Struck, J.; Wirfalt, E.; Hedblad, B.; Morgenthaler, N.G.; Melander, O. Plasma copeptin, a unifying factor behind the metabolic syndrome. J. Clin. Endocrinol. Metab. 2011, 96, 1065–1072. [Google Scholar] [CrossRef]
- De Oliveira, E.P.; Burini, R.C. High plasma uric acid concentration: Causes and consequences. Diabetol. Metab. Syndr. 2012, 4, 1–7. [Google Scholar] [CrossRef]
- Hallfrisch, J.; Ellwood, K.; Michaelis OEt Reiser, S.; Prather, E.S. Plasma fructose, uric acid, and inorganic phosphorus responses of hyperinsulinemic men fed fructose. J. Am. Coll. Nutr. 1986, 5, 61–68. [Google Scholar] [CrossRef]
- Faroqui, M.; Mirza, S.K.; Aarwal, B.R.; Faroqui, M. Physical and nutritional analysis of apple juice samples. Anal. Chem. 2009, 8, 26–28. [Google Scholar]
- Abdelmalek, M.F.; Lazo, M.; Horska, A.; Bonekamp, S.; Lipkin, E.W.; Balasubramanyam, A.; Bantle, J.P.; Johnson, R.J.; Diehl, A.M.; Clark, J.M.; et al. Higher dietary fructose is associated with impaired hepatic adenosine triphosphate homeostasis in obese individuals with type 2 diabetes. Hepatology 2012, 56, 952–960. [Google Scholar] [CrossRef] [PubMed]
- Nakagawa, T.; Hu, H.; Zharikov, S.; Tuttle, K.R.; Short, R.A.; Glushakova, O.; Ouyang, X.; Feig, D.I.; Block, E.R.; Herrera-Acosta, J.; et al. A causal role for uric acid in fructose-induced metabolic syndrome. Am. J. Physiol. Renal Physiol. 2006, 290, 625–631. [Google Scholar] [CrossRef] [PubMed]
- Johnson, R.J.; Perez-Pozo, S.E.; Sautin, Y.Y.; Manitius, J.; Sanchez-Lozada, L.G.; Feig, D.I.; Shafiu, M.; Segal, M.; Glassock, R.J.; Shimada, M.; et al. Hypothesis: Could excessive fructose intake and uric acid cause type 2 diabetes? Endocr. Rev. 2009, 30, 96–116. [Google Scholar] [CrossRef]
- Kanbay, M.; Solak, Y.; Dogan, E.; Lanaspa, M.A.; Covic, A. Uric acid in hypertension and renal disease: The chicken or the egg? Blood Purif. 2010, 30, 288–295. [Google Scholar] [CrossRef]


| Characteristics | 30 Healthy Subjects | |||
|---|---|---|---|---|
| Overall | Group 1 | Group 2 | p | |
| Number | 30 | 15 | 15 | |
| Age, years (mean ± SD) | 26.1 ± 3.7 | 25.33 ± 1.8 | 26.9 ± 4.9 | 0.7 |
| Gender (male) n (%) | 13 (43.3%) | 6 (40%) | 7 (46.7%) | 0.9 |
| Smoking, n (%) | 4 (13.3%) | 2 (13.3%) | 2 (13.3%) | 0.9 |
| BMI, kg/m2 (median ± IQR) | 22.9 ± 4.1 | 22.86 ± 6.3 | 22.9 ± 2.1 | 0.8 |
| Systolic BP (mmHg) | 109.2 (105.9 ± 113.3) | 108.5 (104.8 ± 112.2) | 109.5 (105.8 ± 113.2) | 0.9 |
| Diastolic BP (mmHg) | 74.2 (70.9 ± 76.3) | 74.5 (70.8 ± 76.8) | 73.9 (70.9 ± 75.9) | 0.9 |
| Hemoglobin (median ± IQR) | 14.4 ± 3.1 | 14.1 ± 2.5 | 14.6 ± 3.1 | 0.5 |
| ALT-U/L (median ± IQR) | 12.9 ± 11.7 | 11 ± 9.2 | 14.3 ± 22.7 | 0.1 |
| GGT-U/L (median ± IQR) | 12 ± 10 | 12 ± 8 | 12 ± 13 | 0.8 |
| Creatinine-mg/dL (median ± IQR) | 0.7 ± 0.3 | 0.7 ± 0.2 | 0.8 ± 0.3 | 0.5 |
| Baseline | 15 min | 30 min | 60 min | 120 min | p-Value a | p-Value b | |
|---|---|---|---|---|---|---|---|
| Glucose (mg/dL) | <0.001 | <0.001 | |||||
| Group 1 | 66.4 ± 6.3 | 76 ± 18 | 84.6 ± 10 | 86.1 ± 1.5 | 76.6 ± 15.1 | ||
| Group 2 | 78 ± 18.7 | 102.5 ± 17.3 | 113.6 ± 25 | 85.3 ± 30.2 | 77.8 ± 9.2 | ||
| Insulin (μIU/mL) | <0.001 | 0.001 | |||||
| Group 1 | 8.4 ± 5.5 | 15.8 ± 10.5 | 33.8 ± 21.7 | 48.3 ± 35.8 | 10.7 ± 5.9 | ||
| Group 2 | 11.9 ± 7.4 | 35.7 ± 19.4 | 49 ± 36.2 | 24.7 ± 24.4 | 8.7 ± 7.4 | ||
| HOMA-IR score | <0.001 | <0.001 | |||||
| Group 1 | 1.7 ± 1.0 | 4.5 ± 4.0 | 7.9 ± 3.9 | 11 ± 5.7 | 3.1 ± 4.4 | ||
| Group 2 | 2.0 ± 1.0 | 12.3 ± 9.6 | 15.4 ± 10.9 | 8.0 ± 4.1 | 3.3 ± 2.2 | ||
| FGF-21 (pg/mL) | <0.001 | <0.001 | |||||
| Group 1 | 16.4 ± 17.2 | 20.5 ± 13.7 | 22.1 ± 16.2 | 24.5 ± 15.6 | 18.9 ± 14.1 | ||
| Group 2 | 18.3 ± 15.4 | 31 ± 12.7 | 36.8 ± 11.2 | 43.9 ± 17.1 | 25.4 ± 17.2 | ||
| Copeptin (pmol/L) | <0.001 | 0.044 | |||||
| Group 1 | 45.6 ± 52.9 | 56.5 ±46.8 | 60.1 ± 52.4 | 54.8 ± 53 | 47.9 ± 35.9 | ||
| Group 2 | 58.5 ± 61.8 | 98.7 ± 64.6 | 99.2 ± 57.6 | 74.7 ± 60.9 | 60.4 ± 30.2 | ||
| Osmolarity (mOsm/L) | <0.001 | <0.001 | |||||
| Group 1 | 283.7 ± 5.6 | 284.5 ± 8.7 | 283.9 ± 6.5 | 284.5 ± 6.6 | 284.9 ± 7.9 | ||
| Group 2 | 284.7 ± 5.4 | 289.2 ± 6.6 | 291.8 ± 4.9 | 289.8 ± 6.8 | 286.2 ± 5.3 | ||
| Sodium (mmol/L) | <0.001 | <0.001 | |||||
| Group 1 | 137.6 ± 1.8 | 137.9 ± 2.0 | 138 ± 1.6 | 137.9 ± 1.5 | 138.2 ± 1.7 | ||
| Group 2 | 138.1 ± 1.2 | 140.2 ± 1.0 | 141.9 ± 0.8 | 139.7 ± 0.8 | 138.5 ± 1.2 | ||
| BUN (mg/dL) | <0.001 | <0.001 | |||||
| Group 1 | 11.9 ± 4 | 11.7 ± 4.0 | 11.8 ± 3.9 | 11.3 ± 3.6 | 10.5 ± 3.2 | ||
| Group 2 | 12.7 ± 4.0 | 15.3 ± 3.4 | 18.1 ± 4.0 | 14.5 ± 3.2 | 11.6 ± 3.5 | ||
| Lactic acid (mmol/L) | <0.001 | <0.001 | |||||
| Group 1 | 0.9 ± 0.5 | 1 ± 0.4 | 1.5 ± 0.5 | 1.9 ± 0.7 | 1.2 ± 0.4 | ||
| Group 2 | 1 ± 0.4 | 1.8 ± 0.4 | 2.6 ± 0.8 | 2.5 ± 0.8 | 1.4 ± 0.7 | ||
| Phosphate (mg/dL) | 0.022 | <0.001 | |||||
| Group 1 | 3.4 ± 0.8 | 3.4 ± 0.7 | 3.5 ± 0.6 | 3.4 ± 0.7 | 3.5 ± 0.8 | ||
| Group 2 | 3.5 ± 0.4 | 3.7 ± 0.2 | 3.9 ± 0.3 | 3.9 ± 0.7 | 3.8 ± 0.7 | ||
| Uric acid (mg/dL) | <0.001 | 0.48 | |||||
| Group 1 | 4.3 ± 1.5 | 4.3 ± 1.4 | 4.5 ± 1.7 | 4.6 ± 1.7 | 4.5 ± 1.7 | ||
| Group 2 | 4.4 ± 1.1 | 4.6 ± 1.1 | 4.7 ± 0.9 | 4.8 ± 1.1 | 4.6 ± 1.3 | ||
| Baseline–15 min | Baseline–30 min | Baseline–60 min | Baseline–120 min | |
|---|---|---|---|---|
| Glucose (mg/dL) | ||||
| Group 1 | 11.6 ± 9.2 | 20.5 ± 7.9 | 19.7 ± 13.7 | 8.3 ± 112.7 |
| Group 2 | 31.7 ± 14.7 | 38.2 ± 13.4 | 13.6 ± 15.7 | 6.7 ± 8.3 |
| p-Value | <0.001 | <0.001 | 0.213 | 0.983 |
| Insulin (μIU/mL) | ||||
| Group 1 | 11.4 ± 13.5 | 22.9 ± 12.8 | 33.9 ± 20.1 | 6.1 ± 20.2 |
| Group 2 | 35.8 ± 31.3 | 42.9 ± 30.2 | 18.6 ± 15.4 | 1.9 ± 6.8 |
| p-Value | 0.004 | 0.033 | 0.019 | 0.494 |
| HOMA-IR (Homeostatic model assessment) | ||||
| Group 1 | 2.9 ± 3.7 | 6.2 ± 3.6 | 9.4 ± 6.1 | 1.5 ± 4.6 |
| Group 2 | 10.3 ± 9.8 | 13.4 ± 10.7 | 6.0 ± 4.2 | 1.2 ± 1.8 |
| p-Value | 0.003 | 0.040 | 0.078 | 0.494 |
| FGF-21 (pg/mL) | ||||
| Group 1 | 3.7 ± 7.1 | 6.6 ± 7.5 | 6.5 ± 6.9 | −1.3 ± 8.7 |
| Group 2 | 14.8 ± 7.5 | 21.9 ± 7.4 | 24.5 ± 11.7 | 8.9 ± 8.4 |
| p-Value | <0.001 | <0.001 | <0.001 | 0.001 |
| Copeptin (pmol/L) | ||||
| Group 1 | 18.8 ± 30.6 | 23.3 ± 36.4 | 20.3 ± 31.9 | 2.6 ± 10.6 |
| Group 2 | 35.2 ± 24.1 | 46.2 ± 28 | 20.2 ± 24.2 | 2.7 ± 15.4 |
| p-Value | 0.005 | 0.001 | 0.576 | 0.604 |
| Osmolarity (mOsm/L) | ||||
| Group 1 | 0.5 ± 2.5 | 1.2 ± 1.5 | 1.3 ± 1.3 | 0.8 ± 2 |
| Group 2 | 5.1 ± 2.3 | 6.4 ± 2.1 | 4.3 ± 3.7 | 1.5 ± 2.3 |
| p-Value | <0.001 | <0.001 | 0.044 | 0.494 |
| Sodium (mmol/L) | ||||
| Group 1 | 2.9 ± 3.7 | 6.2 ± 3.6 | 9.4 ± 6.1 | 1.5 ± 4.6 |
| Group 2 | 10.3 ± 9.8 | 13.4 ± 10.7 | 6.0 ± 4.2 | 1.2 ± 1.8 |
| p-Value | 0.002 | <0.001 | 0.013 | 0.656 |
| BUN (mg/dL) | ||||
| Group 1 | 0.3 ± 1.7 | 0.4 ± 1.4 | 0.3 ± 1.2 | 0.6 ± 1.7 |
| Group 2 | 2.1 ± 0.9 | 3.8 ± 1.0 | 1.6 ± 1.2 | 0.3 ± 1.2 |
| p-Value | <0.001 | <0.001 | 0.003 | 0.827 |
| Lactic acid (mmol/L) | ||||
| Group 1 | 0.1 ± 0.3 | 0.6 ± 0.5 | 1.1 ± 0.6 | 0.5 ± 0.7 |
| Group 2 | 0.7 ± 0.3 | 1.5 ± 0.5 | 1.5 ± 0.5 | 1.5 ± 0.4 |
| p-Value | <0.001 | <0.001 | 0.04 | 0.351 |
| Phosphate (mg/dL) | ||||
| Group 1 | −0.1 ± 0.2 | −0.1 ± 0.1 | −0.2 ± 0.3 | 0.04 ± 0.5 |
| Group 2 | 0.1 ± 0.1 | 0.3 ± 0.2 | 0.4 ± 0.3 | 0.3 ± 0.2 |
| p-Value | 0.001 | <0.001 | <0.001 | 0.026 |
| Uric acid (mg/dL) | ||||
| Group 1 | 0.1 ± 0.1 | 0.2 ± 0.3 | 0.3 ± 0.3 | 0.3 ± 0.3 |
| Group 2 | 0.1 ± 0.2 | 0.3 ± 0.9 | 0.4 ± 0.3 | 0.2 ± 0.3 |
| p-Value | 0.931 | 0.308 | 0.411 | 0.675 |
Publisher’s Note: MDPI stays neutral with regard to jurisdictional claims in published maps and institutional affiliations. |
© 2021 by the authors. Licensee MDPI, Basel, Switzerland. This article is an open access article distributed under the terms and conditions of the Creative Commons Attribution (CC BY) license (https://creativecommons.org/licenses/by/4.0/).
Share and Cite
Kanbay, M.; Guler, B.; Ertuglu, L.A.; Dagel, T.; Afsar, B.; Incir, S.; Baygul, A.; Covic, A.; Andres-Hernando, A.; Sánchez-Lozada, L.G.; et al. The Speed of Ingestion of a Sugary Beverage Has an Effect on the Acute Metabolic Response to Fructose. Nutrients 2021, 13, 1916. https://doi.org/10.3390/nu13061916
Kanbay M, Guler B, Ertuglu LA, Dagel T, Afsar B, Incir S, Baygul A, Covic A, Andres-Hernando A, Sánchez-Lozada LG, et al. The Speed of Ingestion of a Sugary Beverage Has an Effect on the Acute Metabolic Response to Fructose. Nutrients. 2021; 13(6):1916. https://doi.org/10.3390/nu13061916
Chicago/Turabian StyleKanbay, Mehmet, Begum Guler, Lale A. Ertuglu, Tuncay Dagel, Baris Afsar, Said Incir, Arzu Baygul, Adrian Covic, Ana Andres-Hernando, Laura Gabriela Sánchez-Lozada, and et al. 2021. "The Speed of Ingestion of a Sugary Beverage Has an Effect on the Acute Metabolic Response to Fructose" Nutrients 13, no. 6: 1916. https://doi.org/10.3390/nu13061916
APA StyleKanbay, M., Guler, B., Ertuglu, L. A., Dagel, T., Afsar, B., Incir, S., Baygul, A., Covic, A., Andres-Hernando, A., Sánchez-Lozada, L. G., Lanaspa, M. A., & Johnson, R. J. (2021). The Speed of Ingestion of a Sugary Beverage Has an Effect on the Acute Metabolic Response to Fructose. Nutrients, 13(6), 1916. https://doi.org/10.3390/nu13061916