
Availability of a Flavored Beverage and Impact on Children’s Hydration Status, Sleep, and Mood

 , , and
Abstract
1. Introduction
2. Materials and Methods
2.1. Beverage
Experimental Approach to the Problem
2.2. Participants
2.3. Overview of the Study Procedures
2.4. Weekly Lab Visits
2.5. At Home Data Collection
2.6. Statistical Analysis
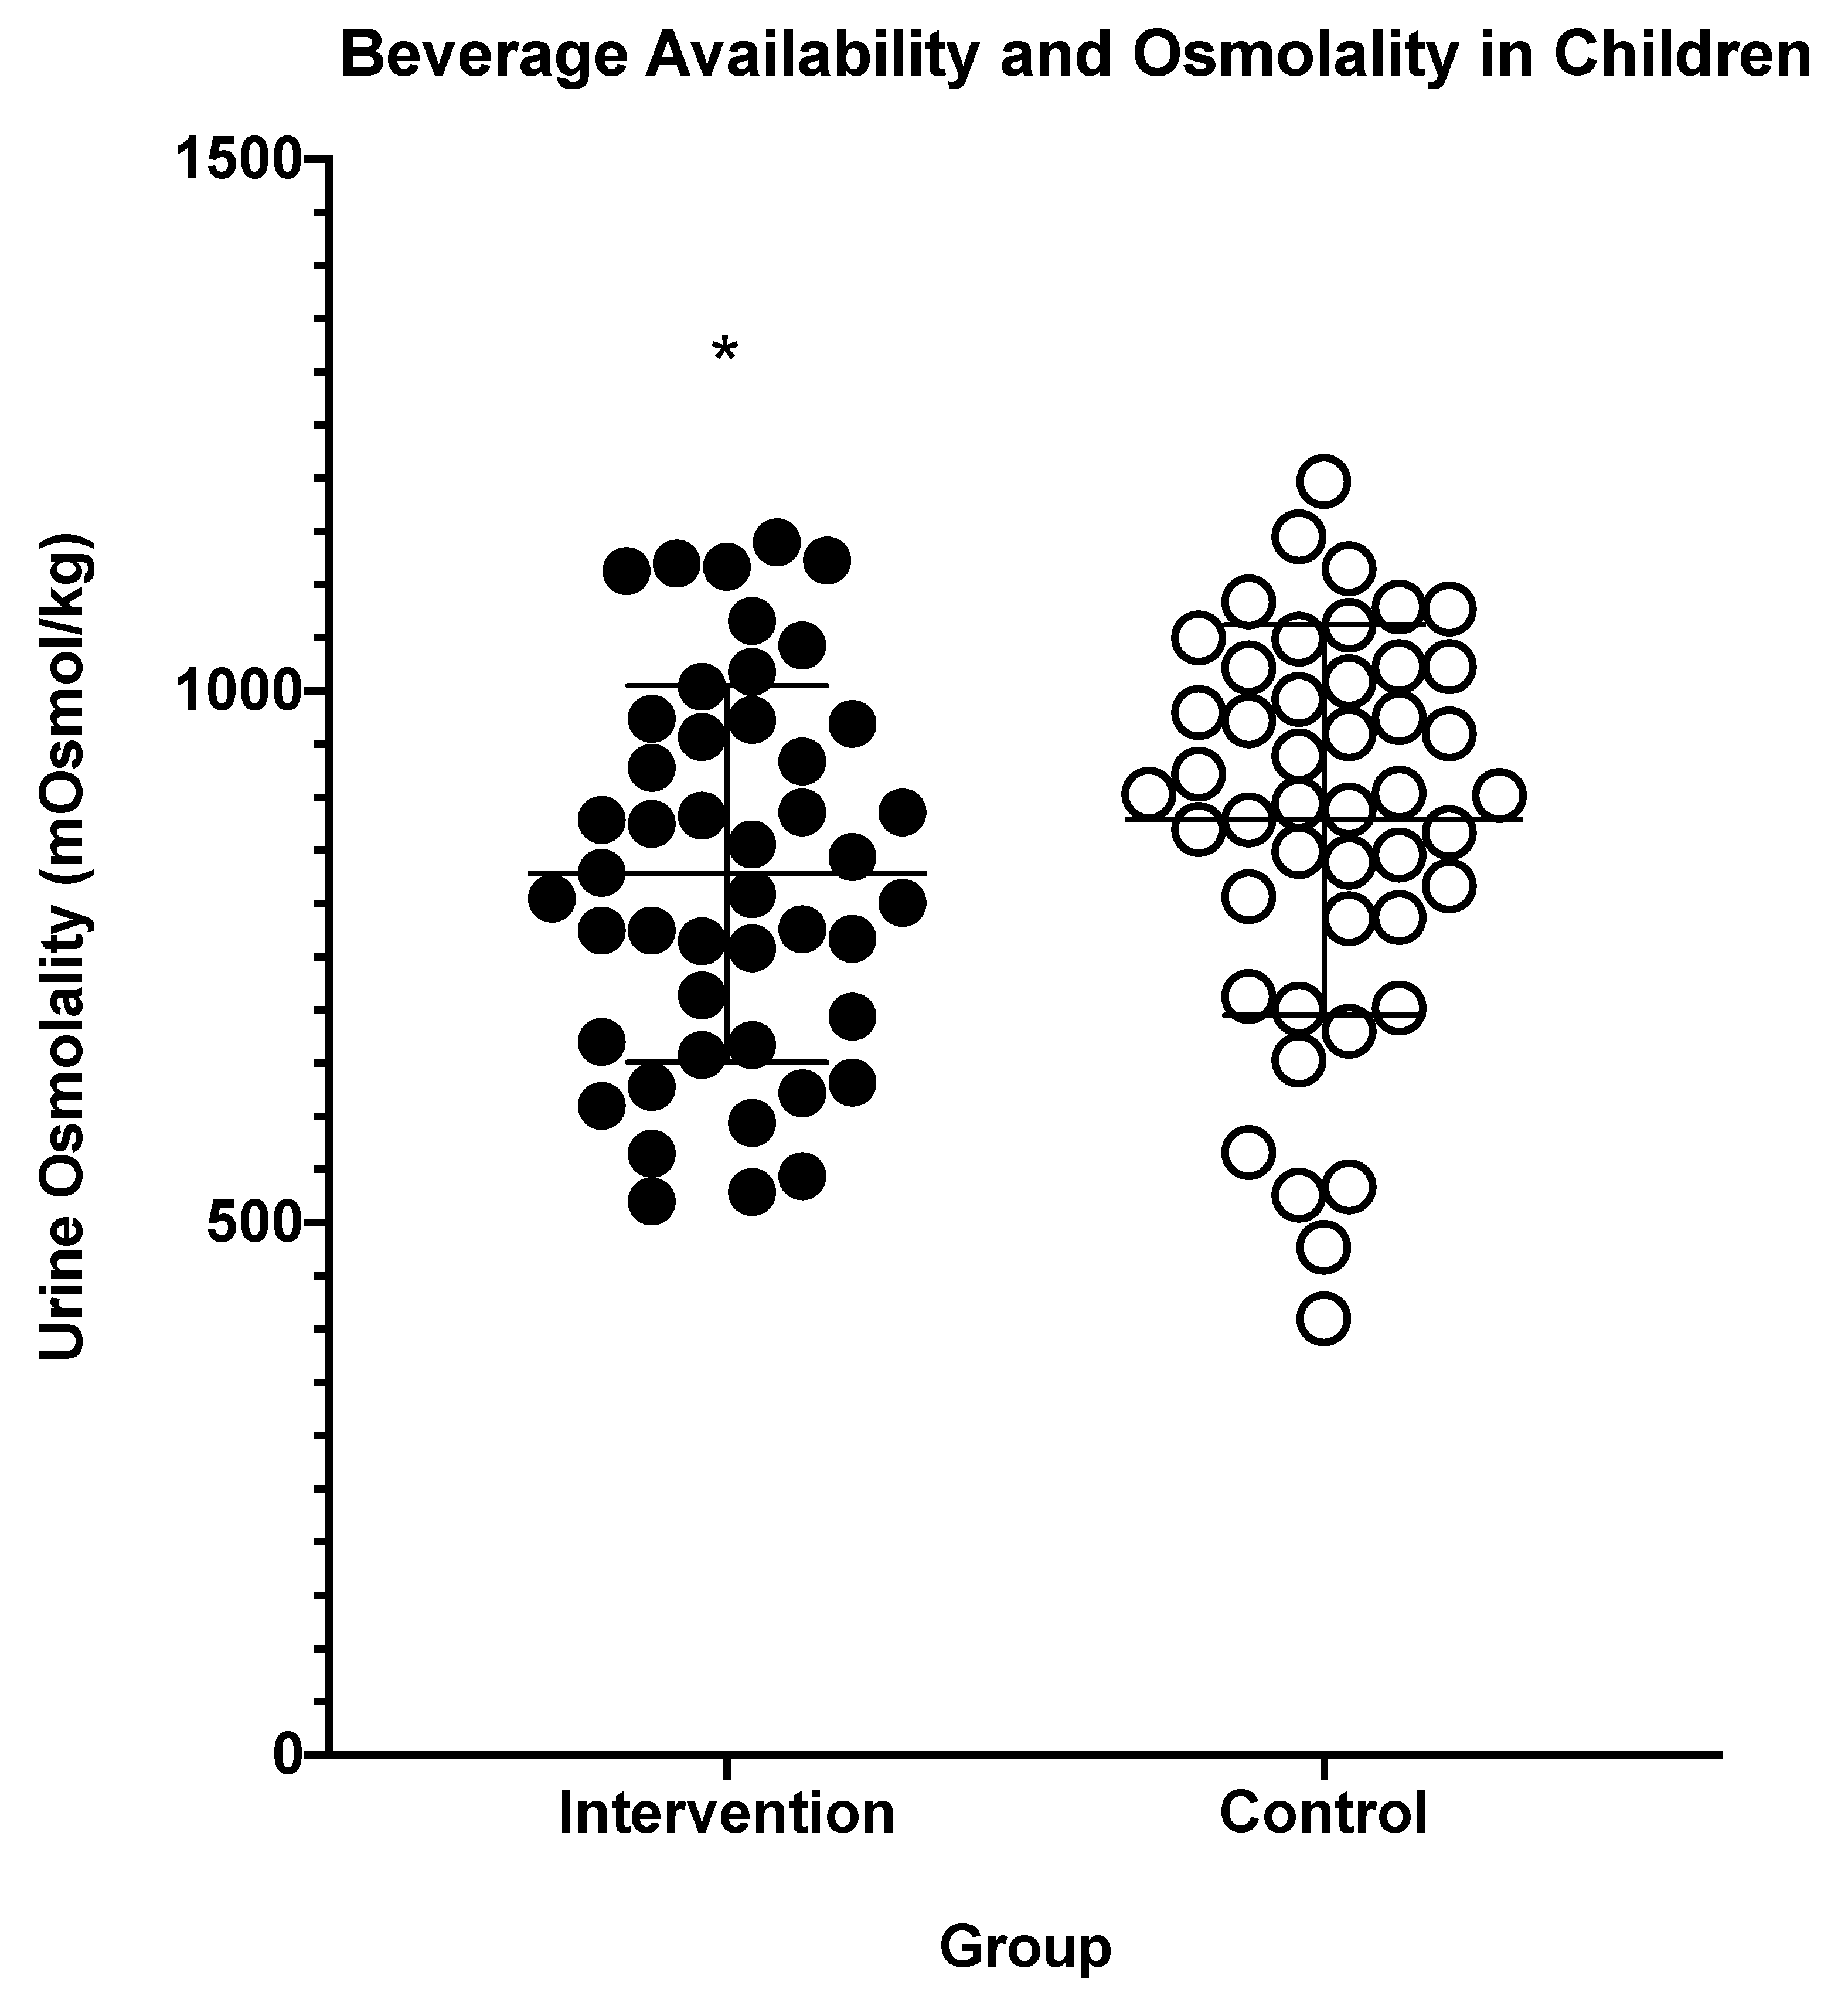
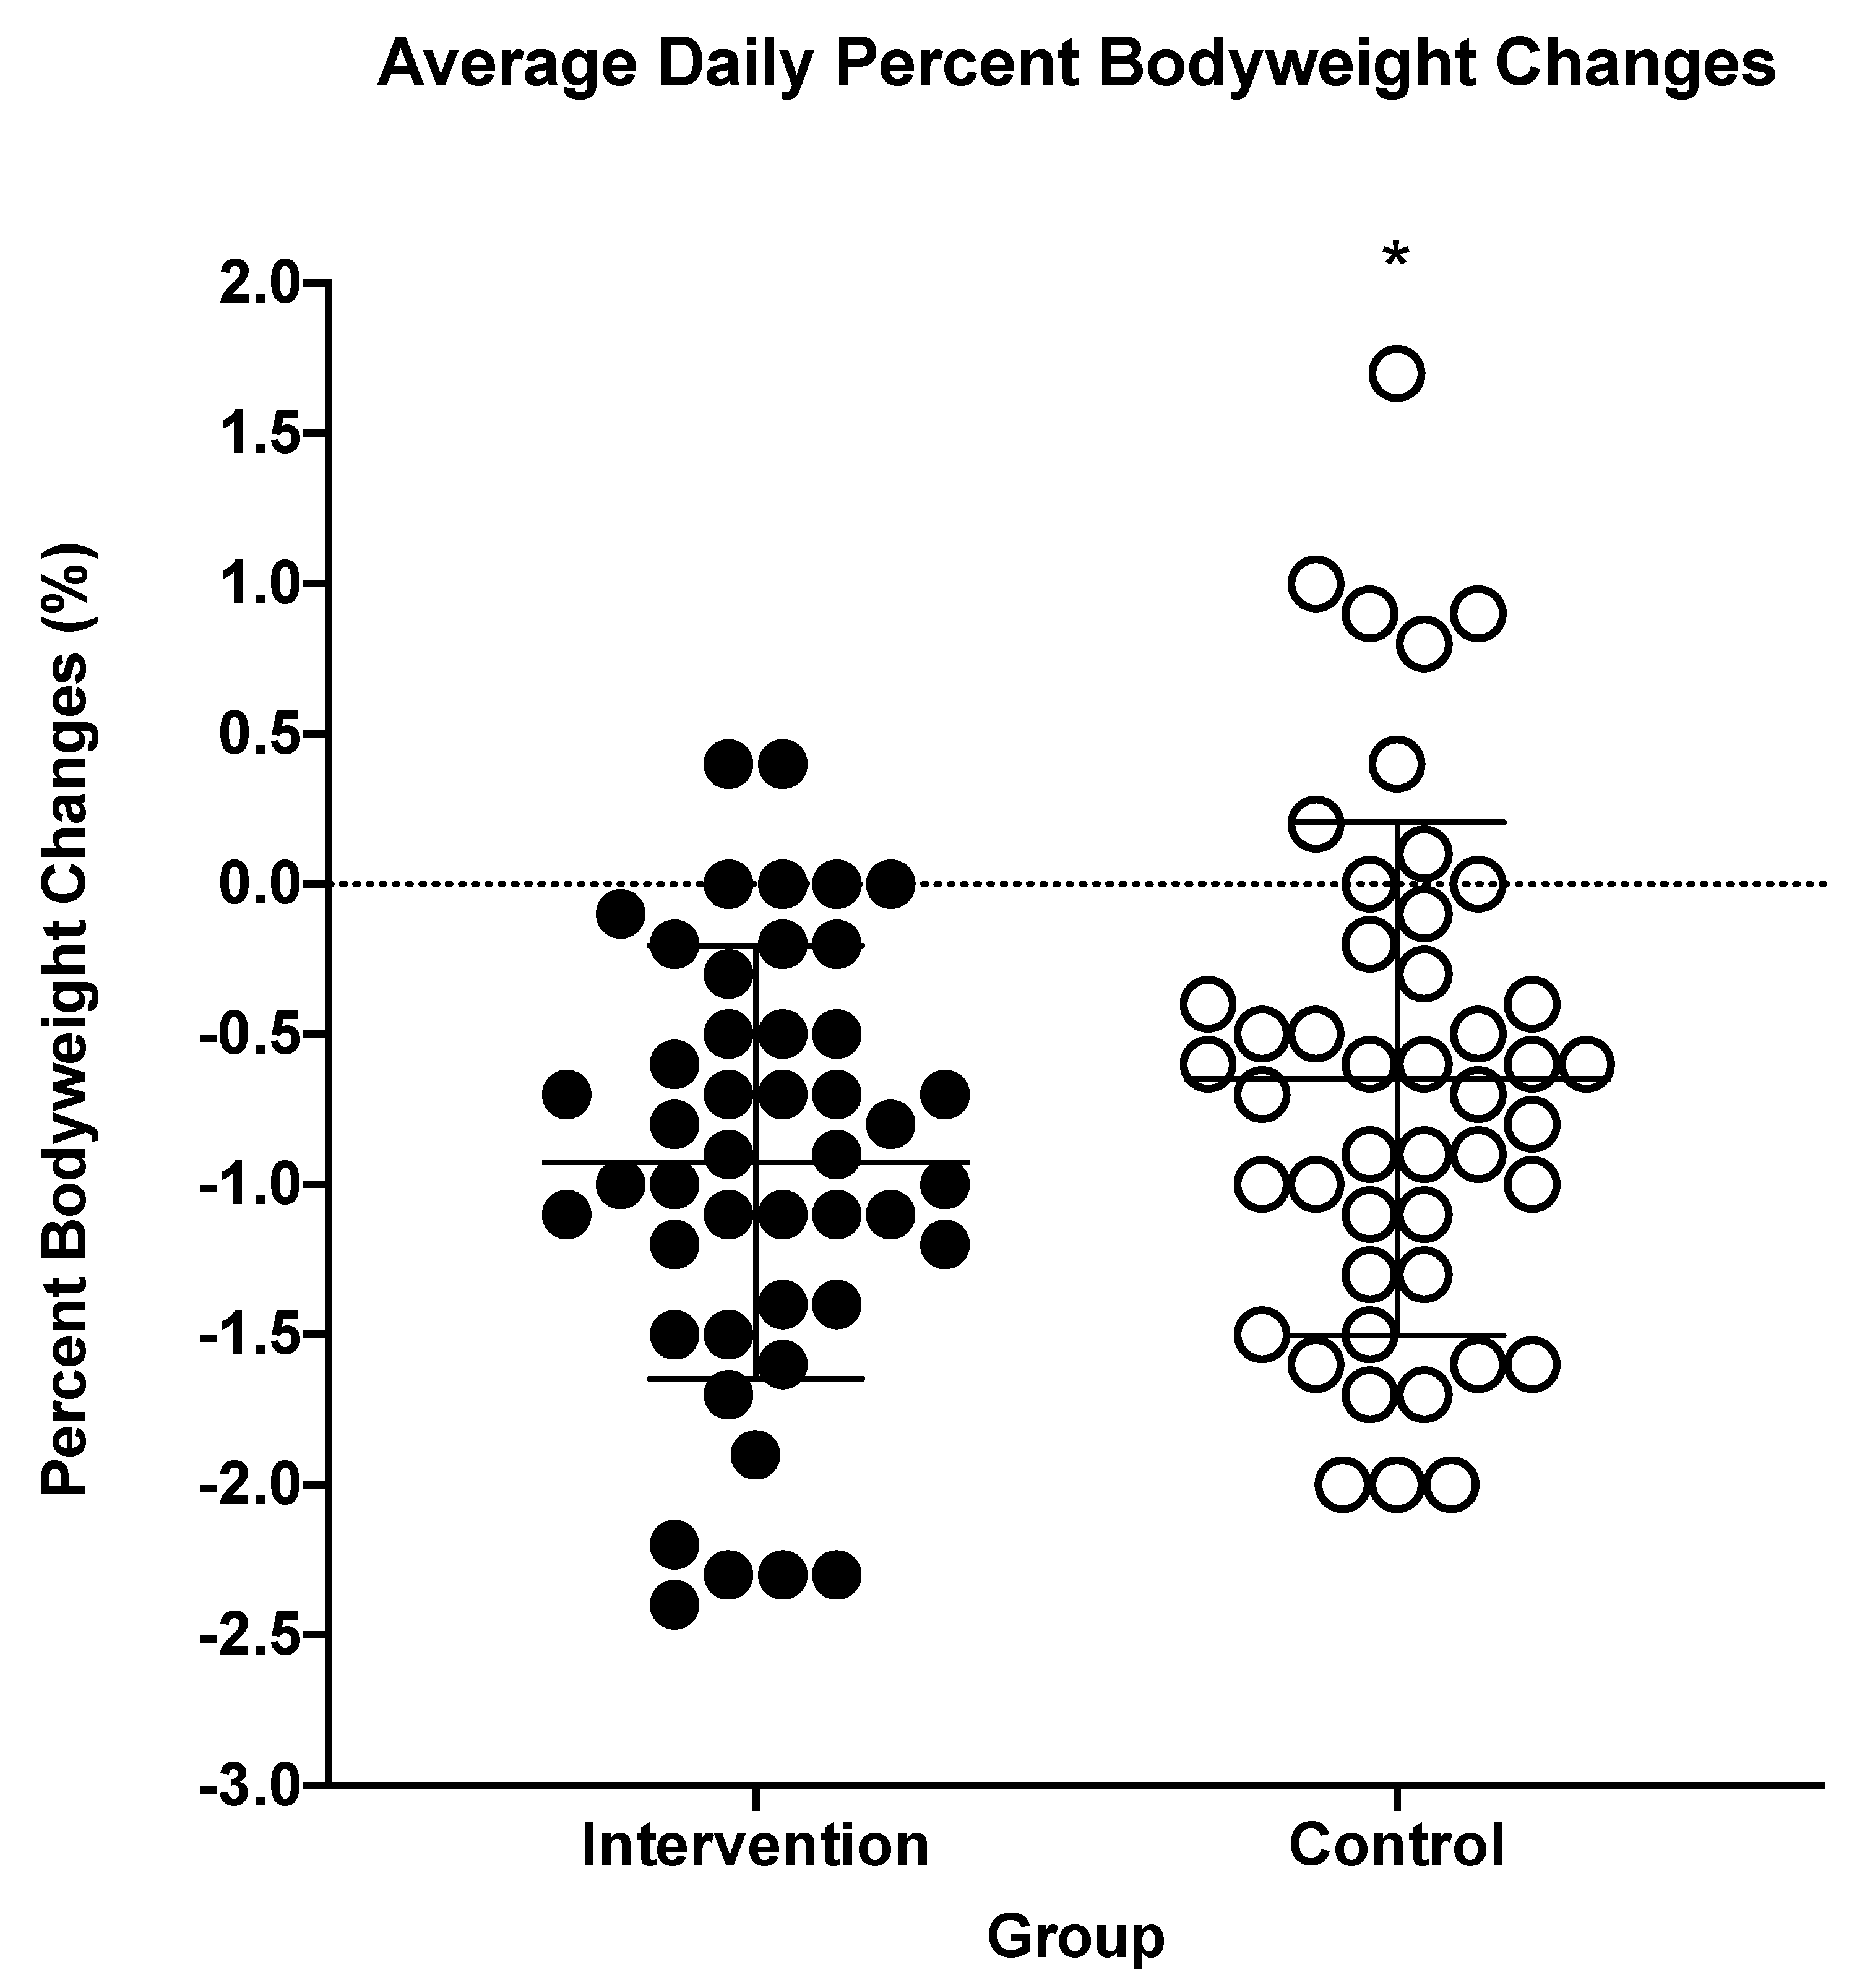
3. Results
4. Discussion
5. Limitations
6. Conclusions
Author Contributions
Funding
Institutional Review Board Statement
Informed Consent Statement
Data Availability Statement
Acknowledgments
Conflicts of Interest
References
- Khan, N.A.; Westfall, D.R.; Jones, A.R.; Sinn, M.A.; Bottin, J.H.; Perrier, E.T.; Hillman, C.H. A 4-d Water Intake Intervention Increases Hydration and Cognitive Flexibility among Preadolescent Children. J. Nutr. 2019, 149, 2255–2264. [Google Scholar] [CrossRef] [PubMed]
- Suh, H.; Kavouras, S.A. Water intake and hydration state in children. Eur. J. Nutr. 2019, 58, 475–496. [Google Scholar] [CrossRef] [PubMed]
- Kenney, E.L.; Long, M.W.; Cradock, A.L.; Gortmaker, S.L. Prevalence of Inadequate Hydration Among US Children and Disparities by Gender and Race/Ethnicity: National Health and Nutrition Examination Survey, 2009–2012. Am. J. Public Health 2015, 105, e113–e118. [Google Scholar] [CrossRef] [PubMed]
- Patel, A.I.; Hampton, K.E. Encouraging consumption of water in school and child care settings: Access, challenges, and strategies for improvement. Am. J. Public Health 2011, 101, 1370–1379. [Google Scholar] [CrossRef] [PubMed]
- Ganio, M.S.; Armstrong, L.E.; Casa, D.J.; McDermott, B.P.; Lee, E.C.; Yamamoto, L.M.; Marzano, S.; Lopez, R.M.; Jimenez, L.; Le Bellego, L.; et al. Mild dehydration impairs cognitive performance and mood of men. Br. J. Nutr. 2011, 106, 1535–1543. [Google Scholar] [CrossRef] [PubMed]
- Fadda, R.; Rapinett, G.; Grathwohl, D.; Parisi, M.; Fanari, R.; Calo, C.M.; Schmitt, J. Effects of drinking supplementary water at school on cognitive performance in children. Appetite 2012, 59, 730–737. [Google Scholar] [CrossRef] [PubMed]
- Rosinger, A.Y.; Chang, A.M.; Buxton, O.M.; Li, J.; Wu, S.; Gao, X. Short sleep duration is associated with inadequate hydration: Cross-cultural evidence from US and Chinese adults. Sleep 2019, 42. [Google Scholar] [CrossRef] [PubMed]
- Jequier, E. , Constant, F. Water as an essential nutrient: The physiological basis of hydration. Eur. J. Clin. Nutr. 2010, 64, 115–123. [Google Scholar] [CrossRef] [PubMed]
- Terry, P.C.; Lane, A.M.; Lane, H.J.; Keohane, L. Development and validation of a mood measure for adolescents. J. Sports Sci. 1999, 17, 861–872. [Google Scholar] [CrossRef] [PubMed]
- Buysse, D.J.; Reynolds, C.F.; Monk, T.H., 3rd; Berman, S.R.; Kupfer, D.J. The Pittsburgh Sleep Quality Index: A new instrument for psychiatric practice and research. Psychiatry Res. 1989, 28, 193–213. [Google Scholar] [CrossRef]
- Kavouras, S.A.; Johnson, E.C.; Bougatsas, D.; Arnaoutis, G.; Panagiotakos, D.B.; Perrier, E.; Klein, A. Validation of a urine color scale for assessment of urine osmolality in healthy children. Eur. J. Nutr. 2016, 55, 907–915. [Google Scholar] [CrossRef] [PubMed]
- Adams, W.M.; Vandermark, L.W.; Belval, L.N.; Casa, D.J. The Utility of Thirst as a Measure of Hydration Status Following Exercise-Induced Dehydration. Nutrients 2019, 11, 2689. [Google Scholar] [CrossRef] [PubMed]
- Engell, D.B.; Maller, O.; Sawka, M.N.; Francesconi, R.N.; Drolet, L.; Young, A.J. Thirst and fluid intake following graded hypohydration levels in humans. Physiol. Behav. 1987, 40, 229–236. [Google Scholar] [CrossRef]
- Suh, H.; Summers, L.G.; Seal, A.D.; Colburn, A.T.; Mauromoustakos, A.; Perrier, E.T.; Bottin, J.H.; Kavouras, S.A. Afternoon urine osmolality is equivalent to 24 h for hydration assessment in healthy children. Eur. J. Clin. Nutr. 2020, 74, 884–890. [Google Scholar] [CrossRef] [PubMed]
- Youhanna, S.; Bankir, L.; Jungers, P.; Porteous, D.; Polasek, O.; Bochud, M.; Hayward, C.; Devuyst, O. Validation of Surrogates of Urine Osmolality in Population Studies. Am. J. Nephrol. 2017, 46, 26–36. [Google Scholar] [CrossRef] [PubMed]
- Cheuvront, S.N.; Sawka, M.N. Hydration assessment of athletes. Sports Sci. Exch. 2005, 18, 1–6. [Google Scholar]
- Katan, M.B.; de Ruyter, J.C.; Kuijper, L.D.; Chow, C.C.; Hall, K.D.; Olthof, M.R. Impact of Masked Replacement of Sugar-Sweetened with Sugar-Free Beverages on Body Weight Increases with Initial BMI: Secondary Analysis of Data from an 18 Month Double-Blind Trial in Children. PLoS ONE 2016, 11, e0159771. [Google Scholar] [CrossRef] [PubMed]
- De Ruyter, J.C.; Olthof, M.R.; Seidell, J.C.; Katan, M.B. A trial of sugar-free or sugar-sweetened beverages and body weight in children. N. Engl. J. Med. 2012, 367, 1397–1406. [Google Scholar] [CrossRef] [PubMed]


| Variable | Familiarization | Baseline | Daily Data Collection During Weeks 1, 2, 4, 5 (at Home) | Weekly Visit with Researchers (End of Weeks 1–5) |
|---|---|---|---|---|
| Body mass | X | X | X | X |
| Urine Sample | X | X | ||
| Urine Specific Gravity | X | X | ||
| Urine Osmolality | X | X | ||
| AM Urine Color | X | X | X | |
| PM Urine Color | X | X | X | |
| Thirst Sensation | X | X | X | X |
| Sleep Questionnaire | X | X | X | |
| Mood (POMS) | X | X | X |
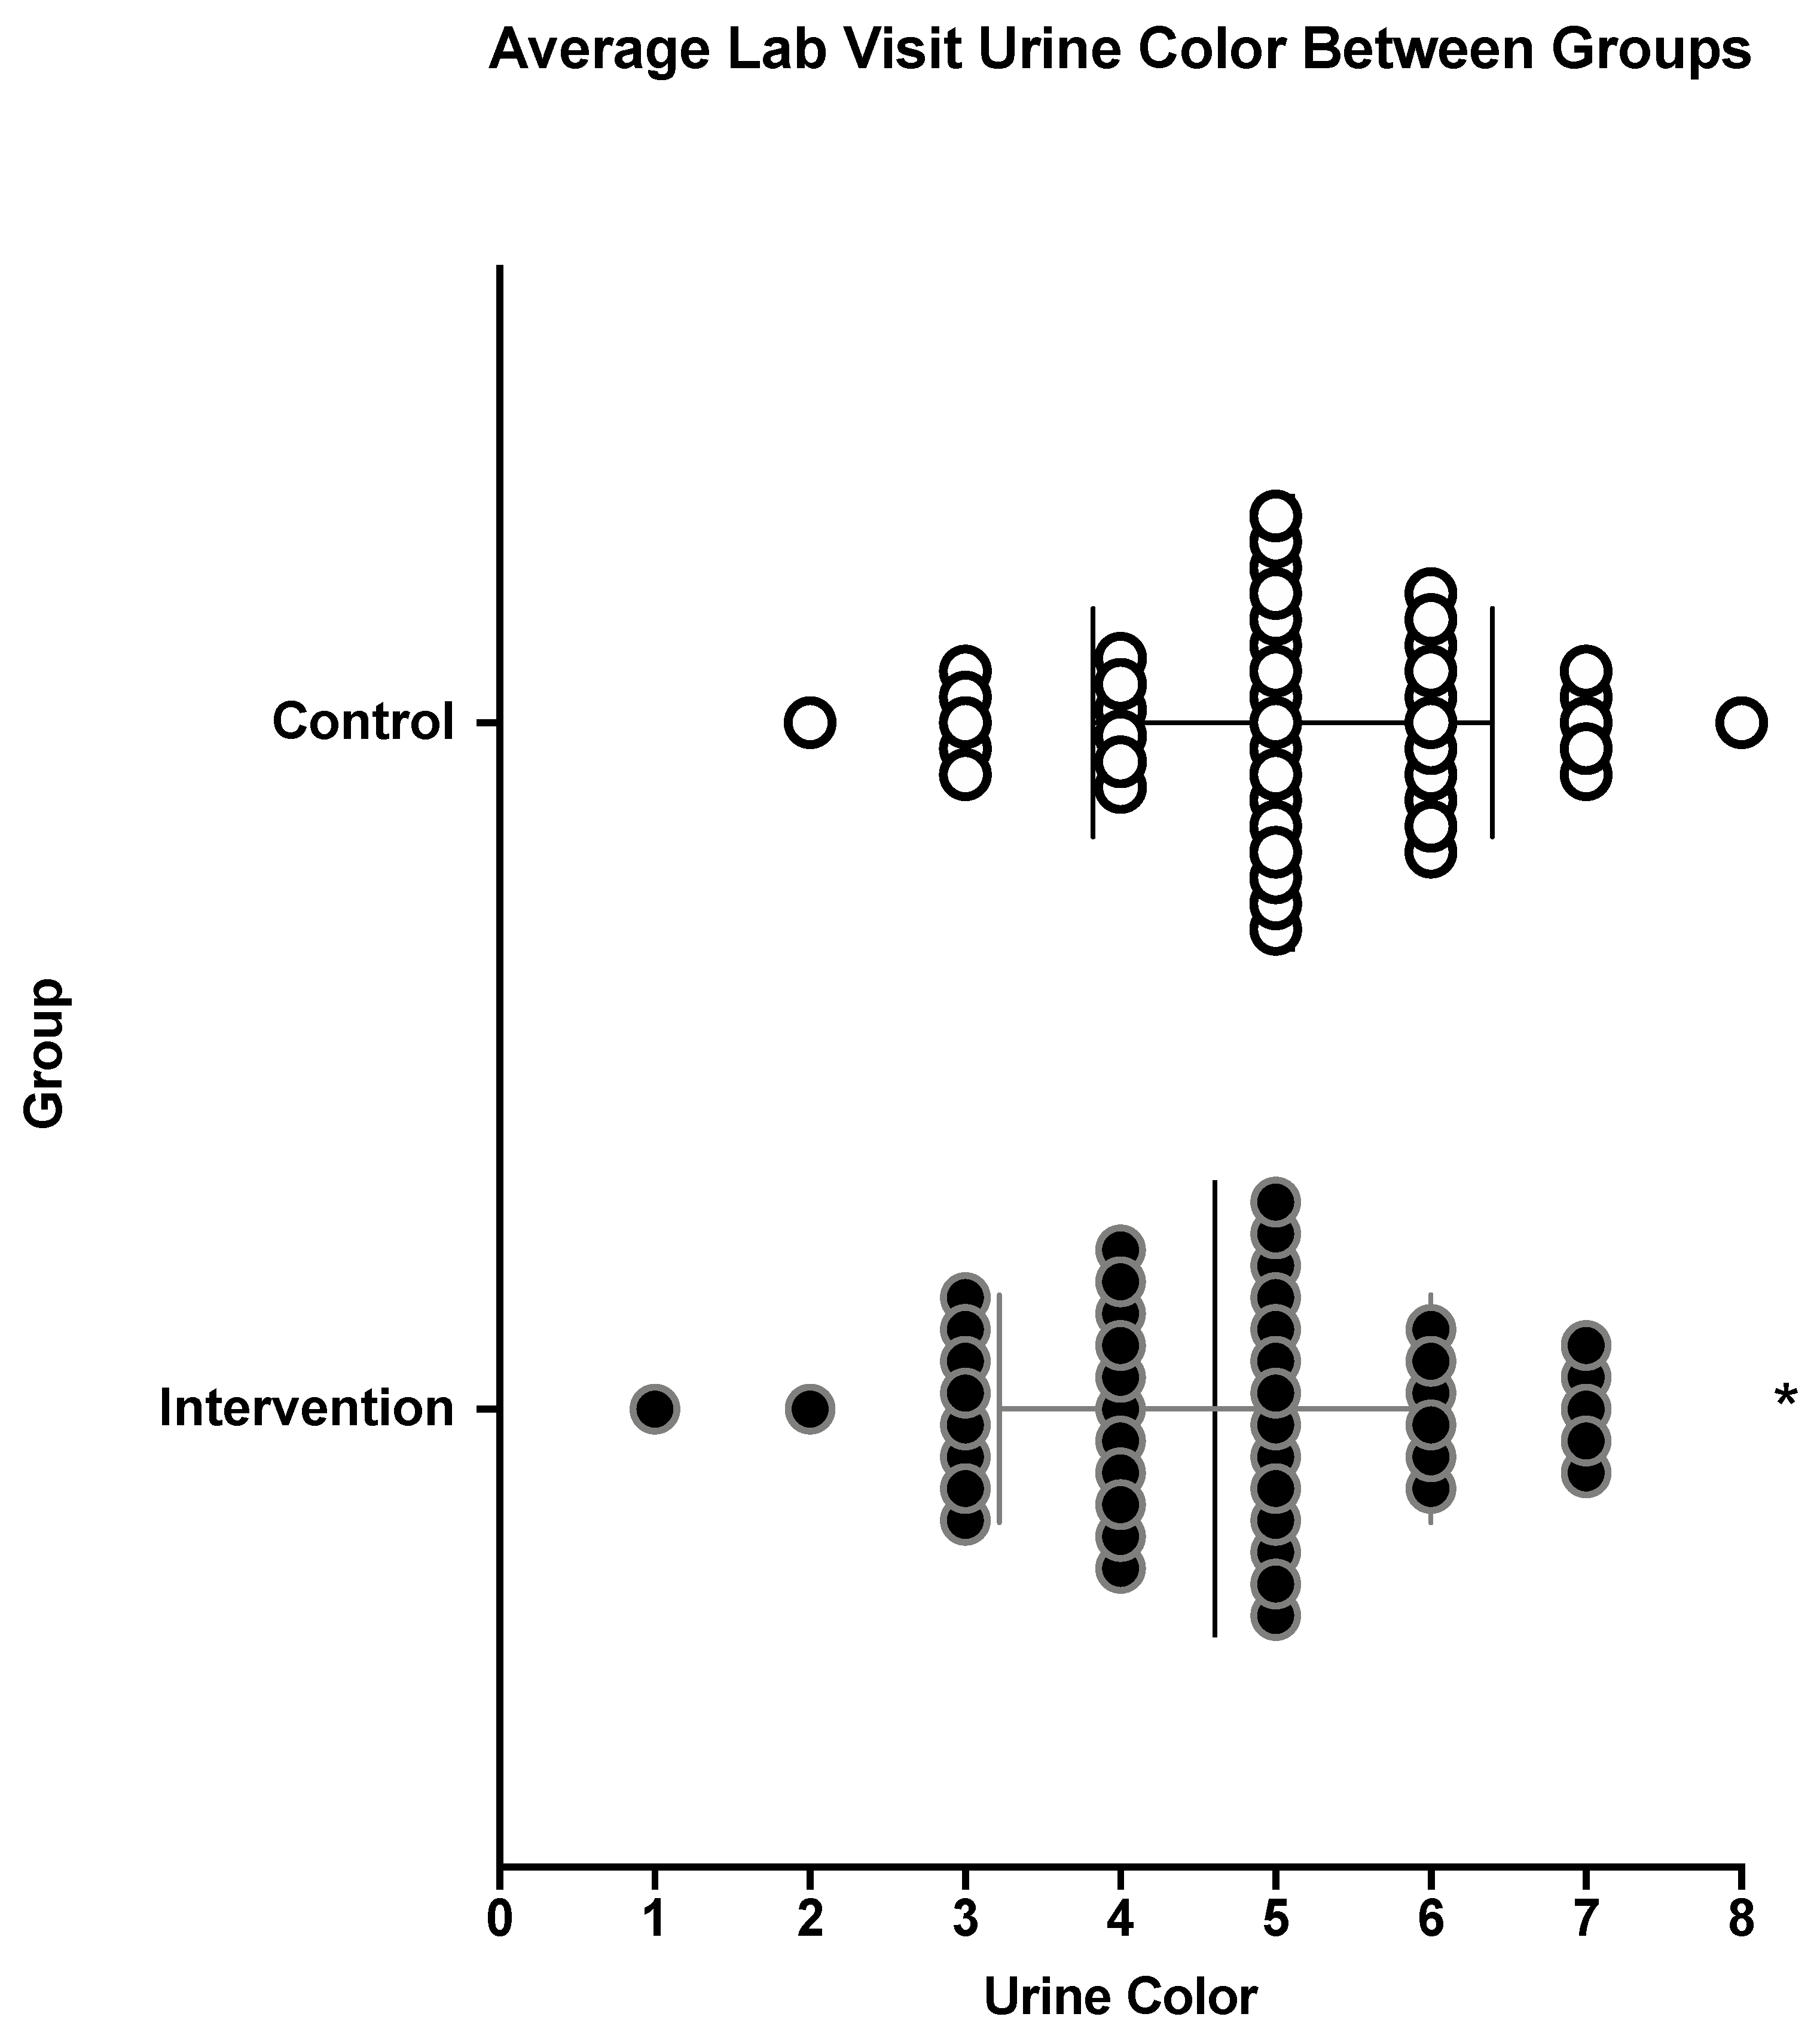
| Morning Urine Color | Afternoon Urine Color | Morning Thirst Perception | Afternoon Thirst Perception | |
|---|---|---|---|---|
| Intervention | 4 ± 1 | 3 ± 1 * | 4 ± 1 | 3 ± 1 |
| Control | 4 ± 1 | 3 ± 1 | 4 ± 1 | 3 ± 1 |
Publisher’s Note: MDPI stays neutral with regard to jurisdictional claims in published maps and institutional affiliations. |
© 2021 by the authors. Licensee MDPI, Basel, Switzerland. This article is an open access article distributed under the terms and conditions of the Creative Commons Attribution (CC BY) license (https://creativecommons.org/licenses/by/4.0/).
Share and Cite
Szymanski, M.R.; Giersch, G.E.W.; Morrissey, M.C.; Benjamin, C.L.; Sekiguchi, Y.; Manning, C.N.; Stearns, R.L.; Casa, D.J. Availability of a Flavored Beverage and Impact on Children’s Hydration Status, Sleep, and Mood. Nutrients 2021, 13, 1757. https://doi.org/10.3390/nu13061757
Szymanski MR, Giersch GEW, Morrissey MC, Benjamin CL, Sekiguchi Y, Manning CN, Stearns RL, Casa DJ. Availability of a Flavored Beverage and Impact on Children’s Hydration Status, Sleep, and Mood. Nutrients. 2021; 13(6):1757. https://doi.org/10.3390/nu13061757
Chicago/Turabian StyleSzymanski, Michael R., Gabrielle E. W. Giersch, Margaret C. Morrissey, Courteney L. Benjamin, Yasuki Sekiguchi, Ciara N. Manning, Rebecca L. Stearns, and Douglas J. Casa. 2021. "Availability of a Flavored Beverage and Impact on Children’s Hydration Status, Sleep, and Mood" Nutrients 13, no. 6: 1757. https://doi.org/10.3390/nu13061757
APA StyleSzymanski, M. R., Giersch, G. E. W., Morrissey, M. C., Benjamin, C. L., Sekiguchi, Y., Manning, C. N., Stearns, R. L., & Casa, D. J. (2021). Availability of a Flavored Beverage and Impact on Children’s Hydration Status, Sleep, and Mood. Nutrients, 13(6), 1757. https://doi.org/10.3390/nu13061757