
Diet Quality According to Mental Status and Associated Factors during Adulthood in Spain


Abstract

1. Introduction
2. Materials and Methods
2.1. Design, Data Source and Sample
2.2. Variables
2.2.1. Diet Quality
2.2.2. Mental Health
2.2.3. Sociodemographic Characteristics
2.2.4. Health-Related Variables
2.2.5. Lifestyle Variables
2.3. Ethical Aspects
2.4. Statistical Analysis
3. Results
3.1. Characteristics of Participants
3.2. Prevalence of Diet Quality in SNHS 2006, SNHS 2011/2012 and SNHS 2017
3.3. Frequency of Food Consumption and Diet Quality According to Mental Status
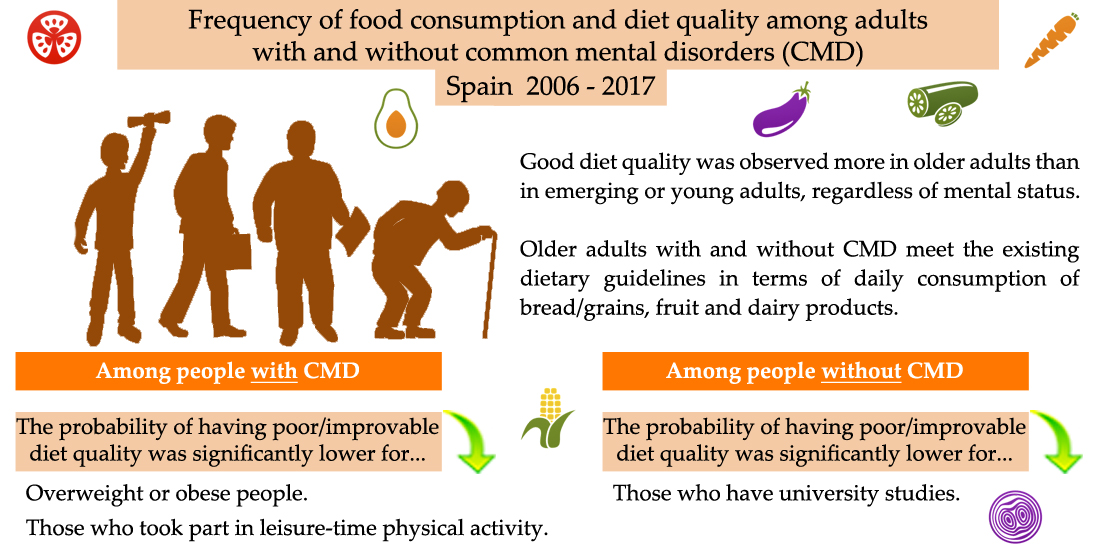
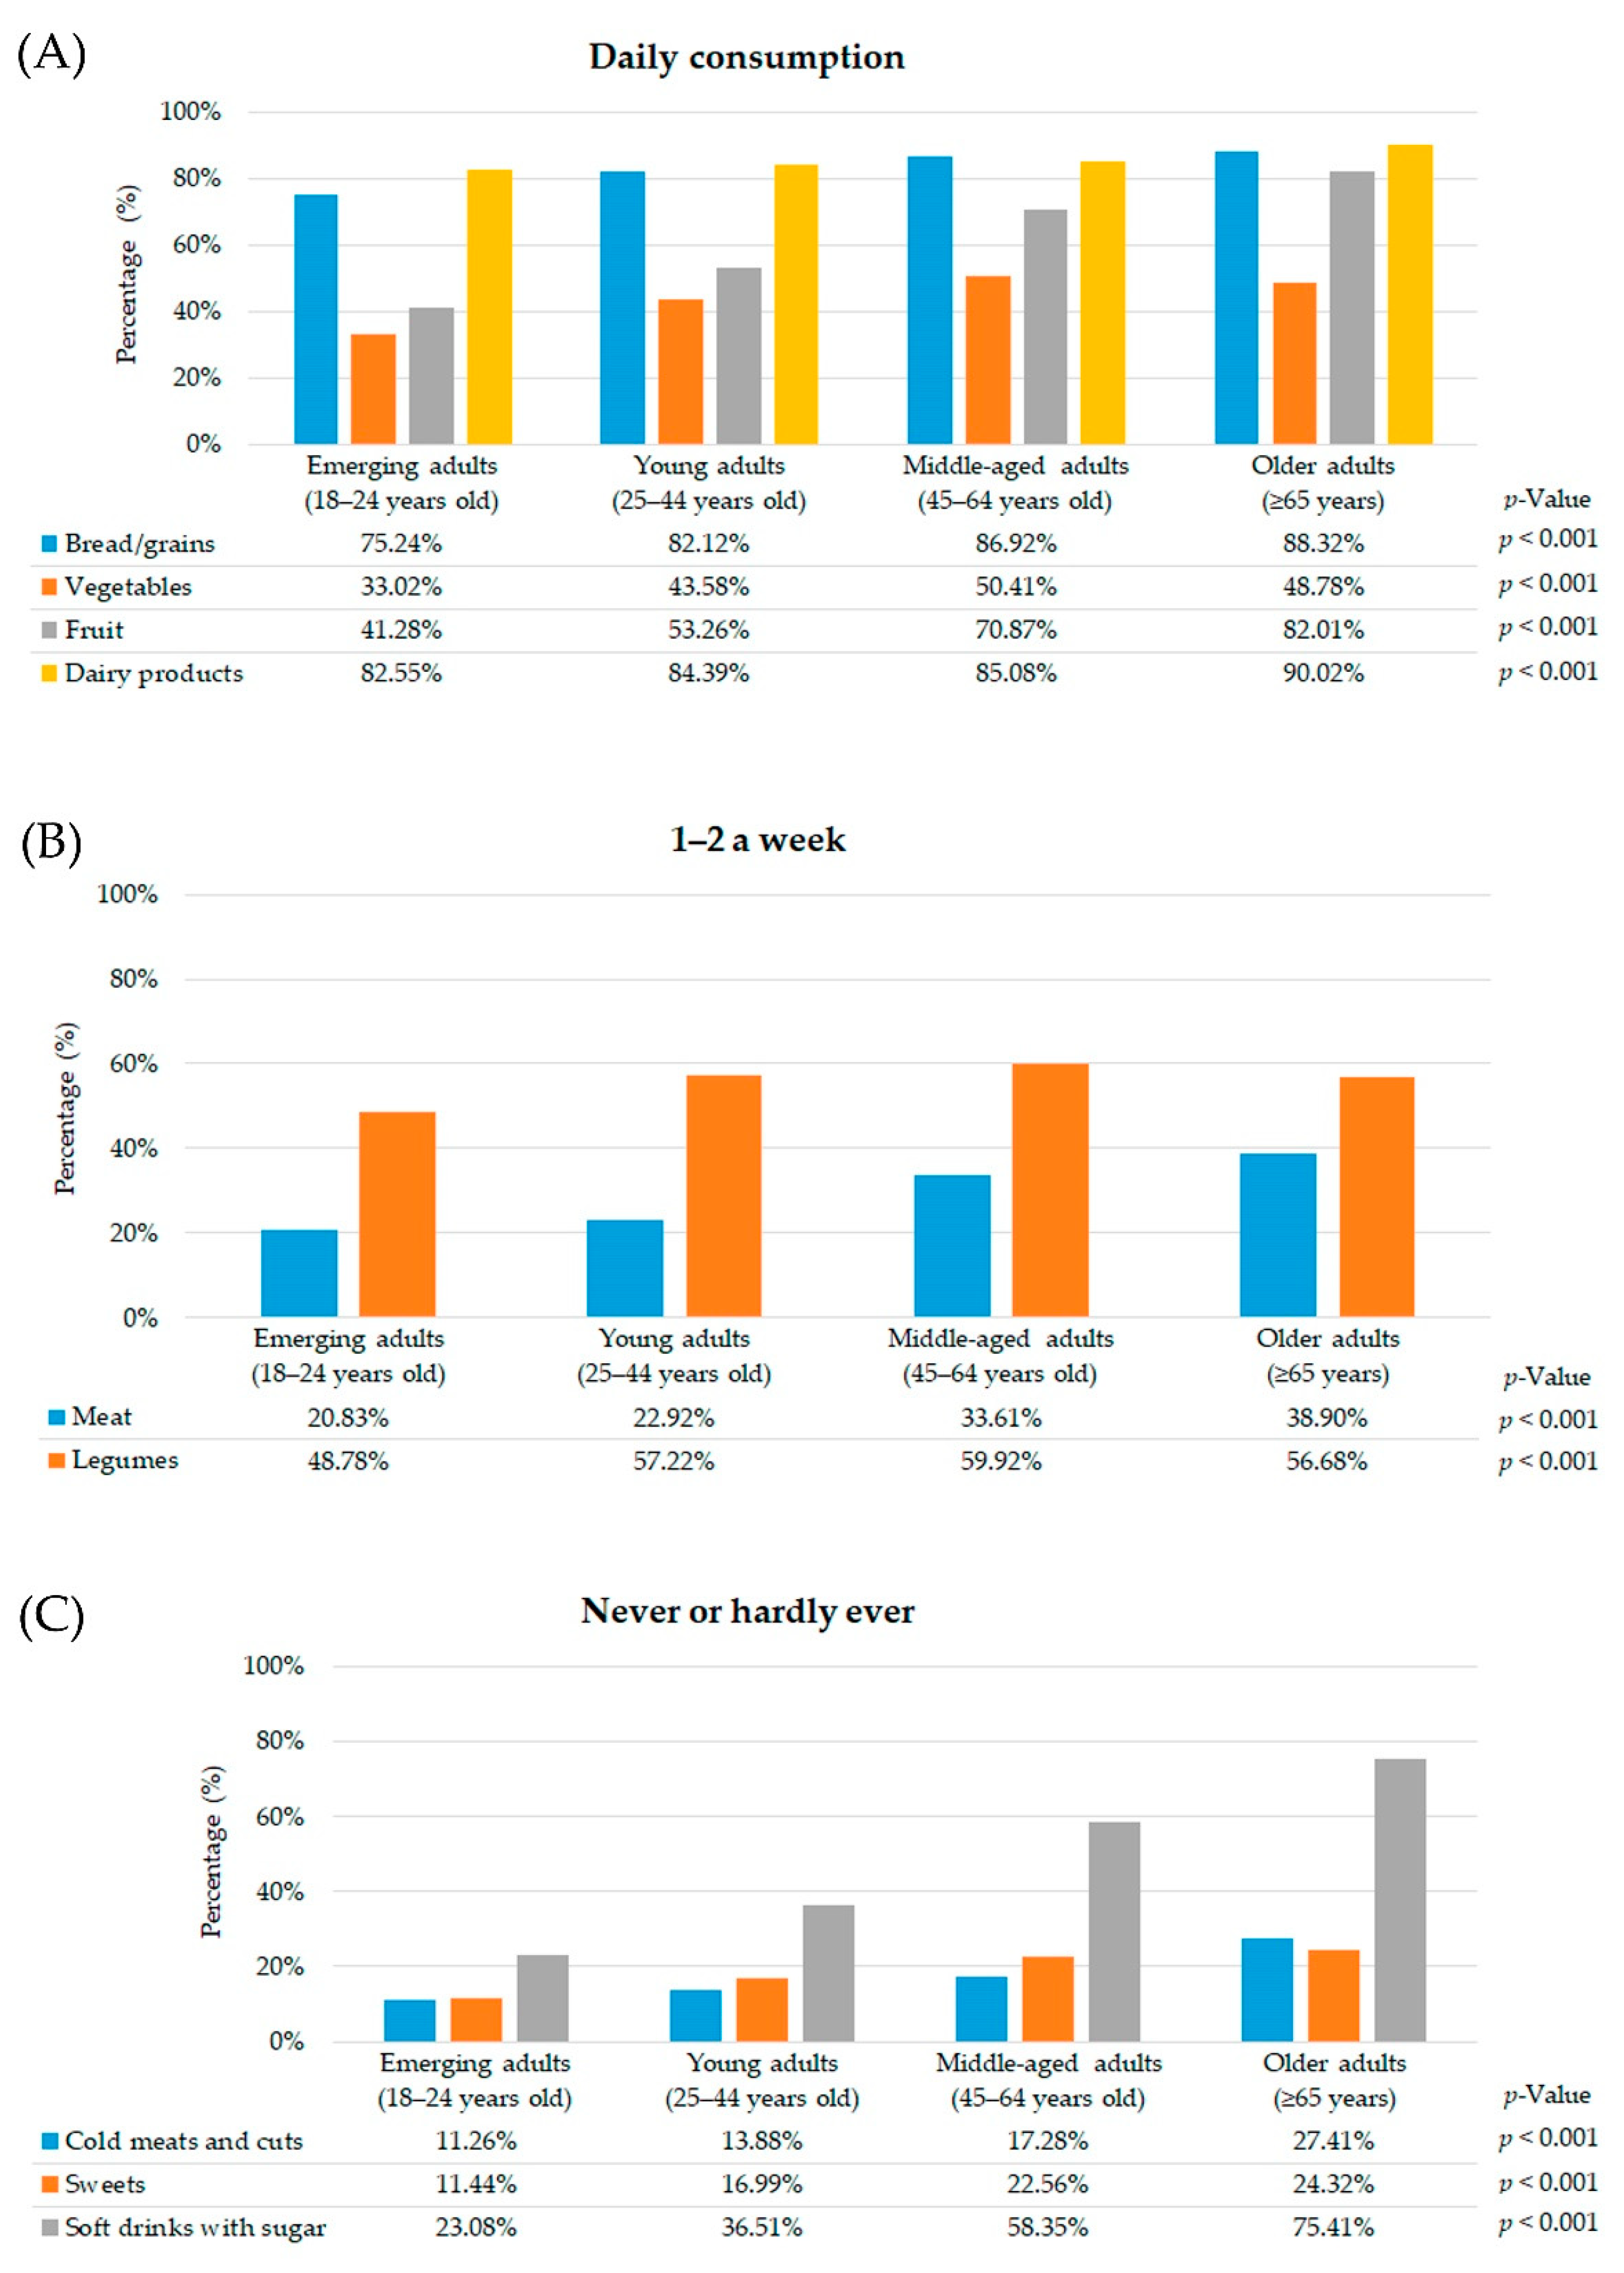
3.4. Comparison of the Frequency of Food Consumption and Diet Quality across Age Groups within Individuals with CMD
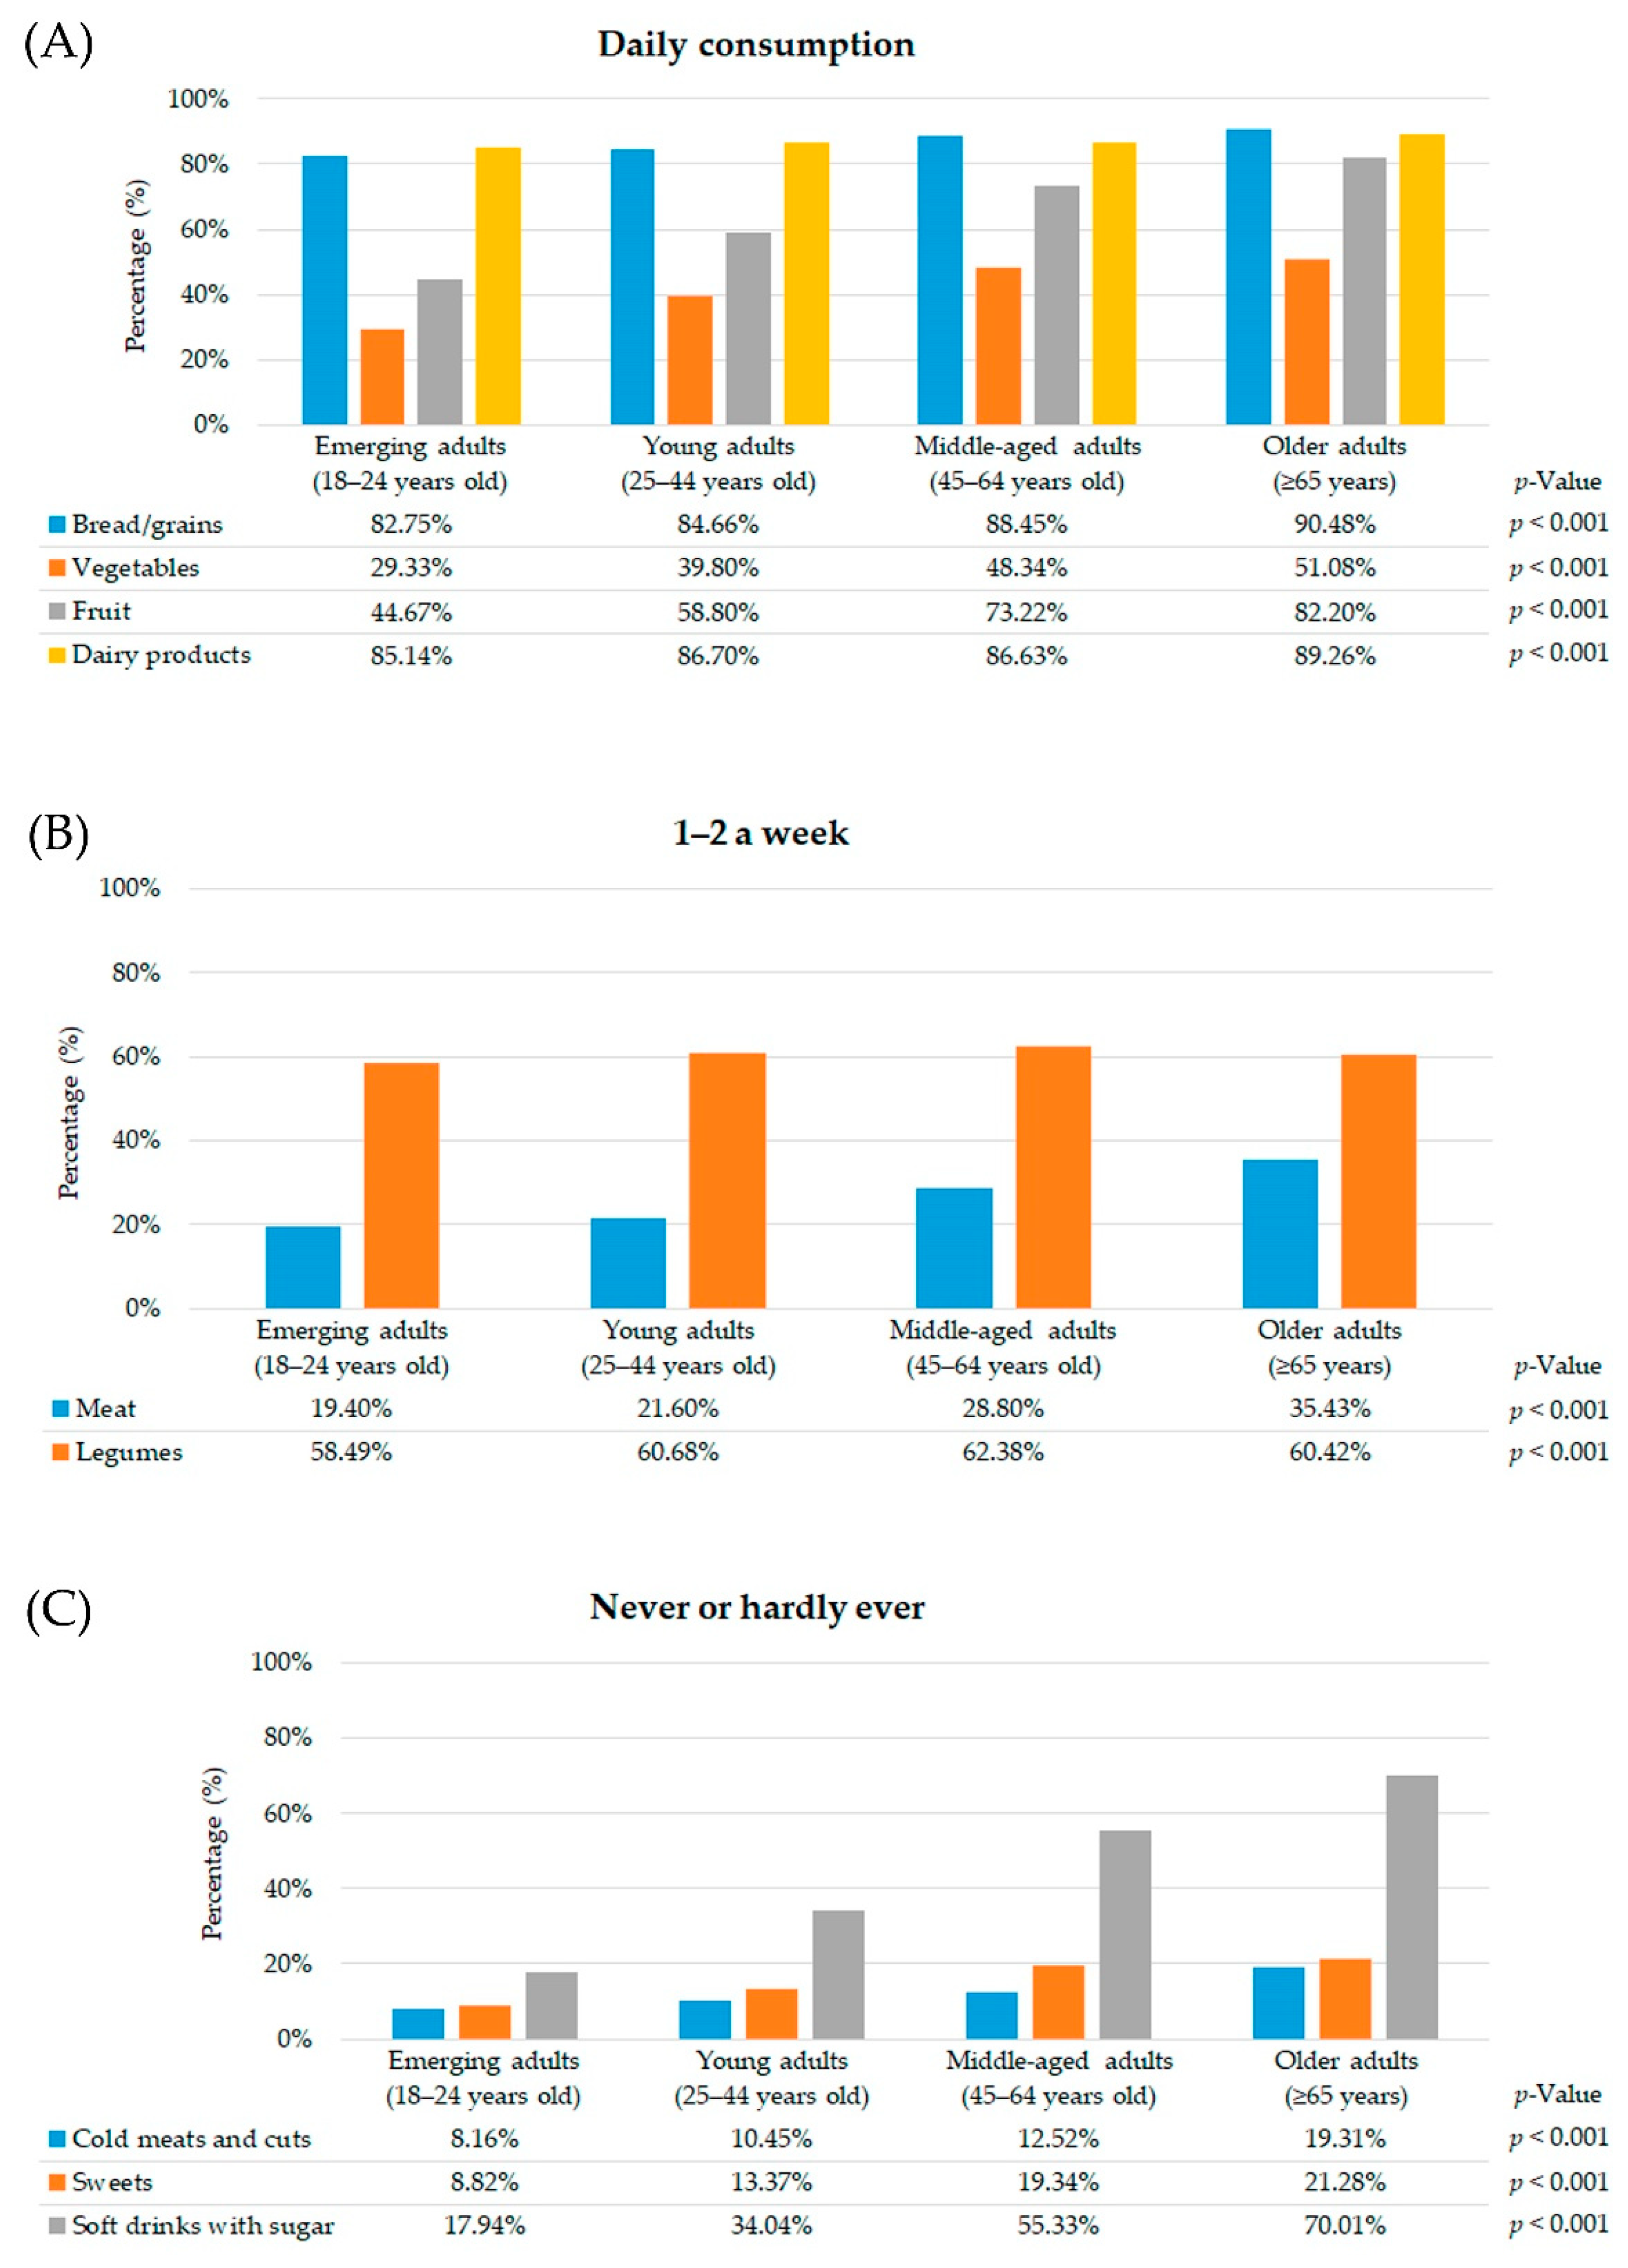
3.5. Comparison of the Frequency of Food Consumption and Diet Quality across Age Groups within Individuals without CMD
3.6. Comparison of the Frequency of Food Consumption and Diet Quality across Age Group in Individuals with and without CMD
3.7. Association between Sociodemographic Characteristics, Lifestyle Behavior, Health-Related Variables and Diet Quality According to Mental Status
4. Discussion
4.1. Main Findings
4.2. Strengths and Limitations
4.3. Implications for Research and Practice
5. Conclusions
Supplementary Materials
Author Contributions
Funding
Institutional Review Board Statement
Informed Consent Statement
Data Availability Statement
Acknowledgments
Conflicts of Interest
References
- World Health Organization (WHO). Mental Health Action Plan 2013–2020. Available online: https://apps.who.int/iris/bitstream/handle/10665/89966/9789241506021_eng.pdf?sequence=1 (accessed on 3 January 2020).
- World Health Organization (WHO). Mental Health Action Programme (mhGAP) Community Toolkit: Field Test Version. 2019. Available online: https://apps.who.int/iris/bitstream/handle/10665/328742/9789241516556-eng.pdf (accessed on 3 January 2021).
- World Health Organization (WHO). Depression and Other Common Mental Disorders: Global Health Estimates. 2017. Available online: https://apps.who.int/iris/bitstream/handle/10665/254610/WHO-MSD-MER-2017.2-eng.pdf (accessed on 3 January 2021).
- GBD 2017 DALYs and HALE Collaborators. Global, regional, and national disability-adjusted life-years (DALYs) for 359 diseases and injuries and healthy life expectancy (HALE) for 195 countries and territories, 1990–2017: A systematic analysis for the Global Burden of Disease Study 2017. Lancet 2018, 392, 1859–1922. [Google Scholar] [CrossRef]
- Craske, M.G.; Stein, M.B.; Eley, T.C.; Milad, M.R.; Holmes, A.; Rapee, R.M.; Wittchen, H.-U. Anxiety disorders. Nat. Rev. Dis. Primers. 2017, 3, 17024. [Google Scholar] [CrossRef] [PubMed]
- Hudson, J.L. Prevention of anxiety disorders across the lifespan. JAMA Psychiatry 2017, 74, 1029–1030. [Google Scholar] [CrossRef] [PubMed]
- Hoare, E.; Callaly, E.; Berk, M. Can depression be prevented? If so, how? JAMA Psychiatry 2020. [Google Scholar] [CrossRef]
- Jorm, A.F.; Patten, S.B.; Brugha, T.S.; Mojtabai, R. Has increased provision of treatment reduced the prevalence of common mental disorders? Review of the evidence from four countries. World Psychiatry 2017, 16, 90–99. [Google Scholar] [CrossRef] [PubMed]
- Marx, W.; Moseley, G.; Berk, M.; Jacka, F.N. Nutritional psychiatry: The present state of the evidence. Proc. Nutr. Soc. 2017, 76, 427–436. [Google Scholar] [CrossRef] [PubMed]
- Hockey, M.; McGuinness, A.J.; Marx, W.; Rocks, T.; Jacka, F.N.; Ruusunen, A. Is dairy consumption associated with depressive symptoms or disorders in adults? A systematic review of observational studies. Crit. Rev. Food. Sci. Nutr. 2020, 60, 3653–3668. [Google Scholar] [CrossRef] [PubMed]
- Lane, M.M.; Davis, J.A.; Beattie, S.; Gómez-Donoso, C.; Loughman, A.; O’Neil, A.; Jacka, F.N.; Berk, M.; Page, R.; Marx, W.; et al. Ultraprocessed food and chronic noncommunicable diseases: A systematic review and meta-analysis of 43 observational studies. Obes. Rev. 2021, 22, e13146. [Google Scholar] [CrossRef] [PubMed]
- Dash, S.R.; O’Neil, A.; Jacka, F.N. Diet and common mental disorders: The imperative to translate evidence into action. Front. Public Health 2016, 4, 81. [Google Scholar] [CrossRef] [PubMed]
- Owen, L.; Corfe, B. The role of diet and nutrition on mental health and wellbeing. Proc. Nutr. Soc. 2017, 76, 425–426. [Google Scholar] [CrossRef]
- Marx, W.; Lane, M.; Hockey, M.; Aslam, H.; Berk, M.; Walder, K.; Borsini, A.; Firth, J.; Pariante, C.M.; Berding, K.; et al. Diet and depression: Exploring the biological mechanisms of action. Mol. Psychiatry 2021, 26, 134–150. [Google Scholar] [CrossRef] [PubMed]
- Lassale, C.; Batty, G.D.; Baghdadli, A.; Jacka, F.N.; Sánchez Villegas, A.; Kivimäki, M.; Akbaraly, T. Healthy dietary indices and risk of depressive outcomes: A systematic review and meta-analysis of observational studies. Mol. Psychiatry 2019, 24, 965–986. [Google Scholar] [CrossRef] [PubMed]
- Firth, J.; Veronese, N.; Cotter, J.; Shivappa, N.; Hebert, J.R.; Ee, C.; Smith, L.; Stubbs, B.; Jackson, S.E.; Sarris, J. What is the role of dietary inflammation in severe mental illness? A review of observational and experimental findings. Front. Psychiatry 2019, 10, 350. [Google Scholar] [CrossRef] [PubMed]
- Phillips, C.M.; Shivappa, N.; Hébert, J.R.; Perry, I.J. Dietary inflammatory index and mental health: A cross-sectional analysis of the relationship with depressive symptoms, anxiety and well-being in adults. Clin. Nutr. 2017, 37, 1485–1491. [Google Scholar] [CrossRef]
- Wirth, M.D.; Shivappa, N.; Burch, J.B.; Hurley, T.G.; Hébert, J.R. The dietary inflammatory index, shift work, and depression: Results from NHANES. Health Psychol. 2017, 36, 760–769. [Google Scholar] [CrossRef]
- Shivappa, N.; Hebert, J.R.; Neshatbini Tehrani, A.; Bayzai, B.; Naja, F.; Rashidkhani, B. A pro-inflammatory diet is associated with an increased odds of depression symptoms among Iranian female adolescents: A cross-sectional study. Front. Psychiatry 2018, 9, 400. [Google Scholar] [CrossRef]
- Shivappa, N.; Hébert, J.R.; Veronese, N.; Caruso, M.G.; Notarnicola, M.; Maggi, S.; Stubbs, B.; Firth, J.; Fornaro, M.; Solmi, M. The relationship between the Dietary Inflammatory Index (DII®) and incident depressive symptoms: A longitudinal cohort study. J. Affect. Disord. 2018, 235, 39–44. [Google Scholar] [CrossRef]
- Wang, J.; Zhou, Y.; Chen, K.; Jing, Y.; He, J.; Sun, H.; Hu, X. Dietary inflammatory index and depression: A meta-analysis. Public Health Nutr. 2018, 22, 1–7. [Google Scholar] [CrossRef]
- Tolkien, K.; Bradburn, S.; Murgatroyd, C. An anti-inflammatory diet as a potential intervention for depressive disorders: A systematic review and meta-analysis. Clin. Nutr. 2019, 38, 2045–2052. [Google Scholar] [CrossRef] [PubMed]
- Adjibade, M.; Andreeva, V.A.; Lemogne, C.; Touvier, M.; Shivappa, N.; Hébert, J.R.; Wirth, M.D.; Hercberg, S.; Galan, P.; Julia, C.; et al. The inflammatory potential of the diet is associated with depressive symptoms in different subgroups of the general population. J. Nutr. 2017, 147, 879–887. [Google Scholar] [CrossRef]
- Wickramasinghe, K.; Mathers, J.C.; Wopereis, S.; Marsman, D.S.; Griffiths, J.C. From lifespan to healthspan: The role of nutrition in healthy ageing. J. Nutr. Sci. 2020, 9, e33. [Google Scholar] [CrossRef]
- Gracia, A.; Albisu, L.M. Moving away from a typical Mediterranean diet: The case of Spain. Br. Food J. 1999, 101, 701–714. [Google Scholar] [CrossRef]
- Bondia Pons, I.; Mayneris Perxachs, J.; Serra Majem, L.; Castellote, A.I.; Mariné, A.; López Sabater, M.C. Diet quality of a population sample from coastal North-East Spain evaluated by a Mediterranean adaptation of the Diet Quality Index (DQI). Public Health Nutr. 2010, 13, 12–24. [Google Scholar] [CrossRef]
- Buckland, G.; Agudo, A.; Travier, N.; Huerta, J.M.; Cirera, L.; Tormo, M.-J.; Navarro, C.; Chirlaque, M.D.; Moreno-Iribas, C.; Ardanaz, E.; et al. Adherence to the Mediterranean diet reduces mortality in the Spanish cohort of the European Prospective Investigation into Cancer and Nutrition (EPIC-Spain). Br. J. Nutr. 2011, 106, 1581–1591. [Google Scholar] [CrossRef]
- Allman-Farinelli, M.; Partridge, S.R.; Roy, R. Weight-related dietary behaviors in young adults. Curr. Obes. Rep. 2016, 5, 23–29. [Google Scholar] [CrossRef]
- Noble, E.E.; Hsu, T.M.; Kanoski, S.E. Gut to brain dysbiosis: Mechanisms linking Western diet consumption, the microbiome, and cognitive impairment. Front. Behav. Neurosci. 2017, 11, 9. [Google Scholar] [CrossRef]
- Cook, N.R.; He, F.J.; MacGregor, G.A.; Graudal, N. Sodium and health-concordance and controversy. BMJ 2020, 369, m2440. [Google Scholar] [CrossRef]
- Adams, M.S. Gaps in the awareness of current nutrition issues as dependent on age. Nutr. Food. Sic. 2006, 36, 286–294. [Google Scholar] [CrossRef]
- Poddar, K.H.; Hosig, K.W.; Anderson-Bill, E.S.; Nickols-Richardson, S.; Duncan, S.E. Dairy intake and related self-regulation improved in college students using online nutrition education. J. Acad. Nutr. Diet. 2012, 112, 1976–1986. [Google Scholar] [CrossRef]
- Davies, L. Retirement courses: Should they include nutrition? J. R. Soc. Health 1990, 110, 20–22. [Google Scholar] [CrossRef]
- Eng, P.M.; Kawachi, I.; Fitzmaurice, G.; Rimm, E.B. Effects of marital transitions on changes in dietary and other health behaviours in US male health professionals. J. Epidemiol. Community Health 2005, 59, 56–62. [Google Scholar] [CrossRef]
- Lee, S.; Cho, E.; Grodstein, F.; Kawachi, I.; Hu, F.B.; Colditz, G.A. Effects of marital transitions on changes in dietary and other health behaviours in US women. Int. J. Epidemiol. 2005, 34, 69–78. [Google Scholar] [CrossRef] [PubMed]
- Lara, J.; Hobbs, N.; Moynihan, P.J.; Meyer, T.D.; Adamson, A.J.; Errington, L.; Rochester, L.; Sniehotta, F.F.; White, M.; Mathers, J.C. Effectiveness of dietary interventions among adults of retirement age: A systematic review and meta-analysis of randomized controlled trials. BMC Med. 2014, 12, 60. [Google Scholar] [CrossRef] [PubMed]
- Milte, C.M.; Thorpe, M.G.; Crawford, D.; Ball, K.; McNaughton, S.A. Associations of diet quality with health-related quality of life in older Australian men and women. Exp. Gerontol. 2015, 64, 8–16. [Google Scholar] [CrossRef]
- World Health Organization (WHO). European Food and Nutrition Action Plan 2015–2020. Available online: https://www.euro.who.int/__data/assets/pdf_file/0003/294474/European-Food-Nutrition-Action-Plan-20152020-en.pdf (accessed on 13 January 2021).
- Cena, H.; Calder, P.C. Defining a healthy diet: Evidence for the role of contemporary dietary patterns in health and disease. Nutrients 2020, 12, 334. [Google Scholar] [CrossRef]
- Molendijk, M.; Molero, P.; Ortuño Sánchez-Pedreño, F.; Van der Does, W.; Martínez González, M.A. Diet quality and depression risk: A systematic review and dose-response meta-analysis of prospective studies. J. Affect. Disord. 2018, 226, 346–354. [Google Scholar] [CrossRef]
- Childs, C.E. From the Mediterranean Diet to the microbiome. J. Nutr. 2018, 148, 819–820. [Google Scholar] [CrossRef]
- Edirappuli, S.D.; Venkatesh, A.; Zaman, R. The effect of nutrition on mental health: A focus on inflammatory mechanisms. Psychiatr. Danub. 2020, 32, 114–120. [Google Scholar]
- Jacka, F.N. Nutritional psychiatry: Where to next? EBioMedicine 2017, 17, 24–29. [Google Scholar] [CrossRef] [PubMed]
- Norte Navarro, A.; Ortiz Moncada, R. Spanish diet quality according to the healthy eating index. Nutr. Hosp. 2011, 26, 330–336. [Google Scholar] [CrossRef]
- Spanish Society of Community Nutrition (SSCN). Healthy Dietary Guidelines (2014). Available online: http://www.nutricioncomunitaria.org/es/otras-publicaciones (accessed on 30 December 2020).
- Ministerio de Sanidad Servicios Sociales e Igualdad, Instituto Nacional de Estadística. Encuesta Europea de Salud en España ENSE 2006; Ministerio de Sanidad, Servicios Sociales e Igualdad: Madrid, Spain, 2007; Available online: https://www.mscbs.gob.es/estadEstudios/estadisticas/encuestaNacional/encuesta2006.htm (accessed on 25 December 2020).
- Ministerio de Sanidad Servicios Sociales e Igualdad, Instituto Nacional de Estadística. Encuesta Nacional de Salud España ENSE 2011/12; Ministerio de Sanidad, Servicios Sociales e Igualdad: Madrid, Spain, 2013; Available online: https://www.mscbs.gob.es/estadEstudios/estadisticas/encuestaNacional/encuesta2011.htm (accessed on 25 December 2020).
- Ministerio de Sanidad Servicios Sociales e Igualdad, Instituto Nacional de Estadística. Encuesta Nacional de Salud España ENSE 2017; Ministerio de Sanidad, Servicios Sociales e Igualdad: Madrid, Spain, 2018; Available online: https://www.mscbs.gob.es/estadEstudios/estadisticas/encuestaNacional/encuesta2017.htm (accessed on 25 December 2020).
- National Institute of Statistics. National Health Survey 2006 (SNHS 2006): Methodology. Available online: https://www.ine.es/en/metodologia/t15/t153041906_en.pdf (accessed on 25 December 2020).
- National Institute of Statistics. National Health Survey 2011–2012 (SNHS 2011–2012): Methodology. Available online: https://www.ine.es/en/metodologia/t15/t153041912_en.pdf (accessed on 25 December 2020).
- National Institute of Statistics. National Health Survey 2017 (SNHS 2017): Methodology. Available online: https://www.ine.es/en/metodologia/t15/t153041917_en.pdf (accessed on 25 December 2020).
- Goldberg, D.P.; Hillier, V.F. A scaled version of the General Health Questionnaire. Psychol. Med. 1979, 9, 139–145. [Google Scholar] [CrossRef] [PubMed]
- Goldberg, D.P.; Williams, P. Cuestionario de Salud General GHQ: Guía Para el Usuario de las Distintas Versiones, 1st ed.; Masson: Barcelona, Spain, 1996. [Google Scholar]
- Sánchez López, M.P.; Dresch, V. The 12-Item General Health Questionnaire (GHQ-12): Reliability, external validity and factor structure in the Spanish population. Psicothema 2008, 20, 839–843. [Google Scholar]
- Goldberg, D.P.; Gater, R.; Sartorius, N.; Ustun, T.B.; Piccinelli, M.; Gureje, O.; Rutter, C. The validity of two versions of the GHQ in the WHO study of mental illness in general health care. Psychol. Med. 1997, 27, 191–197. [Google Scholar] [CrossRef]
- Arnett, J.J. Emerging adulthood: A theory of development from the late teens through the twenties. Am. Psychol. 2000, 55, 469–480. [Google Scholar] [CrossRef] [PubMed]
- Erikson, E.H. Identity: Youth, and Crisis; W. W. Norton & Company: New York, NY, USA, 1968. [Google Scholar]
- Domingo-Salvany, A.; Bacigalupe, A.; Carrasco, J.M.; Espelt, A.; Ferrando, J.; Borrell, C. Proposals for social class classification based on the Spanish National Classification of Occupations 2011 using neo-Weberian and neo-Marxist approaches. Gac. Sanit. 2011, 27, 263–272. [Google Scholar] [CrossRef]
- World Health Organization (WHO). Body Mass Index (BMI). Available online: http://www.euro.who.int/en/health-topics/disease-prevention/nutrition/a-healthy-lifestyle/body-mass-index-bmi (accessed on 31 December 2020).
- Partearroyo, T.; Samaniego-Vaesken, M.L.; Ruiz, E.; Aranceta-Bartrina, J.; Gil, Á.; González-Gross, M.; Ortega, R.M.; Serra-Majem, L.; Varela-Moreiras, G. Current food consumption amongst the Spanish ANIBES Study Population. Nutrients 2019, 11, 2663. [Google Scholar] [CrossRef]
- Report on Food Consumption in Spain. Available online: https://www.mapa.gob.es/eu/alimentacion/temas/consumo-tendencias/informeconsumoalimentacionenespana2017_prefinal_tcm35-456186.pdf (accessed on 11 April 2021).
- Kim, N.; Kim, G.-U.; Kim, H. Comparative study of dietary patterns by living arrangements: The Korea National Health and Nutrition Examination Survey (KNHANES) 2013–2015. Int. J. Environ. Res. Public Health 2020, 17, 2371. [Google Scholar] [CrossRef]
- Li, Y.; Lv, M.-R.; Wei, Y.J.; Sun, L.; Zhang, J.-X.; Zhang, H.-G.; Li, B. Dietary patterns and depression risk: A meta-analysis. Psychiatry Res. 2017, 253, 373–382. [Google Scholar] [CrossRef]
- Quirk, S.E.; Williams, L.J.; O’Neil, A.; Pasco, J.A.; Jacka, F.N.; Housden, S.; Berk, M.; Brennan, S.L. The association between diet quality, dietary patterns and depression in adults: A systematic review. BMC Psychiatry 2013, 13, 175. [Google Scholar] [CrossRef]
- Jacka, F.N.; Cherbuin, N.; Anstey, K.J.; Butterworth, P. Does reverse causality explain the relationship between diet and depression? J. Affect. Disord. 2015, 175, 248–250. [Google Scholar] [CrossRef]
- Davison, K.M.; Gondara, L.; Kaplan, B.J. Food insecurity, poor diet quality, and suboptimal intakes of folate and iron are independently associated with perceived mental health in Canadian adults. Nutrients 2017, 9, 274. [Google Scholar] [CrossRef] [PubMed]
- Gibson-Smith, D.; Bot, M.; Brouwer, I.A.; Visser, M.; Penninx, B.W. Diet quality in persons with and without depressive and anxiety disorders. J. Psychiatr. Res. 2018, 106, 1–7. [Google Scholar] [CrossRef]
- Godos, J.; Currenti, W.; Angelino, D.; Mena, P.; Castellano, S.; Caraci, F.; Galvano, F.; del Rio, D.; Ferri, R.; Grosso, G. Diet and mental health: Review of the recent updates on molecular mechanisms. Antioxidants 2020, 9, 346. [Google Scholar] [CrossRef] [PubMed]
- Oddy, W.H.; Allen, K.L.; Trapp, G.S.A.; Ambrosini, G.L.; Black, L.J.; Huang, R.-C.; Rzehak, P.; Runions, K.C.; Pan, F.; Beilin, L.J.; et al. Dietary patterns, body mass index and inflammation: Pathways to depression and mental health problems in adolescents. Brain Behav. Immun. 2018, 69, 428–439. [Google Scholar] [CrossRef] [PubMed]
- Inguglia, C.; Ingoglia, S.; Liga, F.; Lo Coco, A.; Lo Cricchio, M.G. Autonomy and relatedness in adolescence and emerging adulthood: Relationships with parental support and psychological distress. J. Adult Dev. 2015, 22, 1–13. [Google Scholar] [CrossRef]
- Verschueren, M.; Rassart, J.; Claes, L.; Moons, P.; Luyckx, K. Identity statuses throughout adolescence and emerging adulthood: A large-scale study into gender, age, and contextual differences. Psychol. Belg. 2017, 57, 32–42. [Google Scholar] [CrossRef] [PubMed][Green Version]
- Pelletier, J.E.; Graham, D.J.; Laska, M.N. Social norms and dietary behaviors among young adults. Am. J. Health Behav. 2014, 38, 144–152. [Google Scholar] [CrossRef]
- Grech, A.; Sui, Z.; Siu, H.Y.; Zheng, M.; Allman-Farinelli, M.; Rangan, A. Socio-demographic determinants of diet quality in Australian adults using the validated Healthy Eating Index for Australian adults (HEIFA-2013). Healthcare 2017, 5, 7. [Google Scholar] [CrossRef]
- DeChristopher, L.R.; Uribarri, J.; Tucker, K.L. Intake of high-fructose corn syrup sweetened soft drinks, fruit drinks and apple juice is associated with prevalent arthritis in US adults, aged 20–30 years. Nutr. Diabetes 2016, 6, e199. [Google Scholar] [CrossRef]
- Al-Qahtani, M.H. Dietary habits of Saudi medical students at University of Dammam. Int. J. Health Sci. 2016, 10, 353–362. [Google Scholar] [CrossRef]
- Van Draanen, J.; Prelip, M.; Upchurch, D.M. Consumption of fast food, sugar-sweetened beverages, artificially-sweetened beverages and allostatic load among young adults. Prev. Med. Rep. 2017, 10, 212–217. [Google Scholar] [CrossRef] [PubMed]
- Aguirre, A.; Borneo, M.T.; El Khori, S.; Borneo, R. Exploring the understanding of the term “ultra-processed foods” by young consumers. Food Res. Int. 2019, 115, 535–540. [Google Scholar] [CrossRef]
- Fakhoury, M. Revisiting the serotonin hypothesis: Implications for major depressive disorders. Mol. Neurobiol. 2016, 53, 2778–2786. [Google Scholar] [CrossRef] [PubMed]
- Ashton, L.M.; Hutchesson, M.J.; Rollo, M.E.; Morgan, P.J.; Thompson, D.I.; Collins, C.E. Young adult males’ motivators and perceived barriers towards eating healthily and being active: A qualitative study. Int. J. Behav. Nutr. Phys. Act. 2015, 12, 93. [Google Scholar] [CrossRef] [PubMed]
- Ashton, L.M.; Hutchesson, M.J.; Rollo, M.E.; Morgan, P.J.; Collins, C.E. Motivators and barriers to engaging in healthy eating and physical activity: A cross-sectional survey in young adult men. Am. J. Men’s Health 2017, 330–343. [Google Scholar] [CrossRef] [PubMed]
- Munt, A.E.; Partridge, S.R.; Allman-Farinelli, M. The barriers and enablers of healthy eating among young adults: A missing piece of the obesity puzzle: A scoping review. Obes. Rev. 2017, 18, 1–17. [Google Scholar] [CrossRef]
- Steptoe, A.; Perkins-Porras, L.; Hilton, S.; Rink, E.; Cappuccio, F.P. Quality of life and self-rated health in relation to changes in fruit and vegetable intake and in plasma vitamins C and E in a randomised trial of behavioural and nutritional education counselling. Br. J. Nutr. 2004, 92, 177–184. [Google Scholar] [CrossRef][Green Version]
- Carr, A.C.; Bozonet, S.M.; Pullar, J.M.; Vissers, M.C.M. Mood improvement in young adult males following supplementation with gold kiwifruit, a high-vitamin C food. J. Nutr. Sci. 2014, 2, e24. [Google Scholar] [CrossRef]
- Smith, A.P.; Rogers, R. Positive effects of a healthy snack (fruit) versus an unhealthy snack (chocolate/crisps) on subjective reports of mental and physical health: A preliminary intervention study. Front. Nutr. 2014, 1, 10. [Google Scholar] [CrossRef]
- Conner, T.S.; Brookie, K.L.; Carr, A.C.; Mainvil, L.A.; Vissers, M.C.M. Let them eat fruit! The effect of fruit and vegetable consumption on psychological well-being in young adults: A randomized controlled trial. PLoS ONE 2017, 12, e0171206. [Google Scholar] [CrossRef]
- Mujcic, R.; Oswald, A.J. Evolution of well-being and happiness after increases in consumption of fruit and vegetables. Am. J. Public Health 2016, 106, 1504–1510. [Google Scholar] [CrossRef] [PubMed]
- Yu, Z.M.; Parker, L.; Dummer, T.J.B. Depressive symptoms, diet quality, physical activity, and body composition among populations in Nova Scotia, Canada: Report from the Atlantic Partnership for Tomorrow’s Health. Prev. Med. 2014, 61, 106–113. [Google Scholar] [CrossRef] [PubMed]
- Elstgeest, L.E.M.; Winkens, L.H.H.; Penninx, B.W.J.H.; Brouwer, I.A.; Visser, M. Associations of depressive symptoms and history with three a priori diet quality indices in middle-aged and older adults. J. Affect. Disord. 2019, 249, 394–403. [Google Scholar] [CrossRef] [PubMed]
- Conklin, A.I.; Forouhi, N.G.; Surtees, P.; Khaw, K.-T.; Wareham, N.J.; Monsivais, P. Social relationships and healthful dietary behaviour: Evidence from over-50s in the EPIC cohort, UK. Soc. Sci. Med. 2014, 100, 167–175. [Google Scholar] [CrossRef] [PubMed]
- Haghighatdoost, F.; Azadbakht, L.; Keshteli, A.H.; Feinle-Bisset, C.; Daghaghzadeh, H.; Afshar, H.; Feizi, A.; Esmaillzadeh, A.; Adibi, P. Glycemic index, glycemic load, and common psychological disorders. Am. J. Clin. Nutr. 2016, 103, 201–209. [Google Scholar] [CrossRef] [PubMed]
- Gröber, U.; Schmidt, J.; Kisters, K. Magnesium in prevention and therapy. Nutrients 2015, 7, 8199–8226. [Google Scholar] [CrossRef] [PubMed]
- Sánchez-Villegas, A.; Martínez-González, M.A.; Estruch, R.; Salas-Salvadó, J.; Corella, D.; Covas, M.I.; Arós, F.; Romaguera, D.; Gómez-Gracia, E.; Lapetra, J.; et al. Mediterranean dietary pattern and depression: The PREDIMED Randomized Trial. BMC Med. 2013, 11, 208. [Google Scholar] [CrossRef]
- Gregório, M.J.; Rodrigues, A.M.; Eusébio, M.; Sousa, R.D.; Dias, S.; André, B.; Grønning, K.; Coelho, P.S.; Mendes, J.M.; Graça, P.; et al. Dietary patterns characterized by high meat consumption are associated with other unhealthy life styles and depression symptoms. Front. Nutr. 2017, 4, 25. [Google Scholar] [CrossRef]
- Roos, E.; Prättälä, R.; Lahelma, E.; Kleemola, P.; Pietinen, P. Modern and healthy: Socioeconomic differences in the quality of diet. Eur. J. Clin. Nutr. 1996, 50, 753–760. [Google Scholar]
- Irala Estévez, J.D.; Groth, M.; Johansson, L.; Oltersdorf, U.; Prättälä, R.; Martínez González, M.A. A systematic review of socio-economic differences in food habits in Europe: Consumption of fruit and vegetables. Eur. J. Clin. Nutr. 2000, 54, 706–714. [Google Scholar] [CrossRef]
- Groth, M.V.; Fagt, S.; Brøndsted, L. Social determinants of dietary habits in Denmark. Eur. J. Clin. Nutr. 2001, 55, 959–966. [Google Scholar] [CrossRef] [PubMed]
- Backholer, K.; Spencer, E.; Gearon, E.; Magliano, D.J.; McNaughton, S.A.; Shaw, J.E.; Peeters, A. The association between socio-economic position and diet quality in Australian adults. Public Health Nutr. 2016, 19, 477–485. [Google Scholar] [CrossRef]
- Deroover, K.; Bucher, T.; Vandelanotte, C.; de Vries, H.; Duncan, M.J. Practical nutrition knowledge mediates the relationship between sociodemographic characteristics and diet quality in adults: A cross-sectional analysis. Am. J. Health Promot. 2020, 34, 59–62. [Google Scholar] [CrossRef] [PubMed]
- Yau, A.; Adams, J.; White, M.; Nicolaou, M. Differences in diet quality and socioeconomic patterning of diet quality across ethnic groups: Cross-sectional data from the HELIUS Dietary Patterns study. Eur. J. Clin. Nutr. 2020, 74, 387–396. [Google Scholar] [CrossRef] [PubMed]
- Barnaba, L.; Intorre, F.; Azzini, E.; Ciarapica, D.; Venneria, E.; Foddai, M.S.; Maiani, F.; Raguzzini, A.; Polito, A. Evaluation of adherence to Mediterranean diet and association with clinical and biological markers in an Italian population. Nutrition 2020, 77, 110813. [Google Scholar] [CrossRef]
- Sánchez Ojeda, M.A.; Luna Bertos, E.D. Hábitos de vida saludable en la población universitaria. Nutr. Hosp. 2015, 31, 1910–1919. [Google Scholar] [CrossRef]
- Deliens, T.; Verhoeven, H.; de Bourdeaudhuij, I.; Huybrechts, I.; Mullie, P.; Clarys, P.; Deforche, B. Factors associated with fruit and vegetable and total fat intake in university students: A cross-sectional explanatory study. Nutr. Diet. 2018, 75, 151–158. [Google Scholar] [CrossRef] [PubMed]
- Dallongeville, J.; Marécaux, N.; Cottel, D.; Bingham, A.; Amouyel, P. Association between nutrition knowledge and nutritional intake in middle-aged men from Northern France. Public Health Nutr. 2001, 4, 27–33. [Google Scholar] [CrossRef] [PubMed]
- Turrell, G.; Kavanagh, A.M. Socio-economic pathways to diet: Modelling the association between socio-economic position and food purchasing behaviour. Public Health Nutr. 2006, 9, 375–383. [Google Scholar] [CrossRef]
- Hupkens, C.L.H.; Knibbe, R.A.; Drop, M.J. Social class differences in food consumption: The explanatory value of permissiveness and health and cost considerations. Eur. J. Public Health 2005, 10, 108–113. [Google Scholar] [CrossRef]
- Ball, K.; Crawford, D.; Mishra, G. Socio-economic inequalities in women’s fruit and vegetable intakes: A multilevel study of individual, social and environmental mediators. Public Health Nutr. 2006, 9, 623–630. [Google Scholar] [CrossRef]
- Lê, J.; Dallongeville, J.; Wagner, A.; Arveiler, D.; Haas, B.; Cottel, D.; Simon, C.; Dauchet, L. Attitudes toward healthy eating: A mediator of the educational level–diet relationship. Eur. J. Clin. Nutr. 2013, 67, 808–814. [Google Scholar] [CrossRef]
- Ramón Arbués, E.; Martínez Abadía, B.; Granada López, J.M.; Echániz Serrano, E.; Pellicer García, B.; Juárez Vela, R.; Guerrero Portillo, S.; Sáez Guinoa, M. Conducta alimentaria y su relación con el estrés, la ansiedad, la depresión y el insomnio en estudiantes universitarios. Nutr. Hosp. 2019, 36, 1339–1345. [Google Scholar] [CrossRef]
- Tardivo, A.P.; Nahas Neto, J.; Nahas, E.A.P.; Maestra, N.; Rodrigues, M.A.H.; Orsatti, F.L. Association between healthy eating patterns and indicators of metabolic risk in postmenopausal women. Nutr. J. 2010, 9, 64. [Google Scholar] [CrossRef]
- Sundararajan, K.; Campbell, M.K.; Choi, Y.-H.; Sarma, S. The relationship between diet quality and adult obesity: Evidence from Canada. J. Am. Coll. Nutr. 2014, 33, 1–17. [Google Scholar] [CrossRef]
- Knaapila, A.J.; Sandell, M.A.; Vaarno, J.; Hoppu, U.; Puolimatka, T.; Kaljonen, A.; Lagström, H. Food neophobia associates with lower dietary quality and higher BMI in Finnish adults. Public Health Nutr. 2015, 18, 2161–2171. [Google Scholar] [CrossRef]
- Surrow, S.; Jessen-Winge, C.; Ilvig, P.M.; Reffstrup Christensen, J. The motivation and opportunities for weight loss related to the everyday life of people with obesity: A qualitative analysis within the DO:IT study. Scand. J. Occup. Ther. 2020, 1–9. [Google Scholar] [CrossRef]
- Gibson, E.L. Emotional influences on food choice: Sensory, physiological and psychological pathways. Physiol. Behav. 2006, 89, 53–61. [Google Scholar] [CrossRef]
- Gomes, A.P.; Gonçalves Soares, A.L.; Gonçalves, H. Low diet quality in older adults: A population-based study in southern Brazil. Cien. Saude Colet. 2016, 21, 3417–3428. [Google Scholar] [CrossRef]
- Yuan, Y.-Q.; Li, F.; Dong, R.-H.; Chen, J.-S.; He, G.-S.; Li, S.-G.; Chen, B. The development of a Chinese Healthy Eating Index and its application in the general population. Nutrients 2017, 9, 977. [Google Scholar] [CrossRef]
- Martínez Lacoba, R.; Pardo García, I.; Amo Saus, E.; Escribano Sotos, F. Socioeconomic, demographic and lifestyle-related factors associated with unhealthy diet: A cross-sectional study of university students. BMC Public Health 2018, 18, 1241. [Google Scholar] [CrossRef]
- Moli, G.K.; Mini, G.K. Correlates of overweight among adult women in Kerala: A study based on National Family Health Survey (NFHS-3). Anthropologist 2012, 14, 67–72. [Google Scholar] [CrossRef]
- Biddle, S.J.H.; Asare, M. Physical activity and mental health in children and adolescents: A review of reviews. Br. J. Sports Med. 2011, 45, 886–895. [Google Scholar] [CrossRef]
- Kwan, B.M.; Davis, K.J.; Dunn, A.L. Physical activity for the prevention of depression. In Physical Activity across the Lifespan: Prevention and Treatment for Health and Well-Being; Meyer, A.L., Gullotta, T.P., Eds.; Springer: New York, NY, USA, 2012. [Google Scholar]
- Jewett, R.; Sabiston, C.M.; Brunet, J.; O’Loughlin, E.K.; Scarapicchia, T.; O’Loughlin, J. School sport participation during adolescence and mental health in early adulthood. J. Adolesc. Health 2014, 55, 640–644. [Google Scholar] [CrossRef]
- Hinkley, T.; Teychenne, M.; Downing, K.L.; Ball, K.; Salmon, J.; Hesketh, K.D. Early childhood physical activity, sedentary behaviors and psychosocial well-being: A systematic review. Prev. Med. 2014, 62, 182–192. [Google Scholar] [CrossRef] [PubMed]
- Doré, I.; O’Loughlin, J.L.; Beauchamp, G.; Martineau, M.; Fournier, L. Volume and social context of physical activity in association with mental health, anxiety and depression among youth. Prev. Med. 2016, 91, 344–350. [Google Scholar] [CrossRef] [PubMed]
- Paradis, A.-M.; Pérusse, L.; Vohl, M.-C. Dietary patterns and associated lifestyles in individuals with and without familial history of obesity: A cross-sectional study. Int. J. Behav. Nutr. Phys. Act. 2006, 3, 38. [Google Scholar] [CrossRef]
- Zamora, D.; Gordon-Larsen, P.; Jacobs, D.R.; Popkin, B.M. Diet quality and weight gain among black and white young adults: The Coronary Artery Risk Development in Young Adults (CARDIA) Study (1985–2005). Am. J. Clin. Nutr. 2010, 92, 784–793. [Google Scholar] [CrossRef] [PubMed]
- Parveen, Z.; Ali, A.; Ali, T.M.; Hasnain, A. Association of dietary patterns with anthropometric, lifestyle and socio-economic factors among women of selected communities from Karachi, Pakistan. J. Pak. Med. Assoc. 2016, 66, 1249–1257. [Google Scholar]
- Hann, C.S.; Rock, C.L.; King, I.; Drewnowski, A. Validation of de Healthy Eating Index with use of plasma biomarkers in a clini-cal sample of women. Am. J. Clin. Nutr. 2001, 74, 479–486. [Google Scholar] [CrossRef] [PubMed]
- Weinstein, S.J.; Vogt, T.M.; Gerrior, S.A. Healthy Eating Index scores are associated with blood nutrient concentrations in the Third National Health and Nutrition Examination Survey. J. Am. Diet. Assoc. 2004, 104, 576–584. [Google Scholar] [CrossRef] [PubMed]
- Thiele, S.; Mensink, G.B.M.; Beitz, R. Determinants of diet quality. Public Health Nutr. 2003, 7, 29–37. [Google Scholar] [CrossRef]
- Gorski, M.T.; Roberto, C.A. Public health policies to encourage healthy eating habits: Recent perspectives. J. Healthc. Leadersh. 2015, 7, 81–90. [Google Scholar] [CrossRef]
- Menozzi, D.; Sogari, G.; Mora, C. Understanding and modelling vegetables consumption among young adults. LWT 2017, 85, 327–333. [Google Scholar] [CrossRef]
- García, A.L.; Reardon, R.; McDonald, M.; Vargas García, E.J. Community interventions to improve cooking skills and their effects on confidence and eating behaviour. Curr. Nutr. Rep. 2016, 5, 315–322. [Google Scholar] [CrossRef]
- Hutchinson, J.; Watt, J.F.; Strachan, E.K.; Cade, J.E. Evaluation of the effectiveness of the Ministry of Food cooking programme on self-reported food consumption and confidence with cooking. Public Health Nutr. 2016, 19, 3417–3427. [Google Scholar] [CrossRef]
- Bloom, I.; Lawrence, W.; Barker, M.; Baird, J.; Dennison, E.; Sayer, A.A.; Cooper, C.; Robinson, S. What influences diet quality in older people? A qualitative study among community-dwelling older adults from the Hertfordshire Cohort Study, UK. Public Health Nutr. 2017, 20, 2685–2693. [Google Scholar] [CrossRef]


| Variables | People without Common Mental Disorders n = 48,079 (%) | People with Common Mental Disorders n = 12,545 (%) |
|---|---|---|
| Gender | ||
| Female | 24,817 (75.12%) | 8219 (24.88%) |
| Male | 23,262 (84.32%) | 4326 (15.68%) |
| Age groups (years) | ||
| Emerging adults | 2881 (84.39%) | 533 (15.61%) |
| Young adults | 17,343 (82.06%) | 3791 (17.94%) |
| Middle-aged adults | 16,368 (78.58%) | 4463 (21.42%) |
| Older adults | 11,487 (75.35%) | 3758 (24.65%) |
| Marital status | ||
| Never-married | 12,441 (81.69%) | 2789 (18.31%) |
| Married | 28,453 (81.23%) | 6575 (18.77%) |
| Widowed | 4277 (67.71%) | 2040 (32.29%) |
| Separated/divorced | 2908 (71.82%) | 1141 (28.18%) |
| Social class | ||
| Classes I and II | 9909 (84.36%) | 1837 (15.64%) |
| Classes III and IV | 20,250 (79.85%) | 5111 (20.15%) |
| Classes V and VI | 17,920 (76.20%) | 5597 (23.80%) |
| Educational level | ||
| Without formal education | 4637 (69.15%) | 2069 (30.85%) |
| Completed primary studies | 10,608 (77.00%) | 3169 (23.00%) |
| Completed secondary studies or professional training | 23,695 (80.43%) | 5766 (19.57%) |
| University studies | 9139 (85.57%) | 1541 (14.43%) |
| Nationality | ||
| Spanish | 44,928 (79.27%) | 11,751 (20.73%) |
| Foreign | 3151 (79.87%) | 794 (20.13%) |
| Population of town/city | ||
| <10,000 inhabitants | 11,901 (80.52%) | 2879 (19.48%) |
| ≥10,000 inhabitants | 36,178 (78.92%) | 9666 (21.08%) |
| Body Mass Index | ||
| Underweight | 800 (77.07%) | 238 (22.93%) |
| Normal-weight | 20,875 (80.39%) | 5092 (19.61%) |
| Overweight | 18,371 (80.01%) | 4589 (19.99%) |
| Obese | 8033 (75.36%) | 2626 (24.64%) |
| Self-perceived health status | ||
| Very good | 9452 (92.64%) | 751 (7.36%) |
| Good | 26,519 (87.25%) | 3877 (12.75%) |
| Fair | 9934 (67.86%) | 4704 (32.14%) |
| Poor | 1832 (43.48%) | 2381 (56.52%) |
| Very poor | 342 (29.13%) | 832 (70.87%) |
| Current smokers | ||
| Yes | 12,903 (78.68%) | 3496 (21.32%) |
| No | 35,176 (79.54%) | 9049 (20.46%) |
| Alcohol consumption in the past twelve months | ||
| Yes | 20,943 (82.66%) | 4394 (17.34%) |
| No | 27,136 (76.90%) | 8151 (23.10%) |
| Physical exercise in main activity | ||
| Yes | 31,838 (81.75%) | 7108 (18.25%) |
| No | 16,241 (74.92%) | 5437 (25.08%) |
| Leisure-time physical activity | ||
| Yes | 30,527 (83.04%) | 6233 (16.96%) |
| No | 17,552 (73.55%) | 6312 (26.45%) |
| Variables | People without Common Mental Disorders n = 48,079 (%) | People with Common Mental Disorders n = 12,545 (%) | p-Value |
|---|---|---|---|
| Frequency of bread/grains consumption | |||
| Never or hardly ever | 859 (1.79%) | 329 (2.62%) | <0.001 |
| <1 a week | 663 (1.38%) | 248 (1.98%) | |
| 1–2 a week | 1575 (3.27%) | 440 (3.51%) | |
| ≥3 times a week, but not daily | 3044 (6.33%) | 816 (6.50%) | |
| Daily | 41,938 (87.23%) | 10,712 (85.39%) | |
| Frequency of vegetable consumption | |||
| Never or hardly ever | 582 (1.21%) | 227 (1.81%) | <0.001 |
| <1 a week | 1160 (2.41%) | 358 (2.85%) | |
| 1–2 a week | 6318 (13.14%) | 1714 (13.66%) | |
| ≥3 times a week, but not daily | 18,491 (38.46%) | 4335 (34.56%) | |
| Daily | 21,528 (44.78%) | 5911 (47.12%) | |
| Frequency of fruit consumption | |||
| Never or hardly ever | 1462 (3.04%) | 549 (4.38%) | <0.001 |
| <1 a week | 1434 (2.98%) | 463 (3.69%) | |
| 1–2 a week | 4140 (8.61%) | 1166 (9.29%) | |
| ≥3 times a week, but not daily | 8131 (16.91%) | 1883 (15.01%) | |
| Daily | 32,912 (68.46%) | 8484 (67.63%) | |
| Frequency of consumption of dairy products | |||
| Never or hardly ever | 1072 (2.23%) | 373 (2.97%) | <0.001 |
| <1 a week | 684 (1.42%) | 185 (1.48%) | |
| 1–2 a week | 1389 (2.89%) | 417 (3.32%) | |
| ≥3 times a week, but not daily | 3012 (6.26%) | 751 (5.99%) | |
| Daily | 41,922 (87.20%) | 10,819 (86.24%) | |
| Frequency of meat consumption | |||
| Never or hardly ever | 580 (1.21%) | 254 (2.03%) | <0.001 |
| <1 a week | 1107 (2.30%) | 483 (3.85%) | |
| 1–2 a week | 13,089 (27.22%) | 3942 (31.42%) | |
| ≥3 times a week, but not daily | 27,718 (57.65%) | 6496 (51.78%) | |
| Daily | 5585 (11.62%) | 1370 (10.92%) | |
| Frequency of consumption of legumes | |||
| Never or hardly ever | 1163 (2.42%) | 455 (3.63%) | <0.001 |
| <1 a week | 5200 (10.81%) | 1452 (11.57%) | |
| 1–2 a week | 29,361 (61.07%) | 7233 (57.66%) | |
| ≥3 times a week, but not daily | 11,515 (23.95%) | 3132 (24.97%) | |
| Daily | 840 (1.75%) | 273 (2.17%) | |
| Frequency of consumption of cold meats and cuts | |||
| Never or hardly ever | 6314 (13.13%) | 2387 (19.03%) | <0.001 |
| <1 a week | 8871 (18.45%) | 2612 (20.82%) | |
| 1–2 a week | 14,190 (29.52%) | 3515 (28.02%) | |
| ≥3 times a week, but not daily | 12,002 (24.96%) | 2480 (19.77%) | |
| Daily | 6702 (13.94%) | 1551 (12.36%) | |
| Frequency of consumption of sweets | |||
| Never or hardly ever | 8181 (17.01%) | 2626 (20.93%) | <0.001 |
| <1 a week | 7905 (16.44%) | 2094 (16.69%) | |
| 1–2 a week | 9663 (20.10%) | 2220 (17.70%) | |
| ≥3 times a week, but not daily | 7542 (15.69%) | 1699 (13.54%) | |
| Daily | 14,788 (30.76%) | 3906 (31.14%) | |
| Frequency of consumption of soft drinks with sugar | |||
| Never or hardly ever | 23,519 (48.92%) | 6945 (55.36%) | <0.001 |
| <1 a week | 8676 (18.05%) | 1894 (15.10%) | |
| 1–2 a week | 6940 (14.43%) | 1387 (11.05%) | |
| ≥3 times a week, but not daily | 3832 (7.97%) | 883 (7.04%) | |
| Daily | 5112 (10.63%) | 1436 (11.45%) | |
| Diet quality | |||
| Poor diet quality | 1130 (2.35%) | 354 (2.82%) | <0.001 |
| Moderate diet quality | 30,878 (64.22%) | 7639 (60.89%) | |
| Good diet quality | 16,071 (33.43%) | 4552 (36.29%) |
| Variables | People without Common Mental Disorders (n = 48,079) M (SD) | People with Common Mental Disorders (n = 12,545) M (SD) | p-Value |
|---|---|---|---|
| Bread/grains consumption (points) | 9.40 (1.85) | 9.25 (2.11) | <0.001 |
| Vegetable consumption (points) | 8.08 (2.14) | 8.06 (2.28) | 0.34 |
| Fruit consumption (points) | 8.62 (2.45) | 8.45 (2.70) | <0.001 |
| Consumption of dairy products (points) | 9.37 (1.94) | 9.28 (2.12) | <0.001 |
| Meat consumption (points) | 7.45 (2.33) | 7.49 (2.46) | 0.10 |
| Consumption of legumes (points) | 8.49 (2.31) | 8.27 (2.51) | <0.001 |
| Consumption of cold meats and cuts (points) | 5.11 (3.08) | 5.60 (3.17) | <0.001 |
| Consumption of sweets (points) | 4.53 (3.71) | 4.76 (3.85) | <0.001 |
| Consumption of soft drinks with sugar (points) | 7.29 (3.36) | 7.50 (3.44) | <0.001 |
| Overall diet quality (points) | 74.96 (10.86) | 75.27 (11.64) | <0.01 |
| Frequency of Consumption Recommended by the Spanish Society of Community Nutrition | Type of Food | Age Groups | People with Common Mental Disorders n = 12,545 (%) | People without Common Mental Disorders n = 48,079 (%) | p-Value |
|---|---|---|---|---|---|
| Daily consumption | Bread/grains | Emerging adults (18–24 years old) | 401 (3.74%) | 2384 (5.69%) | <0.001 |
| Young adults (25–44 years old) | 3113 (29.06%) | 14,683 (35.01%) | |||
| Middle-aged adults (45–64 years old) | 3879 (36.21%) | 14,477 (34.52%) | |||
| Older adults (≥65 years old) | 3319 (30.99%) | 10,394 (24.78%) | |||
| Vegetables | Emerging adults (18–24 years old) | 176 (2.98%) | 895 (3.92%) | <0.001 | |
| Young adults (25–44 years old) | 1652 (27.95%) | 6902 (32.06%) | |||
| Middle-aged adults (45–64 years old) | 2250 (38.06%) | 7913 (36.76%) | |||
| Older adults (≥65 years old) | 1833 (31.01%) | 5868 (27.26%) | |||
| Fruit | Emerging adults (18–24 years old) | 220 (2.59%) | 1287 (3.91%) | <0.001 | |
| Young adults (25–44 years old) | 2019 (23.80%) | 10,198 (30.99%) | |||
| Middle-aged adults (45–64 years old) | 3163 (37.28%) | 11,985 (36.41%) | |||
| Older adults (≥65 years old) | 3082 (36.33%) | 9442 (28.69%) | |||
| Dairy products | Emerging adults (18–24 years old) | 440 (4.06%) | 2453 (5.85%) | <0.001 | |
| Young adults (25–44 years old) | 3199 (29.57%) | 15,036 (35.87%) | |||
| Middle-aged adults (45–64 years old) | 3797 (35.10%) | 14,180 (33.82%) | |||
| Older adults (≥65 years old) | 3383 (31.27%) | 10,253 (24.46%) | |||
| 1–2 times a week | Meat | Emerging adults (18–24 years old) | 111 (2.82%) | 559 (4.27%) | <0.001 |
| Young adults (25–44 years old) | 869 (22.04%) | 3746 (28.62%) | |||
| Middle-aged adults (45–64 years old) | 1500 (38.05%) | 4714 (36.02%) | |||
| Older adults (≥65 years old) | 1462 (37.09%) | 4070 (31.09%) | |||
| Legumes | Emerging adults (18–24 years old) | 260 (3.59%) | 1685 (5.74%) | <0.001 | |
| Young adults (25–44 years old) | 2169 (29.99%) | 10,524 (35.84%) | |||
| Middle-aged adults (45–64 years old) | 2674 (36.97%) | 10,211 (34.78%) | |||
| Older adults (≥65 years old) | 2130 (29.45%) | 6941 (23.64%) | |||
| Never or hardly ever | Cold meats and cuts | Emerging adults (18–24 years old) | 60 (2.51%) | 235 (3.72%) | <0.001 |
| Young adults (25–44 years old) | 526 (22.04%) | 1812 (28.70%) | |||
| Middle-aged adults (45–64 years old) | 771 (32.30%) | 2049 (32.45%) | |||
| Older adults (≥65 years old) | 1030 (43.15%) | 2218 (35.13%) | |||
| Sweets | Emerging adults (18–24 years old) | 61 (2.32%) | 254 (3.11%) | <0.001 | |
| Young adults (25–44 years old) | 644 (24.52%) | 2318 (28.33%) | |||
| Middle-aged adults (45–64 years old) | 1007 (38.35%) | 3165 (38.69%) | |||
| Older adults (≥65 years old) | 914 (34.81%) | 2444 (29.87%) | |||
| Soft drinks with sugar | Emerging adults (18–24 years old) | 123 (1.77%) | 517 (2.20%) | <0.001 | |
| Young adults(25–44 years old) | 1384 (19.93%) | 5904 (25.10%) | |||
| Middle-aged adults(45–64 years old) | 2604 (37.49%) | 9056 (38.51%) | |||
| Older adults(≥65 years old) | 2834 (40.81%) | 8042 (34.19%) | |||
| Diet Quality | Age Groups | People with Common Mental Disorders n = 12,545 (%) | People without Common Mental Disorders n = 48,079 (%) | p-Value | |
| Poor diet quality | Emerging adults (18–24 years old) | 71 (20.06%) | 299 (26.46%) | 0.04 | |
| Young adults (25–44 years old) | 206 (58.19%) | 636 (56.28%) | |||
| Middle-aged adults (45–64 years old) | 61 (17.23%) | 161 (14.25%) | |||
| Older adults (≥65 years old) | 16 (4.52%) | 34 (3.01%) | |||
| Moderate diet quality | Emerging adults (18–24 years old) | 416 (5.45%) | 2265 (7.34%) | <0.001 | |
| Young adults (25–44 years old) | 2768 (36.24%) | 13,019 (42.16%) | |||
| Middle-aged adults (45–64 years old) | 2637 (34.52%) | 10,032 (32.49%) | |||
| Older adults (≥65 years old) | 1818 (23.80%) | 5562 (18.01%) | |||
| Good diet quality | Emerging adults (18–24 years old) | 46 (1.01%) | 317 (1.97%) | <0.001 | |
| Young adults (25–44 years old) | 817 (17.95%) | 3688 (22.95%) | |||
| Middle-aged adults (45–64 years old) | 1765 (38.77%) | 6175 (38.42%) | |||
| Older adults (≥65 years old) | 1924 (42.27%) | 5891 (36.66%) | |||
| Variables | Participants with Common Mental Disorders (n = 12,545) | ||||
|---|---|---|---|---|---|
| Poor/Moderate Diet Quality (n = 7993) | |||||
| n (%) | OR (CI 95%) | p-Value | ORa (CI 95%) 1 | p-Value | |
| Gender | |||||
| Female | 3005 (37.60%) | 0.68 (0.63–0.73) | <0.001 | 0.70 (0.65–0.77) | <0.001 |
| Male | 4988 (62.40%) | Reference | Reference | ||
| Age groups (years) | |||||
| Emerging adults | 487 (6.09%) | 2.91 (2.13–3.97) | <0.001 | 2.44 (1.60–3.36) | <0.001 |
| Young adults | 2974 (37.21%) | Reference | Reference | ||
| Middle-aged adults | 2698 (33.75%) | 0.42 (0.38–0.46) | <0.001 | 0.46 (0.41–0.51) | <0.001 |
| Older adults | 1834 (22.95%) | 0.26 (0.24–0.29) | <0.001 | 0.31 (0.27–0.35) | <0.001 |
| Marital status | |||||
| Never-married | 2175 (27.21%) | 2.31 (2.08–2.56) | <0.001 | 1.35 (1.21–1.52) | <0.001 |
| Married | 3982 (49.82%) | Reference | Reference | ||
| Widowed | 1035 (12.95%) | 0.67 (0.61–0.74) | <0.001 | 1.09 (0.97–1.22) | 0.13 |
| Separated/divorced | 801 (10.02%) | 1.53 (1.34–1.76) | <0.001 | 1.36 (1.18–1.57) | <0.001 |
| Social class | |||||
| Classes I and II | 1144 (14.31%) | 0.91 (0.82–1.02) | 0.10 | ||
| Classes III and IV | 3246 (40.61%) | 0.96 (0.89–1.04) | 0.35 | ||
| Classes V and VI | 3603 (45.08%) | Reference | |||
| Educational level | |||||
| Without formal education | 1120 (14.01%) | 0.55 (0.49–0.61) | <0.001 | 1.24 (1.09–1.40) | <0.01 |
| Completed primary studies | 1901 (23.78%) | 0.70 (0.64–0.76) | <0.001 | 1.17 (1.06–1.29) | <0.01 |
| Completed secondary studies or professional training | 3939 (49.28%) | Reference | Reference | ||
| University studies | 1033 (12.93%) | 0.94 (0.84–1.06) | 0.34 | 0.91 (0.80–1.04) | 0.16 |
| Nationality | |||||
| Spanish | 7353 (91.99%) | Reference | Reference | ||
| Foreign | 640 (8.01%) | 2.49 (2.07–2.98) | <0.001 | 157 (1.30–1.90) | <0.001 |
| Population of town/city | |||||
| <10,000 inhabitants | 1794 (22.44%) | 0.93 (0.85–1.01) | 0.08 | ||
| ≥10,000 inhabitants | 6199 (77.56%) | Reference | |||
| Body Mass Index | |||||
| Underweight | 184 (2.30%) | 1.53 (1.12–2.08) | <0.01 | 1.29 (0.93–1.79) | 0.13 |
| Normal-weight | 3515 (43.98%) | Reference | Reference | ||
| Overweight | 2752 (34.43%) | 0.67 (0.62–0.73) | <0.001 | 0.83 (0.76–0.91) | <0.001 |
| Obese | 1542 (19.29%) | 0.64 (0.58–0.70) | <0.001 | 0.84 (0.76–0.94) | <0.01 |
| Self-perceived health status | |||||
| Very good | 532 (6.66%) | 1.50 (1.27–1.77) | <0.001 | ||
| Good | 2650 (33.15%) | 1.33 (1.22–1.46) | <0.001 | ||
| Fair | 2911 (36.42%) | Reference | |||
| Poor | 1391 (17.40%) | 0.87 (0.78–0.96) | <0.01 | ||
| Very poor | 509 (6.37%) | 0.97 (0.84–1.13) | 0.70 | ||
| Current smokers | |||||
| Yes | 2689 (33.64%) | 2.35 (2.15–2.57) | <0.001 | 1.59 (1.44–1.75) | <0.001 |
| No | 5304 (66.36%) | Reference | Reference | ||
| Alcohol consumption in the past twelve months | |||||
| Yes | 2925 (36.59%) | 1.21 (1.12–1.31) | <0.001 | ||
| No | 5068 (63.41%) | Reference | |||
| Physical exercise in main activity | |||||
| Yes | 4602 (57.58%) | Reference | |||
| No | 3391 (42.42%) | 0.90 (0.84–0.97) | <0.01 | ||
| Leisure-time physical activity | |||||
| Yes | 3863 (48.33%) | 0.86 (0.80–0.93) | <0.001 | 0.78 (0.72–0.84) | <0.001 |
| No | 4130 (51.67%) | Reference | Reference | ||
| Variables | Participants without Common Mental Disorders (n = 48,079) | ||||
|---|---|---|---|---|---|
| Poor/Moderate Diet Quality (n = 32,008) | |||||
| n (%) | OR (CI 95%) | p-Value | ORa (CI 95%) 1 | p-Value | |
| Gender | |||||
| Female | 15,288 (47.76%) | 0.63 (0.60–0.65) | <0.001 | 0.62 (0.59–0.65) | <0.001 |
| Male | 16,720 (52.24%) | Reference | Reference | ||
| Age groups (years) | |||||
| Emerging adults | 2564 (8.01%) | 2.19 (1.93–2.47) | <0.001 | 1.77 (1.56–2.01) | <0.001 |
| Young adults | 13,655 (42.66%) | Reference | Reference | ||
| Middle-aged adults | 10,193 (31.85%) | 0.45 (0.43–0.47) | <0.001 | 0.48 (0.45–0.50) | <0.001 |
| Older adults | 5596 (17.48%) | 0.26 (0.24–0.27) | <0.001 | 0.29 (0.26–0.31) | <0.001 |
| Marital status | |||||
| Never-married | 9765 (30.51%) | 2.07 (1.97–2.18) | <0.001 | 1.31 (1024–1.38) | <0.001 |
| Married | 18,144 (56.68%) | Reference | Reference | ||
| Widowed | 2099 (6.56%) | 0.55 (0.51–0.58) | <0.001 | 1.06 (0.99–1.14) | 0.11 |
| Separated/divorced | 2000 (6.25%) | 1.25 (1.15–1.36) | <0.001 | 1.20 (1.10–1.31) | <0.001 |
| Social class | |||||
| Classes I and II | 6309 (19.71%) | 0.89 (0.84–0.93) | <0.001 | 0.89 (0.84–0.94) | <0.001 |
| Classes III and IV | 13,452 (42.03%) | Reference | Reference | ||
| Classes V and VI | 12,247 (38.26%) | 1.09 (1.05–1.14) | <0.001 | 1.08 (1.03–1.13) | <0.01 |
| Educational level | |||||
| Without formal education | 2543 (7.95%) | 0.49 (0.46–0.52) | <0.001 | 1.00 (0.93–1.08) | 0.99 |
| Completed primary studies | 6473 (20.22%) | 0.63 (0.60–0.66) | <0.001 | 1.02 (0.96–1.08) | 0.53 |
| Completed secondary studies or professional training | 16,933 (52.90%) | Reference | Reference | ||
| University studies | 6059 (18.93%) | 0.79 (0.75–0.83) | <0.001 | 0.90 (0.84–0.95) | <0.01 |
| Nationality | |||||
| Spanish | 29,539 (92.29%) | Reference | Reference | ||
| Foreign | 2469 (7.71%) | 1.89 (1.73–2.06) | <0.001 | 1.23 (1.12–1.34) | <0.001 |
| Population of town/city | |||||
| <10,000 inhabitants | 7933 (24,78%) | 1.01 (0.96–1.10) | 0.82 | ||
| ≥10,000 inhabitants | 24,075 (75.22%) | Reference | |||
| Body Mass Index | |||||
| Underweight | 632 (1.97%) | 1.69 (1.42–2.01) | <0.001 | 1.47 (1.23–1.77) | <0.001 |
| Normal-weight | 14,397 (44.98%) | Reference | Reference | ||
| Overweight | 11,894 (37.16%) | 0.83 (0.79–0.86) | <0.001 | 0.98 (0.93–1.02) | 0.55 |
| Obese | 5085 (15.89%) | 0.78 (0.74–0.82) | <0.001 | 0.98 (0.93–1.04) | 0.32 |
| Self-perceived health status | |||||
| Very good | 6876 (21.48%) | 1.27 (1.20–1.33) | <0.001 | 1.02 (0.96–1.07) | 0.61 |
| Good | 17,988 (56.20%) | Reference | Reference | ||
| Fair | 5910 (18.47%) | 0.70 (0.66–0.73) | <0.001 | 0.93 (0.88–0.98) | <0.01 |
| Poor | 1048 (3.27%) | 0.63 (0.58–0.70) | <0.001 | 0.91 (0.82–1.03) | 0.06 |
| Very poor | 186 (0.58%) | 0.57 (0.46–0.70) | <0.001 | 0.80 (0.64–0.99) | 0.04 |
| Current smokers | |||||
| Yes | 9952 (31.09%) | 2.01 (1.92–2.10) | <0.001 | 1.42 (1.36–1.50) | <0.001 |
| No | 22,056 (68.91%) | Reference | Reference | ||
| Alcohol consumption in the past twelve months | |||||
| Yes | 14,321 (44.74%) | 1.16 (1.11–1.20) | <0.001 | 1.04 (1.01–1.09) | 0.04 |
| No | 17,687 (55.26%) | Reference | Reference | ||
| Physical activity in main activity | |||||
| Physically active | 21,164 (66.12%) | Reference | |||
| Not physically active | 10,844 (33.88%) | 1.01 (0.97–1.06) | 0.52 | ||
| Leisure-time physical activity | |||||
| Yes | 19,381 (60.55%) | Reference | Reference | ||
| No | 12,627 (39.45%) | 1.47 (1.42–1.53) | <0.001 | 1.47 (1.40–1.53) | <0.001 |
Publisher’s Note: MDPI stays neutral with regard to jurisdictional claims in published maps and institutional affiliations. |
© 2021 by the authors. Licensee MDPI, Basel, Switzerland. This article is an open access article distributed under the terms and conditions of the Creative Commons Attribution (CC BY) license (https://creativecommons.org/licenses/by/4.0/).
Share and Cite
Cebrino, J.; Portero de la Cruz, S. Diet Quality According to Mental Status and Associated Factors during Adulthood in Spain. Nutrients 2021, 13, 1727. https://doi.org/10.3390/nu13051727
Cebrino J, Portero de la Cruz S. Diet Quality According to Mental Status and Associated Factors during Adulthood in Spain. Nutrients. 2021; 13(5):1727. https://doi.org/10.3390/nu13051727
Chicago/Turabian StyleCebrino, Jesús, and Silvia Portero de la Cruz. 2021. "Diet Quality According to Mental Status and Associated Factors during Adulthood in Spain" Nutrients 13, no. 5: 1727. https://doi.org/10.3390/nu13051727
APA StyleCebrino, J., & Portero de la Cruz, S. (2021). Diet Quality According to Mental Status and Associated Factors during Adulthood in Spain. Nutrients, 13(5), 1727. https://doi.org/10.3390/nu13051727