Article

Obesity Development and Signs of Metabolic Abnormalities in Young Göttingen Minipigs Consuming Energy Dense Diets Varying in Carbohydrate Quality

by
Mihai Victor Curtasu
*,
Mette Skou Hedemann
,
Helle Nygaard Lærke
and
Knud Erik Bach Knudsen
Department of Animal Science, Aarhus University, Blichers Alle 20, DK-8830 Tjele, Denmark
*
Author to whom correspondence should be addressed.
Nutrients 2021, 13(5), 1560; https://doi.org/10.3390/nu13051560
Submission received: 3 April 2021 / Revised: 27 April 2021 / Accepted: 29 April 2021 / Published: 6 May 2021

Abstract

:
Consumption of fructose has been associated with a higher risk of developing obesity and metabolic syndrome (MetS). The aim of this study was to examine the long-term effects of fructose compared to starch from high-amylose maize starch (HiMaize) at ad libitum feeding in a juvenile Göttingen Minipig model with 20% of the diet provided as fructose as a high-risk diet (HR, n = 15) and 20% as HiMaize as a lower-risk control diet (LR, n = 15). The intake of metabolizable energy was on average similar (p = 0.11) among diets despite increased levels of the satiety hormone PYY measured in plasma (p = 0.0005) of the LR pigs. However, after over 20 weeks of ad libitum feeding, no difference between diets was observed in daily weight gain (p = 0.103), and a difference in BW was observed only at the end of the experiment. The ad libitum feeding promoted an obese phenotype over time in both groups with increased plasma levels of glucose (p = 0.005), fructosamine (p < 0.001), insulin (p = 0.03), and HOMA-IR (p = 0.02), whereas the clinical markers of dyslipidemia were unaffected. When compared to the LR diet, fructose did not accelerate the progression of MetS associated parameters and largely failed to change markers that indicate a stimulated de novo lipogenesis.

Graphical Abstract

1. Introduction

People in developed countries are increasingly adopting unhealthy dietary patterns with poor quality foods based on refined carbohydrates, high levels of fats, and low in dietary fiber (DF). Easy access to such foods, together with a lack of physical activity, has led to an alarming rise in obesity and metabolic syndrome (MetS) [1]. Not only adults suffer from an increased prevalence of obesity, but also childhood obesity that has almost tripled since 1970 [2]. MetS presents complex pathophysiology characterized by abdominal obesity, insulin resistance (IR), hypertension, dyslipidemia, which increases the risk of developing type 2 diabetes (T2D) and cardiovascular disease (CVD) [3].
Obesity and MetS research relied so far primarily on rodent models [4], but recently there has been an increased interest in domestic and miniature swine, a suitable model for disease as demonstrated by the increased use of the Göttingen, Yucatan, and Ossabaw minipig breeds [5,6,7,8]. In addition to similarities regarding genome, anatomy, and digestive physiology, obese pigs are also closely related to obese humans due to their lack of postnatal brown fat, similar metabolic features, cardiovascular system, comparable organ size, and deposition of body fat [5]. Close similarities to human proteins and inflammation responses have also been recently identified [9]. Age and gender of the animal model have an important contribution to the metabolic response in dietary intervention studies [10]. Female minipigs are preferred due to their predisposition to increased weight gain, fat deposition, and dyslipidemic responses compared to males [10,11]. However, animal models studying the onset of obesity in early life are scarce, and the longitudinal aspect of obesity and MetS in juvenile animals has not been well assessed, particularly when subjected to ad libitum feeding.
High-fructose corn syrup used in different pre-packaged foods, fast foods, and soft drinks has been associated with adverse health effects such as obesity development and altered hepatic metabolism through fat accumulation and development of non-alcoholic fatty liver disease (NAFLD) [12,13,14]. Fructose is characterized by a metabolism that may favor hepatic lipogenesis [14]. In contrast to glucose, rapid fructose phosphorylation, and conversion to triose phosphates (glyceraldehyde, dihydroxyacetone phosphate, and glyceraldehyde-3-phosphate), bypasses the key regulatory mechanisms of phosphofructokinase in liver glycolysis [13]. The resulting increase in lipogenic precursors can be mobilized for de novo lipogenesis (DNL), gluconeogenesis, or oxidation pathways [15]. Epidemiological and interventional studies, however, have not been able to clearly support the idea that fructose, compared to other energy-dense nutrients, causes more liver fat accumulation. More likely, the observed steatotic effects of fructose are confounded by obesity and a continuous positive energy balance [16].
The primary objective of the current study was to investigate the physiological effects of high levels of fructose in a diet compared to similar levels of high amylose (HiMaize) starch on obesity development and the risk for developing metabolic abnormalities. We examined the longitudinal effects of the two diets on obesity development and changes in specific MetS biomarkers in a young minipig model over five months of ad libitum intake of a high-risk (HR) fructose based diet compared to a control lower-risk (LR) diet containing the same amount of glucose from HiMaize starch, which contains digestible and fermentable starch [17,18]. It is hypothesized that fructose, because of its metabolic effects, will lead to a more rapid development of obesity and markers of metabolic abnormalities of the young Göttingen Minipigs. This paper is a continuation on the study of Curtasu et al. (2020), where samples collected from this miniature pig model were previously assessed from a metabolomics and gut microbiota profiling perspective [19].

2. Materials and Methods

2.1. Experimental Diets

Two experimental diets were formulated with 20% of the diet provided as either fructose in the HR diet or as digestible and fermentable starch from HiMaize in the LR control diet (Table S1). The remaining 80% of the diets were similar and provided the fat (35% of energy) and protein (10% of energy), and carbohydrates from starch and fiber. The HR diet formulation resulted in a limited content of dietary fiber (DF) (5% of energy), resembling a typical western-style diet in terms of DF content. The fat source used in this experiment contained the following fatty acid profile: 45.1% saturated, 45.1% monounsaturated, and 9.8% poly-unsaturated fatty acids.

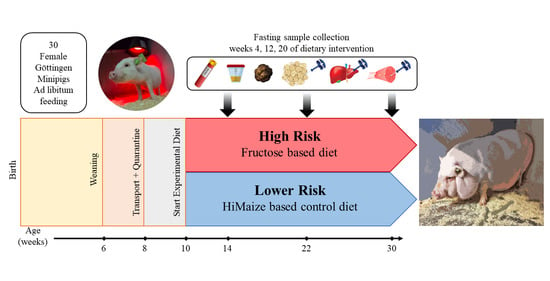
2.2. Animals and Experimental Design

Experimental procedures regarding handling of animals were done in accordance with Danish laws and regulations regarding the humane care and use of animals in research (The Danish Ministry of Justice, Act on Animal Experiments no. 474 of 15 May 2014, as stipulated in the executive order no. 12 or 7 January 2016) and according to licenses obtained from the Danish Animal Experimentation Inspectorate, Ministry of Food, Agriculture and Fisheries (Animal experiment permit: 2015−15−0201−00599). Animals were monitored closely on a daily basis by observing the general condition and any manifestations of reduced feeding or drinking desire, lethargy, reduced spontaneous activity, vomiting, fever, diarrhea, labored respiration, or decreased interactions with humans and neighboring pigs. The pigs’ blood sugar levels were monitored bi-weekly using an ear prick glucose test (Accu-Check, Roche Diabetes Care, Inc., Indianapolis, IN, USA). Humane end-points were considered when the condition of the animals could not be remedied by treatment within 1–3 days, the cause could not be clarified or if the pigs were subjected to exceeding strain. None of the animals presented any declining health conditions and all animals completed the trial.
A total of 30 female Göttingen Minipigs (Ellegaard Göttingen Minipigs, Dalmose, Denmark) were delivered at 8 weeks of age in 4 separate blocks over 8 months and were kept isolated from other pigs at the facility for the entire period of the study (Figure S1). In each block, animals were randomly allocated to the diets and pens. Access and handling were permitted only by wearing disposable overalls and latex gloves. For one week, paired housing and restricted feeding of a standard Special Diet Services (SDS, Dietex International, Essex, UK) minipig chow was used according to breeders’ recommendations, followed by gradually transitioning to the experimental diets throughout the coming week. At the start of ad libitum feeding with the experimental diets, animals were separated and housed individually in pens (1.5 × 2.4 m). Wood shavings were provided as bedding, and water provided ad libitum from drinking nipples. The animals had visible access and contact with neighboring animals through open grilled side panels. For the current study, 15 animals per treatment were allotted to the LR and HR diet, respectively. The feed was provided ad libitum for 20 weeks. Feed was weighed out for 2-week periods based on estimated feed intake, and residues collected during this period were pooled and used for calculating daily feed intake. Body weight was recorded every second week for the first six weeks, followed by measurements every fourth week. Every second week, length, chest circumference, and abdominal circumference of the animals were measured. The weight of the animals before the start of dietary transition was not different between the two assigned groups (HR, 3.03 ± 1.9 kg; LR, 3.04 ± 1.9 kg). The animals utilized in this study were previously used for metabolomics and gut microbiota profiling by Curtasu et al. (2020) [19].

2.3. Sample Collection

At 4, 12, and 20 weeks of the dietary intervention, animals underwent a broad sample collection procedure. After overnight fasting (16 h) animals were put under anesthesia using 0.1 mL/kg body weight of Zolitil-mixture containing 50 mg/mL tiletamine/zolazepam (Vibrac SA, Carros, France), 2.5 mg/mL butorphanol (Torbugesic® Vet, Scan Vet Animal Health A/S, Fredensborg, Denmark), 12.5 mg/mL ketamine (Ketaminol Vet, Intervet Denmark, Skovlunde, Denmark), and 12.5 mg/mL xylazine (Rompun, Bayer Health Care AG, Leverkusen, Germany). Blood sampling was performed from the jugular vein with the animals in a supine position. A total of 17 mL was collected in vacutainers: 6 mL LiHep, 6 mL K3EDTA, 3 mL LiHepSep, 1 mL K3EDTA/Aprotinin inhibitor (10,000 KIU/mL blood, Nordic Pharma Ltd., Ismaning, Bayern, Germany), 1 mL K3EDTA/DPPIV inhibitor (Vacuette, Greiner Bio-One International, GmbH, Kremsmünster, Austria). Blood plasma was aliquoted for separate analyses and stored at −80 °C after the tubes were centrifuged (12 min at 4 °C, 3300 rpm).
Liver biopsy was performed by moving the animal in a left recumbent position for liver access. The area between the first and fifth teat was shaved and disinfected with 0.5% chlorhexidine solution in 85% alcohol (Abena A/S, Aabenraa, Denmark). Procaine (Procamidor VET, 20 mg/mL, Richter Pharma, AG, Wels, Austria) was injected subcutaneously as a local anesthetic. Ultrasound scanning using a 6–18 MHz linear probe (MyLabTM Five VET, Biosound Esaote Inc., Indianapolis, IN, USA) was performed for guided assistance of the liver biopsy and determining the location of the gallbladder to avoid puncture or damage to surrounding tissues or organs. After a small incision of the skin (5–7 mm), 2–4 biopsies were taken to a total amount of maximum 50 mg of liver tissue with a biopsy pistol (Pro-MagTM I 2.5, Argon Medical Devices Inc., Frisco, TX, USA) and a 14 G × 10 cm needle (Argon Medical Devices Inc., Frisco, TX, USA). Following the procedure, the incision site was closed with surgical staples. Figure S2 presents a visual illustration of the liver biopsy procedure. Afterwards, the right hind leg was cleaned, disinfected, and locally anesthetized, similar to the liver biopsy procedure. After a 15–20 mm skin incision, approximatively 100 mg of subcutaneous adipose tissue (SAT) was collected for gene expression, snap-frozen in liquid N2, and stored at −80 °C until analysis. Muscle tissue (50–100 mg) was collected for gene expression from the semitendinosus muscle with the biopsy pistol. A few drops of Streptocillin®Vet. (Boehringer Ingelheim Animal Health Nordics A/S, København Ø, Denmark) were administered to the incision site and closed with surgical staples. Both muscle and liver tissues were placed in sterile tubes with RNA later (Sigma-Aldrich Co. LLC, Saint Louis, MO, USA). Fresh feces were collected from the animals immediately after defecation as an effect of the anesthesia. Following these procedures, spot urine samples were collected by placing absorbent tampons on the rear of the minipigs adhesive fabric tape (Omniplast, Hartmann, Baden-Württemberg, Germany).

2.4. Analytical Methods

Freeze-dried material in duplicate was used for the chemical analysis of the diets, as previously described [17]. Gross energy (GE) of the diets was determined on a 6300 Automatic Isoperibol Calorimeter System (Parr Instruments, Moline, IL, USA), whereas values of metabolizable energy (ME) intake were calculated based on nutrient intake and the energy conversion factors (FAO) for carbohydrates (17 kJ/g), protein (17 kJ/g), fat (37 kJ/g), and total dietary fiber (8 kJ/g). LiHep plasma was used to measure concentrations of the following metabolites: glucose, fructosamine, lactate, non-esterified fatty acids (NEFA), high-density lipoproteins (HDL), low-density lipoproteins (LDL), total cholesterol (TC), triglycerides (TG), albumin, AST (aspartate transaminase), ALT (alanine transaminase), and GGT (gamma-glutamyltransferase). The analysis was performed using the ADVIA 1650 Chemistry system (Siemens Diagnostics, Tarrytown, NY, USA) according to the manufacturer’s instructions (Siemens Diagnostics Clinical Methods for ADVIA 1650). The same system was used for the analysis of glucose, creatinine, and total protein in urine samples. K3EDTA plasma with aprotinin inhibitor was used for the analysis of metabolic markers: insulin, glucagon, ghrelin (active), glucose-dependent insulin tropic polypeptide (GIP), monocyte chemoattractant protein 1 (MPC-1/CCL2), peptide tyrosine tyrosine (PYY), total glucagon-like peptide-1 (GLP-1), and C-peptide using a Millipore MILLIPLEX MAP Human Metabolic Hormone bead panel kit (HMHEMAG-34K, Merck Millipore, Merck KGaA, Darmstadt, Germany). K3EDTA plasma was used to measure interferon gamma (IFN-γ) and several interleukins (IL-2, IL-4, IL-10, IL-12, IL-18) using the Millipore MILLIPLEX MAP porcine bead panel kit (PCYTMAG-23K, Merck Millipore, Merck KGaA, Darmstadt, Germany). Both kits were run on the Luminex MAGPIX system (Luminex Corporation, TX, USA) according to the manufacturer’s instructions.

2.5. Gene Expression Analysis of Liver, Muscle, and Subcutaneous Adipose Tissue (SAT) by Real-Time Reverse Transcriptase-Polymerase Chain Reaction (RT-PCR)

Liver, muscle, and SAT were analyzed for the expression of 14, 11, and 12, respectively, selected gene transcripts by using gene-specific probes and porcine-specific primers (Table S2). Total RNA extraction from liver tissue was performed using the NucleoSpin RNA Plus kit (Macherey-Nagel GmbH & Co., KG., Duren, Germany) according to the manufacturer’s instructions. Muscle and SAT total RNA was extracted using TRI Reagent® Solution (Ambion, Applied Biosystems, Stockholm, Sweden) following the manufacturer’s protocol. RNA transcription, cDNA synthesis, and RT-PCR quantification were done as described in Supplementary Materials. Glyceraldehyde 3-phosphate dehydrogenase (GAPDH), β-actin, and hypoxanthine phosphoribosyltransferase 1 (HPRT1) were tested as housekeeping genes (HKG). Gene expression data was obtained as Ct values and used to calculate ΔCt values as the difference between Ct of the target gene and mean Ct of HKG (Ct value represents the cycle number at which logarithmic plots cross a calculated threshold). Liver GAPDH exhibited changes concerning the two diets and also with time development. As a result, β-actin and HPRT1 were used as mean HKG for liver tissue, whereas β-actin and GAPDH were used as mean HKG for muscle and SAT. Relative gene expression was determined using the (1 + efficiencies)-ΔΔCt method, were ΔΔCt = ΔCttarget-ΔCtLRweek4. Expression in muscle and SAT expression of C-reactive protein (CRP) and muscle leptin receptor (LEPR) expression were measured close to the detection limit, and as a result, values are not reported. Results were reported as fold changes.

2.6. Calculations and Statistical Analyses

Porcine obesity index (POI) was calculated [7]:
POI = (π × (1/3) × BS × (Abr2 + Cr2 + Ab × Cc))/BS
where BS represents body size (length), Abr abdomen radius, Cr chest radius, Ab abdomen circumference, and Cc chest circumference.
Body surface area (BSA) was calculated using the proposed formula for miniature swine [20]:
BSA = 0.121BW0.575
where BW represents body weight. Calculations of the homeostatic model assessment for insulin resistance (HOMA-IR) and beta-cell function (HOMA-B) were done as previously described [21].
Statistical analysis of the weight development, feed intake, biochemical parameters, blood biomarkers, anthropometric measurements, and gene expression were performed using Statistical Analysis Software (SAS, version 9.4, SAS Institute Inc., Cary, NC, USA). Diet, time, and their interaction effects were analyzed using a Linear Mixed Model for repeated measurements:
Y i j k l = μ + α i + β j + α β i j + γ k + γ l + ε i j k l
where Yijkl is the analyzed variable; µ is the overall mean; αi represents the effect of diet (i = LR, HR); βj is the collection time (j = 4, 12, 20); αβij is the interaction between diet and time; γk is the random effect of the block (k = 1, 2, 3, 4), and γl is the random component of the individual animal (l = 1, 2,…, 30). Data was modeled to account for the repeated measurements of time using an autoregressive covariance structure of order 1. The εijkl component represents the residual error. Tissue gene expression data was analyzed using a similar model where the collection time only reflects two time points (j = 4, 20).
Data are presented as Least Square Means (LSM) ± standard error of mean (SEM). Significance level is assumed for p < 0.05, whereas 0.05 ≤ p ˂ 0.10 is describing tendencies. Spearman correlations of body weight and plasma albumin were performed in RStudio Version 1.1.456 (RStudio Inc, Boston, MA, USA) using the cor.test function. Due to other experimental analysis performed on the adipose tissue, only 8 animals were included in the gene expression analysis at week 4 compared to 15 animals at week 20. The hypothesized changes in biomarkers of dyslipidemia were based on previous analysis done on ad libitum vs. restrictive fed pigs in a MetS context [22]. Sufficient statistical power (α < 0.05; β = 0.80) was expected from 6–8 pigs completing the study according to the power calculations for triglycerides and total cholesterol.

3. Results

3.1. Diet Composition

The experimental diets were formulated to provide on a dry matter (DM) basis equal amounts of energy from fat (174–177 g/kg DM) and protein (113–119 g/kg DM), but to differ regarding content and sources of available carbohydrates and DF (Table 1). Available carbohydrates in the HR diet added up to 555 g/kg DM, out of which 225 g/kg DM was fructose. In the LR diet, the available carbohydrates were lower, 424 g/kg DM mostly as starch (415 g/kg DM), but higher in total DF (188 g/kg DM); the difference was in RS (89 vs. 2 g/kg DM), whereas the non-starch polysaccharides (NSP) content was practically similar in the two diets (73 and 69 g/kg DM). On a pure carbohydrate basis and expressed as monosaccharides, the difference between the HR and LR diet was that the HR diet provided 225 g/kg DM as fructose that substituted 222 g/kg DM glucose monosaccharides from starch in the LR diet. Overall, gross energy (20.3–20.7 MJ/kg DM) was comparable between the two diets.

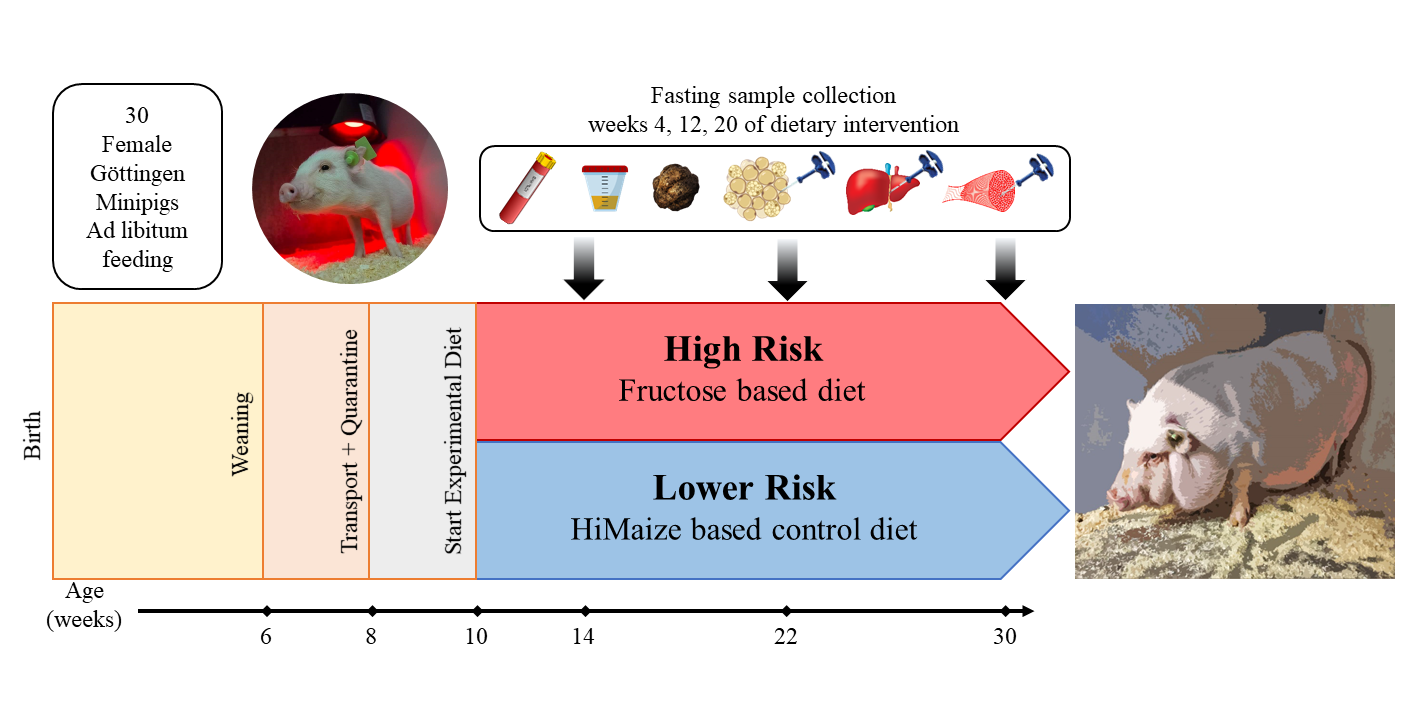
3.2. Nutrient and Energy Intake

Over the 20-week intervention trial, the intake of metabolizable energy (ME) calculated based on feed intake, was on average similar (p = 0.11) as the HR group had an intake of 10.2 MJ/d, compared to the 12 MJ/d of the LR group and only a notable difference was observed at weeks 10–12, as seen in Figure 1C. The animals on the two diets consumed, on average, the same amount of available carbohydrates, whereas for all other nutrients, the intake was higher in the LR group primarily because of higher feed intake (Table 2). Proportionally, animals on the HR diet ingested 9% more energy from carbohydrates, but less from fat, protein, and DF (3.2%, 1.4%, and 4.4%, respectively) compared to the LR group.

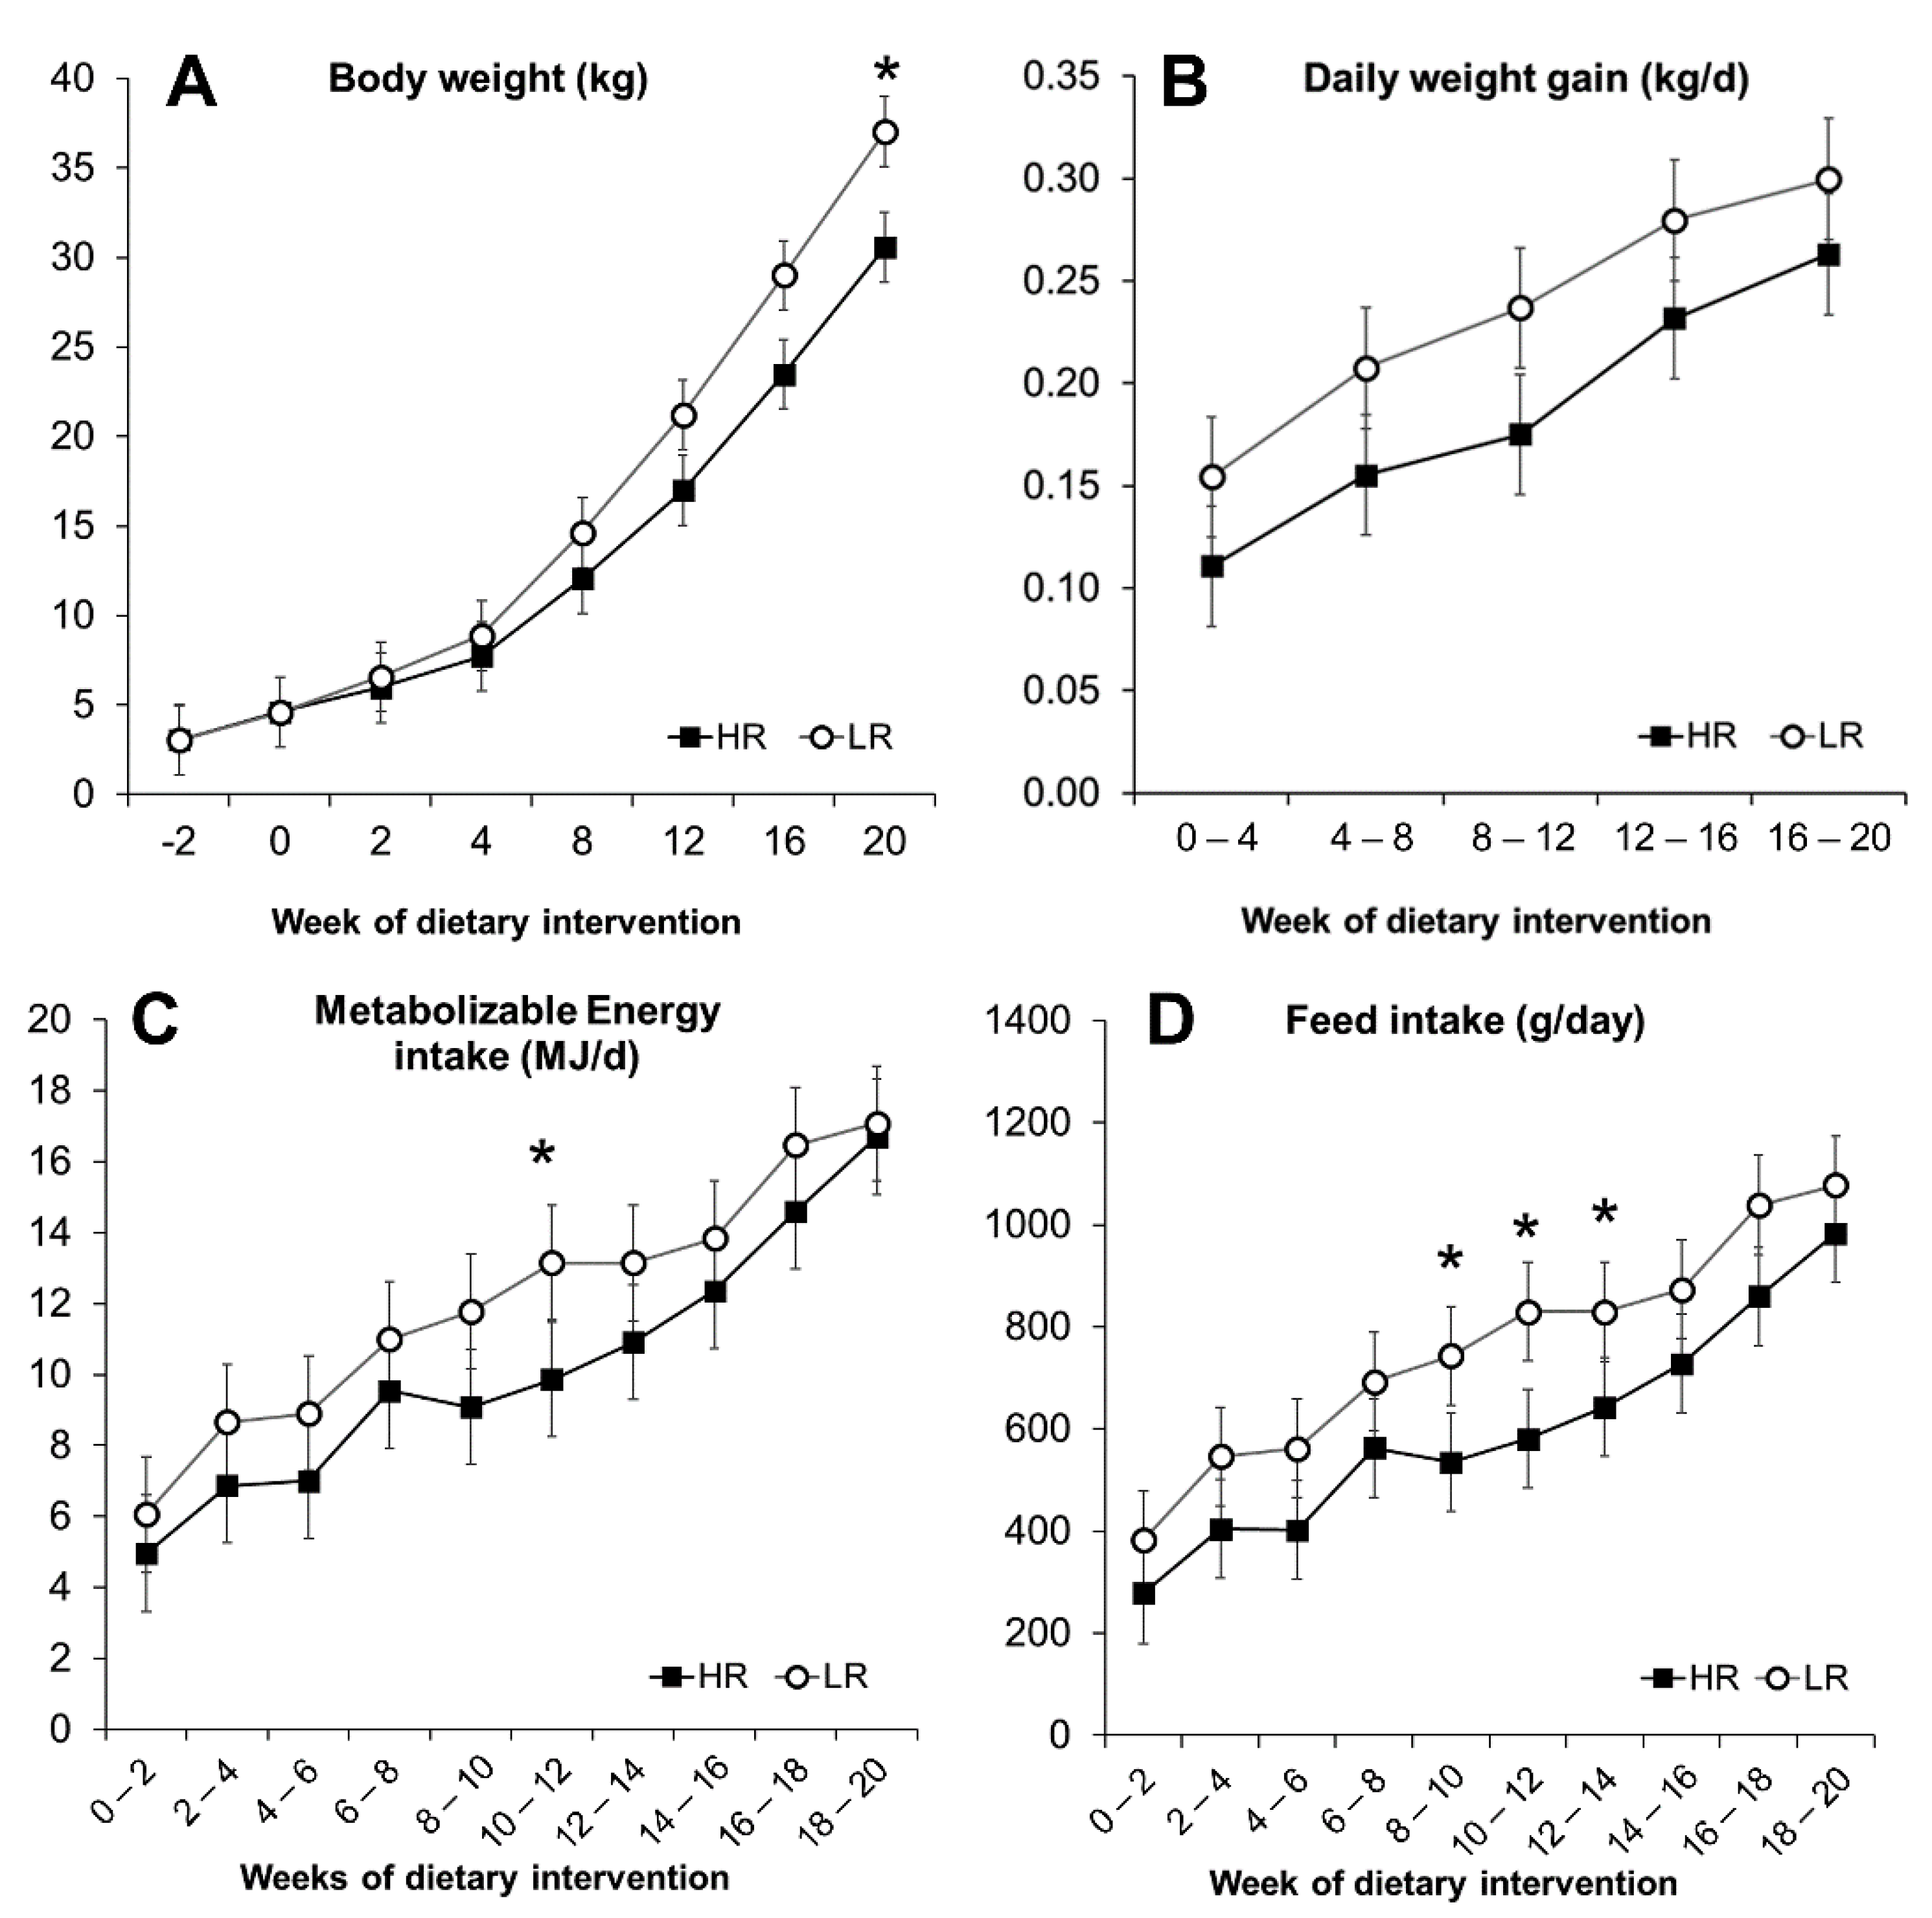
3.3. Obesity Development and Morphometric Measurements

The minipigs gained weight at a comparable rate during the experiment, regardless of the dietary intervention. Body weight (BW) and daily weight gain (DWG) increased significantly over 20 weeks of dietary intervention (p < 0.001), as seen in Figure 1A,B. During the first two weeks, HR and LR groups had a feed intake (FI) of 287 and 382 g/day, respectively, increasing to 984 g for the HR group and 1077 g for the LR during the last two weeks (Figure 1D). A primary effect of the diet was observed with the LR group, where overall measured FI was higher (p = 0.023; Figure 1D). The higher FI, however, did not translate into differences in overall DWG (p = 0.103; Figure 1B), BW (p = 0.33; Figure 1A), or the calculated POI (p = 0.14) and BSA (p = 0.25) measurements (Figure 2). The calculated POI and BSA measurements showed an increased adiposity for minipigs consuming the LR diet only during the last period of the intervention (Figure 2) as well as a difference in BW at week 20 (Figure 1A). Measurements of length, chest circumference, and abdominal circumference are shown in Figure S3.

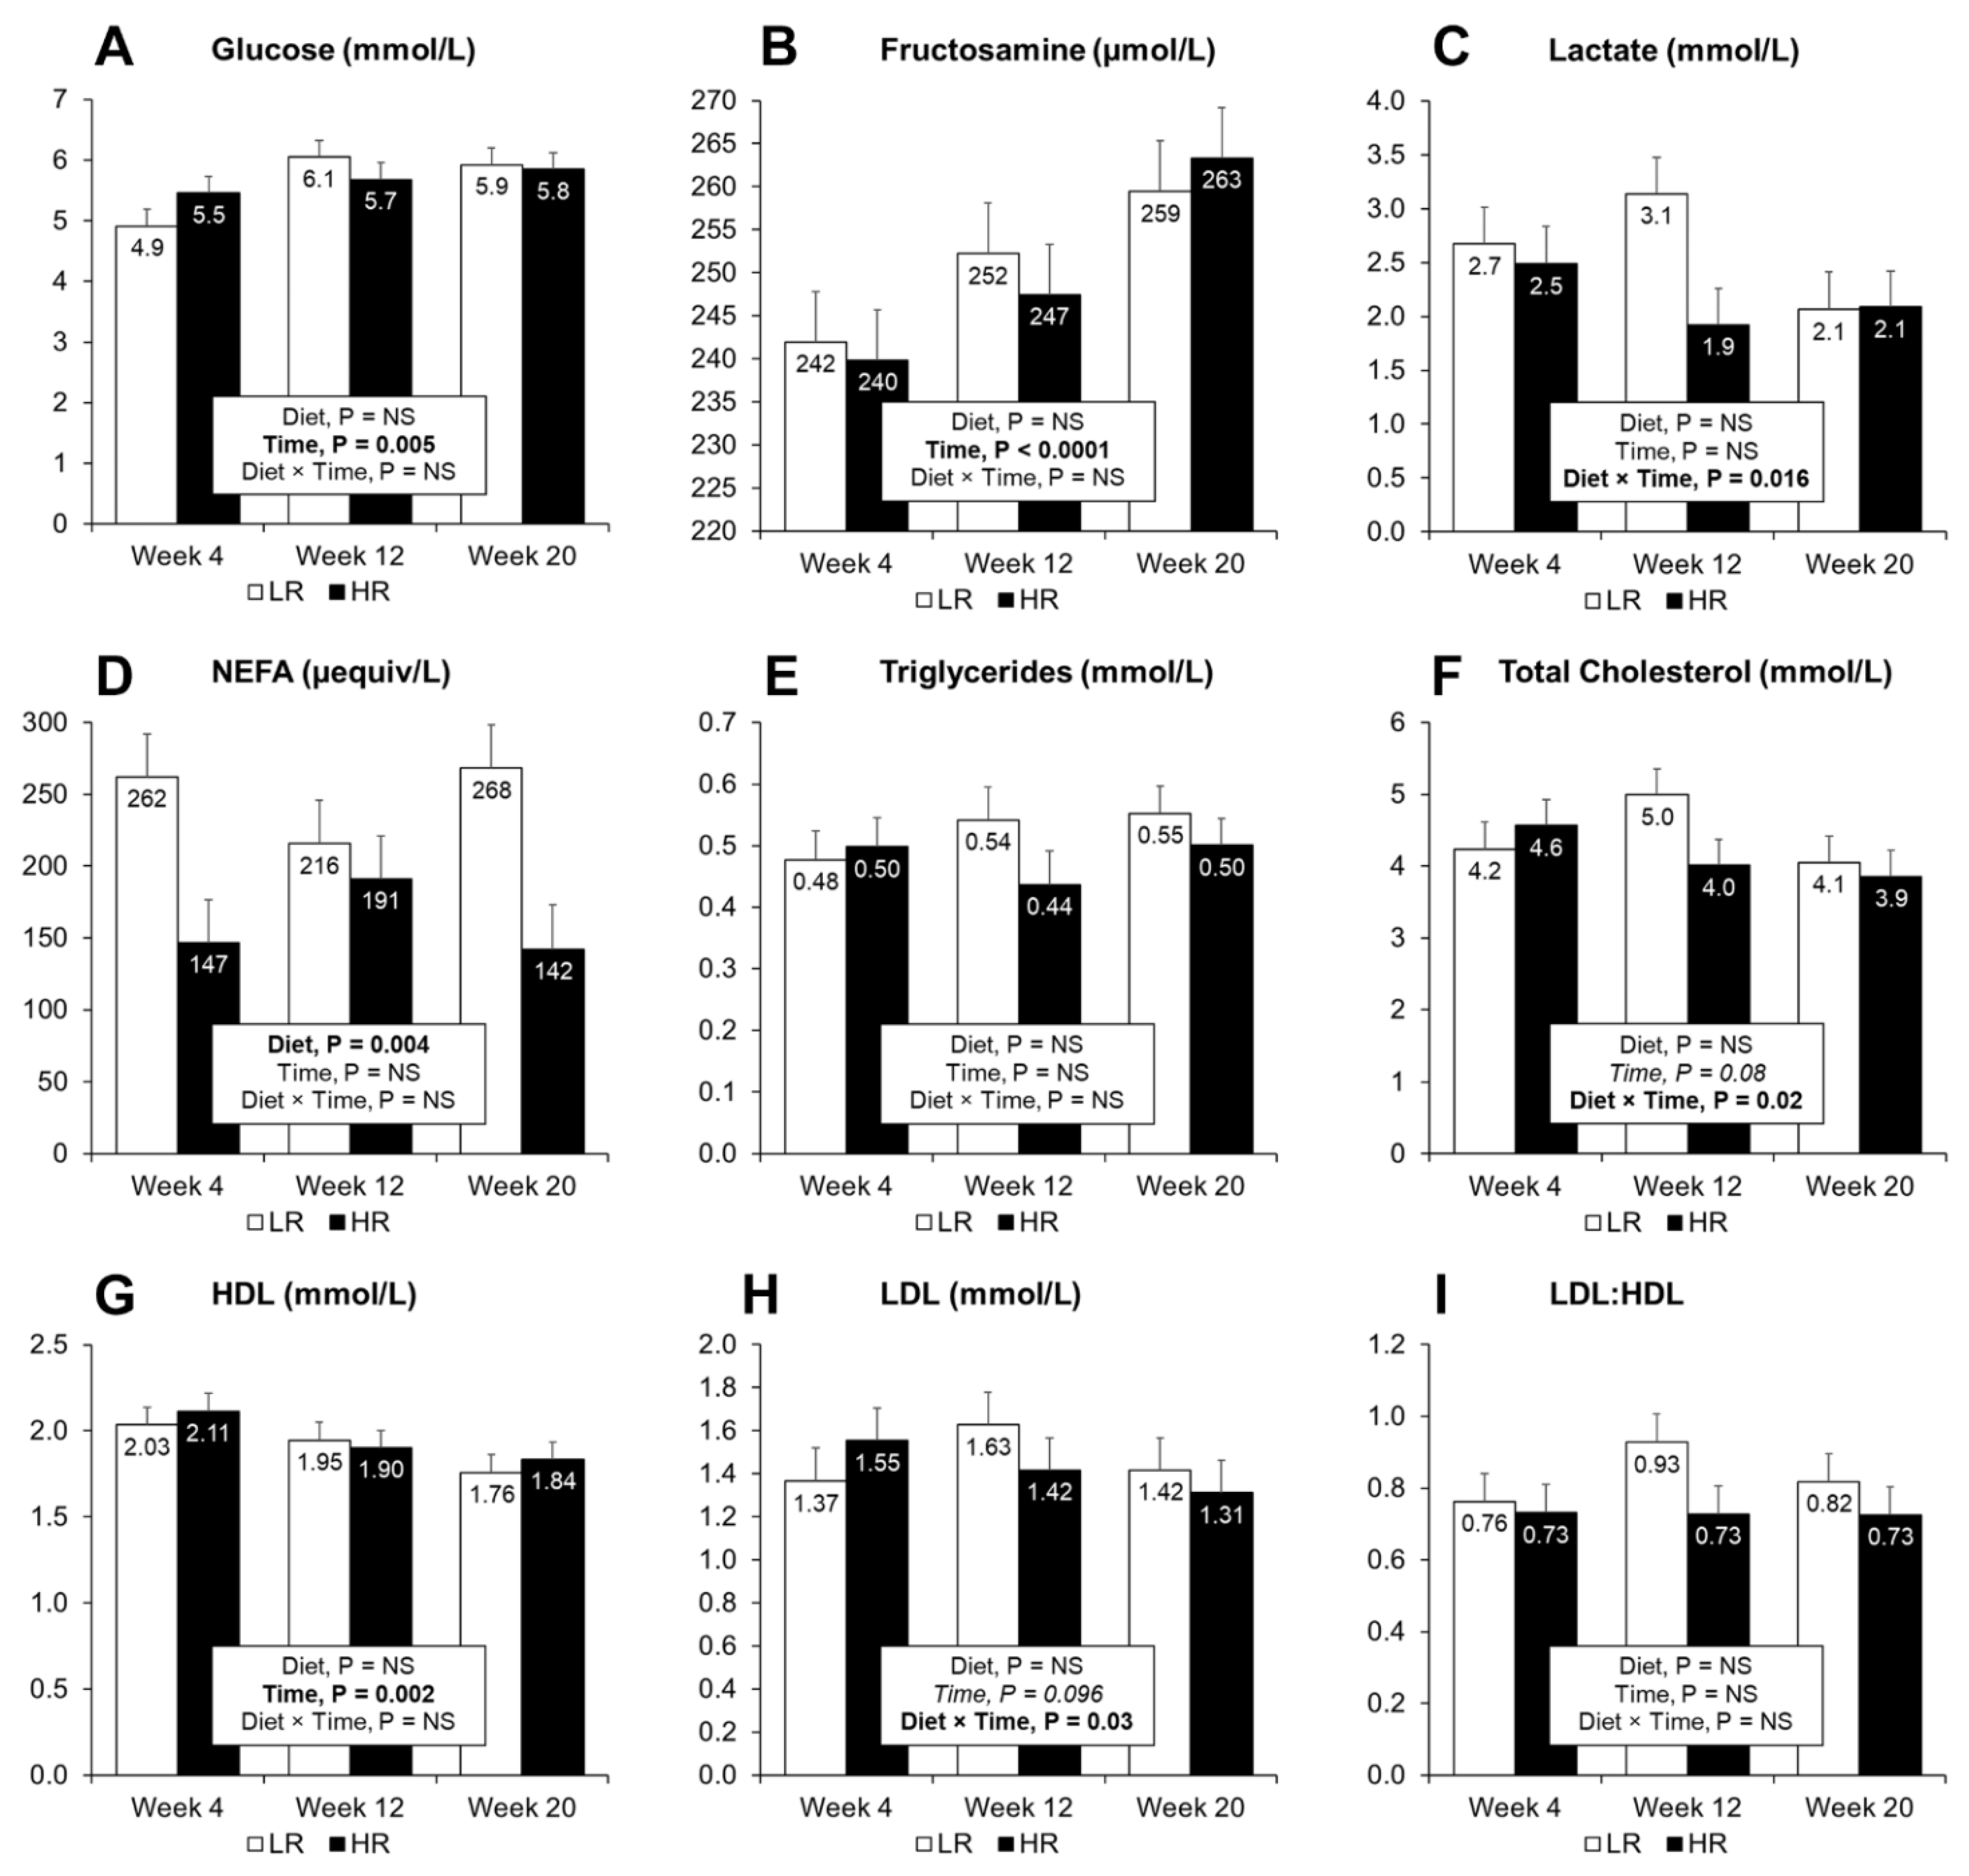
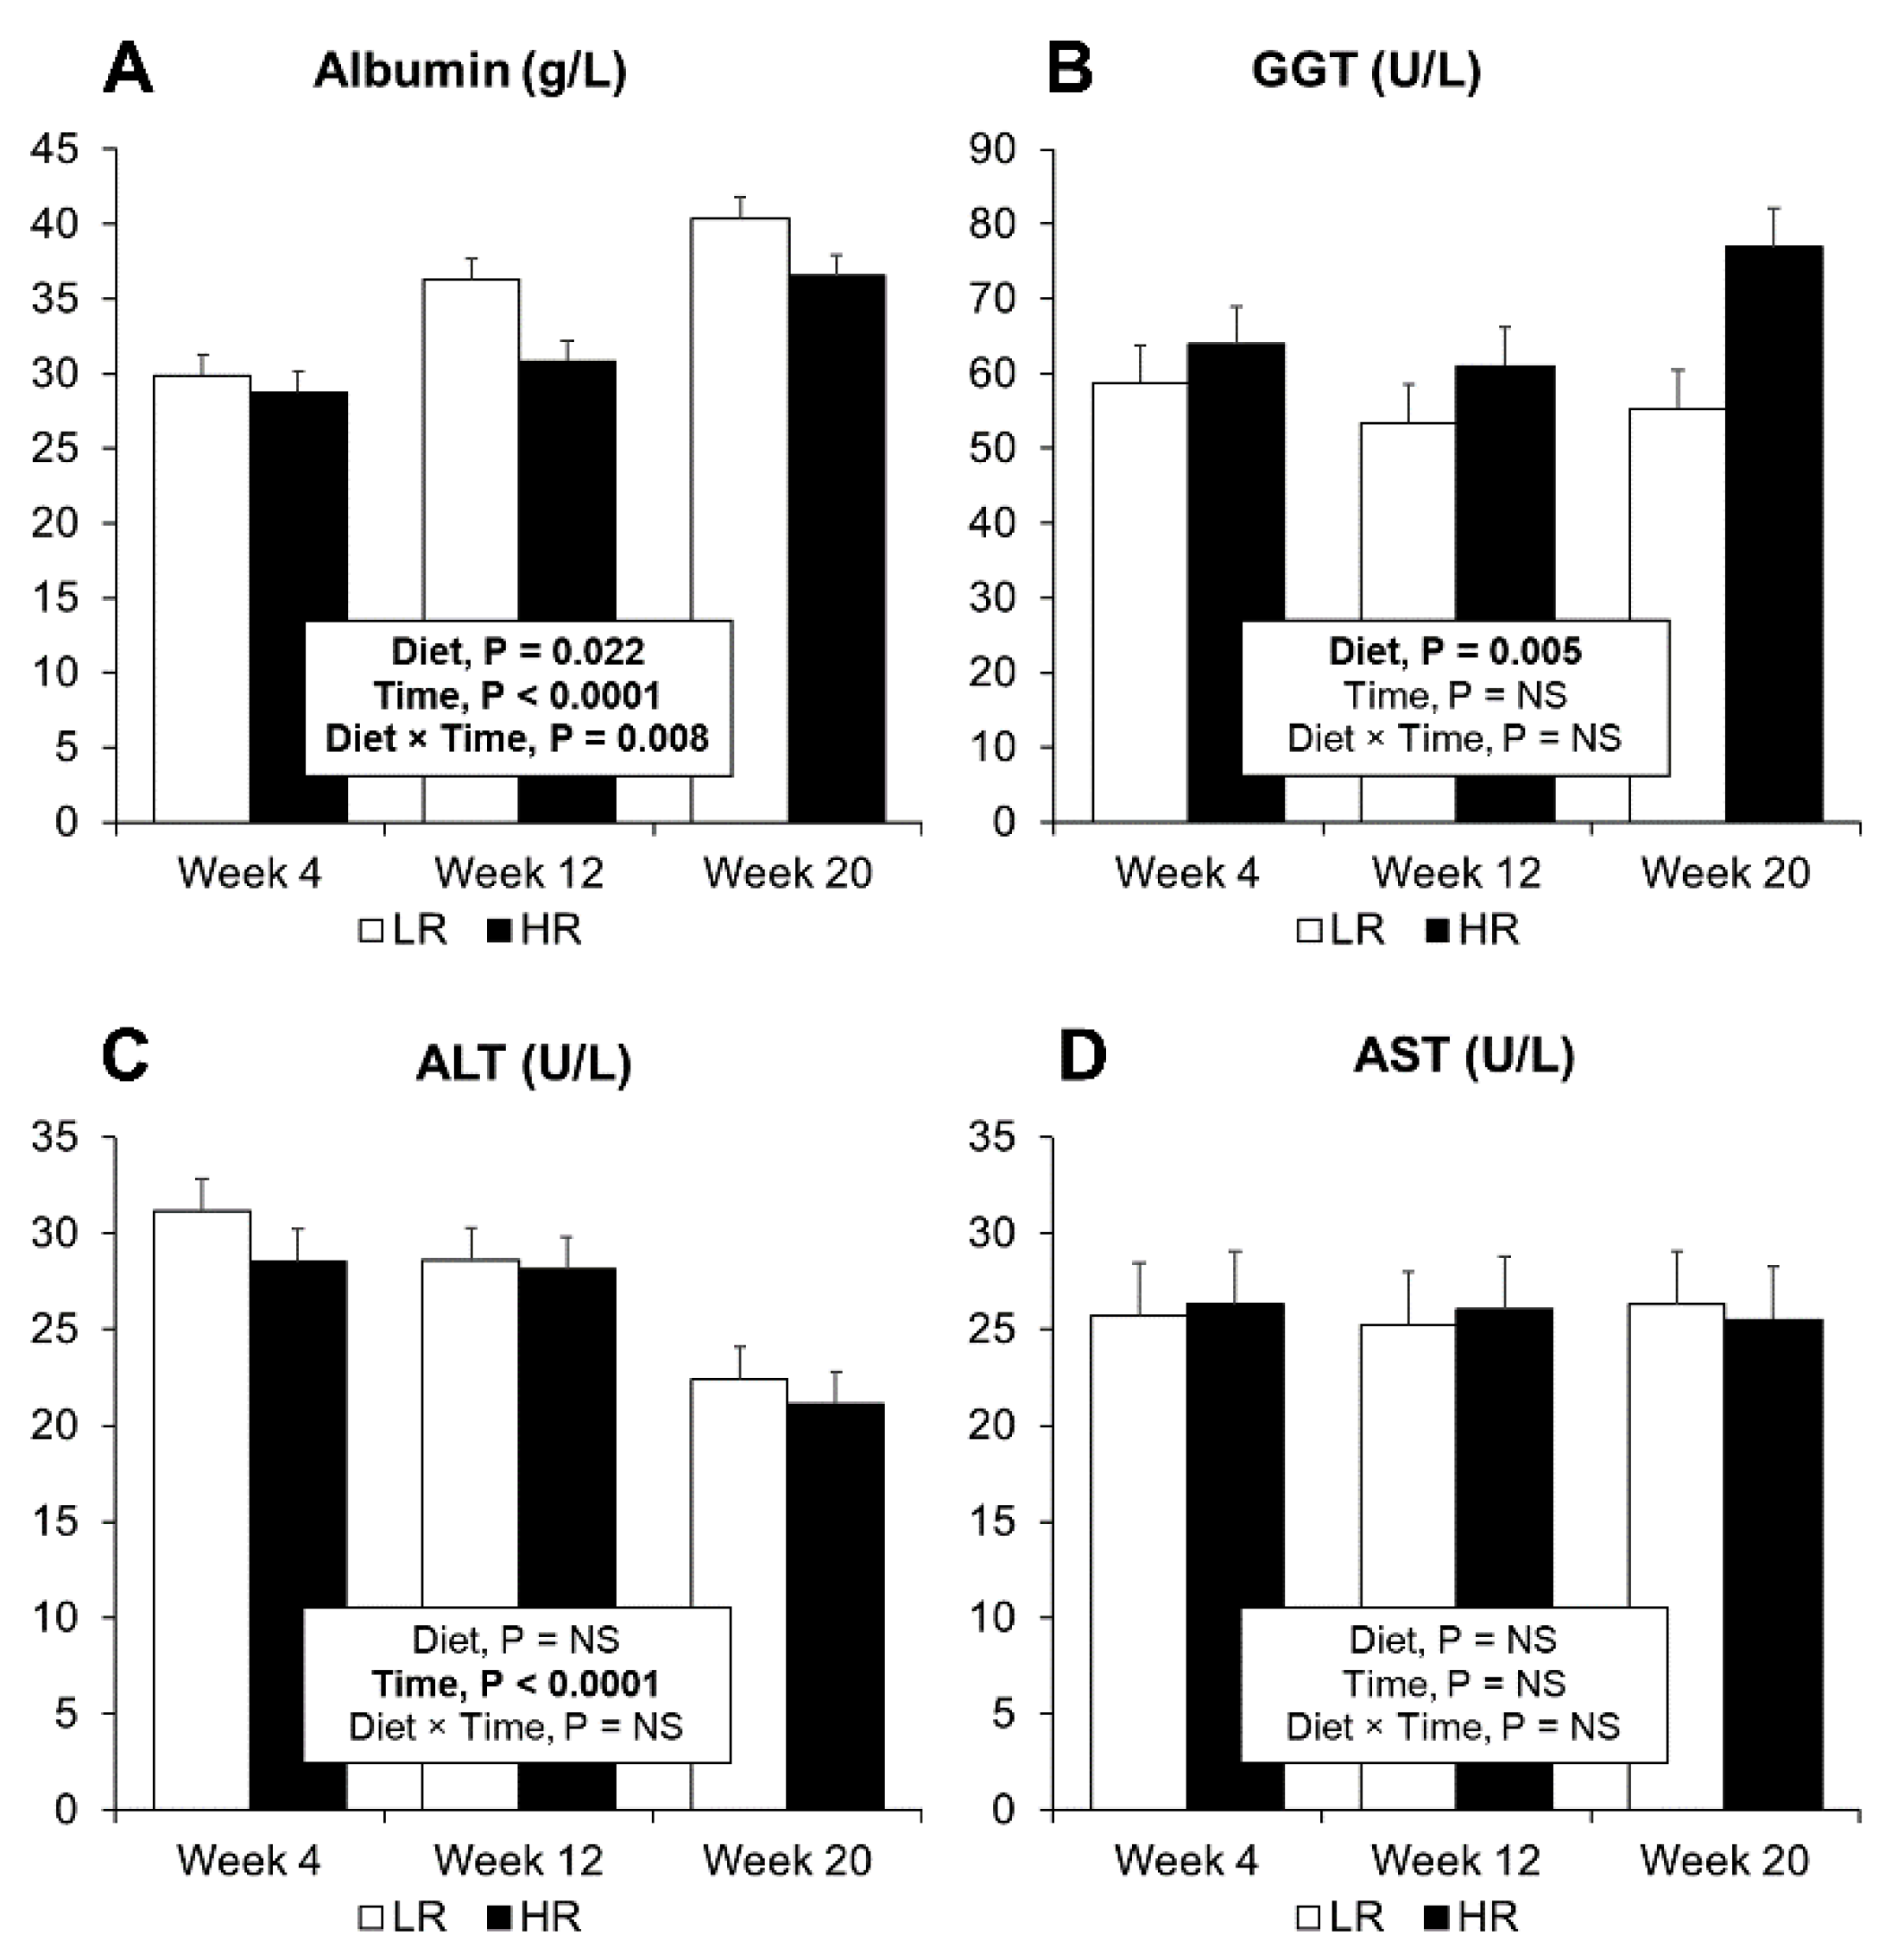
3.4. Plasma and Urine Biomarkers of MetS and Biomarkers of Inflammation

Plasma and urine metabolites measured after overnight fasting are presented in Figure 3 and Table 3, respectively. Plasma glucose (p = 0.005) and fructosamine (p < 0.001) increased, whereas the level of HDL cholesterol decreased with time (p = 0.002). Diet did not affect other measured plasma metabolites except for NEFA (p = 0.003), where higher levels were observed in the LR group. A tendency for decreasing cholesterol level was observed with time (p = 0.08), and neither diet nor time affected triglyceride levels. The HR diet led to increased urinary creatinine (p < 0.001) and glucose (p = 0.005) output, but did not affect total protein content (Table 3). However, when expressed as protein to creatinine ratio (PCR), lower values were observed at weeks 12 and 20 with the HR group.
Plasma albumin was observed to increase in both the LR and HR diets during the dietary intervention (Figure 4A). Furthermore, the LR diet increased albumin levels when compared to the HR diet (Figure 4A). In both dietary groups, strong correlations between BW and measured albumin levels were observed (Figure S4). Two liver transaminases: ALT, AST (Figure 4C,D), together with GGT were assessed in plasma, where only GGT had a diet effect with higher levels observed in the HR diet compared to the LR (Figure 4B). ALT levels decreased with time in both dietary groups (Figure 4C).
Fasting levels of circulating plasma hormones are presented in Table 4. Insulin (p = 0.03), total GLP-1 (p = 0.04), and glucagon (p < 0.0001) increased during the dietary intervention; GIP levels decreased over time (p < 0.0001), whereas C-peptide, PYY, and ghrelin levels were unaffected. Higher levels of glucagon (p = 0.01) were observed with the HR diet, whereas lower values of PYY were present when compared to the LR diet (p = 0.0005). HOMA-IR indicated a time-dependent increase (p = 0.02) with no difference between the two diets. None of the plasma inflammatory markers (IFGg, IL2, IL4, IL10, IL12, IL18) measured in this experiment exhibited a response to the diets (Table S3), and only IL12 decreased from week 4 to week 20 (p = 0.0003).

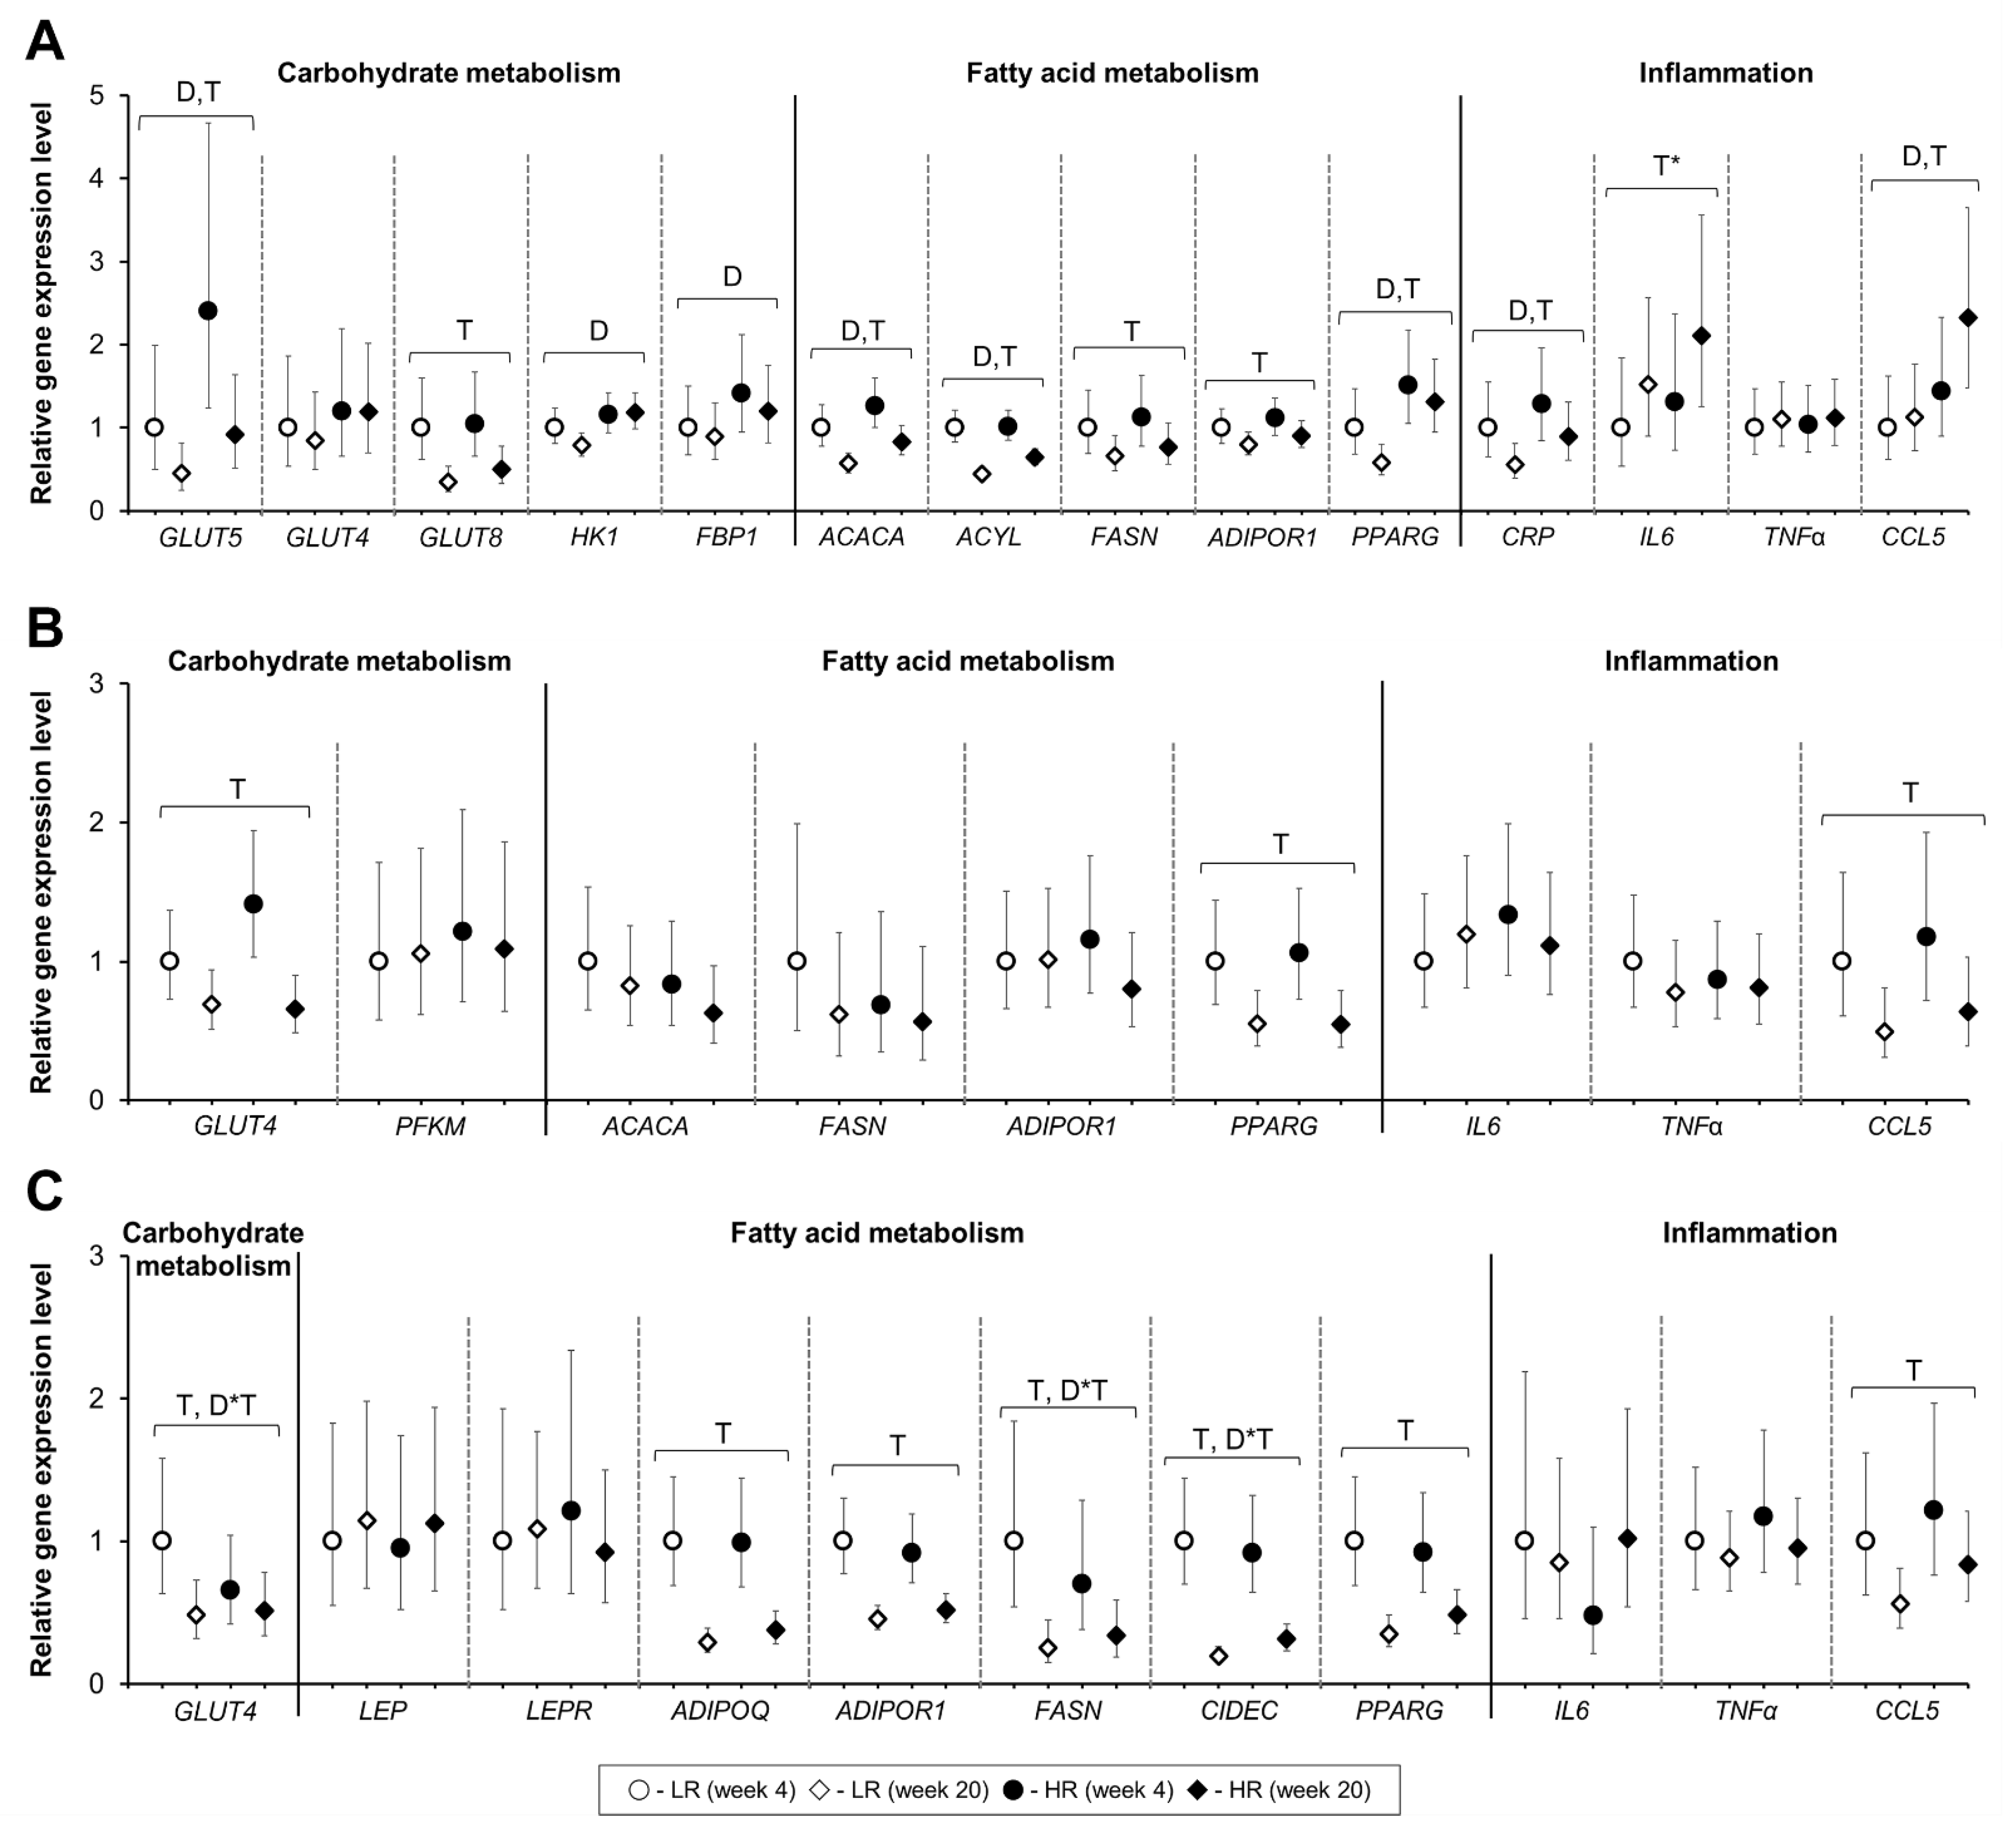
3.5. Tissue Gene Expression

The relative hepatic gene expression of Solute Carrier Family 2 Member 5 (GLUT5), hexokinase 1 (HK1), fructose-biphosphatase 1 (FBP1), acetyl-Coenzyme A carboxylase alpha (ACACA), ATP-citrate lyase (ACYL), C-reactive protein (CRP), and peroxisome proliferator-activated receptor gamma (PPARG) increased with the HR diet (Figure 5A). The hepatic gene expression of C-C Motif Chemokine Ligand 5/RANTES (CCL5) was increased with the HR diet at the end of the study (Figure 5A). Diet had no significant effect on the relative gene expression in muscle or SAT (Figure 5B, 5C). A significant diet and time interaction was observed in the SAT for Solute Carrier Family 2 Member 4 (GLUT4), fatty acid synthase (FASN), and Cell Death-Inducing DFFA Like Effector C (CIDEC) where higher expression levels were observed in response to the LR diet at week 4 of the dietary intervention. Time had a more pronounced effect than diet on gene expression in all three tissues analyzed. Irrespective of the diet, the relative expression of GLUT5, Solute Carrier Family 2 Member 8 (GLUT8), ACACA, ACYL, FASN, ADIPOR1, and CRP decreased from week 4 towards week 20 in the liver. Only CCL5 showed a higher expression levels at the end of the experiment (p = 0.02), while IL6 show a tendency for higher expression at week 20 (p = 0.06) and no effect of the diet was observed. Three genes had lower expression in the muscle at the end of the dietary intervention: SLC2A4, CCL5, and PPARG (p < 0.01). Genes expressed in the SAT followed similar tendencies with a decrease in expression seen for GLUT4, ADIPOR1, adiponectin (ADIPOQ), FASN, CIDEC, PPARG, and CCL5 after 20 weeks of dietary intervention.

4. Discussion

In the context of carbohydrate quality and quantity consumption, the rationale behind the two experimental diets was that the LR diet should resemble a typical human diet recommended in Western societies, high in complex carbohydrates such as starch and dietary fiber, whereas the HR diet, in contrast, should resemble a Western-style diet with the monomeric sugar substituting complex carbohydrates. The two diets also contributed with equal amounts of energy from fat and protein; the level of protein was reduced to redirect energy from lean tissue accretion to adipose tissue storage and to diminish the muscle mass for glucose regulation [23]. Thus, the intention was to study the higher expected risk presented by the fructose ingredient substituting HiMaize starch that contains a mix of digestible and fermentable starch [18]. It is expected that the fermentation of RS to short-chain fatty acids (SCFA) will influence satiety hormones (GLP-1 and PYY) [24,25] and lower the risk of developing obesity and metabolic signs of MetS [26,27,28].
In the current study, we used ad libitum intake as has been employed successfully in several studies on swine [22,29,30] to mimic the behavior of humans with tendencies towards overeating [31]. We were expecting that the higher fermentation of RS in the LR diet would have a direct effect on satiety control mechanisms [25] and thereby influence the ad libitum feed intake. Previously published data on gut microbiota revealed a higher abundance of microbiota associated with acetate production (Bacteroidetes and Ruminococcus) and fecal and plasma SCFA in the LR diet [19]. This, together with the higher release of PYY throughout the trial, is in agreement with previous studies in swine [24], but in contrast to our expectations where the feed intake of the LR group was higher than of the HR group. A reason for that could be the higher acetate production in the LR group [19] causing acetate-mediated hyperphagia in an ad libitum context, as recently found in a rodent study [32]. Other studies applying ad libitum feeding with RS to pigs have also failed to influence voluntary feed intake and carcass quality compared to a low-RS diet [33,34]. Moreover, although adiposity in rodents, nonhuman primates, and humans has been strongly correlated with plasma leptin concentrations [35], our data on mRNA expression levels of leptin and leptin receptor in the subcutaneous adipose tissue did not show any significant difference between the two diets. Therefore, we believe that other mechanisms than satiety hormones may be responsible for the higher feed intake of LR diet compared to HR diet, such as differences in palatability between fructose and HiMaize.
Although fructose has a potential DNL effect, results from this and other recent studies provide conflicting evidence. At low doses, the small intestine is the primary organ for dietary fructose clearance, whereas, at high doses, the clearance capacity is saturated, resulting in spillage to the colonic microbiota and the liver [36]. Gene expression analysis confirms that GLUT5 is not only expressed and facilitates fructose absorption at the intestinal level, but also in the hepatic tissue where higher expression levels of GLUT5 were measured with the HR diet. Other transporters analyzed, such as GLUT4 or GLUT8, did not respond to the intake of fructose, confirming that GLUT5 is a significant transporter of fructose in the liver [37]. Fatty acid synthesis is favored through the regulatory effects of SREBP-1c and ChREBP on fatty acid synthase (FASN) and acetyl-CoA carboxylase (ACACA) [16,38]. Hepatic gene expression of ATP-citrate lyase (ACLY) and ACACA were both increased by the presence of dietary fructose after 20 weeks of dietary intervention. However, the expression of FASN was not increased by the HR diet in the hepatic, muscular, or adipose tissue and a rise in lactate, a by-product of DNL from fructose, in the systemic circulation [13] was not observed in this study. Interestingly, the HR diet lowered albumin secretion from the liver, which could indicate impaired liver function, as seen previously in rats fed high-fat-high-fructose and ethanol diets [39]. Glucagon levels were higher throughout the trial in the HR diet compared to the LR diet. However, differences between the groups are not sufficient to indicate a release due to a state of hypoglycemia as the levels of glucose and fructosamine (indicating long-term glucose levels) were unaffected. A potential explanation might come from the different carbohydrate sources, as the LR diet provides directly digestible glucose from starch, whereas the metabolism requires extra steps for the hepatic release of glucose synthesized from fructose. Similar increases of glucagon levels have been reported in juvenile minipigs exposed to high-fat-high-fructose/sucrose diets without visible changes in glucose, fructosamine, or insulin levels [40].
Irrespective of the carbohydrate quality of the diets, there was a down-regulation of GLUT4 expression in muscle and SAT, towards the end of the dietary intervention, which indicates an early progression toward insulin resistance and T2D pathogenesis as has been found in adipose tissue GLUT4 knockdown mice that developed insulin resistance [41], whereas overexpression of GLUT4 in adipocytes reduced fasting hyperglycemia and prevented insulin resistance [42]. Branched-chain amino acids (BCAA, leucine, valine) are linked to insulin resistance via GLUT4 [43] and the accumulation of BCAA and BCAA degradation products found in our metabolomic study [19] could be an early sign of insulin resistance as further indicated by the significantly increased plasma levels of glucose (p = 0.005), fructosamine (p < 0.001), insulin (p = 0.03), and HOMA-IR (p = 0.02) in both groups from week 4 to week 20. In spite of these changes in metabolic biomarkers, the minipigs developed only some of the hallmarks of MetS; increased body weight, BSA, and POI with visible deposition of subcutaneous fat, alterations in fasting glucose, and insulin responses, and decreasing levels of HDL cholesterol. Total cholesterol, triglycerides, and LDL, however, showed no dysregulation, in contrast to other studies where minipigs developed more severe signs of diet-induced MetS in high-fat diet trials with or without cholesterol supplementation [8,44,45,46]. A confounding effect of increasing intake of dietary fat, which deregulates the synthesis of fatty acids [44] cannot be excluded as several hepatic and adipose tissue genes related to fatty acid metabolism (ACACA, ACYL, FASN, CIDEC, and PPARG) expressed were downregulated with time. In this context, the age of animals could play a role in the rate of disease development. Post-weaned and growing swine have a higher capacity for fat synthesis as lipogenic enzymes reach a plateau during aging [47]. Furthermore, swine generally have an increased innate capacity for adipose tissue expansion independent of adipocyte count, whereas more mature animals, like the case in humans [48], are less flexible and therefore more prone to be affected by an energy-dense dietary intervention, as seen in swine models of sarcopenic obesity [49] and MetS [8]. A contributing factor for dyslipidemia development is the level and type of fat. Although the dietary fat levels used in this study were high (17.4–17.7%) compared to a conventional pig diet, and it was insufficient for the development of dietary dyslipidemia. Other experiments with pigs have used over 30% fat [8,50] or have accelerated dyslipidemia with cholesterol and sodium cholate [50]. The gene expression of adiponectin in the subcutaneous adipose tissue revealed a time-driven decline as well as PPARG, which is an essential mediator of adiponectin expression in the adipose tissue [51]. This, together with the increasing levels of insulin and glucose, could be interpreted as the minipigs evolving towards a state of chronic obesity with signs of insulin resistance. These results are in agreement with current knowledge linking obesity to the development of T2D and CVD [52,53].
Contrary to our expectations, the circulating levels of plasma inflammation markers did not reveal any signs of inflammation during the 20 weeks of dietary intervention irrespective the dietary treatments. A similar situation was observed in juvenile Ossabaw pigs, where a high-fat diet induced dyslipidemia, IR, and hypertension, but did not increase visceral or subcutaneous adipose tissue inflammation or circulatory levels of cytokines [54]. In the liver tissue, however, the exposure to both diets over 20 weeks of dietary intervention increased the expression of CCL5 (RANTES) and IL6, but decreased the expression of CRP. However, the presence of fructose seems to influence hepatic gene expression differently with the upregulated expression of CRP and CCL5 by the HR diet compared to the LR diet. CCL5 cytokine plays an important role in recruiting leukocytes at specific inflammatory sites and has been linked to the progression of hepatic inflammation and fibrosis in the context of NAFLD/NASH [55]. CRP is predominately produced by the liver as a response to inflammation and tissue damage and the presence of dietary fructose seems to increase circulatory levels of CPR, as also seen in a previous Göttingen minipig study [56]. The two well-known clinical indicators for hepatitis, ALT, and AST, however, showed no effect of diet as also report by Schumacher-Petersen et al. in male Göttingen pigs [57], and in other fructose interventions in minipigs [58,59]. On the other hand, GGT was increased with the HR diet, as was also reported with a fructose diet in a NASH minipig model, although not causing significant steatosis, but only foamy macrophage-like cells [40]. Taken together, the long-term exposure to fructose showed no increase in expression levels of the specific DNL related genes nor an increase in circulatory lactate levels. Although fructose increased CCL5 and CRP expression level in the liver as well as circulating GGT levels, it would be difficult to confirm the presence of an inflammatory state at the hepatic level without more extensive analyses or liver histology. In another study, severely obese Gottingen Minipigs have been described to avoid the development of hepatic steatosis through fructose due to their higher capacity of adipose tissue expansion and protection by developing a metabolically healthy obese phenotype [60]. Finally, dyslipidemia is key to the development of liver disease [54,55], and according to more recent studies in minipigs, fructose does not significantly influence hepatic fatty acid synthesis when compared to sucrose [40].

Study Limitations and Strengths

The present study has several strengths, but also potential weaknesses that should be considered. Although ad libitum feeding can be advantageous for the acceleration of obesity, the continuous access to energy might disrupt differences between the pre- and post-absorptive phase, thereby putting less stress on the regulatory mechanisms of the metabolism and disease development compared to regular meal feeding. Ad libitum feeding also disrupted our capacity to conduct a successful meal glucose or insulin tolerance test, as the constant access to feed de-regulated the capacity of the animals to intake large portions of feed. Tissue biopsies were collected in a fasting state, and while it is well established that a fasting state can deregulate gene expression in the liver, interpretation of the results should be done considering that these animals were for the full duration of the experiment subjected to ad libitum feeding. Furthermore, differences between human and swine liver metabolism should be considered regarding TG secretion and inflammation. The swine liver plays a minor role in DNL compared to the adipose tissue [61,62], and this might explain why fructose did not stimulate the FASN expression and organ fat deposition. Animal model studies commonly utilize a small number of animals per group due to increased costs of the animal model and maintenance. One strength of this study was the large number of replicates utilized. Moreover, the collection of repeated organ biopsies on the same animal is not common practice with miniature swine, and it provided new information on tissue metabolism in young and developing Göttingen Minipigs. However, the results should be interpreted with care in the absence of information on enzymatic activities occurring in the liver, muscle, or adipose tissue and the absence of histological data on these tissues.

5. Conclusions

We observed that ad libitum intake of high-energy diets with fructose or HiMaize both favored a rapid fat accumulation inducing an obese phenotype with increased fasting glucose, signs of insulin deregulation in this juvenile minipig model. Furthermore, the high-level fructose intake failed to induce a higher state of dyslipidemia or other markers of metabolic syndrome when compared to the HiMaize based diet. Given the young age of these minipigs, relative metabolic flexibility appears to be still present when feeding energy-dense diets for 20 weeks, and the disease phenotype is not clearly established regarding MetS.

Supplementary Materials

The following are available online at https://www.mdpi.com/article/10.3390/nu13051560/s1, Table S1. Feed ingredients; Table S2. RT-PCR gene expression assays; Table S3. Plasma concentrations (ng/mL) of inflammation biomarkers after overnight fasting; Figure S1. Flow chart presentation of experimental procedures, samples collected, and analysis performed in this longitudinal dietary trial; Figure S2. Photos of the liver biopsy procedure; Figure S3. Morphometric measurements of Göttingen Minipigs fed ad libitum a high-risk (HR, n = 15) and a lower-risk (LR, n = 15) diet; Figure S4. Spearman correlations between the body weight and albumin levels in the plasma of Göttingen minipigs fed a high-risk (left panel) and a low-risk (right panel) diet.

Author Contributions

Conceptualization, K.E.B.K., M.S.H., and H.N.L.; methodology, K.E.B.K., M.S.H., and H.N.L.; formal analysis, M.V.C.; investigation, M.S.H., H.N.L., and M.V.C.; resources, K.E.B.K.; writing—original draft preparation, M.V.C.; writing—review and editing, M.V.C., K.E.B.K., M.S.H., and H.N.L.; visualization, M.V.C.; project administration, K.E.B.K.; funding acquisition, K.E.B.K. All authors have read and agreed to the published version of the manuscript.

Funding

Innovation Fund Denmark (4105-00002B) and industrial partners (Arla Food Ingredients/Arla Food, Lantmännen, DuPont, and Ellegaard Göttingen Minipigs) in the MERITS project (Metabolic Changes by Carbohydrate and Protein Quality in the Development and Mitigation of Metabolic Syndrome).

Institutional Review Board Statement

Handling of animals and experimental procedures were done in accordance with Danish laws and regulations regarding the humane care and use of animals in research (The Danish Ministry of Justice, Act on Animal Experiments no. 474 of 15 May 2014, as stipulated in the executive order no. 12 or 7 January 2016) and according to licenses obtained from the Danish Animal Experimentation Inspectorate, Ministry of Food, Agriculture and Fisheries (Animal experiment permit: 2015−15−0201−00599).

Informed Consent Statement

Not applicable.

Data Availability Statement

The data presented in this study are available on request from the corresponding authors.

Acknowledgments

The authors acknowledge Winnie Østergaard Thomsen, Lisbeth Märcher, Stina Greis Handberg, and Kasper Bøgild Poulsen for their excellent technical assistance in sample collection, preparation, and analysis. We would like to further thank the technical personnel involved in animal rearing and handling at AU Foulum, and to Peter Kappel Theil for assistance in analyzing the gene expression data. Lastly, M.V.C acknowledges the Graduate School for Science and Technology Aarhus University for financially supporting the PhD study scholarship.

Conflicts of Interest

The authors declare no conflict of interest. The funders had no role in the design of the study; in the collection, analyses, or interpretation of data; in the writing of the manuscript, or in the decision to publish the results.

References

  1. Alwahsh, S.M.; Gebhardt, R. Dietary fructose as a risk factor for non-alcoholic fatty liver disease (NAFLD). Arch. Toxicol. 2017, 91, 1545–1563. [Google Scholar] [CrossRef] [PubMed]
  2. Fryar, C.D.; Carroll, M.D.; Ogden, C.L. Prevalence of Overweight, Obesity, and Severe Obesity Among Children and Adolescents Aged 2–19 Years: United States, 1963–1965 Through 2015–2016. Available online: https://www.cdc.gov/nchs/data/hestat/obesity_child_15_16/obesity_child_15_16.htm (accessed on 3 March 2020).
  3. Huang, P.L. A comprehensive definition for metabolic syndrome. Dis. Model Mech. 2009, 2, 231–237. [Google Scholar] [CrossRef] [Green Version]
  4. Wong, S.K.; Chin, K.Y.; Suhaimi, F.H.; Fairus, A.; Ima-Nirwana, S. Animal models of metabolic syndrome: A review. Nutr. Metab. 2016, 13, 65. [Google Scholar] [CrossRef] [Green Version]
  5. Spurlock, M.E.; Gabler, N.K. The Development of Porcine Models of Obesity and the Metabolic Syndrome. J. Nutr. 2008, 138, 397–402. [Google Scholar] [CrossRef]
  6. Johansen, T.; Hansen, H.S.; Richelsen, B.; Malmlof, R. The obese Gottingen minipig as a model of the metabolic syndrome: Dietary effects on obesity, insulin sensitivity, and growth hormone profile. Comp. Med. 2001, 51, 150–155. [Google Scholar] [PubMed]
  7. Sébert, S.P.; Lecannu, G.; Kozlowski, F.; Siliart, B.; Bard, J.M.; Krempf, M.; Champ, M.M.J. Childhood obesity and insulin resistance in a Yucatan mini-piglet model: Putative roles of IGF-1 and muscle PPARs in adipose tissue activity and development. Int. J. Obes. 2005, 29, 324–333. [Google Scholar] [CrossRef] [Green Version]
  8. Renner, S.; Blutke, A.; Dobenecker, B.; Dhom, G.; Muller, T.D.; Finan, B.; Clemmensen, C.; Bernau, M.; Novak, I.; Rathkolb, B.; et al. Metabolic syndrome and extensive adipose tissue inflammation in morbidly obese Gottingen minipigs. Mol. Metab. 2018, 16, 180–190. [Google Scholar] [CrossRef] [PubMed]
  9. Dawson, H.D.; Smith, A.D.; Chen, C.; Urban, J.F. An in-depth comparison of the porcine, murine and human inflammasomes; lessons from the porcine genome and transcriptome. Vet. Microbiol. 2017, 202, 2–15. [Google Scholar] [CrossRef]
  10. Christoffersen, B.; Golozoubova, V.; Pacini, G.; Svendsen, O.; Raun, K. The young göttingen minipig as a model of childhood and adolescent obesity: Influence of diet and gender. Obesity 2013, 21, 149–158. [Google Scholar] [CrossRef] [PubMed]
  11. Christoffersen, B.O.; Grand, N.; Golozoubova, V.; Svendsen, O.; Raun, K. Gender-associated differences in metabolic syndrome-related parameters in Gottingen minipigs. Comp. Med. 2007, 57, 493–504. [Google Scholar]
  12. Stanhope, K.L.; Schwarz, J.M.; Havel, P.J. Adverse metabolic effects of dietary fructose: Results from the recent epidemiological, clinical, and mechanistic studies. Curr. Opin. Lipidol. 2013, 24, 198–206. [Google Scholar] [CrossRef] [Green Version]
  13. Havel, P.J. Dietary fructose: Implications for dysregulation of energy homeostasis and lipid/carbohydrate metabolism. Nutr. Rev. 2005, 63, 133–157. [Google Scholar] [CrossRef]
  14. Rutledge, A.C.; Adeli, K. Fructose and the metabolic syndrome: Pathophysiology and molecular mechanisms. Nutr. Rev. 2007, 65, S13–S23. [Google Scholar] [CrossRef] [PubMed]
  15. Sun, S.Z.; Empie, M.W. Fructose metabolism in humans–What isotopic tracer studies tell us. Nutr. Metab. 2012, 9, 89. [Google Scholar] [CrossRef] [Green Version]
  16. Ter Horst, K.W.; Serlie, M.J. Fructose Consumption, Lipogenesis, and Non-Alcoholic Fatty Liver Disease. Nutrients 2017, 9, 981. [Google Scholar] [CrossRef] [Green Version]
  17. Nielsen, T.S.; Laerke, H.N.; Theil, P.K.; Sorensen, J.F.; Saarinen, M.; Forssten, S.; Knudsen, K.E. Diets high in resistant starch and arabinoxylan modulate digestion processes and SCFA pool size in the large intestine and faecal microbial composition in pigs. Br. J. Nutr. 2014, 112, 1837–1849. [Google Scholar] [CrossRef] [PubMed] [Green Version]
  18. Vangsøe, C.T.; Ingerslev, A.K.; Theil, P.K.; Hedemann, M.S.; Lærke, H.N.; Knudsen, K.E.B. In vitro starch digestion kinetics of diets varying in resistant starch and arabinoxylan compared with in vivo portal appearance of glucose in pigs. Food Res. Int. 2016, 88, 199–206. [Google Scholar] [CrossRef]
  19. Curtasu, M.V.; Tafintseva, V.; Bendiks, Z.A.; Marco, M.L.; Kohler, A.; Xu, Y.; Nørskov, N.P.; Nygaard Lærke, H.; Bach Knudsen, K.E.; Hedemann, M.S. Obesity-Related Metabolome and Gut Microbiota Profiles of Juvenile Göttingen Minipigs—Long-Term Intake of Fructose and Resistant Starch. Metabolites 2020, 10, 456. [Google Scholar] [CrossRef]
  20. Swindle, M.M.; Makin, A.; Herron, A.J.; Clubb, F.J.; Frazier, K.S. Swine as models in biomedical research and toxicology testing. Vet. Pathol. 2012, 49, 344–356. [Google Scholar] [CrossRef] [PubMed]
  21. Levy, J.C.; Matthews, D.R.; Hermans, M.P. Correct homeostasis model assessment (HOMA) evaluation uses the computer program. Diabetes Care 1998, 21, 2191–2192. [Google Scholar] [CrossRef]
  22. Christensen, K.L.; Hedemann, M.S.; Jorgensen, H.; Stagsted, J.; Knudsen, K.E. Liquid chromatography-mass spectrometry based metabolomics study of cloned versus normal pigs fed either restricted or ad libitum high-energy diets. J Proteome Res 2012, 11, 3573–3580. [Google Scholar] [CrossRef] [PubMed]
  23. Fisher, K.D.; Scheffler, T.L.; Kasten, S.C.; Reinholt, B.M.; van Eyk, G.R.; Escobar, J.; Scheffler, J.M.; Gerrard, D.E. Energy Dense, Protein Restricted Diet Increases Adiposity and Perturbs Metabolism in Young, Genetically Lean Pigs. PLoS ONE 2013, 8, e72320. [Google Scholar] [CrossRef] [PubMed] [Green Version]
  24. Ingerslev, A.K.; Mutt, S.J.; Lærke, H.N.; Hedemann, M.S.; Theil, P.K.; Nielsen, K.L.; Jørgensen, H.; Herzig, K.-H.; Bach Knudsen, K.E. Postprandial PYY increase by resistant starch supplementation is independent of net portal appearance of short-chain fatty acids in pigs. PLoS ONE 2017, 12, e0185927. [Google Scholar] [CrossRef] [PubMed] [Green Version]
  25. Karhunen, L.J.; Juvonen, K.R.; Huotari, A.; Purhonen, A.K.; Herzig, K.H. Effect of protein, fat, carbohydrate and fibre on gastrointestinal peptide release in humans. Regul. Pept. 2008, 149, 70–78. [Google Scholar] [CrossRef]
  26. de Leeuw, J.A.; Jongbloed, A.W.; Spoolder, H.A.M.; Verstegen, M.W.A. Effects of hindgut fermentation of non-starch polysaccharides on the stability of blood glucose and insulin levels and physical activity in empty sows. Livest. Prod. Sci. 2005, 96, 165–174. [Google Scholar] [CrossRef]
  27. Johnston, K.L.; Thomas, E.L.; Bell, J.D.; Frost, G.S.; Robertson, M.D. Resistant starch improves insulin sensitivity in metabolic syndrome. Diabet. Med. J. Br. Diabet. Assoc. 2010, 27, 391–397. [Google Scholar] [CrossRef]
  28. Maki, K.C.; Pelkman, C.L.; Finocchiaro, E.T.; Kelley, K.M.; Lawless, A.L.; Schild, A.L.; Rains, T.M. Resistant starch from high-amylose maize increases insulin sensitivity in overweight and obese men. J. Nutr. 2012, 142, 717–723. [Google Scholar] [CrossRef]
  29. Bollen, P.J.; Madsen, L.W.; Meyer, O.; Ritskes-Hoitinga, J. Growth differences of male and female Gottingen minipigs during ad libitum feeding: A pilot study. Lab. Anim. 2005, 39, 80–93. [Google Scholar] [CrossRef]
  30. Curtasu, M.V.; Knudsen, K.E.B.; Callesen, H.; Purup, S.; Stagsted, J.; Hedemann, M.S. Obesity Development in a Miniature Yucatan Pig Model: A Multi-compartmental Metabolomics Study on Cloned and Normal Pigs Fed Restricted or Ad Libitum High-Energy Diets. J. Proteome Res. 2019, 18, 30–47. [Google Scholar] [CrossRef]
  31. Stinson, E.J.; Piaggi, P.; Ibrahim, M.; Venti, C.; Krakoff, J.; Votruba, S.B. High Fat and Sugar Consumption During Ad Libitum Intake Predicts Weight Gain. Obesity 2018, 26, 689–695. [Google Scholar] [CrossRef] [Green Version]
  32. Perry, R.J.; Peng, L.; Barry, N.A.; Cline, G.W.; Zhang, D.; Cardone, R.L.; Petersen, K.F.; Kibbey, R.G.; Goodman, A.L.; Shulman, G.I. Acetate mediates a microbiome–brain–β-cell axis to promote metabolic syndrome. Nature 2016, 534, 213. [Google Scholar] [CrossRef] [Green Version]
  33. Souza da Silva, C.; Haenen, D.; Koopmans, S.J.; Hooiveld, G.J.; Bosch, G.; Bolhuis, J.E.; Kemp, B.; Muller, M.; Gerrits, W.J. Effects of resistant starch on behaviour, satiety-related hormones and metabolites in growing pigs. Animal 2014, 8, 1402–1411. [Google Scholar] [CrossRef] [Green Version]
  34. van Erp, R.J.J.; de Vries, S.; van Kempen, T.A.T.G.; Den Hartog, L.A.; Gerrits, W.J.J. Feed intake patterns nor growth rates of pigs are affected by dietary resistant starch, despite marked differences in digestion. Animal 2020, 14, 1402–1412. [Google Scholar] [CrossRef]
  35. Elliott, S.S.; Keim, N.L.; Stern, J.S.; Teff, K.; Havel, P.J. Fructose, weight gain, and the insulin resistance syndrome. Am. J. Clin. Nutr. 2002, 76, 911–922. [Google Scholar] [CrossRef]
  36. Jang, C.; Hui, S.; Lu, W.; Cowan, A.J.; Morscher, R.J.; Lee, G.; Liu, W.; Tesz, G.J.; Birnbaum, M.J.; Rabinowitz, J.D. The Small Intestine Converts Dietary Fructose into Glucose and Organic Acids. Cell Metab. 2018, 27, 351–361.e353. [Google Scholar] [CrossRef] [PubMed] [Green Version]
  37. Douard, V.; Ferraris, R.P. Regulation of the fructose transporter GLUT5 in health and disease. Am. J. Physiol. Endocrinol. Metab. 2008, 295, E227–E237. [Google Scholar] [CrossRef] [Green Version]
  38. Janevski, M.; Ratnayake, S.; Siljanovski, S.; McGlynn, M.A.; Cameron-Smith, D.; Lewandowski, P. Fructose containing sugars modulate mRNA of lipogenic genes ACC and FAS and protein levels of transcription factors ChREBP and SREBP1c with no effect on body weight or liver fat. Food Funct. 2012, 3, 141–149. [Google Scholar] [CrossRef] [PubMed]
  39. Alwahsh, S.M.; Dwyer, B.J.; Forbes, S.; Thiel, D.H.; Lewis, P.J.S.; Ramadori, G. Insulin Production and Resistance in Different Models of Diet-Induced Obesity and Metabolic Syndrome. Int. J. Mol. Sci. 2017, 18, 285. [Google Scholar] [CrossRef] [PubMed] [Green Version]
  40. Pedersen, H.D.; Galsgaard, E.D.; Christoffersen, B.Ø.; Cirera, S.; Holst, D.; Fredholm, M.; Latta, M. NASH-inducing Diets in Göttingen Minipigs. J. Clin. Exp. Hepatol. 2019. [Google Scholar] [CrossRef] [PubMed] [Green Version]
  41. Abel, E.D.; Peroni, O.; Kim, J.K.; Kim, Y.-B.; Boss, O.; Hadro, E.; Minnemann, T.; Shulman, G.I.; Kahn, B.B. Adipose-selective targeting of the GLUT4 gene impairs insulin action in muscle and liver. Nature 2001, 409, 729. [Google Scholar] [CrossRef]
  42. Carvalho, E.; Kotani, K.; Peroni, O.D.; Kahn, B.B. Adipose-specific overexpression of GLUT4 reverses insulin resistance and diabetes in mice lacking GLUT4 selectively in muscle. Am. J. Physiol. Endocrinol. Metab. 2005, 289, E551–E561. [Google Scholar] [CrossRef] [PubMed] [Green Version]
  43. Zhang, S.; Zeng, X.; Ren, M.; Mao, X.; Qiao, S. Novel metabolic and physiological functions of branched chain amino acids: A review. J. Anim. Sci. Biotechnol. 2017, 8, 10. [Google Scholar] [CrossRef] [PubMed] [Green Version]
  44. Polakof, S.; Remond, D.; Bernalier-Donadille, A.; Rambeau, M.; Pujos-Guillot, E.; Comte, B.; Dardevet, D.; Savary-Auzeloux, I. Metabolic adaptations to HFHS overfeeding: How whole body and tissues postprandial metabolic flexibility adapt in Yucatan mini-pigs. Eur. J. Nutr. 2018, 57, 119–135. [Google Scholar] [CrossRef] [PubMed]
  45. Neeb, Z.P.; Edwards, J.M.; Alloosh, M.; Long, X.; Mokelke, E.A.; Sturek, M. Metabolic syndrome and coronary artery disease in Ossabaw compared with Yucatan swine. Comp. Med. 2010, 60, 300–315. [Google Scholar]
  46. Mentzel, C.M.J.; Cardoso, T.F.; Lex, A.M.J.; Sorensen, D.B.; Fredholm, M.; Cirera, S. Fat and carbohydrate content in the diet induces drastic changes in gene expression in young Gottingen minipigs. Mamm. Genome 2017, 28, 166–175. [Google Scholar] [CrossRef]
  47. Farnworth, E.R.; Kramer, J.K.G. Fat Metabolism in Growing Swine: A Review. Can. J. Anim. Sci. 1987, 67, 301–318. [Google Scholar] [CrossRef]
  48. Spalding, K.L.; Arner, E.; Westermark, P.O.; Bernard, S.; Buchholz, B.A.; Bergmann, O.; Blomqvist, L.; Hoffstedt, J.; Naslund, E.; Britton, T.; et al. Dynamics of fat cell turnover in humans. Nature 2008, 453, 783–787. [Google Scholar] [CrossRef] [PubMed]
  49. Garcia-Contreras, C.; Vazquez-Gomez, M.; Torres-Rovira, L.; Gonzalez, J.; Porrini, E.; Gonzalez-Colaço, M.; Isabel, B.; Astiz, S.; Gonzalez-Bulnes, A. Characterization of Ageing- and Diet-Related Swine Models of Sarcopenia and Sarcopenic Obesity. Int. J. Mol. Sci. 2018, 19, 823. [Google Scholar] [CrossRef] [PubMed] [Green Version]
  50. Al-Mashhadi, A.L.; Poulsen, C.B.; von Wachenfeldt, K.; Robertson, A.K.; Bentzon, J.F.; Nielsen, L.B.; Thygesen, J.; Tolbod, L.P.; Larsen, J.R.; Moestrup, S.K.; et al. Diet-Induced Abdominal Obesity, Metabolic Changes, and Atherosclerosis in Hypercholesterolemic Minipigs. J. Diabetes Res. 2018, 2018, 6823193. [Google Scholar] [CrossRef]
  51. Maeda, N.; Takahashi, M.; Funahashi, T.; Kihara, S.; Nishizawa, H.; Kishida, K.; Nagaretani, H.; Matsuda, M.; Komuro, R.; Ouchi, N.; et al. PPAR Ligands Increase Expression and Plasma Concentrations of Adiponectin, an Adipose-Derived Protein. Diabetes 2001, 50, 2094–2099. [Google Scholar] [CrossRef] [Green Version]
  52. Kahn, S.E.; Hull, R.L.; Utzschneider, K.M. Mechanisms linking obesity to insulin resistance and type 2 diabetes. Nature 2006, 444, 840–846. [Google Scholar] [CrossRef] [PubMed]
  53. Despres, J.P.; Lemieux, I. Abdominal obesity and metabolic syndrome. Nature 2006, 444, 881–887. [Google Scholar] [CrossRef]
  54. Vieira-Potter, V.J.; Lee, S.; Bayless, D.S.; Scroggins, R.J.; Welly, R.J.; Fleming, N.J.; Smith, T.N.; Meers, G.M.; Hill, M.A.; Rector, R.S.; et al. Disconnect between adipose tissue inflammation and cardiometabolic dysfunction in Ossabaw pigs. Obesity 2015, 23, 2421–2429. [Google Scholar] [CrossRef] [PubMed]
  55. Kirovski, G.; Gäbele, E.; Dorn, C.; Moleda, L.; Niessen, C.; Weiss, T.S.; Wobser, H.; Schacherer, D.; Buechler, C.; Wasmuth, H.E.; et al. Hepatic steatosis causes induction of the chemokine RANTES in the absence of significant hepatic inflammation. Int. J. Clin. Exp. Pathol. 2010, 3, 675–680. [Google Scholar] [PubMed]
  56. Christoffersen, B.O.; Jensen, S.J.; Ludvigsen, T.P.; Nilsson, S.K.; Grossi, A.B.; Heegaard, P.M. Age- and Sex-Associated Effects on Acute-Phase Proteins in Gottingen Minipigs. Comp. Med. 2015, 65, 333–341. [Google Scholar] [PubMed]
  57. Schumacher-Petersen, C.; Christoffersen, B.Ø.; Kirk, R.K.; Ludvigsen, T.P.; Zois, N.E.; Pedersen, H.D.; Vyberg, M.; Olsen, L.H. Experimental non-alcoholic steatohepatitis in Göttingen Minipigs: Consequences of high fat-fructose-cholesterol diet and diabetes. J. Transl. Med. 2019, 17, 110. [Google Scholar] [CrossRef] [PubMed] [Green Version]
  58. Hsu, M.-C.; Wang, M.-E.; Jiang, Y.-F.; Liu, H.-C.; Chen, Y.-C.; Chiu, C.-H. Long-term feeding of high-fat plus high-fructose diet induces isolated impaired glucose tolerance and skeletal muscle insulin resistance in miniature pigs. Diabetol. Metab. Syndr. 2017, 9, 81. [Google Scholar] [CrossRef] [PubMed]
  59. Lee, L.; Alloosh, M.; Saxena, R.; Van Alstine, W.; Watkins, B.A.; Klaunig, J.E.; Sturek, M.; Chalasani, N. Nutritional model of steatohepatitis and metabolic syndrome in the Ossabaw miniature swine. Hepatology 2009, 50, 56–67. [Google Scholar] [CrossRef] [PubMed] [Green Version]
  60. Cirera, S.; Tasoz, E.; Juul Jacobsen, M.; Schumacher-Petersen, C.; Ostergaard Christoffersen, B.; Kaae Kirk, R.; Pagh Ludvigsen, T.; Hvid, H.; Duelund Pedersen, H.; Hoier Olsen, L.; et al. The expression signatures in liver and adipose tissue from obese Gottingen Minipigs reveal a predisposition for healthy fat accumulation. Nutr. Diabetes 2020, 10, 9. [Google Scholar] [CrossRef]
  61. Pullen, D.L.; Liesman, J.S.; Emery, R.S. A species comparison of liver slice synthesis and secretion of triacylglycerol from nonesterified fatty acids in media2. J. Anim. Sci. 1990, 68, 1395–1399. [Google Scholar] [CrossRef] [PubMed]
  62. Bergen, W.G.; Mersmann, H.J. Comparative Aspects of Lipid Metabolism: Impact on Contemporary Research and Use of Animal Models. J. Nutr. 2005, 135, 2499–2502. [Google Scholar] [CrossRef] [PubMed] [Green Version]
Figure 1. Development parameters of Göttingen Minipigs fed ad libitum a high-risk (HR, n = 15) and a lower-risk (LR, n = 15) diet. Body weight (A), daily weight gain (B), calculated metabolizable energy intake (C), and daily feed intake (D). Results are expressed as LS means, error bars indicating SEM. Significant difference (* p < 0.05).
Nutrients 13 01560 g001
Figure 2. Pig obesity index (A) and body surface area (B) calculated from morphometric measurements. Results are expressed as LS means, error bars indicating SEM. Significant difference (* p < 0.05).
Nutrients 13 01560 g002
Figure 3. Plasma concentrations of biomarkers after overnight fasting. Measurements of glucose (A), fructosamine (B), lactate (C), NEFA (D), triglycerides (E), total cholesterol (F), high-density lipoprotein cholesterol (G), low-density lipoprotein cholesterol (H) and the LDL to HDL ratio (I), were taken at 4, 12 and 20 weeks during the dietary intervention. Results are expressed as LS means, error bars indicating SEM. NS, indicates non-significance at p > 0.05. Significant difference at p < 0.05.
Nutrients 13 01560 g003
Figure 4. Clinical plasma biomarkers for liver function. (A) Albumin measurements. (B) GGT (gamma-glutamyl transferase). (C) ALT (alanine transaminase). (D) AST (aspartate transaminase). Results are expressed as LS means, error bars indicating SEM.
Nutrients 13 01560 g004
Figure 5. Gene expression of selected genes in the liver (A), muscle (B), and subcutaneous adipose tissue (C) collected at week 4 and week 20 of the dietary intervention from ad libitum fed female Gottingen Minipigs. Solute Carrier Family 2 (Facilitated Glucose/Fructose Transporter) Member 5 (GLUT5); Solute Carrier Family 2 (Facilitated Glucose Transporter) Member 4 (GLUT4); Solute Carrier Family 2 (Facilitated Glucose Transporter) Member 8 (GLUT8); Hexokinase 1 (HK1); Fructose-Bisphosphatase 1 (FBP1); Phosphofructokinase, Muscle (PFKM); Acetyl-Coenzyme A Carboxylase Alpha (ACACA); ATP-citrate lyase (ACYL); Fatty Acid Synthase (FASN); C-C Motif Chemokine Ligand 5/RANTES (CCL5); Adiponectin (ADIPOQ); Adiponectin receptor 1 (ADIPOR1); Leptin (LEP); Leptin Receptor (LEPR); Cell Death-Inducing DFFA Like Effector C (CIDEC); Peroxisome proliferator-activated receptor gamma (PPARG); C-reactive protein (CRP); Interleukin 6 (IL6); Tumor Necrosis Factor (TNFα). Results are presented as ddCT values with 95% CI, reported relative to the LR diet at week 4. LR, lower-risk diet. HR, high-risk diet. Number of animals-liver: LR week 4 (n = 10), LR week 20 (n = 15), HR week 4 (n = 11), HR week 20 (n = 15). Number of animals-muscle: LR-HR week 4 (n = 14), LR-HR week 20 (n = 15). Number of animals-subcutaneous adipose tissue: LR-HR week 4 (n = 8), LR-HR week 20 (n = 15). D = effect of diet (p < 0.05), T = effect of time (p < 0.05). D*T = effect of interaction diet and time (p < 0.05). T* = tendency effect of time (0.05 ≤ p ˂ 0.10).
Nutrients 13 01560 g005
Table 1. Chemical composition of the experimental diets.
LRHR
Chemical composition (g/kg DM 1)
DM (g/kg, as-fed basis)917913
Ash6362
Protein (N × 6.25)119113
Fat177174
Available carbohydrates424555
Sugars9233
Fructose0.6225
Glucose1.20.8
Sucrose77
Starch415322
Total dietary fiber 2188100
Total NSP (soluble NSP) 373 (15)69 (8)
RS 4892
AXOS 535
Fructans56
Klason lignin1818
Gross energy (MJ/kg DM)20.320.7
1 Dry matter; 2 Total NSP + fructans + RS + lignin + AXOS; 3 Non-starch polysaccharides; 4 Resistant starch; 5 Arabinoxylan-oligosaccharides.
Table 2. Average nutrient intake over a 20-week intervention period and relative energy contribution of diet components.
LR 1HR 1SEMp-Value
Nutrient intake (g/day) 2
Dry matter694548780.023
Available carbohydrates295304390.775
Protein836290.006
Fat12395140.015
Total dietary fiber 31305513<0.0001
Relative energy contribution (%) 4
Carbohydrates41.850.8
Fat37.934.6
Protein11.710.3
Total dietary fiber8.74.3
1 Data presented as LS means; LR (n = 15), HR (n = 15). 2 Calculated from feed intake. 3 Total NSP + fructans + RS + lignin + arabinoxylan-oligosaccharides. 4 Calculated from nutrient intake using the FAO energy conversion factors for carbohydrates (17 kJ/g), protein (17 kJ/g), fat (37 kJ/g), and total dietary fiber (8 kJ/g).
Table 3. Urinary concentrations of metabolites after overnight fasting.
p-Value 2
WeekLR 1HR 1DietTimeDiet × Time
Creatinine (µmol/L)44.7 (3.6, 6.1)10 (7.4, 13.6)0.0002NS0.02
126.8 (5.3, 8.9)9.4 (7, 12.6)
205.9 (3.9, 6.8)12 (9.4, 15.3)
Glucose (mmol/L)40.4 (0.1, 1.3)1.8 (0.4, 7.2)0.0040.03NS
120.4 (0.1, 1.4)4.7 (1.2, 17.8)
203.8 (1.2, 12.1)3.6 (1.3, 10.4)
Total Protein (mg/L)474.9 (46, 123)136.1 (76, 243)NSNS0.03
12169.9 (104, 278)75.6 (43, 134)
20150.5 (92, 246)150 (97, 233)
Glucose: Creatinine Ratio 340.1 (0.03, 0.3)0.2 (0.05, 0.7)NSNSNS
120.1 (0.02, 0.2)0.2 (0.06, 0.7)
200.4 (0.11, 1.1)0.3 (0.11, 0.8)
Protein Creatinine Ratio 417.1 (11.3, 22.9)17.2 (10.8, 23.6)0.004NS0.05
1227 (18.2, 35.9)4.5 (−5.7, 14.8)
2027.7 (18.6, 36.8)13.2 (4.6, 21.9)
1 Data presented as LS means; LR (n = 15), HR (n = 15); 95% CI are given for analysis with logarithmically transformed data; 2 non-significant (NS), p > 0.1.
Table 4. Plasma concentrations of circulating hormones.
p-Value 4
WeekLR 1HR 1SEMDietTimeDiet × Time
C-Peptide 2 42827.2
1234.127.53.6NSNSNS
203027.9
Ghrelin 2411.315
1213.610.63.2NSNSNS
2011.116.5
GIP 2492.394.2
1270.855.78.4NS<0.0001NS
2043.850.3
GLP1T 34207.6234.6
12258.8255.218.8NS0.04NS
20236236.1
Glucagon 24163.1202.5
12228.7302.125.50.01<0.0001NS
20213.8295.5
PYY 24281.8234
12368.7227.335.70.0005NSNS
20299.3170.1
Insulin (pmol/L)428.031.2
1233.936.44.6NS0.03NS
2038.943.5
HOMA-IR40.520.59
120.660.710.09NS0.02NS
200.760.84
HOMA-B463.660.4
1252.360.38.7NSNSNS
2056.267.8
1 Data presented as LS means; LR (n = 15), HR (n = 15); 2 measured in pg/mL; 3 total GLP-1; 4 non-significant (NS), p > 0.1.
Publisher’s Note: MDPI stays neutral with regard to jurisdictional claims in published maps and institutional affiliations.

