
Association between Dietary Inflammatory Index, Dietary Patterns, Plant-Based Dietary Index and the Risk of Obesity

 ,
,  ,
,  and
and 
Abstract
1. Introduction
2. Materials and Methods
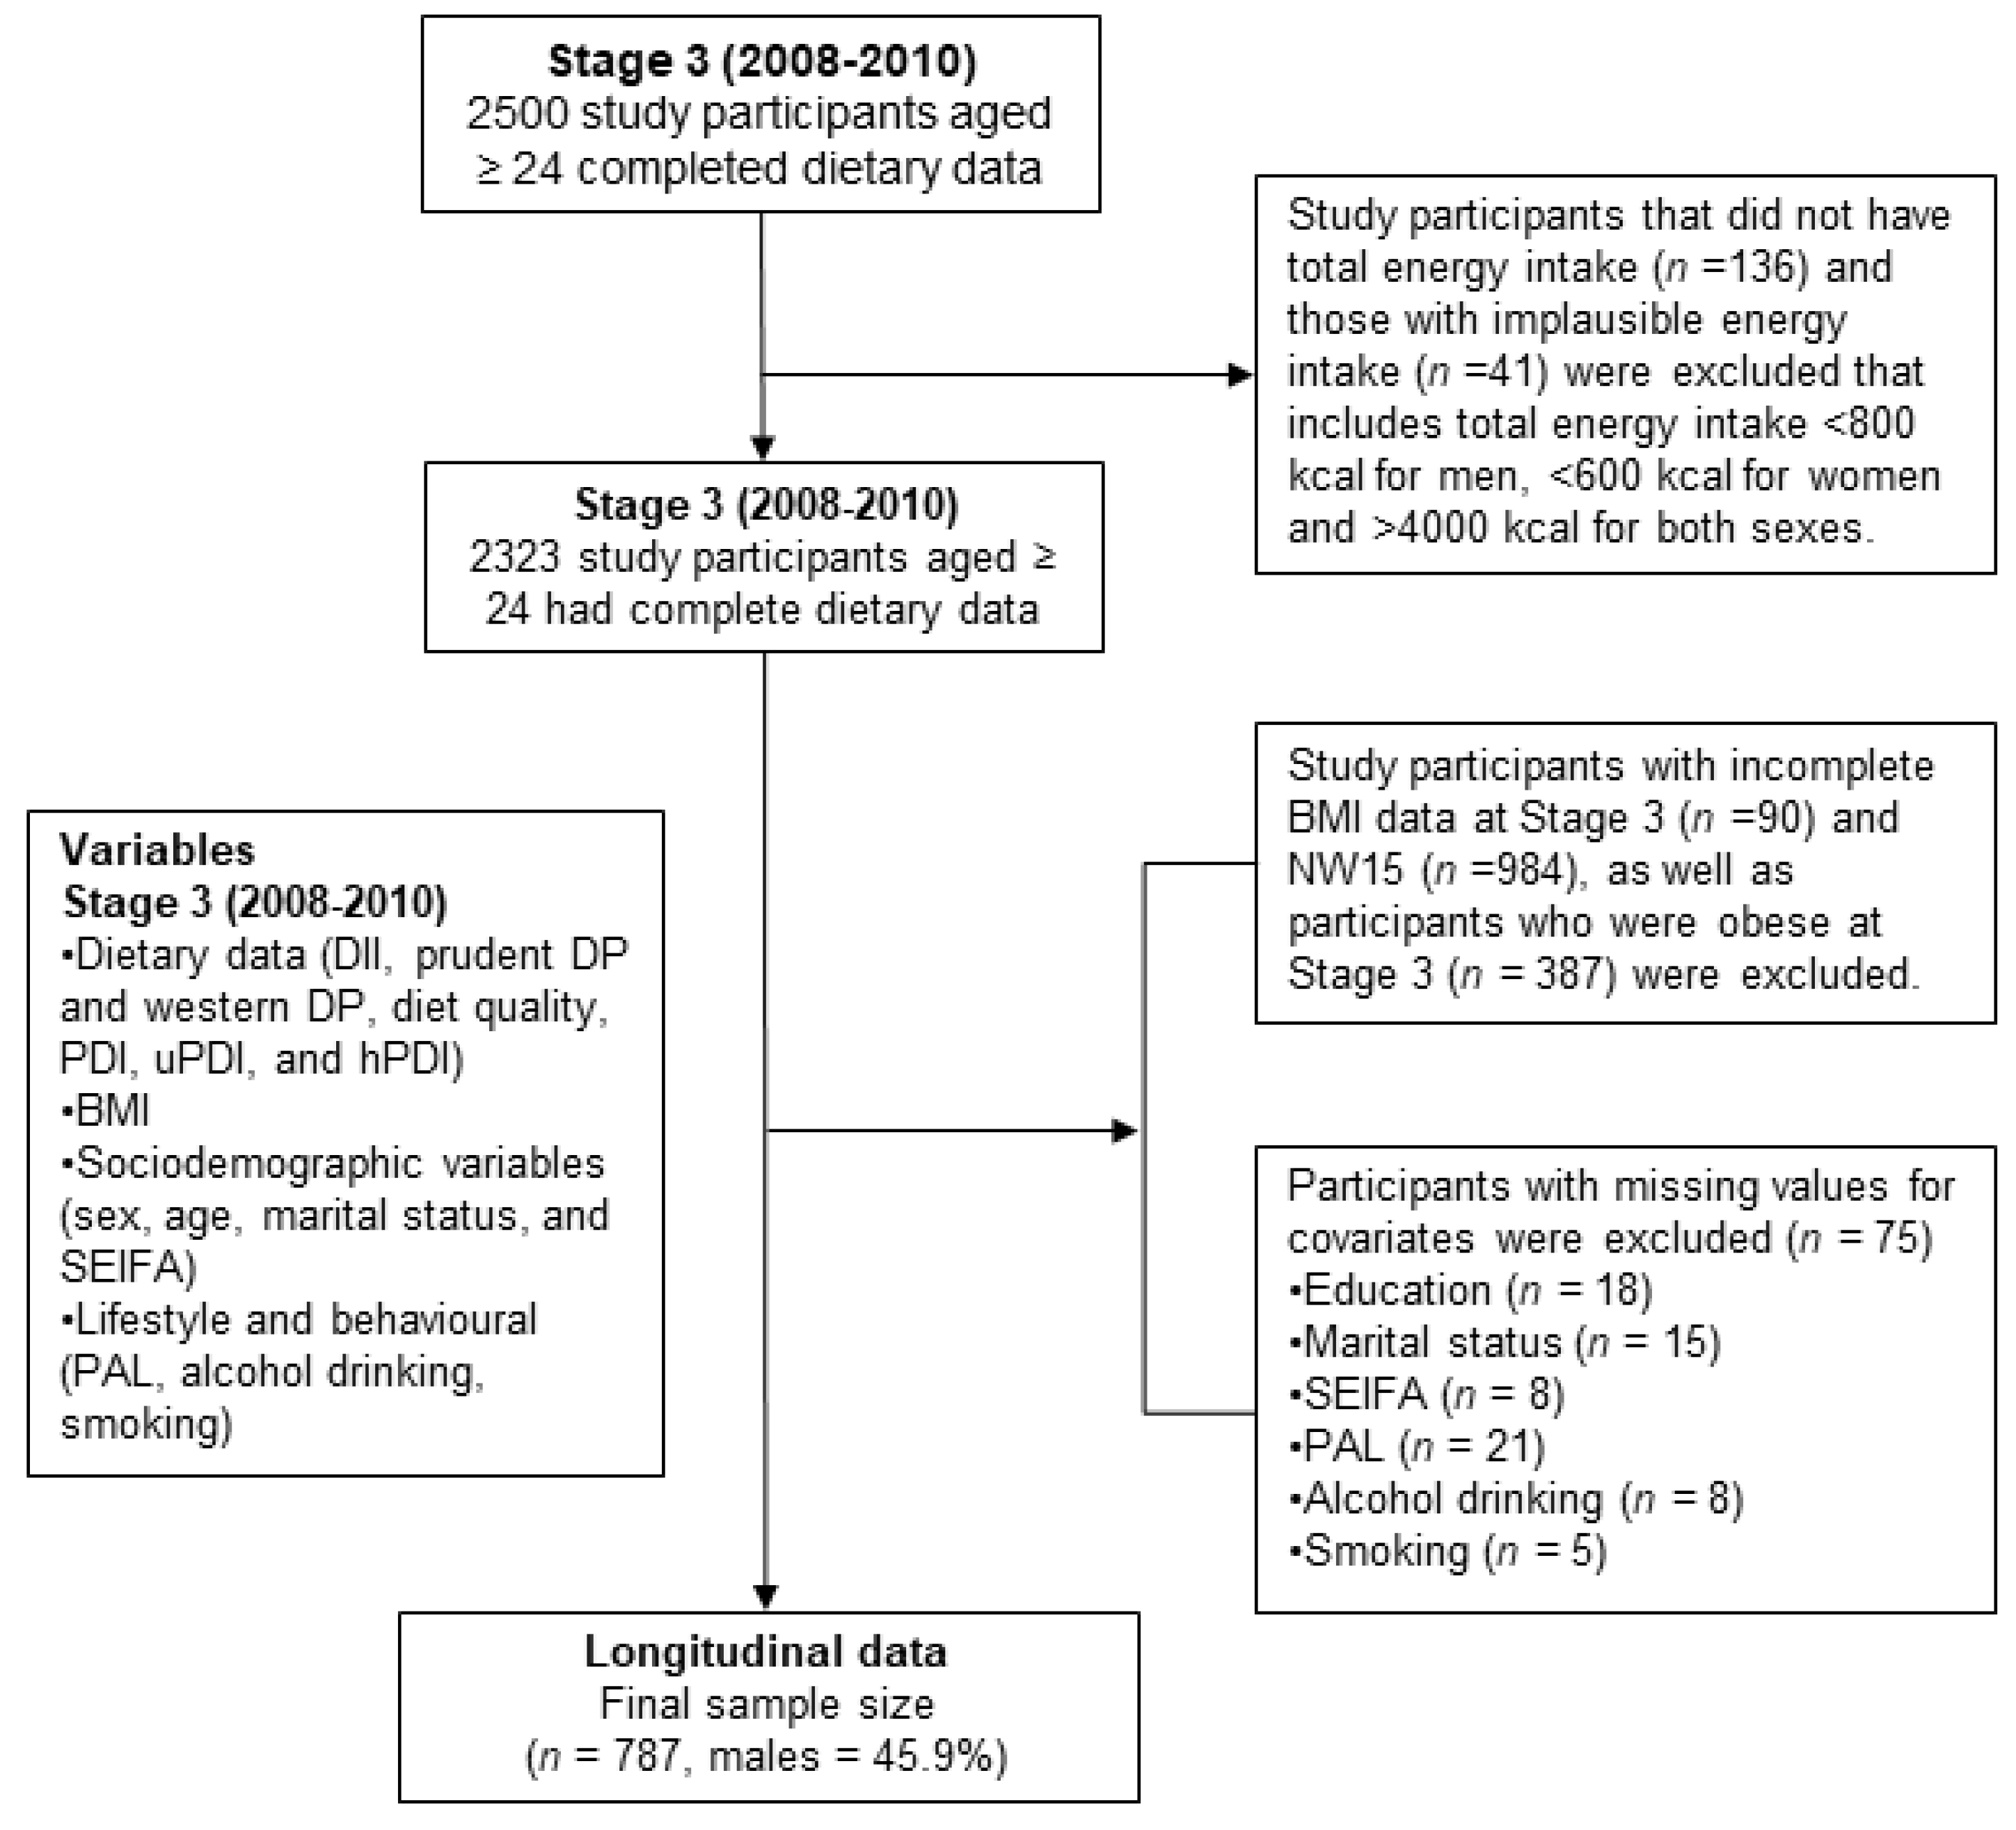
2.1. Study Design and Population
2.2. Measures of BMI at Stage 3 and NW15
2.3. Dietary Assessment and Analysis
2.4. Dietary Inflammatory Index
2.5. Dietary Pattern
2.6. Plant-Based Dietary Index
2.7. Assessment of Covariates
2.8. Statistical Analyses
3. Results
3.1. Anti-Inflammatory Diet, Prudent Pattern, and hPDI Were Inversely Associated with a Lower Risk of Obesity
3.2. Western Dietary Pattern and uPDI Were Associated with a Higher Risk of Obesity
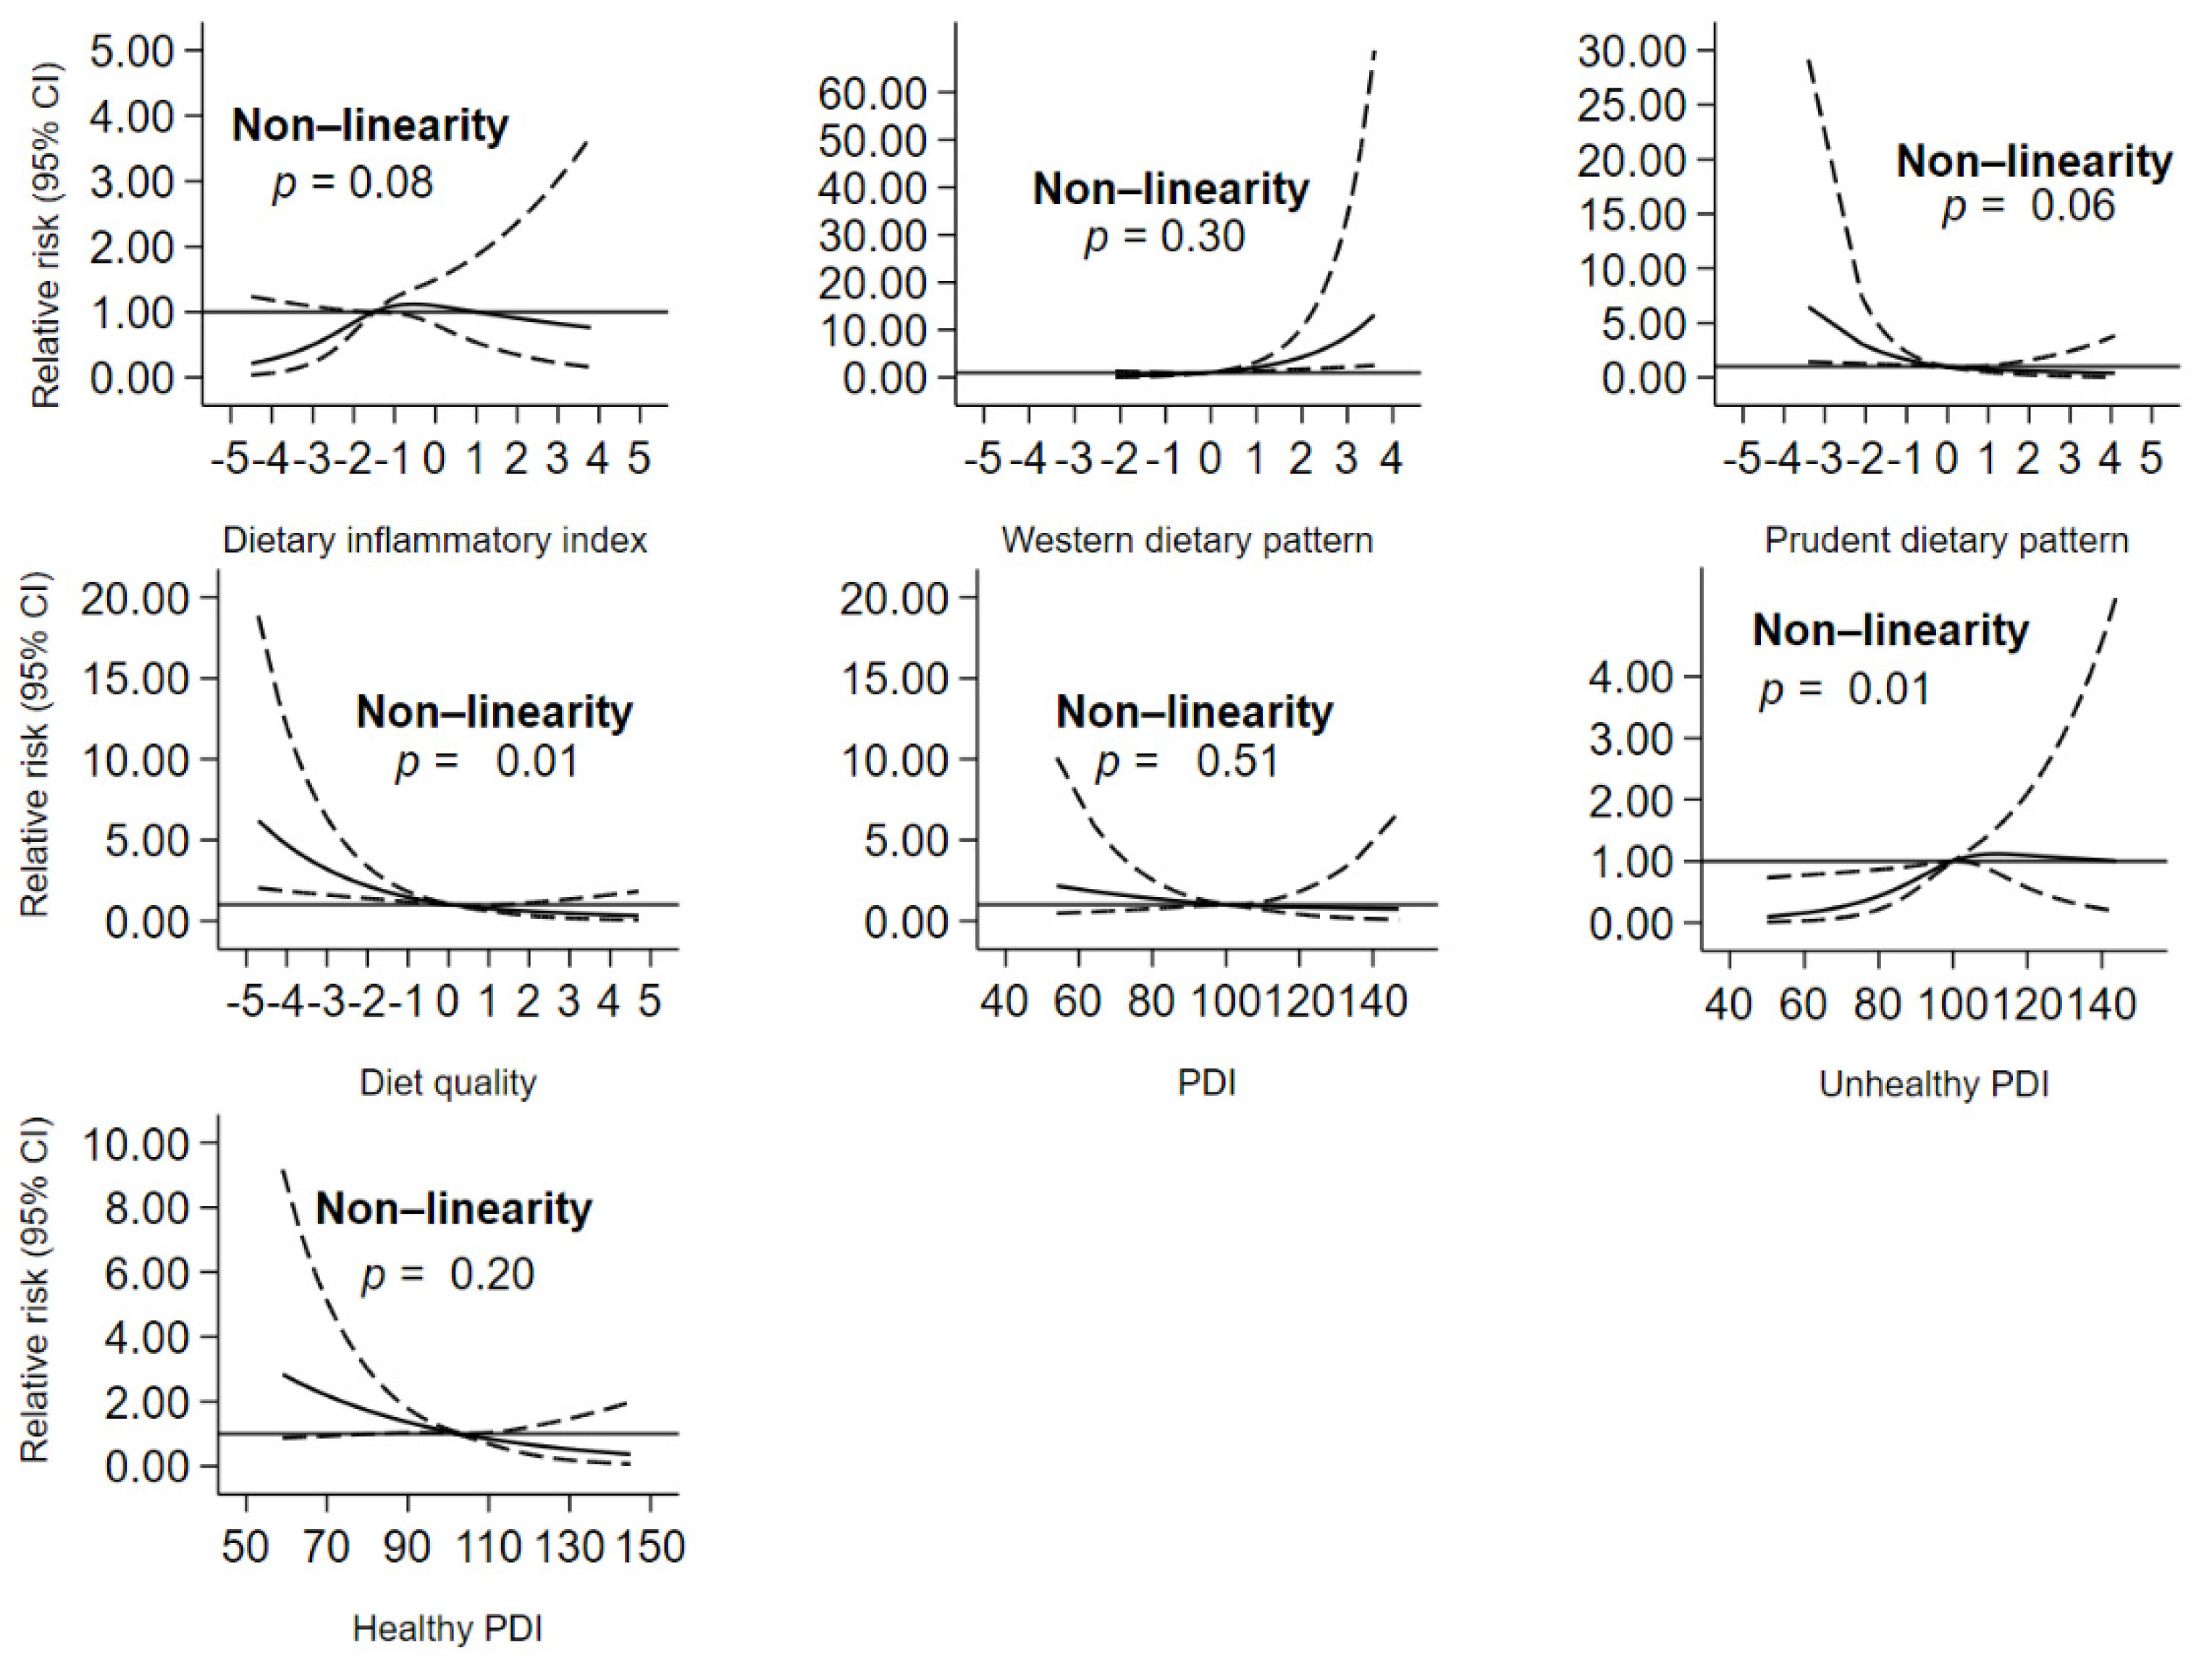
3.3. Diet and Risk of Obesity Dose–Response Relationship
4. Discussion
4.1. DII and the Development of Obesity
4.2. Dietary Patterns and the Risk of Obesity
4.3. Plant-Based Diet and the Risk of Obesity
4.4. Potential Mechanisms
4.5. Strengths and Limitations
4.6. Significance
5. Conclusions
Supplementary Materials
Author Contributions
Funding
Institutional Review Board Statement
Informed Consent Statement
Data Availability Statement
Acknowledgments
Conflicts of Interest
Disclosure
References
- Swinburn, B.A.; Kraak, V.I.; Allender, S.; Atkins, V.J.; Baker, P.I.; Bogard, J.R.; Brinsden, H.; Calvillo, A.; De Schutter, O.; Devarajan, R.; et al. The global syndemic of obesity, undernutrition, and climate change: The lancet commission report. Lancet 2019, 393, 791–846. [Google Scholar] [CrossRef]
- WHO. World Health Statistics 2019: Monitoring Health for the Sdgs, Sustainable Development Goals; World Health Organization: Geneva, Switzerland, 2019. [Google Scholar]
- ABS. 4364.0.55.001—National Health Survey: First Results, 2017–2018; Australian Bureau of Statistics: Canberra, Australia, 2018. [Google Scholar]
- NCD-RisC. Trends in adult body-mass index in 200 countries from 1975 to 2014: A pooled analysis of 1698 population-based measurement studies with 19·2 million participants. Lancet 2016, 387, 1377–1396. [Google Scholar] [CrossRef]
- Afshin, A.; Forouzanfar, M.H.; Reitsma, M.B.; Sur, P.; Estep, K.; Lee, A.; Marczak, L.; Mokdad, A.H.; Moradi-Lakeh, M.; Naghavi, M.; et al. Health effects of overweight and obesity in 195 countries over 25 years. N. Engl. J. Med. 2017, 377, 13–27. [Google Scholar] [CrossRef] [PubMed]
- Shivappa, N.; Steck, S.E.; Hurley, T.G.; Hussey, J.R.; Hebert, J.R. Designing and developing a literature-derived, population-based dietary inflammatory index. Public Health Nutr. 2014, 17, 1689–1696. [Google Scholar] [CrossRef] [PubMed]
- Hu, F.B. Dietary pattern analysis: A new direction in nutritional epidemiology. Curr. Opin. Lipidol. 2002, 13, 3–9. [Google Scholar] [CrossRef]
- Satija, A.; Bhupathiraju, S.N.; Spiegelman, D.; Chiuve, S.E.; Manson, J.E.; Willett, W.; Rexrode, K.M.; Rimm, E.B.; Hu, F.B. Healthful and unhealthful plant-based diets and the risk of coronary heart disease in U.S. Adults. J. Am. Coll. Cardiol. 2017, 70, 411–422. [Google Scholar] [CrossRef] [PubMed]
- Agodi, A.; Maugeri, A.; Kunzova, S.; Sochor, O.; Bauerova, H.; Kiacova, N.; Barchitta, M.; Vinciguerra, M. Association of dietary patterns with metabolic syndrome: Results from the kardiovize brno 2030 study. Nutrients 2018, 10, 898. [Google Scholar] [CrossRef]
- Abdollahzad, H.; Pasdar, Y.; Nachvak, S.M.; Rezaeian, S.; Saber, A.; Nazari, R. The relationship between the dietary inflammatory index and metabolic syndrome in ravansar cohort study. Diabetes Metab. Syndr. Obes. Targets Ther. 2020, 13, 477–487. [Google Scholar] [CrossRef]
- Kim, H.; Caulfield, L.E.; Garcia-Larsen, V.; Steffen, L.M.; Coresh, J.; Rebholz, C.M. Plant based diets are associated with a lower risk of incident cardiovascular disease, cardiovascular disease mortality, and cause mortality in a general population of aged adults. J. Am. Heart Assoc. 2019, 8, e012865. [Google Scholar] [CrossRef]
- McNaughton, S.A.; Dunstan, D.W.; Ball, K.; Shaw, J.; Crawford, D. Dietary quality is associated with diabetes and cardio-metabolic risk factors. J. Nutr. 2009, 139, 734–742. [Google Scholar] [CrossRef]
- Wright, N.; Wilson, L.; Smith, M.; Duncan, B.; McHugh, P. The broad study: A randomised controlled trial using a whole food plant-based diet in the community for obesity, ischaemic heart disease or diabetes. Nutr. Diabetes 2017, 7, e256. [Google Scholar] [CrossRef] [PubMed]
- Boden, S.; Myte, R.; Wennberg, M.; Harlid, S.; Johansson, I.; Shivappa, N.; Hebert, J.R.; Van Guelpen, B.; Nilsson, L.M. The inflammatory potential of diet in determining cancer risk; a prospective investigation of two dietary pattern scores. PLoS ONE 2019, 14, e0214551. [Google Scholar] [CrossRef] [PubMed]
- Ruiz-Canela, M.; Zazpe, I.; Shivappa, N.; Hebert, J.R.; Sanchez-Tainta, A.; Corella, D.; Salas-Salvado, J.; Fito, M.; Lamuela-Raventos, R.M.; Rekondo, J.; et al. Dietary inflammatory index and anthropometric measures of obesity in a population sample at high cardiovascular risk from the predimed (prevencion con dieta mediterranea) trial. Br. J. Nutr. 2015, 113, 984–995. [Google Scholar] [CrossRef]
- Vahid, F.; Bourbour, F.; Gholamalizadeh, M.; Shivappa, N.; Hebert, J.R.; Babakhani, K.; Mosavi Jarrahi, A.; Mirzaei Dahka, S.; Doaei, S. A pro-inflammatory diet increases the likelihood of obesity and overweight in adolescent boys: A case-control study. Diabetol. Metab. Syndr. 2020, 12, 29. [Google Scholar] [CrossRef]
- Olstad, D.L.; Lamb, K.E.; Thornton, L.E.; McNaughton, S.A.; Crawford, D.A.; Minaker, L.M.; Ball, K. Prospective associations between diet quality and body mass index in disadvantaged women: The resilience for eating and activity despite inequality (readi) study. Int. J. Epidemiol. 2017, 46, 1433–1443. [Google Scholar] [CrossRef] [PubMed]
- Grant, J.F.; Taylor, A.W.; Ruffin, R.E.; Wilson, D.H.; Phillips, P.J.; Adams, R.J.; Price, K. Cohort profile: The north west adelaide health study (nwahs). Int. J. Epidemiol. 2009, 38, 1479–1486. [Google Scholar] [CrossRef]
- AIHW. Older Australia at a Glance; Cat. no. AGE 87; AIHW: Canberra, Australia, 2018. [Google Scholar]
- Grant, J.F.; Chittleborough, C.R.; Taylor, A.W.; Dal Grande, E.; Wilson, D.H.; Phillips, P.J.; Adams, R.J.; Cheek, J.; Price, K.; Gill, T.; et al. The north west adelaide health study: Detailed methods and baseline segmentation of a cohort for selected chronic diseases. Epidemiol. Perspect. Innov. 2006, 3, 4. [Google Scholar] [CrossRef]
- Clinical guidelines on the identification, evaluation, and treatment of overweight and obesity in adults: Executive summary. Expert Panel on the Identification, Evaluation, and Treatment of Overweight in Adults. Am J Clin Nutr. 1998, 68, 899–917. [Google Scholar] [CrossRef]
- Victoria, C.C. Dietary Questionnaires for Epidemiological Studies. Available online: https://www.cancervic.org.au/research/epidemiology/nutritional_assessment_services (accessed on 27 November 2020).
- Shakya, P.R.; Melaku, Y.A.; Page, A.; Gill, T.K. Association between dietary patterns and adult depression symptoms based on principal component analysis, reduced-rank regression and partial least-squares. Clin. Nutr. 2019. [Google Scholar] [CrossRef]
- Satija, A.; Malik, V.; Rimm, E.B.; Sacks, F.; Willett, W.; Hu, F.B. Changes in intake of plant-based diets and weight change: Results from 3 prospective cohort studies. Am. J. Clin. Nutr. 2019, 110, 574–582. [Google Scholar] [CrossRef]
- AIHW. Risk Factor Prevalence Study: Survey No. 3 1989; AIHW: Canberra, Australia, 1990. [Google Scholar]
- Armstrong, T.; Bauman, A.E.; Davies, J. Physical Activity Patterns of Australian Adults: Results of the 1999 National Physical Activity Survey; Australian Institute of Health and Welfare: Canberra, Australia, 2000. [Google Scholar]
- ABS. Socio-Economic Indexes for Areas (Seifa); Australian Bureau of Statistics: Canberra, Australia, 2016. [Google Scholar]
- Ji, M.; Hong, X.; Chen, M.; Chen, T.; Wang, J.; Zhang, N. Dietary inflammatory index and cardiovascular risk and mortality: A meta-analysis of cohort studies. Medicine 2020, 99, e20303. [Google Scholar] [CrossRef] [PubMed]
- Zahedi, H.; Djalalinia, S.; Asayesh, H.; Mansourian, M.; Esmaeili Abdar, Z.; Mahdavi Gorabi, A.; Ansari, H.; Noroozi, M.; Qorbani, M. A higher dietary inflammatory index score is associated with a higher risk of incidence and mortality of cancer: A comprehensive systematic review and meta-analysis. Int. J. Prev. Med. 2020, 11, 15. [Google Scholar] [CrossRef] [PubMed]
- Farhangi, M.A.; Vajdi, M. The association between dietary inflammatory index and risk of central obesity in adults: An updated systematic review and meta-analysis. Int. J. Vitam. Nutr. Res. 2020, 1–18. [Google Scholar] [CrossRef] [PubMed]
- Oliveira, T.M.S.; Bressan, J.; Pimenta, A.M.; Martínez-González, M.-Á.; Shivappa, N.; Hébert, J.R.; Hermsdorff, H.H.M. Dietary inflammatory index and prevalence of overweight and obesity in brazilian graduates from the cohort of universities of minas gerais (cume project). Nutrition 2020, 71, 110635. [Google Scholar] [CrossRef]
- Ramallal, R.; Toledo, E.; Martinez, J.A.; Shivappa, N.; Hebert, J.R.; Martinez-Gonzalez, M.A.; Ruiz-Canela, M. Inflammatory potential of diet, weight gain, and incidence of overweight/obesity: The sun cohort. Obesity 2017, 25, 997–1005. [Google Scholar] [CrossRef] [PubMed]
- Mu, M.; Xu, L.F.; Hu, D.; Wu, J.; Bai, M.J. Dietary patterns and overweight/obesity: A review article. Iran. J. Public Health 2017, 46, 869–876. [Google Scholar]
- Livingstone, K.M.; McNaughton, S.A. Diet quality is associated with obesity and hypertension in australian adults: A cross sectional study. BMC Public Health 2016, 16, 1037. [Google Scholar] [CrossRef]
- Newby, P.; Muller, D.; Hallfrisch, J.; Andres, R.; Tucker, K.L. Food patterns measured by factor analysis and anthropometric changes in adults. Am. J. Clin. Nutr. 2004, 80, 504–513. [Google Scholar] [CrossRef]
- Rezagholizadeh, F.; Djafarian, K.; Khosravi, S.; Shab-Bidar, S. A posteriori healthy dietary patterns may decrease the risk of central obesity: Findings from a systematic review and meta-analysis. Nutr. Res. 2017, 41, 1–13. [Google Scholar] [CrossRef]
- Togo, P.; Osler, M.; Sørensen, T.I.A.; Heitmann, B.L. Food intake patterns and body mass index in observational studies. Int. J. Obes. 2001, 25, 1741–1751. [Google Scholar] [CrossRef]
- Denova-Gutiérrez, E.; Castañón, S.; Talavera, J.O.; Flores, M.; Macías, N.; Rodríguez-Ramírez, S.; Flores, Y.N.; Salmerón, J. Dietary patterns are associated with different indexes of adiposity and obesity in an urban mexican population. J. Nutr. 2011, 141, 921–927. [Google Scholar] [CrossRef] [PubMed]
- Paradis, A.M.; Godin, G.; Pérusse, L.; Vohl, M.C. Associations between dietary patterns and obesity phenotypes. Int. J. Obes. 2009, 33, 1419–1426. [Google Scholar] [CrossRef]
- Dinu, M.; Abbate, R.; Gensini, G.F.; Casini, A.; Sofi, F. Vegetarian, vegan diets and multiple health outcomes: A systematic review with meta-analysis of observational studies. Crit. Rev. Food Sci. Nutr. 2017, 57, 3640–3649. [Google Scholar] [CrossRef] [PubMed]
- Magkos, F.; Tetens, I.; Bügel, S.G.; Felby, C.; Schacht, S.R.; Hill, J.O.; Ravussin, E.; Astrup, A. A perspective on the transition to plant-based diets: A diet change may attenuate climate change, but can it also attenuate obesity and chronic disease risk? Adv. Nutr. 2019, 11, 1–9. [Google Scholar] [CrossRef] [PubMed]
- Ratjen, I.; Morze, J.; Enderle, J.; Both, M.; Borggrefe, J.; Müller, H.-P.; Kassubek, J.; Koch, M.; Lieb, W. Adherence to a plant-based diet in relation to adipose tissue volumes and liver fat content. Am. J. Clin. Nutr. 2020, 112, 354–363. [Google Scholar] [CrossRef] [PubMed]
- Kirwan, A.M.; Lenighan, Y.M.; O’Reilly, M.E.; McGillicuddy, F.C.; Roche, H.M. Nutritional modulation of metabolic inflammation. Biochem. Soc. Trans. 2017, 45, 979–985. [Google Scholar] [CrossRef]
- Di Gregorio, G.B.; Hensley, L.; Lu, T.; Ranganathan, G.; Kern, P.A. Lipid and carbohydrate metabolism in mice with a targeted mutation in the il-6 gene: Absence of development of age-related obesity. Am. J. Physiol. Endocrinol. Metab. 2004, 287, E182–E187. [Google Scholar] [CrossRef]
- Uysal, K.T.; Wiesbrock, S.M.; Marino, M.W.; Hotamisligil, G.S. Protection from obesity-induced insulin resistance in mice lacking tnf-alpha function. Nature 1997, 389, 610–614. [Google Scholar] [CrossRef]
- Engström, G.; Hedblad, B.; Stavenow, L.; Lind, P.; Janzon, L.; Lindgärde, F. Inflammation-sensitive plasma proteins are associated with future weight gain. Diabetes 2003, 52, 2097–2101. [Google Scholar] [CrossRef]
- Barzilay, J.I.; Forsberg, C.; Heckbert, S.R.; Cushman, M.; Newman, A.B. The association of markers of inflammation with weight change in older adults: The cardiovascular health study. Int. J. Obes. 2006, 30, 1362–1367. [Google Scholar] [CrossRef]
- Holz, T.; Thorand, B.; Döring, A.; Schneider, A.; Meisinger, C.; Koenig, W. Markers of inflammation and weight change in middle-aged adults: Results from the prospective monica/kora s3/f3 study. Obesity 2010, 18, 2347–2353. [Google Scholar] [CrossRef] [PubMed]
- Duan, Y.; Zeng, L.; Zheng, C.; Song, B.; Li, F.; Kong, X.; Xu, K. Inflammatory links between high fat diets and diseases. Front. Immunol. 2018, 9, 2649. [Google Scholar] [CrossRef] [PubMed]
- Holt, E.M.; Steffen, L.M.; Moran, A.; Basu, S.; Steinberger, J.; Ross, J.A.; Hong, C.P.; Sinaiko, A.R. Fruit and vegetable consumption and its relation to markers of inflammation and oxidative stress in adolescents. J. Am. Diet. Assoc. 2009, 109, 414–421. [Google Scholar] [CrossRef]
- Åsgård, R.; Rytter, E.; Basu, S.; Abramsson-Zetterberg, L.; Möller, L.; Vessby, B. High intake of fruit and vegetables is related to low oxidative stress and inflammation in a group of patients with type 2 diabetes. Scand. J. Food Nutr. 2007, 51, 149–158. [Google Scholar] [CrossRef]
- Ruiz-Saavedra, S.; Salazar, N.; Suárez, A.; de Los Reyes-Gavilán, C.G.; Gueimonde, M.; González, S. Comparison of different dietary indices as predictors of inflammation, oxidative stress and intestinal microbiota in middle-aged and elderly subjects. Nutrients 2020, 12, 3828. [Google Scholar] [CrossRef]
- Kim, J.; Lee, J.; Oh, J.H.; Chang, H.J.; Sohn, D.K.; Shin, A.; Kim, J. Circulating interleukin-6 level, dietary antioxidant capacity, and risk of colorectal cancer. Antioxidants 2019, 8, 595. [Google Scholar] [CrossRef] [PubMed]
- Kobayashi, S.; Murakami, K.; Sasaki, S.; Uenishi, K.; Yamasaki, M.; Hayabuchi, H.; Goda, T.; Oka, J.; Baba, K.; Ohki, K.; et al. Dietary total antioxidant capacity from different assays in relation to serum c-reactive protein among young Japanese women. Nutr. J. 2012, 11, 91. [Google Scholar] [CrossRef] [PubMed]
- Chen, J.; He, X.; Huang, J. Diet effects in gut microbiome and obesity. J. Food Sci. 2014, 79, R442–R451. [Google Scholar] [CrossRef]
- Wu, G.D.; Chen, J.; Hoffmann, C.; Bittinger, K.; Chen, Y.-Y.; Keilbaugh, S.A.; Bewtra, M.; Knights, D.; Walters, W.A.; Knight, R.; et al. Linking long-term dietary patterns with gut microbial enterotypes. Science 2011, 334, 105–108. [Google Scholar] [CrossRef]
- Tomova, A.; Bukovsky, I.; Rembert, E.; Yonas, W.; Alwarith, J.; Barnard, N.D.; Kahleova, H. The effects of vegetarian and vegan diets on gut microbiota. Front. Nutr. 2019, 6, 47. [Google Scholar] [CrossRef]
- Bolte, L.A.; Vich Vila, A.; Imhann, F.; Collij, V.; Gacesa, R.; Peters, V.; Wijmenga, C.; Kurilshikov, A.; Campmans-Kuijpers, M.J.E.; Fu, J.; et al. Long-term dietary patterns are associated with pro-inflammatory and anti-inflammatory features of the gut microbiome. Gut 2021. [Google Scholar] [CrossRef] [PubMed]
- Zinöcker, M.K.; Lindseth, I.A. The western diet—Microbiome-host interaction and its role in metabolic disease. Nutrients 2018, 10, 365. [Google Scholar] [CrossRef] [PubMed]
- Hartstra, A.V.; Bouter, K.E.; Bäckhed, F.; Nieuwdorp, M. Insights into the role of the microbiome in obesity and type 2 diabetes. Diabetes Care 2015, 38, 159–165. [Google Scholar] [CrossRef] [PubMed]
- Tan, J.; McKenzie, C.; Potamitis, M.; Thorburn, A.N.; Mackay, C.R.; Macia, L. The role of short-chain fatty acids in health and disease. Adv. Immunol. 2014, 121, 91–119. [Google Scholar] [CrossRef]
- Zheng, J.; Hoffman, K.L.; Chen, J.S.; Shivappa, N.; Sood, A.; Browman, G.J.; Dirba, D.D.; Hanash, S.; Wei, P.; Hebert, J.R.; et al. Dietary inflammatory potential in relation to the gut microbiome: Results from a cross-sectional study. Br. J. Nutr. 2020, 124, 931–942. [Google Scholar] [CrossRef] [PubMed]
- Willett, W. Nutritional Epidemiology; Oxford University Press: Oxford, UK, 2012. [Google Scholar]
- Ma, Y.; He, F.J.; MacGregor, G.A. High salt intake: Independent risk factor for obesity? Hypertension 2015, 66, 843–849. [Google Scholar] [CrossRef]
- Zhang, F.; Ye, J.; Zhu, X.; Wang, L.; Gao, P.; Shu, G.; Jiang, Q.; Wang, S. Anti-obesity effects of dietary calcium: The evidence and possible mechanisms. Int. J. Mol. Sci. 2019, 20, 3072. [Google Scholar] [CrossRef]
- Cai, X.; Li, X.; Fan, W.; Yu, W.; Wang, S.; Li, Z.; Scott, E.M.; Li, X. Potassium and obesity/metabolic syndrome: A systematic review and meta-analysis of the epidemiological evidence. Nutrients 2016, 8, 183. [Google Scholar] [CrossRef]
- Mazur-Bialy, A.I.; Pocheć, E. Riboflavin reduces pro-inflammatory activation of adipocyte-macrophage co-culture. Potential application of vitamin b2 enrichment for attenuation of insulin resistance and metabolic syndrome development. Molecules 2016, 21, 1724. [Google Scholar] [CrossRef] [PubMed]
- Morris, M.S.; Sakakeeny, L.; Jacques, P.F.; Picciano, M.F.; Selhub, J. Vitamin b-6 intake is inversely related to, and the requirement is affected by, inflammation status. J. Nutr. 2010, 140, 103–110. [Google Scholar] [CrossRef]
- Taylor, A.W.; Dal Grande, E.; Gill, T.K.; Chittleborough, C.R.; Wilson, D.H.; Adams, R.J.; Grant, J.F.; Phillips, P.; Appleton, S.; Ruffin, R.E. How valid are self-reported height and weight? A comparison between cati self-report and clinic measurements using a large cohort study. Aust. N. Z. J. Public Health 2006, 30, 238–246. [Google Scholar] [CrossRef] [PubMed]
- Ghosh, A.; Charlton, K.E.; Batterham, M.J. Socioeconomic disadvantage and its implications for population health planning of obesity and overweight, using cross-sectional data from general practices from a regional catchment in australia. BMJ Open 2016, 6, e010405. [Google Scholar] [CrossRef] [PubMed]
- French, S.A.; Tangney, C.C.; Crane, M.M.; Wang, Y.; Appelhans, B.M. Nutrition quality of food purchases varies by household income: The shopper study. BMC Public Health 2019, 19, 231. [Google Scholar] [CrossRef] [PubMed]


| Characteristics | Overall | DII | p- Trend | Dietary Quality | p- Trend | PDI | p- Trend | uPDI | p- Trend | hPDI | p-Trend | |||||
|---|---|---|---|---|---|---|---|---|---|---|---|---|---|---|---|---|
| Q1 | Q5 | Q1 | Q5 | Q1 | Q5 | Q1 | Q5 | Q1 | Q5 | |||||||
| Sex (n,%) | ||||||||||||||||
| Male | 361 (45.9) | 59 (16.3) | 91 (25.2) | 0.001 | 116 (32.1) | 34 (9.4) | <0.001 | 82 (22.7) | 74 (20.5) | 0.26 | 67 (18.6) | 73 (20.2) | 0.20 | 100 (27.7) | 51 (14.1) | <0.001 |
| Female | 426 (54.1) | 99 (23.2) | 66 (15.5) | 42 (9.9) | 123 (28.9) | 82 (19.3) | 79 (18.5) | 103 (24.2) | 77 (18.1) | 68 (16.0) | 104 (24.4) | |||||
| Age (mean, SD), year | 58.7 (12.9) | 59.7 (10.8) | 56.7 (13.2) | 0.004 | 57.0 (12.7) | 60.3 (11.3) | 0.004 | 58.6 (13.7) | 59.9 (13.3) | 0.001 | 61.4 (11.0) | 56.6 (13.6) | 0.01 | 54.9 (13.5) | 62.7 (11.4) | 0.03 |
| BMI (mean, SD), kg/m2 | 25.6 (2.7) | 25.3 (2.7) | 25.8 (2.8) | 0.004 | 25.9 (2.7) | 24.9 (2.9) | <0.001 | 26.3 (2.4) | 25.4 (2.8) | 0.01 | 25.4 (2.8) | 25.6 (3.0) | 0.002 | 25.8 (2.9) | 25.0 (2.7) | 0.02 |
| Educational Status (n,%) | ||||||||||||||||
| Did not complete high school / high school level | 383 (48.7) | 70 (18.3) | 81 (21.2) | 0.02 | 87 (22.7) | 71 (18.5) | 0.004 | 93 (24.3) | 64 (16.7) | 0.01 | 80 (20.9) | 84 (21.9) | 0.33 | 80 (20.9) | 67 (17.5) | 0.64 |
| Trade / certificate / diploma | 252 (32.0) | 52 (20.6) | 61 (24.2) | 55 (21.8) | 42 (16.7) | 53 (21.0) | 47 (18.7) | 57 (22.6) | 48 (19.1) | 58 (23.0) | 50 (19.8) | |||||
| Degree or higher | 152 (19.3) | 36 (23.7) | 15 (9.9) | 16 (10.5) | 44 (29.0) | 18 (11.8) | 42 (27.6) | 33 (21.7) | 18 (11.8) | 30 (19.7) | 38 (25.0) | |||||
| Marital Status (n,%) | ||||||||||||||||
| Married/living with partner | 572 (72.7) | 121 (21.2) | 103 (18.0) | 0.09 | 114 (19.9) | 109 (19.1) | 0.13 | 116 (20.3) | 113 (19.8) | 0.53 | 117 (20.5) | 117 (20.5) | 0.47 | 130 (22.7) | 99 (17.3) | <0.001 |
| Separated / divorced | 101 (12.8) | 21 (20.8) | 30 (29.7) | 23 (22.7) | 23 (22.7) | 30 (29.7) | 13 (12.9) | 30 (29.7) | 15 (14.9) | 20 (19.8) | 20 (19.8) | |||||
| Widowed | 72 (9.2) | 13 (18.1) | 14 (19.4) | 12 (16.7) | 20 (27.8) | 12 (16.7) | 17 (23.6) | 16 (22.2) | 11 (15.3) | 7 (9.72) | 30 (41.7) | |||||
| Never married | 41 (5.2) | 3 (7.3) | 10 (24.4) | 9 (22.0) | 5 (12.2) | 5 (12.2) | 10 (24.4) | 6 (14.6) | 7 (17.1) | 11 (26.8) | 6 (14.6) | |||||
| Not stated | 1 (0.1) | 0 (0.0) | 0 (0.0) | 0 (0.0) | 0 (0.0) | 1 (100.0) | 0 (0.0) | 1 (100.0) | 0 (0.0) | 0 (0.0) | 0 (0.0) | |||||
| Smoking Status (n,%) | ||||||||||||||||
| Non-smoker | 388 (49.3) | 87 (22.4) | 57 (14.7) | 0.002 | 57 (14.7) | 86 (22.2) | <0.001 | 70 (18.0) | 95 (24.5) | 0.003 | 90 (23.2) | 75 (19.3) | 0.78 | 78 (20.1) | 86 (22.2) | 0.15 |
| Ex-smoker | 320 (40.7) | 62 (19.4) | 71 (22.2) | 71 (22.2) | 66 (20.6) | 73 (22.8) | 52 (16.3) | 67 (20.9) | 59 (18.4) | 67 (20.9) | 62 (19.4) | |||||
| Current smoker | 79 (10.0) | 9 (11.4) | 29 (36.7) | 30 (38.0) | 5 (6.3) | 21 (26.6) | 6 (7.6) | 13 (16.5) | 16 (20.3) | 23 (29.1) | 7 (8.9) | |||||
| SEIFA (n, %) | ||||||||||||||||
| Lowest quintile | 174 (22.1) | 29 (16.7) | 41 (23.6) | 0.09 | 46 (26.4) | 30 (17.2) | 0.28 | 38 (21.8) | 33 (19.0) | 0.86 | 28 (16.1) | 38 (21.8) | 0.49 | 42 (24.1) | 28 (16.1) | 0.84 |
| Low quintile | 187 (23.8) | 45 (24.1) | 44 (23.5) | 44 (23.5) | 35 (18.7) | 42 (22.5) | 28 (15.0) | 46 (24.6) | 42 (22.5) | 40 (21.4) | 33 (17.7) | |||||
| Middle quintile | 165 (21.0) | 31 (18.8) | 28 (17.0) | 28 (17.0) | 34 (20.6) | 31 (18.8) | 33 (20.0) | 38 (23.0) | 23 (13.9) | 35 (21.2) | 31 (18.8) | |||||
| High quintile | 204 (25.9) | 39 (19.1) | 37 (18.1) | 34 (16.7) | 43 (21.1) | 42 (20.6) | 50 (24.5) | 46 (22.6) | 40 (19.6) | 42 (20.6) | 50 (24.5) | |||||
| Highest quintile | 57 (7.2) | 14 (24.6) | 7 (12.3) | 6 (10.5) | 15 (26.3) | 11 (19.3) | 9 (15.8) | 12 (21.1) | 7 (12.3) | 9 (15.8) | 13 (22.8) | |||||
| Alcohol Risk (n,%) | ||||||||||||||||
| Non-drinkers and no risk | 377 (47.9) | 72 (19.1) | 72 (19.1) | 0.30 | 94 (24.9) | 57 (15.1) | <0.001 | 68 (18.0) | 82 (21.8) | 0.16 | 76 (20.2) | 82 (21.8) | 0.48 | 86 (22.8) | 73 (19.4) | 0.91 |
| Low risk | 318 (40.4) | 71 (22.3) | 58 (18.2) | 35 (11.0) | 84 (26.4) | 66 (20.8) | 59 (18.6) | 74 (23.3) | 49 (15.4) | 60 (18.9) | 65 (20.4) | |||||
| Intermediate risk | 20 (2.5) | 3 (15.0) | 5 (25.0) | 10 (50.0) | 2 (10.0) | 9 (45.0) | 1 (5.0) | 4 (20.0) | 2 (10.0) | 4 (20.0) | 2 (10.0) | |||||
| High to very high risk | 8 (1.0) | 0 (0.0) | 2 (25.0) | 3 (37.5) | 0 (0.0) | 3 (37.5) | 0 (0.0) | 2 (25.0) | 3 (37.5) | 2 (25.0) | 1 (12.5) | |||||
| Incomplete information | 64 (8.1) | 12 (18.8) | 20 (31.3) | 16 (25.0) | 14 (21.9) | 18 (28.1) | 11 (17.2) | 14 (21.9) | 14 (21.9) | 16 (25.0) | 14 (21.9) | |||||
| PAL (n,%) | ||||||||||||||||
| No activity | 101 (12.8) | 8 (7.9) | 25 (24.6) | <0.001 | 25 (24.8) | 7 (6.9) | <0.001 | 27 (26.7) | 13 (12.9) | 0.32 | 17 (16.8) | 29 (28.7) | 0.003 | 21 (20.8) | 16 (15.8) | 0.01 |
| Activity but not sufficient | 322 (40.9) | 60 (18.6) | 78 (24.2) | 75 (23.3) | 58 (18.0) | 61 (18.9) | 64 (19.9) | 59 (18.3) | 73 (22.7) | 82 (25.5) | 49 (15.2) | |||||
| Sufficient activity | 364 (46.3) | 90 (24.7) | 54 (14.5) | 58 (15.9) | 92 (25.3) | 76 (20.9) | 76 (20.9) | 94 (25.8) | 48 (13.2) | 65 (17.9) | 90 (24.7) | |||||
| DII (mean, SD) | −1.43 (1.36) | −0.03 (1.25) | −2.64 (0.82) | 0.43 | −0.64 (1.42) | −2.24 (0.99) | 0.18 | −2.11 (1.06) | −0.57 (1.50) | 0.15 | −0.30 (1.34) | −2.27 (1.05) | 0.21 | |||
| Prudent DP (mean, SD) | 0.13 (1.02) | 1.11 (0.97) | −0.77 (0.70) | 0.39 | −0.78 (0.70) | 1.37 (0.83) | 0.40 | −0.66 (0.73) | 0.92 (0.92) | 0.30 | 1.05 (0.99) | −0.71 (0.77) | 0.33 | −0.44 (0.88) | 0.77 (1.11) | 0.14 |
| Western DP (mean, SD) | −0.06 (0.93) | −0.46 (0.79) | 0.38 (1.05) | 0.10 | 1.02 (0.90) | −0.75 (0.63) | 0.30 | −0.19 (1.05) | 0.17 (0.91) | 0.01 | −0.03 (0.93) | −0.14 (0.86) | <0.001 | 0.69 (0.97) | −0.67 (0.70) | 0.25 |
| Dietary quality (mean, SD) | 0.18 (1.43) | 1.56 (1.12) | −1.15 (1.30) | 0.42 | −0.47 (1.43) | 0.75 (1.36) | 0.10 | 1.09 (1.37) | −0.56 (1.23) | 0.15 | −1.12 (1.30) | 1.44 (1.18) | 0.35 | |||
| PDI (mean, SD) | 101.8 (12.8) | 108.9 (12.5) | 91.7 (10.6) | 0.19 | 95.6 (12.1) | 108.3 (12.1) | 0.095 | 104.1 (11.6) | 98.5 (12.5) | 0.02 | 94.0 (10.9) | 109.5 (12.5) | 0.14 | |||
| uPDI (mean, SD) | 99.8 (14.3) | 92.3 (12.9) | 108.4 (13.4) | 0.14 | 107.1 (14.4) | 90.4 (11.5) | 0.17 | 101.9 (13.7) | 97.7 (12.6) | 0.02 | 107.8 (14.3) | 91.8 (12.1) | 0.14 | |||
| hPDI (Mean, SD) | 103.1 (14.7) | 113.9 (12.5) | 91.7 (14.0) | 0.26 | 88.3 (12.1) | 116.0 (12.6) | 0.39 | 95.9 (14.9) | 112.1 (12.5) | 0.15 | 110.4 (14.4) | 94.5 (14.1) | 0.14 | |||
| Model | Relative Risk (95% CI) | p-Trend | ||||
|---|---|---|---|---|---|---|
| Q1 | Q2 | Q3 | Q4 | Q5 | ||
| Dietary inflammatory index | ||||||
| Model 1 | 1.00 | 0.56 (0.19–1.62) | 1.52 (0.68–3.41) | 1.62 (0.73–3.61) | 1.78 (0.81–3.91) | 0.03 |
| Model 2 | 1.00 | 0.58 (0.20–1.68) | 1.64 (0.73–3.68) | 1.72 (0.78–3.81) | 1.59 (0.72–3.50) | 0.06 |
| Prudent pattern | ||||||
| Model 1 | 1.00 | 0.70 (0.37–1.33) | 0.55 (0.30–1.11) | 0.34 (0.15–0.79) | 0.36 (0.16–0.83) | 0.002 |
| Model 2 * | 1.00 | 0.75 (0.39–1.43) | 0.58 (0.28–1.21) | 0.39 (0.16–0.94) | 0.38 (0.15–0.96) | 0.01 |
| Western pattern | ||||||
| Model 1 | 1.00 | 0.96 (0.43–2.16) | 1.14 (0.52–2.47) | 0.82 (0.35–1.92) | 1.13 (0.51–2.53) | 0.87 |
| Model 2 * | 1.00 | 1.36 (0.59–3.12) | 1.77 (0.77–4.07) | 1.57 (0.59–4.16) | 2.16 (0.76–6.08) | 0.17 |
| Diet quality | ||||||
| Model 1 | 1.00 | 0.72 (0.37–1.37) | 0.46 (0.21–0.99) | 0.62 (0.30–1.26) | 0.26 (0.10–0.70) | 0.007 |
| Model 2 * | 1.00 | 0.70 (0.36–1.35) | 0.40 (0.17–0.90) | 0.54 (0.25–1.19) | 0.23 (0.08–0.66) | 0.006 |
| Plant-based dietary index | ||||||
| Model 1 | 1.00 | 0.76 (0.38–1.51) | 0.84 (0.42–1.67) | 0.65 (0.31–1.38) | 0.45 (0.19–1.05) | 0.07 |
| Model 2 | 1.00 | 0.75 (0.37–1.50) | 0.87 (0.44–1.72) | 0.68 (0.32–1.45) | 0.56 (0.23–1.33) | 0.19 |
| Healthy plant-based dietary index | ||||||
| Model 1 | 1.00 | 0.35 (0.16–0.77) | 0.73 (0.38–1.39) | 0.48 (0.23–0.99) | 0.30 (0.12–0.74) | 0.02 |
| Model 2 | 1.00 | 0.367 (0.17–0.80) | 0.67 (0.35–1.29) | 0.39 (0.19–0.81) | 0.31 (0.12–0.77) | 0.006 |
| Unhealthy plant-based dietary index | ||||||
| Model 1 | 1.00 | 1.30 (0.52–3.21) | 1.92 (0.84–4.42) | 1.88 (0.81–4.37) | 1.74 (0.74–4.11) | 0.13 |
| Model 2 | 1.00 | 1.33 (0.54–3.28) | 1.95 (0.85–4.49) | 1.87 (0.81–4.33) | 1.94 (0.81–4.66) | 0.09 |
Publisher’s Note: MDPI stays neutral with regard to jurisdictional claims in published maps and institutional affiliations. |
© 2021 by the authors. Licensee MDPI, Basel, Switzerland. This article is an open access article distributed under the terms and conditions of the Creative Commons Attribution (CC BY) license (https://creativecommons.org/licenses/by/4.0/).
Share and Cite
Wang, Y.B.; Shivappa, N.; Hébert, J.R.; Page, A.J.; Gill, T.K.; Melaku, Y.A. Association between Dietary Inflammatory Index, Dietary Patterns, Plant-Based Dietary Index and the Risk of Obesity. Nutrients 2021, 13, 1536. https://doi.org/10.3390/nu13051536
Wang YB, Shivappa N, Hébert JR, Page AJ, Gill TK, Melaku YA. Association between Dietary Inflammatory Index, Dietary Patterns, Plant-Based Dietary Index and the Risk of Obesity. Nutrients. 2021; 13(5):1536. https://doi.org/10.3390/nu13051536
Chicago/Turabian StyleWang, Yoko B., Nitin Shivappa, James R. Hébert, Amanda J. Page, Tiffany K. Gill, and Yohannes Adama Melaku. 2021. "Association between Dietary Inflammatory Index, Dietary Patterns, Plant-Based Dietary Index and the Risk of Obesity" Nutrients 13, no. 5: 1536. https://doi.org/10.3390/nu13051536
APA StyleWang, Y. B., Shivappa, N., Hébert, J. R., Page, A. J., Gill, T. K., & Melaku, Y. A. (2021). Association between Dietary Inflammatory Index, Dietary Patterns, Plant-Based Dietary Index and the Risk of Obesity. Nutrients, 13(5), 1536. https://doi.org/10.3390/nu13051536