
Postnatal Iron Supplementation with Ferrous Sulfate vs. Ferrous Bis-Glycinate Chelate: Effects on Iron Metabolism, Growth, and Central Nervous System Development in Sprague Dawley Rat Pups


Abstract
1. Introduction
2. Materials and Methods
2.1. Animals
2.2. Blood Measurements
2.3. Tissue Iron, Zinc, Copper, and Manganese
2.4. Histology
2.5. Real-Time PCR
2.6. Western Blotting
2.7. Protein Carbonyl Content
2.8. Statistical Analysis
3. Results
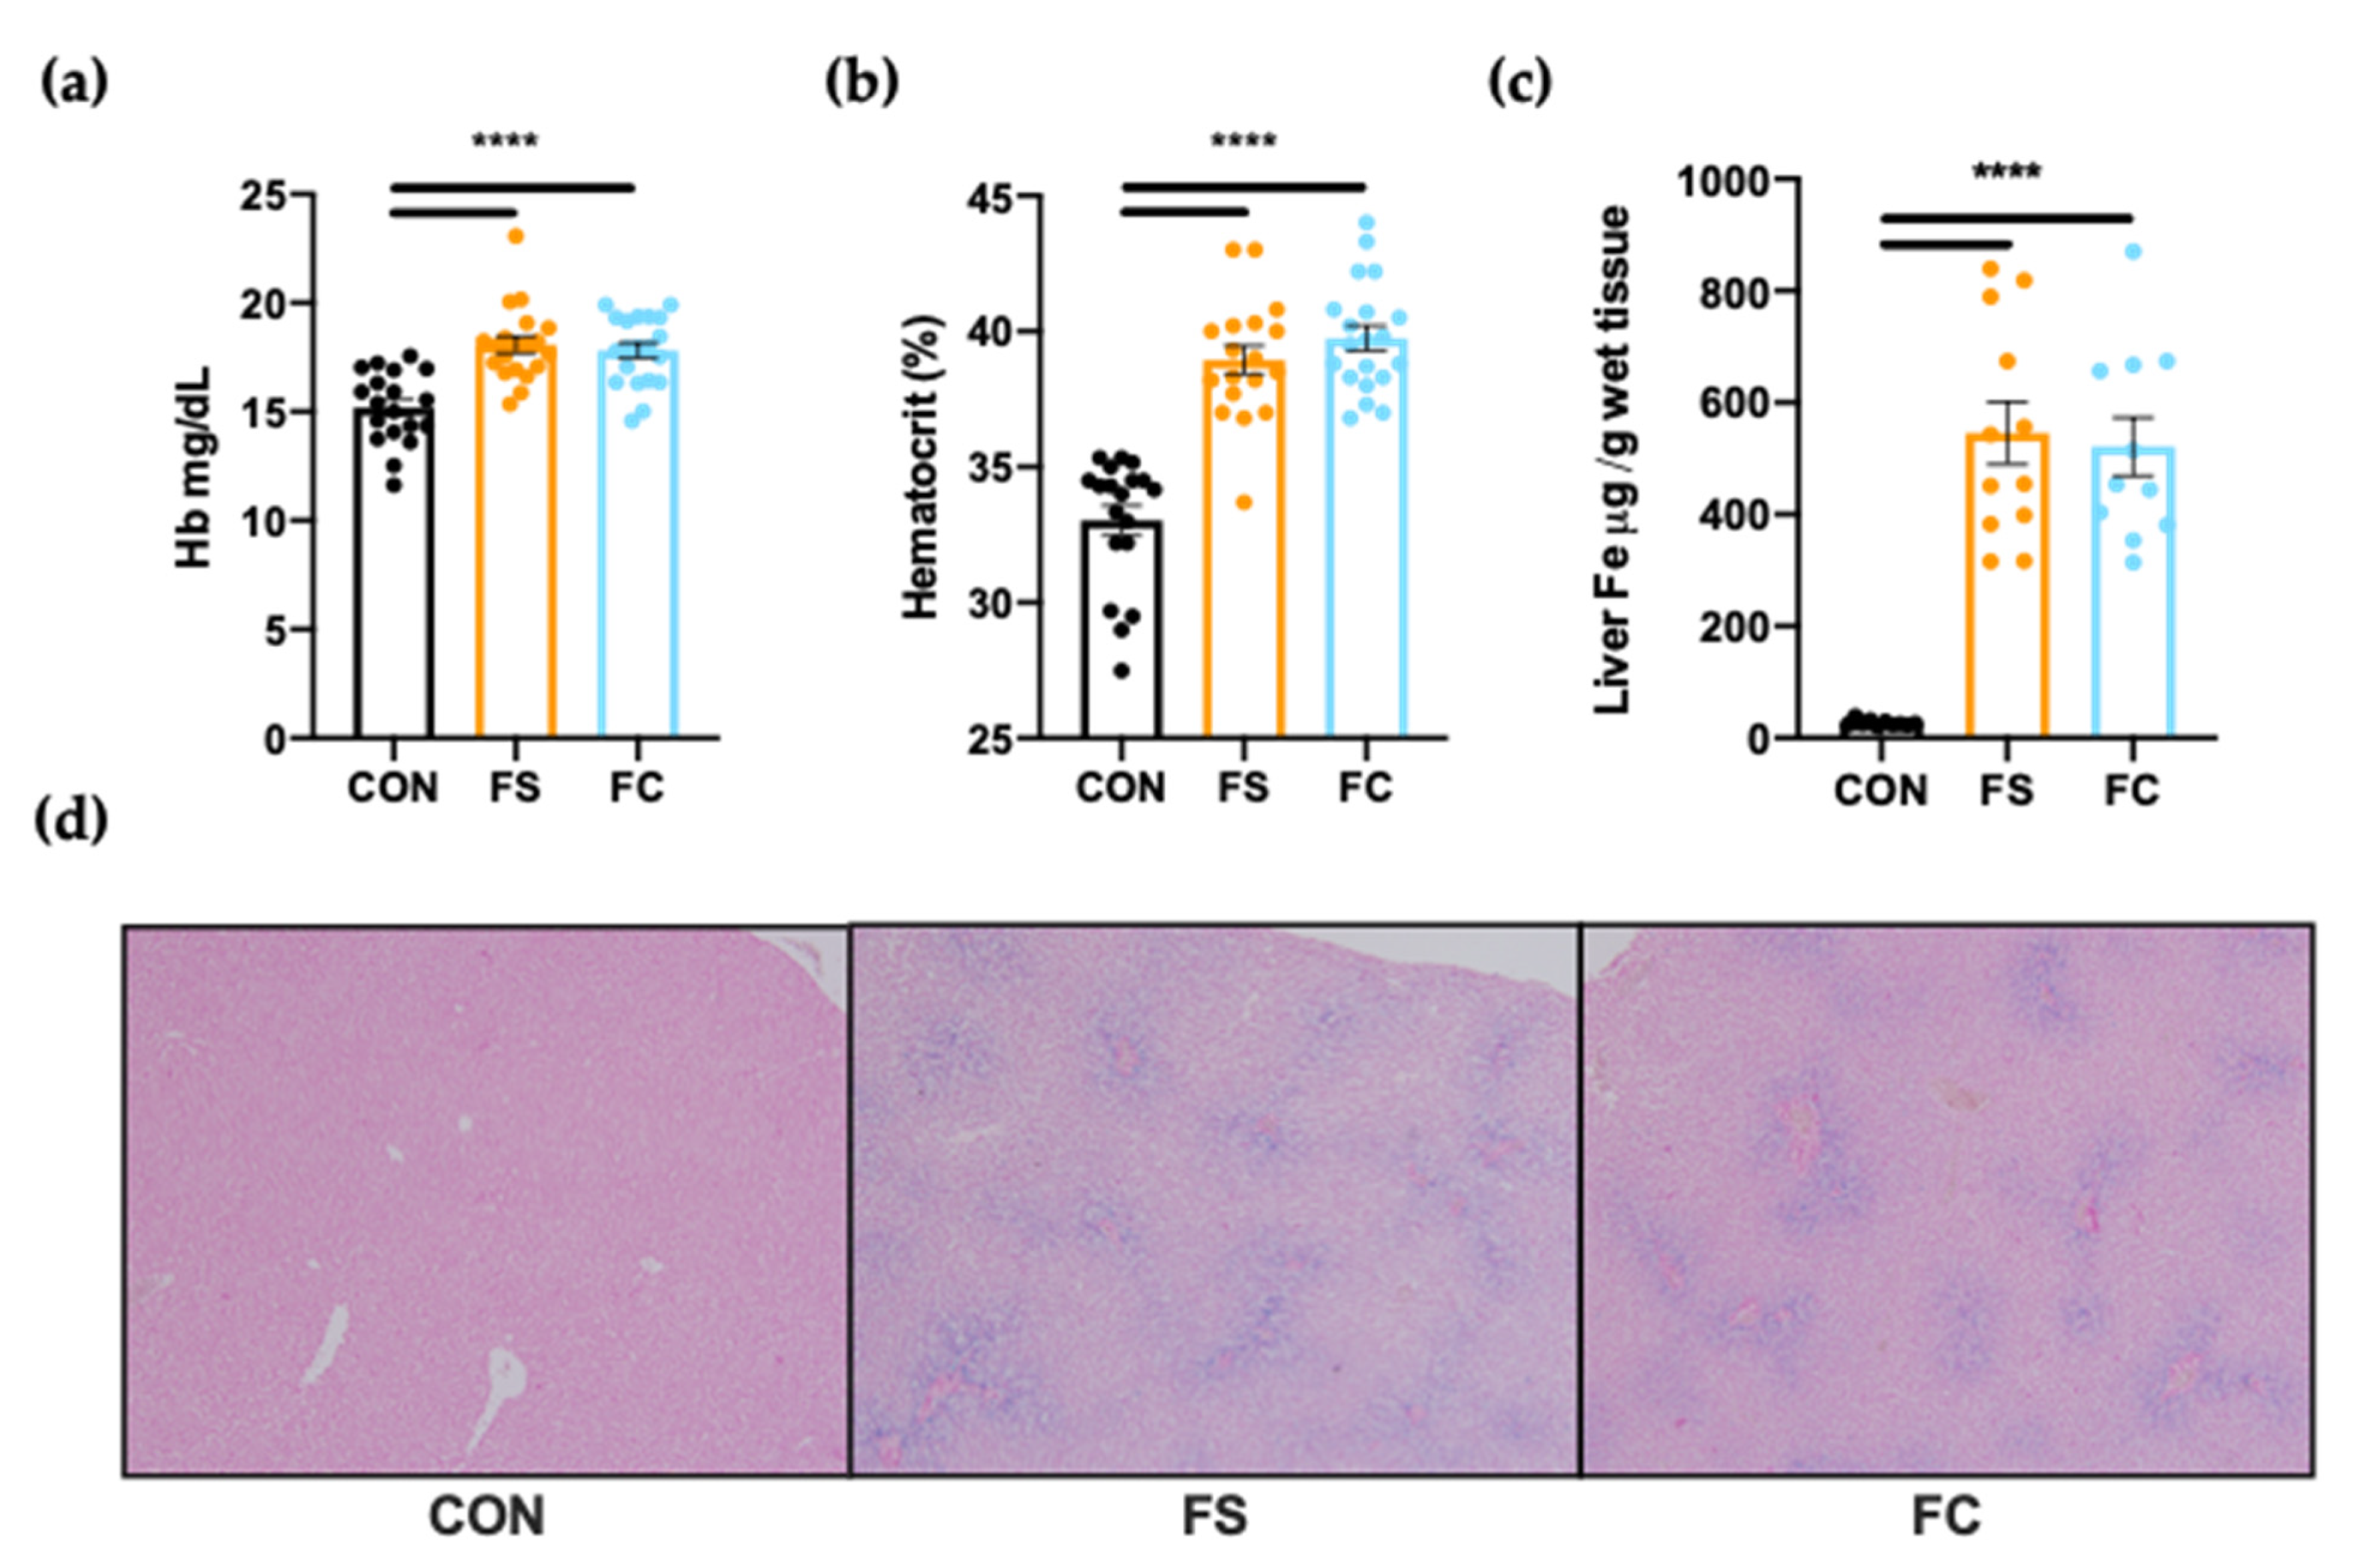
3.1. Iron Status
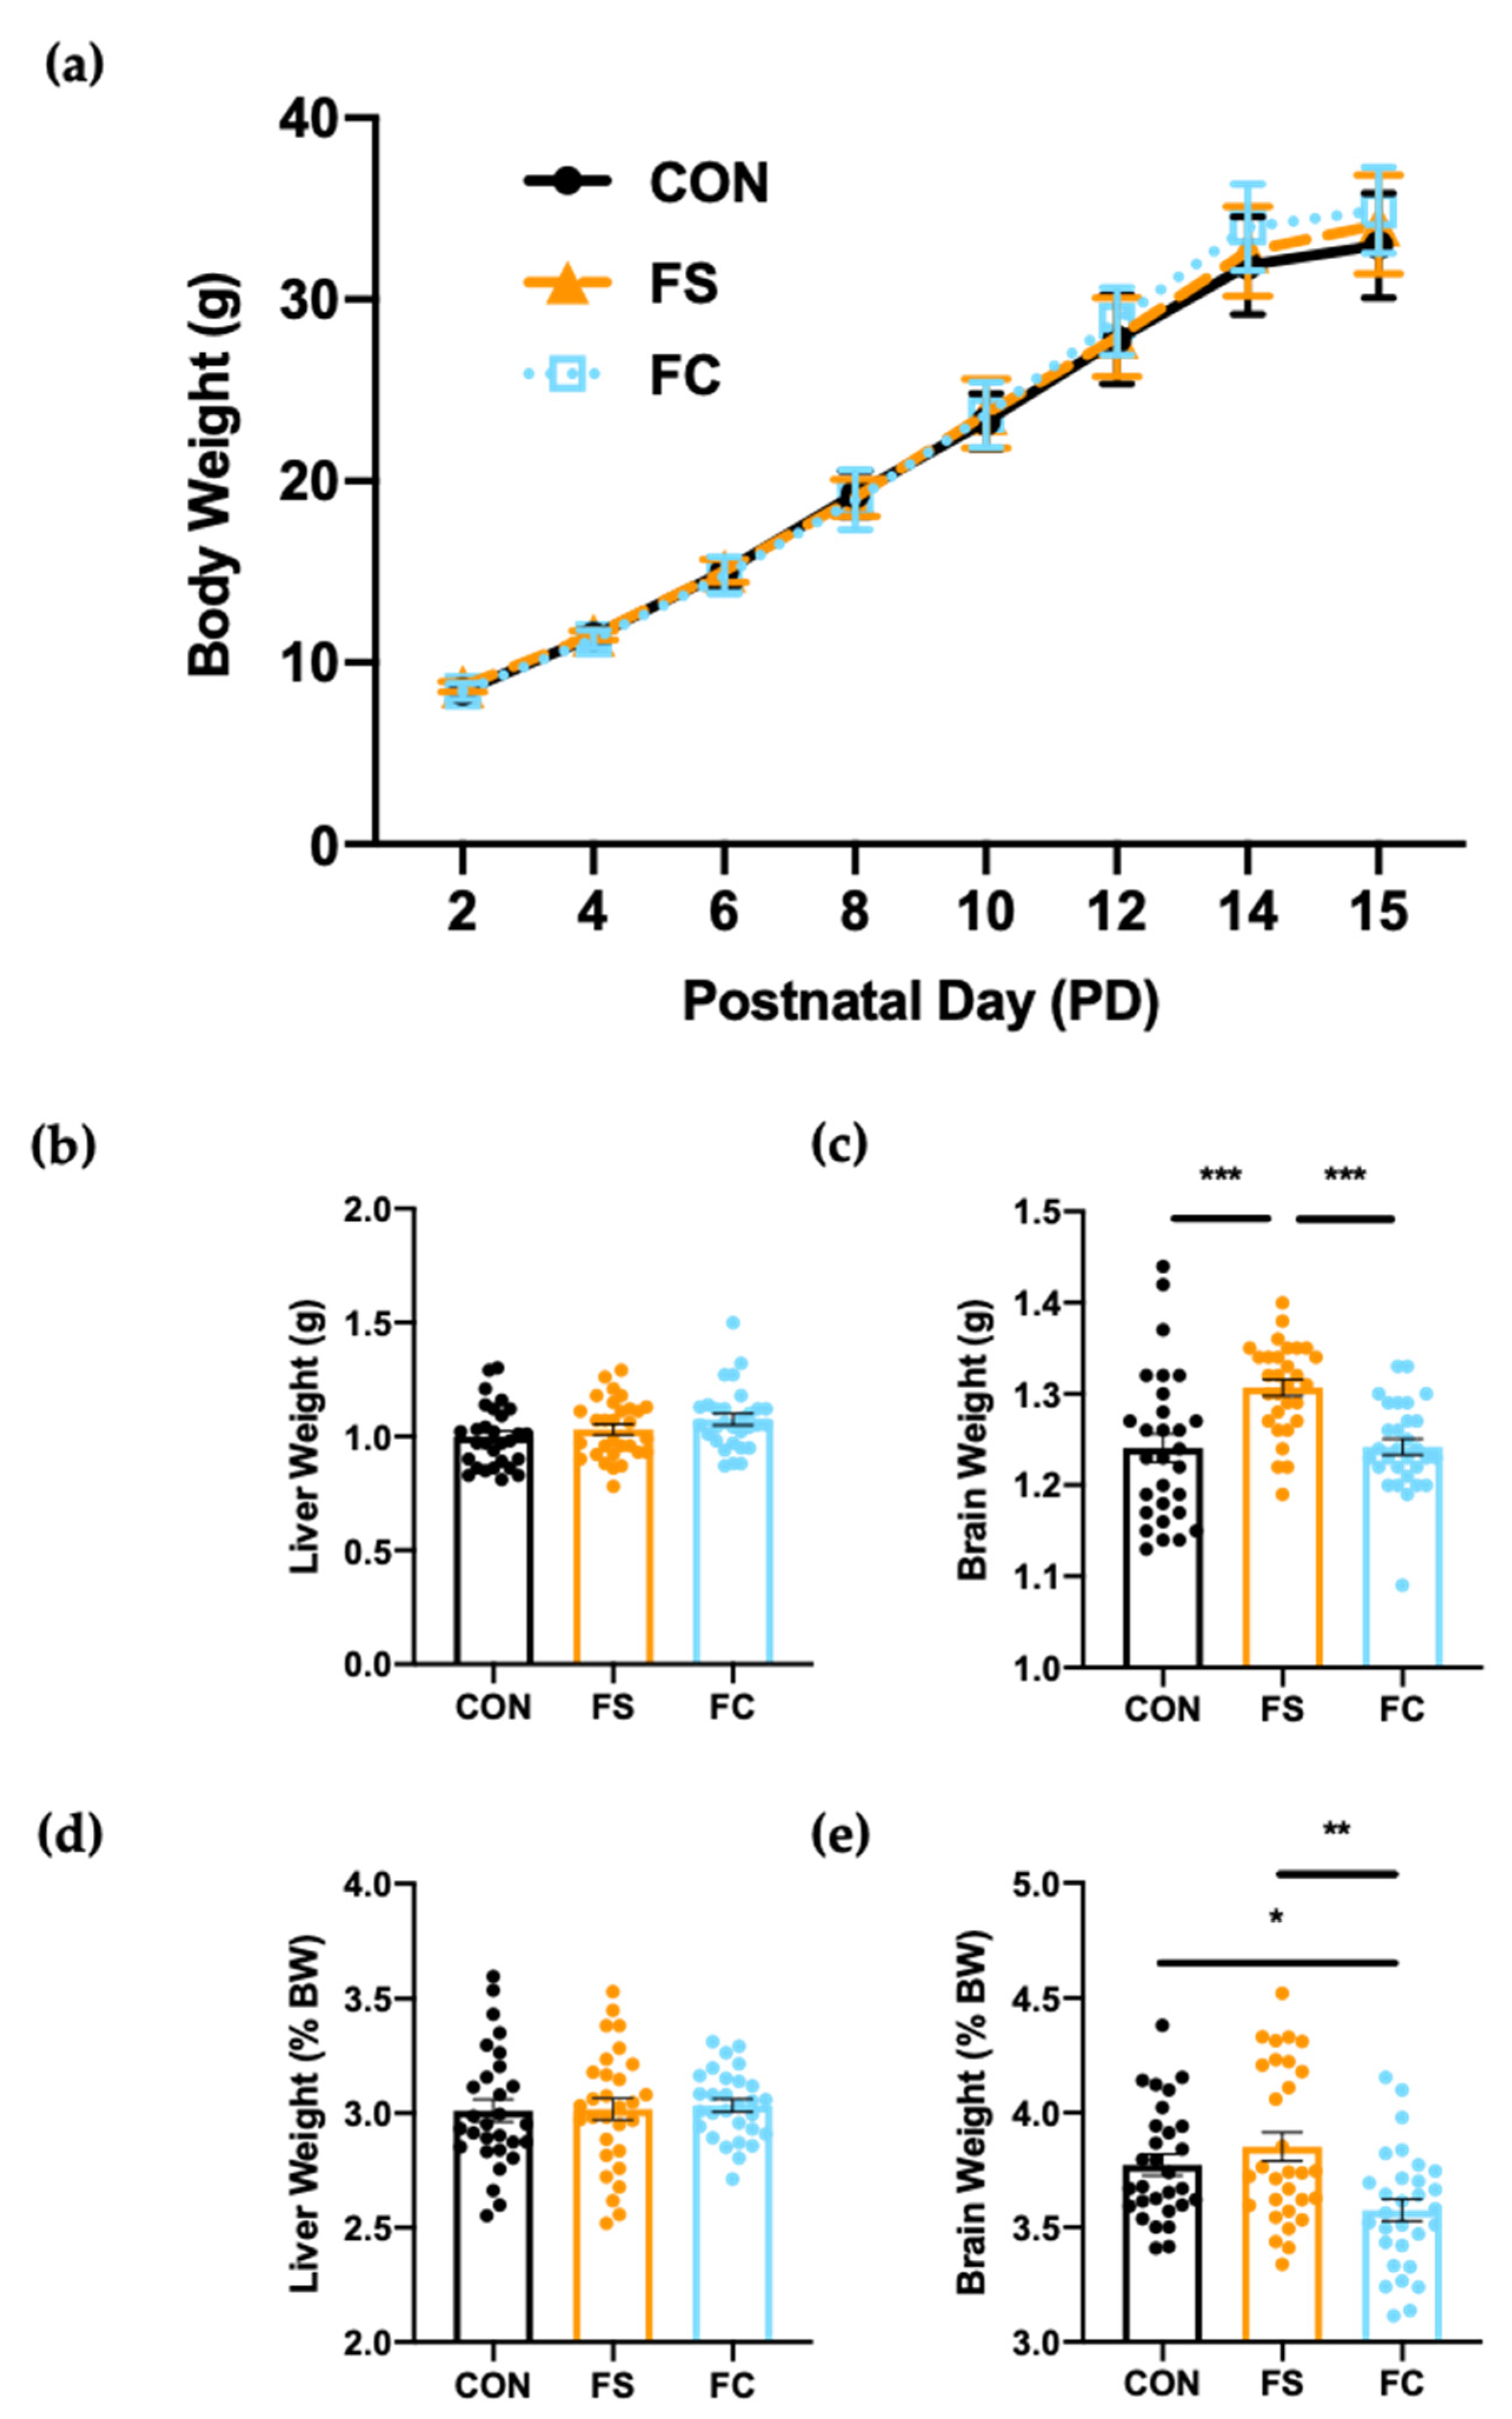
3.2. Growth and Development
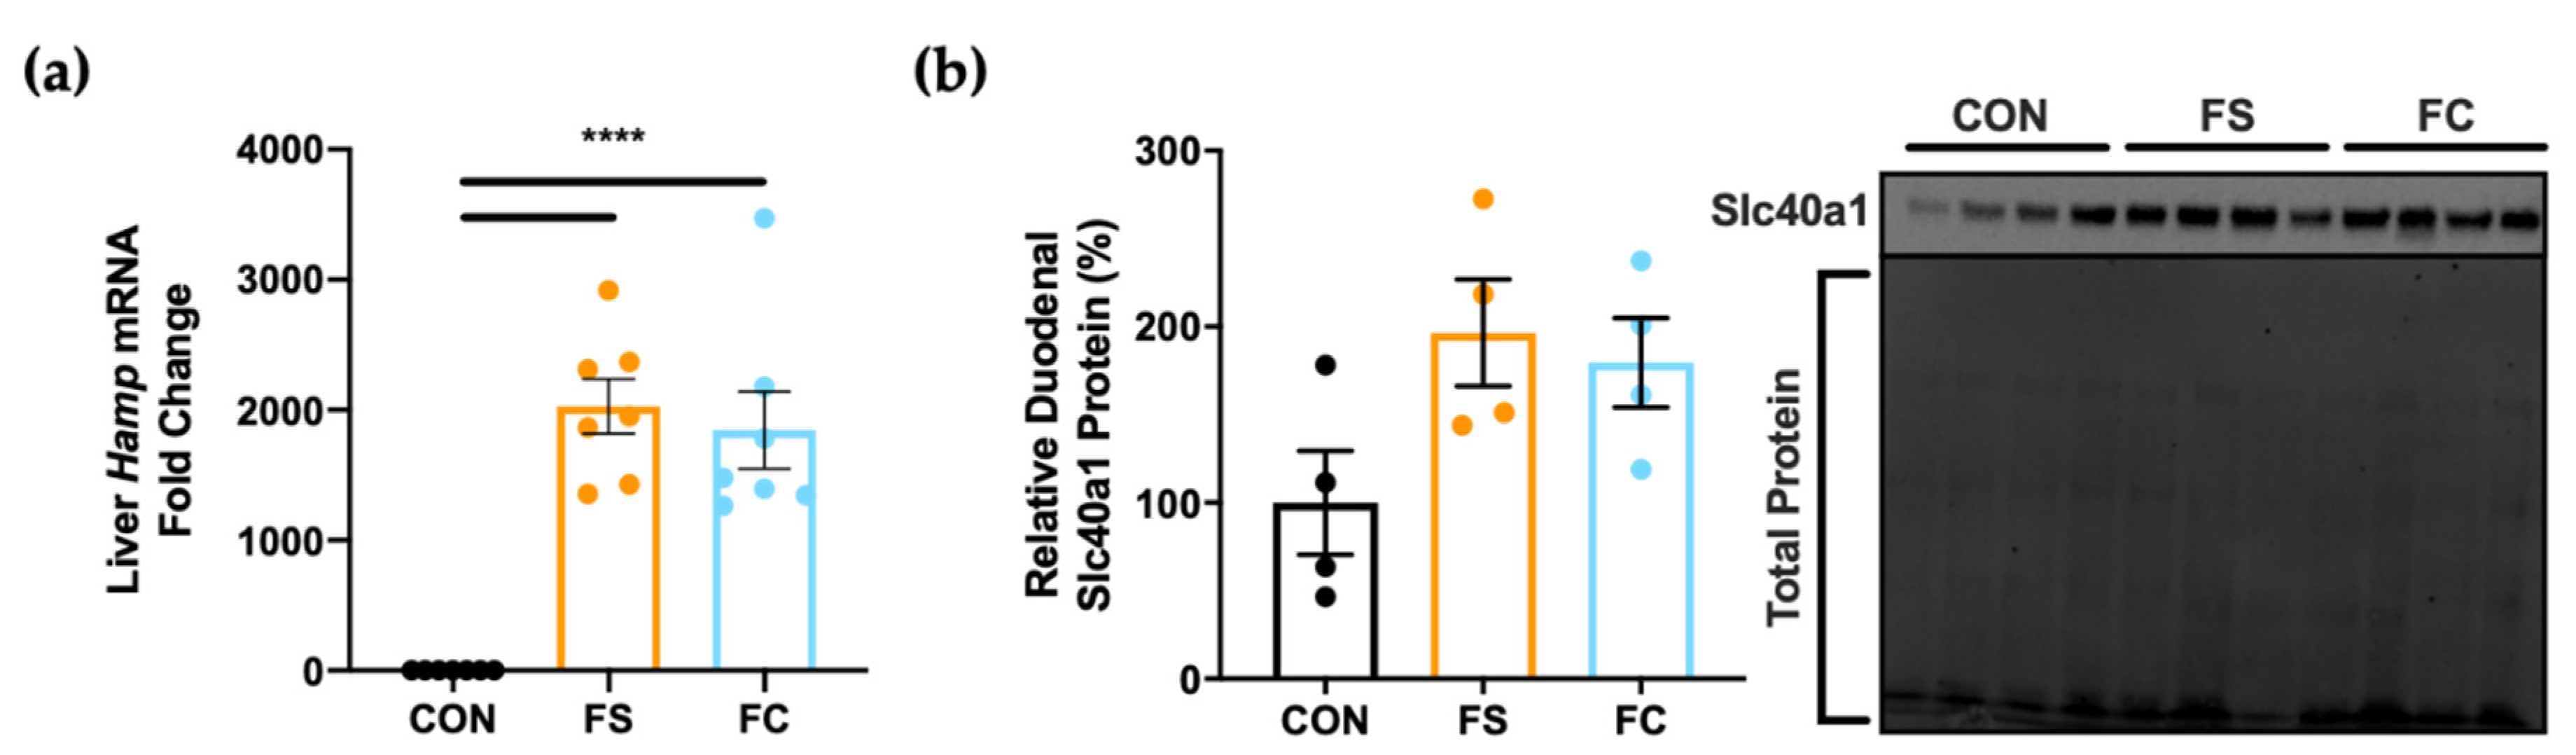
3.3. Systemic Iron Homeostasis
3.4. Iron and Trace Minerals in the Central Nervous System
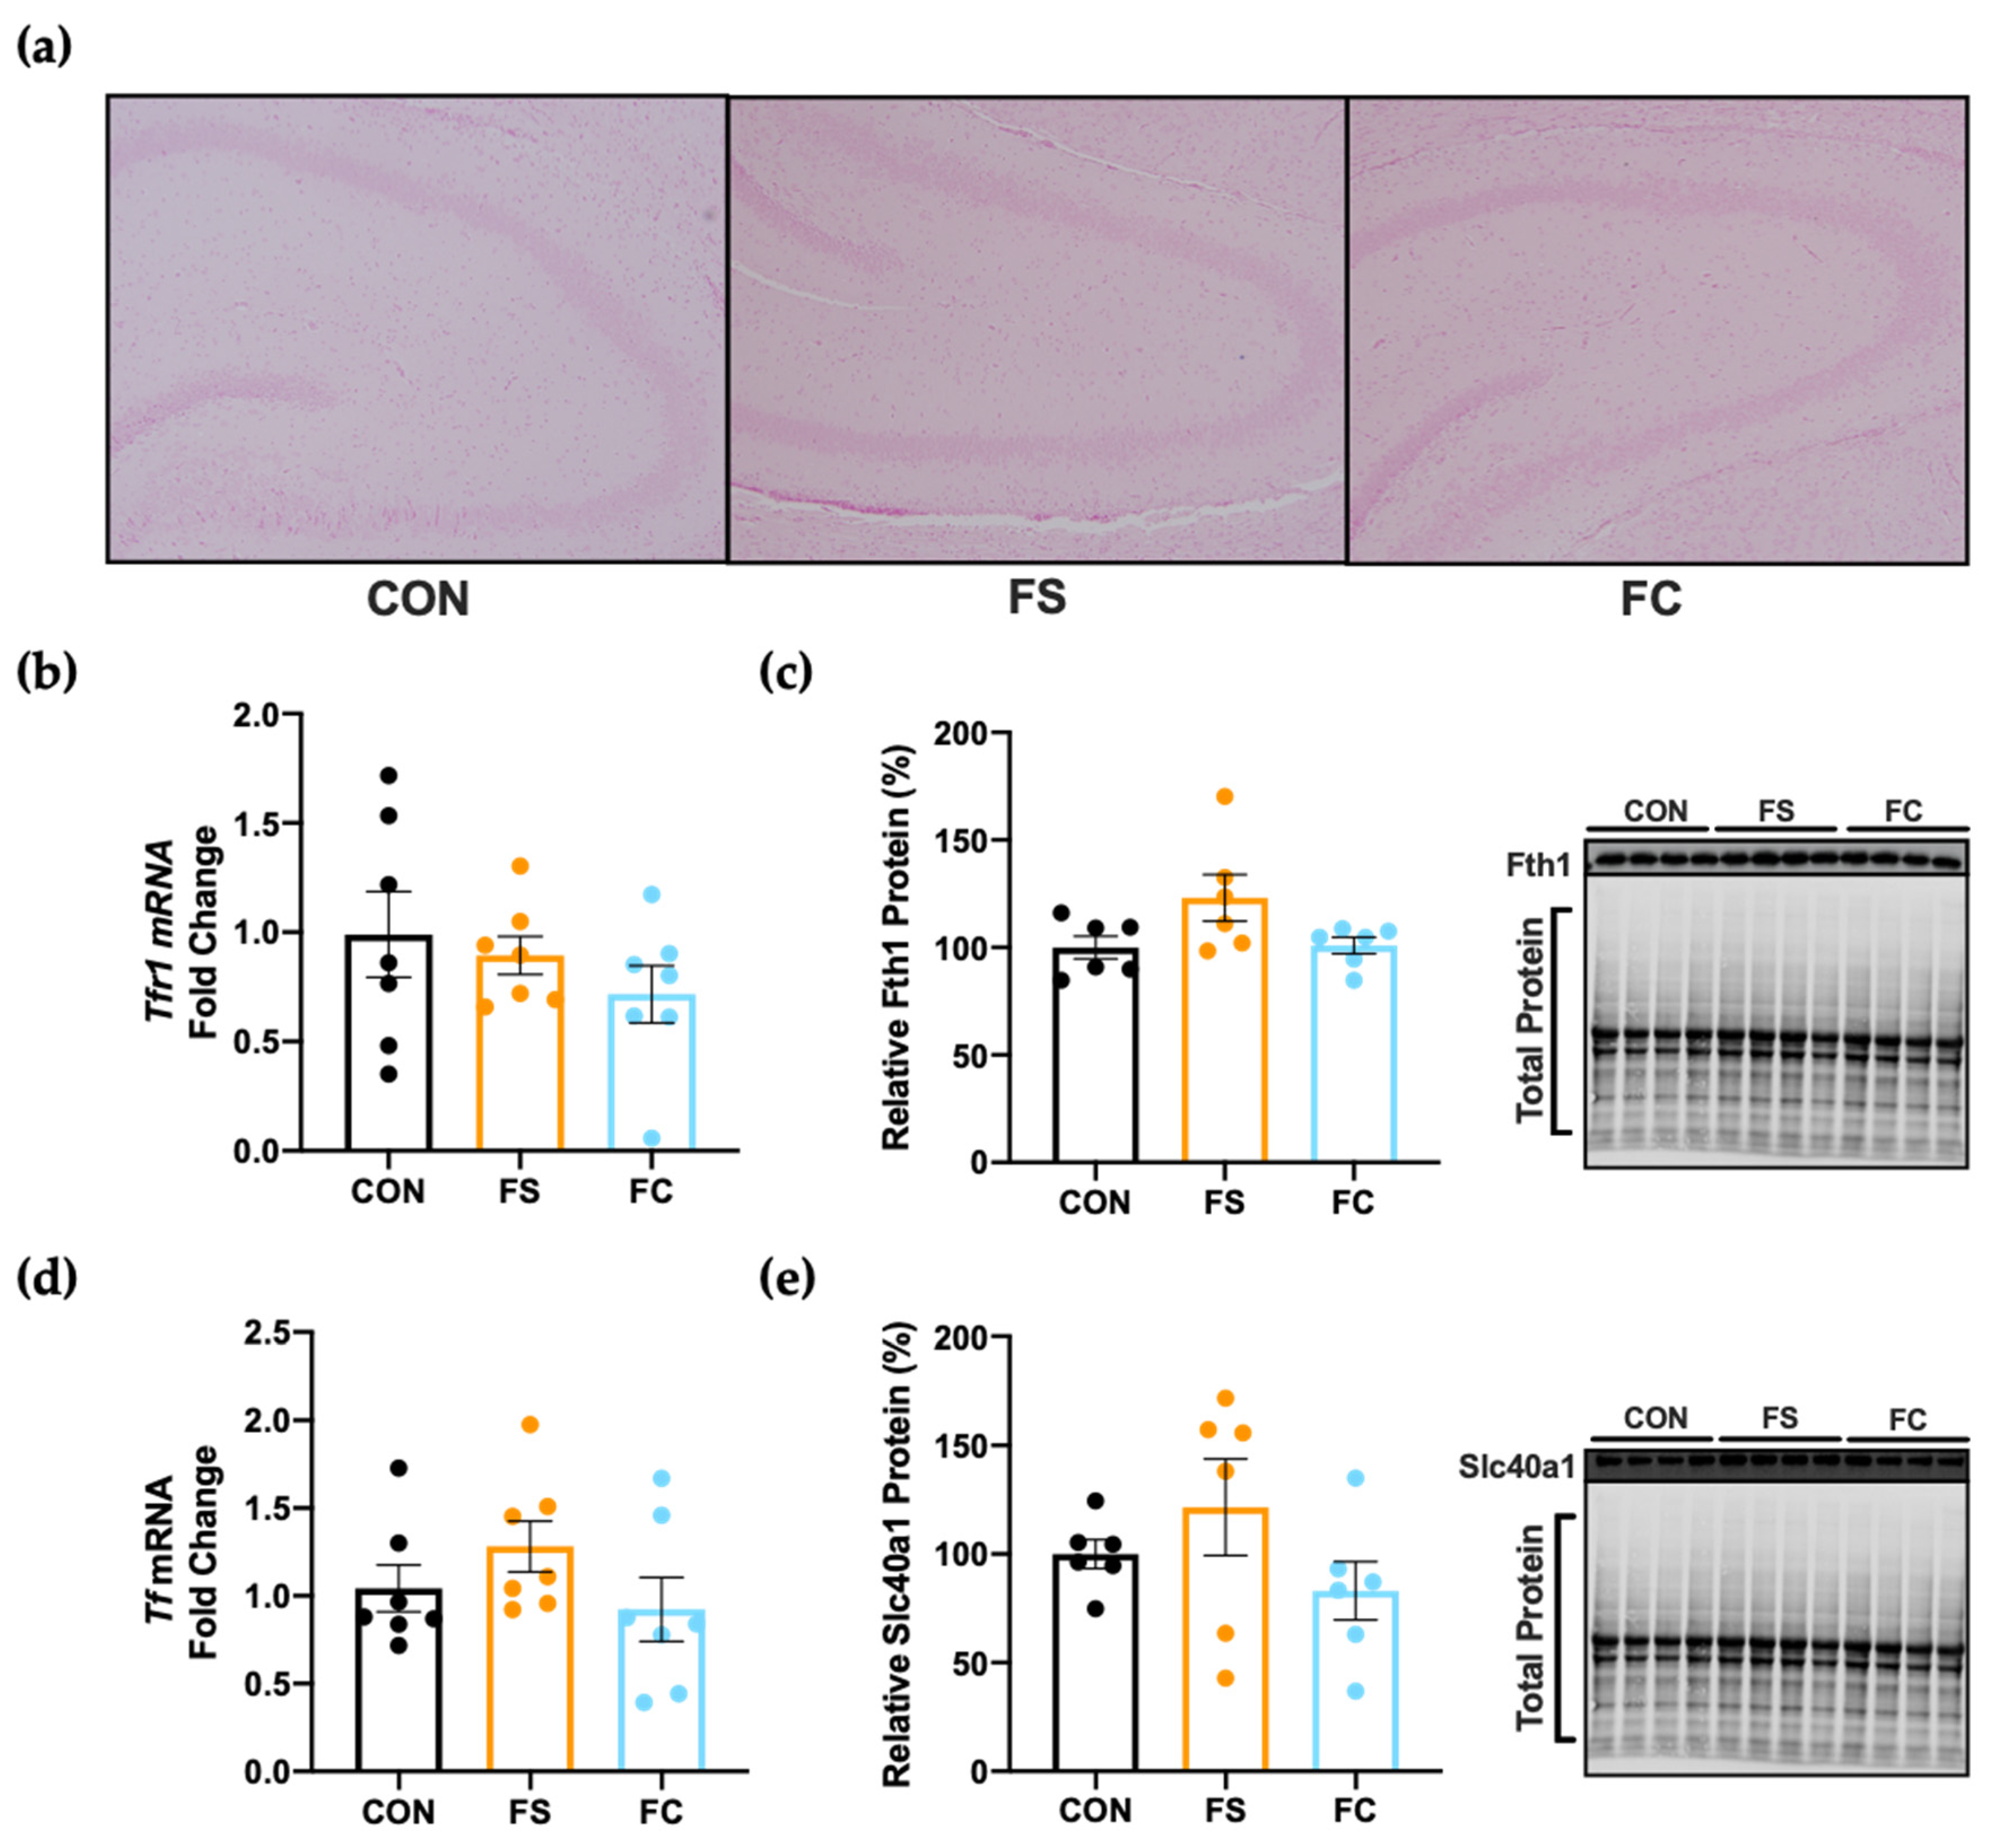
3.5. Iron Regulation in the Hippocampus
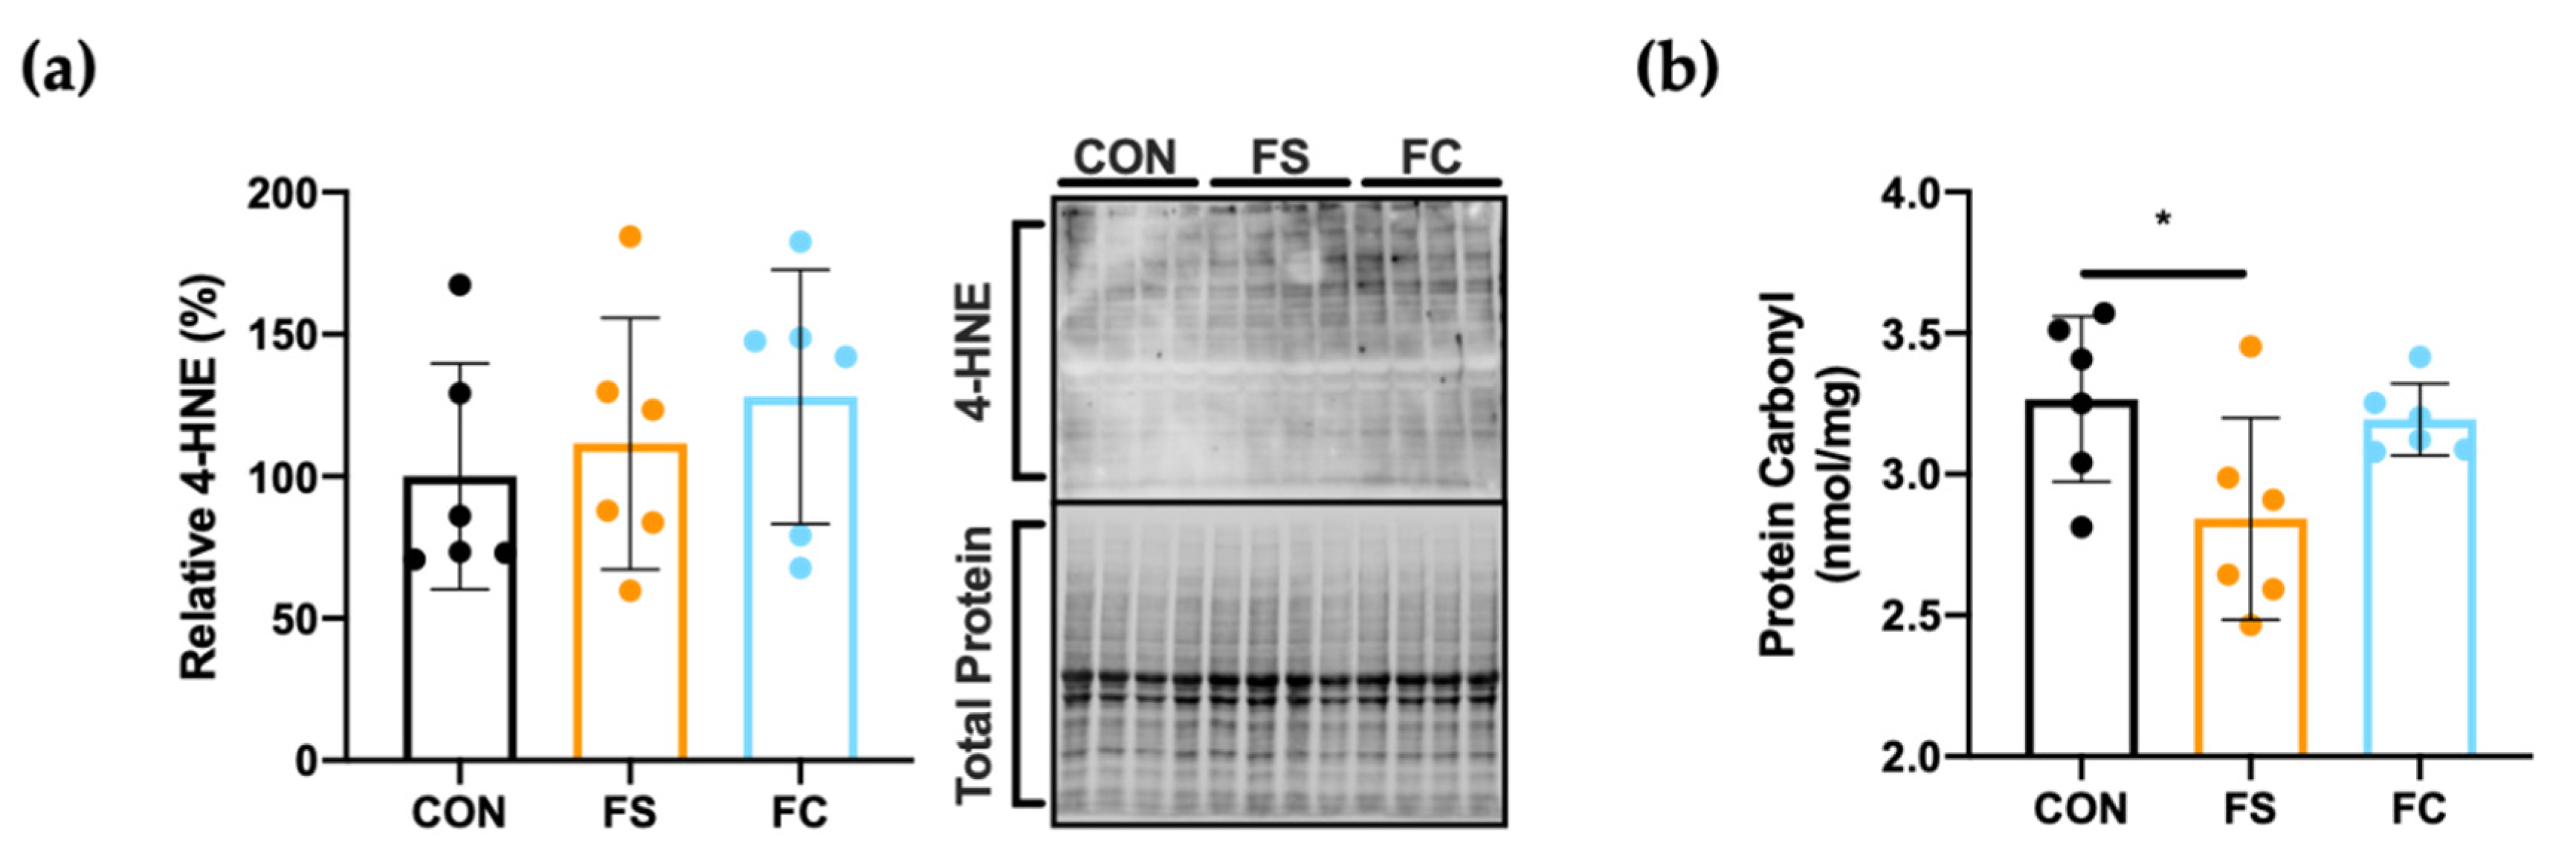
3.6. Oxidative Stress in the Hippocampus
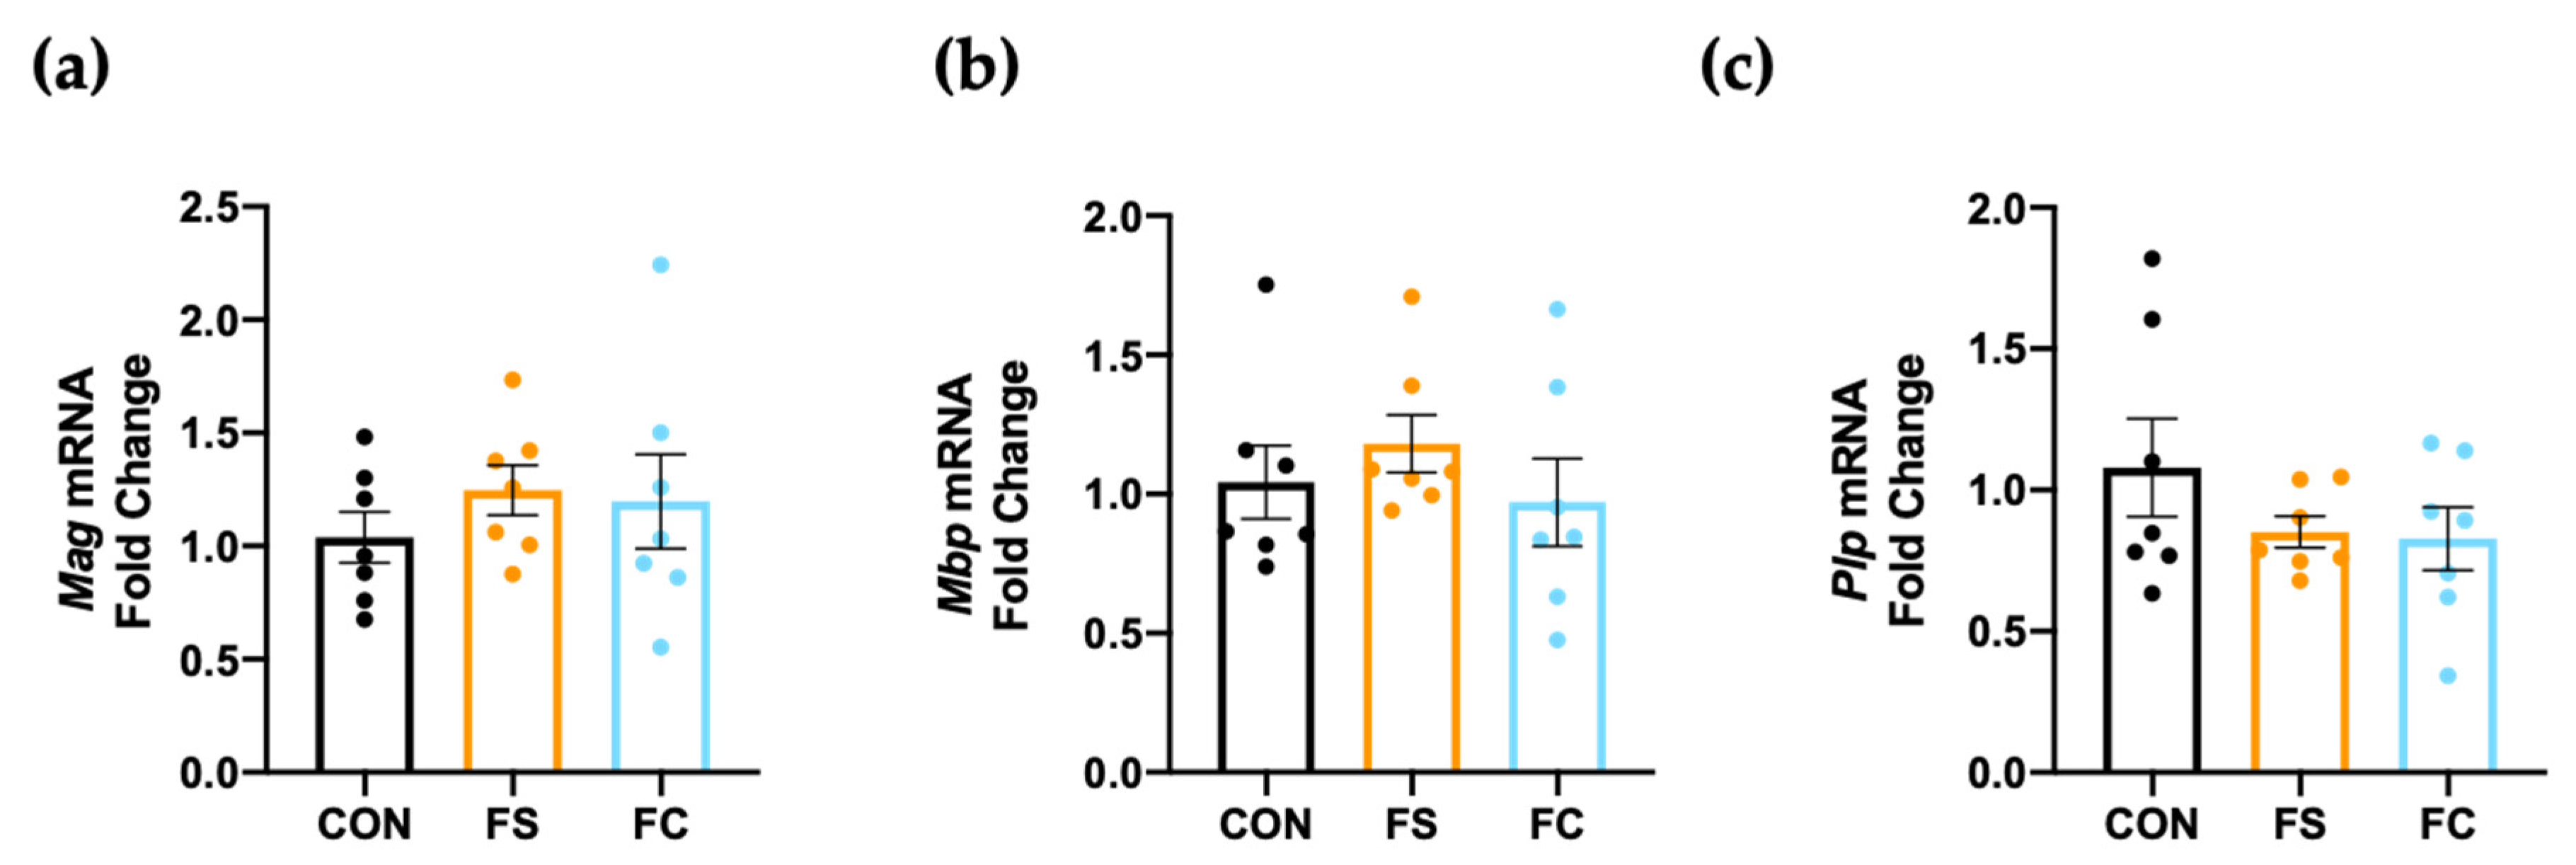
3.7. Myelination in the Hippocampus
4. Discussion
Author Contributions
Funding
Institutional Review Board Statement
Data Availability Statement
Acknowledgments
Conflicts of Interest
References
- Black, R.E.; Heidkamp, R. Causes of Stunting and Preventive Dietary Interventions in Pregnancy and Early Childhood. In Nestlé Nutrition Institute Workshop Series; Colombo, J., Koletzko, B., Lampl, M., Eds.; S. Karger AG: Basel, Switzerland, 2018; Volume 89, pp. 105–113. ISBN 978-3-318-06351-6. [Google Scholar] [CrossRef]
- McCann, J.C.; Ames, B.N. An Overview of Evidence for a Causal Relation between Iron Deficiency during Development and Deficits in Cognitive or Behavioral Function. Am. J. Clin. Nutr. 2007, 85, 931–945. [Google Scholar] [CrossRef]
- Baker, R.D.; Greer, F.R. The Committee on Nutrition Diagnosis and Prevention of Iron Deficiency and Iron-Deficiency Anemia in Infants and Young Children (0–3 Years of Age). Pediatrics 2010, 126, 1040–1050. [Google Scholar] [CrossRef]
- Guideline: Daily Iron Supplementation in Infants and Children; WHO Guidelines Approved by the Guidelines Review Committee; World Health Organization: Geneva, Switzerland, 2016; ISBN 978-92-4-154952-3.
- Pasricha, S.-R.; Drakesmith, H.; Black, J.; Hipgrave, D.; Biggs, B.-A. Control of Iron Deficiency Anemia in Low- and Middle-Income Countries. Blood 2013, 121, 2607–2617. [Google Scholar] [CrossRef]
- Shelov, S.P.; American Academy of Pediatrics. Caring for Your Baby and Young Child: Birth to Age Five; Bantam: New York, NY, USA, 2009; ISBN 978-0-553-38630-1. [Google Scholar]
- Lönnerdal, B.O.; Keen, C.L.; Ohtake, M.; Tamura, T. Iron, Zinc, Copper, and Manganese in Infant Formulas. Am. J. Dis. Children 1983, 137, 433–437. [Google Scholar] [CrossRef]
- Lönnerdal, B. Development of Iron Homeostasis in Infants and Young Children. Am. J. Clin. Nutr. 2017, 106, 1575S–1580S. [Google Scholar] [CrossRef]
- Dewey, K.G.; Domellöf, M.; Cohen, R.J.; Landa Rivera, L.; Hernell, O.; Lönnerdal, B. Iron Supplementation Affects Growth and Morbidity of Breast-Fed Infants: Results of a Randomized Trial in Sweden and Honduras. J. Nutr. 2002, 132, 3249–3255. [Google Scholar] [CrossRef] [PubMed]
- Lozoff, B. Iron-Fortified vs Low-Iron Infant Formula: Developmental Outcome at 10 Years. Arch. Pediatr. Adolesc. Med. 2012, 166, 208. [Google Scholar] [CrossRef] [PubMed]
- Gahagan, S.; Delker, E.; Blanco, E.; Burrows, R.; Lozoff, B. Randomized Controlled Trial of Iron-Fortified versus Low-Iron Infant Formula: Developmental Outcomes at 16 Years. J. Pediatr. 2019, 212, 124–130.e1. [Google Scholar] [CrossRef] [PubMed]
- Lind, T.; Seswandhana, R.; Persson, L.-Å.; Lönnerdal, B. Iron Supplementation of Iron-Replete Indonesian Infants Is Associated with Reduced Weight-for-Age. Acta Paediatr. Oslo Nor. 1992 2008, 97, 770–775. [Google Scholar] [CrossRef] [PubMed]
- Idjradinata, P.; Watkins, W.E.; Pollitt, E. Adverse Effect of Iron Supplementation on Weight Gain of Iron-Replete Young Children. Lancet Lond. Engl. 1994, 343, 1252–1254. [Google Scholar] [CrossRef]
- Majumdar, I.; Paul, P.; Talib, V.H.; Ranga, S. The Effect of Iron Therapy on the Growth of Iron-Replete and Iron-Deplete Children. J. Trop. Pediatr. 2003, 49, 84–88. [Google Scholar] [CrossRef]
- Lonnerdal, B. Excess Iron Intake as a Factor in Growth, Infections, and Development of Infants and Young Children. Am. J. Clin. Nutr. 2017, 106, 1681S–1687S. [Google Scholar] [CrossRef]
- Hare, D.J.; Arora, M.; Jenkins, N.L.; Finkelstein, D.I.; Doble, P.A.; Bush, A.I. Is Early-Life Iron Exposure Critical in Neurodegeneration? Nat. Rev. Neurol. 2015, 11, 536–544. [Google Scholar] [CrossRef]
- Hare, D.J.; Cardoso, B.R.; Szymlek-Gay, E.A.; Biggs, B.-A. Neurological Effects of Iron Supplementation in Infancy: Finding the Balance between Health and Harm in Iron-Replete Infants. Lancet Child Adolesc. Health 2018, 2, 144–156. [Google Scholar] [CrossRef]
- Hare, D.J.; Braat, S.; Cardoso, B.R.; Morgan, C.; Szymlek-Gay, E.A.; Biggs, B.-A. Health Outcomes of Iron Supplementation and/or Food Fortification in Iron-Replete Children Aged 4–24 Months: Protocol for a Systematic Review and Meta-Analysis. Syst. Rev. 2019, 8, 253. [Google Scholar] [CrossRef]
- Agrawal, S.; Berggren, K.L.; Marks, E.; Fox, J.H. Impact of High Iron Intake on Cognition and Neurodegeneration in Humans and in Animal Models: A Systematic Review. Nutr. Rev. 2017, 75, 456–470. [Google Scholar] [CrossRef] [PubMed]
- Wessling-Resnick, M. Excess Iron: Considerations Related to Development and Early Growth. Am. J. Clin. Nutr. 2017, 106, 1600S–1605S. [Google Scholar] [CrossRef] [PubMed]
- Georgieff, M.K.; Krebs, N.F.; Cusick, S.E. The Benefits and Risks of Iron Supplementation in Pregnancy and Childhood. Annu. Rev. Nutr. 2019, 39, 121–146. [Google Scholar] [CrossRef]
- Dietary Guidelines Advisory Committee. Scientific Report of the 2020 Dietary Guidelines Advisory Committee: Advisory Report to the Secretary of Agriculture and the Secretary of Health and Human Services; U.S. Department of Agriculture, Agricultural Research Service: Washington, DC, USA, 2020; p. 786.
- Alexeev, E.E.; He, X.; Slupsky, C.M.; Lönnerdal, B. Effects of Iron Supplementation on Growth, Gut Microbiota, Metabolomics and Cognitive Development of Rat Pups. PLoS ONE 2017, 12, e0179713. [Google Scholar] [CrossRef] [PubMed]
- Fredriksson, A.; Schröder, N.; Eriksson, P.; Izquierdo, I.; Archer, T. Neonatal Iron Exposure Induces Neurobehavioural Dysfunctions in Adult Mice. Toxicol. Appl. Pharmacol. 1999, 159, 25–30. [Google Scholar] [CrossRef] [PubMed]
- Ji, P.; Lönnerdal, B.; Kim, K.; Jinno, C.N. Iron Oversupplementation Causes Hippocampal Iron Overloading and Impairs Social Novelty Recognition in Nursing Piglets. J. Nutr. 2019, 149, 398–405. [Google Scholar] [CrossRef]
- Fredriksson, A.; Schröder, N.; Eriksson, P.; Izquierdo, I.; Archer, T. Neonatal Iron Potentiates Adult MPTP-Induced Neurodegenerative and Functional Deficits. Parkinsonism Relat. Disord. 2001, 7, 97–105. [Google Scholar] [CrossRef]
- Domellöf, M.; Lönnerdal, B.; Abrams, S.A.; Hernell, O. Iron Absorption in Breast-Fed Infants: Effects of Age, Iron Status, Iron Supplements, and Complementary Foods. Am. J. Clin. Nutr. 2002, 76, 198–204. [Google Scholar] [CrossRef]
- Lönnerdal, B.; Georgieff, M.K.; Hernell, O. Developmental Physiology of Iron Absorption, Homeostasis, and Metabolism in the Healthy Term Infant. J. Pediatr. 2015, 167, S8–S14. [Google Scholar] [CrossRef] [PubMed]
- Darshan, D.; Wilkins, S.J.; Frazer, D.M.; Anderson, G.J. Reduced Expression of Ferroportin-1 Mediates Hyporesponsiveness of Suckling Rats to Stimuli That Reduce Iron Absorption. Gastroenterology 2011, 141, 300–309. [Google Scholar] [CrossRef] [PubMed]
- Leong, W.-I.; Bowlus, C.L.; Tallkvist, J.; Lönnerdal, B. Iron Supplementation during Infancy—Effects on Expression of Iron Transporters, Iron Absorption, and Iron Utilization in Rat Pups. Am. J. Clin. Nutr. 2003, 78, 1203–1211. [Google Scholar] [CrossRef] [PubMed]
- Frazer, D.M.; Wilkins, S.J.; Darshan, D.; Mirciov, C.S.G.; Dunn, L.A.; Anderson, G.J. Ferroportin Is Essential for Iron Absorption During Suckling, But Is Hyporesponsive to the Regulatory Hormone Hepcidin. Cell. Mol. Gastroenterol. Hepatol. 2017, 3, 410–421. [Google Scholar] [CrossRef]
- Li, J.; Cao, F.; Yin, H.; Huang, Z.; Lin, Z.; Mao, N.; Sun, B.; Wang, G. Ferroptosis: Past, Present and Future. Cell Death Dis. 2020, 11, 88. [Google Scholar] [CrossRef]
- Carocci, A.; Catalano, A.; Sinicropi, M.S.; Genchi, G. Oxidative Stress and Neurodegeneration: The Involvement of Iron. Biometals Int. J. Role Met. Ions Biol. Biochem. Med. 2018, 31, 715–735. [Google Scholar] [CrossRef] [PubMed]
- Nuñez, M.T.; Chana-Cuevas, P. New Perspectives in Iron Chelation Therapy for the Treatment of Neurodegenerative Diseases. Pharmaceuticals 2018, 11, 109. [Google Scholar] [CrossRef] [PubMed]
- Dornelles, A.S.; Garcia, V.A.; de Lima, M.N.M.; Vedana, G.; Alcalde, L.A.; Bogo, M.R.; Schröder, N. MRNA Expression of Proteins Involved in Iron Homeostasis in Brain Regions Is Altered by Age and by Iron Overloading in the Neonatal Period. Neurochem. Res. 2010, 35, 564–571. [Google Scholar] [CrossRef] [PubMed]
- Fernandez, L.L.; de Lima, M.N.M.; Scalco, F.; Vedana, G.; Miwa, C.; Hilbig, A.; Vianna, M.; Schröder, N. Early Post-Natal Iron Administration Induces Astroglial Response in the Brain of Adult and Aged Rats. Neurotox. Res. 2011, 20, 193–199. [Google Scholar] [CrossRef] [PubMed]
- Fernandez, L.L.; Carmona, M.; Portero-Otin, M.; Naudi, A.; Pamplona, R.; Schröder, N.; Ferrer, I. Effects of Increased Iron Intake during the Neonatal Period on the Brain of Adult AbetaPP/PS1 Transgenic Mice. J. Alzheimers Dis. JAD 2010, 19, 1069–1080. [Google Scholar] [CrossRef]
- Ji, P.; Nonnecke, E.B.; Doan, N.; Lönnerdal, B.; Tan, B. Excess Iron Enhances Purine Catabolism Through Activation of Xanthine Oxidase and Impairs Myelination in the Hippocampus of Nursing Piglets. J. Nutr. 2019, 149, 1911–1919. [Google Scholar] [CrossRef]
- Figueiredo, L.S.; de Freitas, B.S.; Garcia, V.A.; Dargél, V.A.; Köbe, L.M.; Kist, L.W.; Bogo, M.R.; Schröder, N. Iron Loading Selectively Increases Hippocampal Levels of Ubiquitinated Proteins and Impairs Hippocampus-Dependent Memory. Mol. Neurobiol. 2016, 53, 6228–6239. [Google Scholar] [CrossRef]
- Hertrampf, E.; Olivares, M. Iron Amino Acid Chelates. Int. J. Vitam. Nutr. Res. 2004, 74, 435–443. [Google Scholar] [CrossRef] [PubMed]
- Pineda, O.; Ashmead, H.D. Effectiveness of Treatment of Iron-Deficiency Anemia in Infants and Young Children with Ferrous Bis-Glycinate Chelate. Nutrition 2001, 17, 381–384. [Google Scholar] [CrossRef]
- Puiman, P.; Stoll, B. Animal Models to Study Neonatal Nutrition in Humans. Curr. Opin. Clin. Nutr. Metab. Care 2008, 11, 601–606. [Google Scholar] [CrossRef]
- Pérez-Cano, F.J.; Franch, À.; Castellote, C.; Castell, M. The Suckling Rat as a Model for Immunonutrition Studies in Early Life. Clin. Dev. Immunol. 2012, 2012, 1–16. [Google Scholar] [CrossRef]
- Domellöf, M.; Lönnerdal, B.; Dewey, K.G.; Cohen, R.J.; Hernell, O. Iron, Zinc, and Copper Concentrations in Breast Milk Are Independent of Maternal Mineral Status. Am. J. Clin. Nutr. 2004, 79, 111–115. [Google Scholar] [CrossRef]
- Fiorotto, M.L.; Burrin, D.G.; Perez, M.; Reeds, P.J. Intake and Use of Milk Nutrients by Rat Pups Suckled in Small, Medium, or Large Litters. Am. J. Physiol.-Regul. Integr. Comp. Physiol. 1991, 260, R1104–R1113. [Google Scholar] [CrossRef] [PubMed]
- Keen, C.L.; Lönnerdal, B.; Clegg, M.; Hurley, L.S. Developmental Changes in Composition of Rat Milk: Trace Elements, Minerals, Protein, Carbohydrate and Fat. J. Nutr. 1981, 111, 226–236. [Google Scholar] [CrossRef] [PubMed]
- Křížova, E.; Imek, V.S.; Abelenda, M.; Puerta, M. Food Intake and Body Weight in Rats with Daily Food-Availability Restrictions. Physiol. Behav. 1996, 60, 791–794. [Google Scholar] [CrossRef]
- National Research Council (US) Subcommittee on Laboratory Animal Nutrition. Nutrient Requirements of the Laboratory Rat. In Nutrient Requirements of Laboratory Animals, 4th ed.; National Academies Press (US): Washington, DC, USA, 1995; p. 32. [Google Scholar]
- Swain, J.H.; Newman, S.M.; Hunt, J.R. Bioavailability of Elemental Iron Powders to Rats Is Less than Bakery-Grade Ferrous Sulfate and Predicted by Iron Solubility and Particle Surface Area. J. Nutr. 2003, 133, 3546–3552. [Google Scholar] [CrossRef]
- Atarashi, M.; Izawa, T.; Mori, M.; Inai, Y.; Kuwamura, M.; Yamate, J. Dietary Iron Overload Abrogates Chemically-Induced Liver Cirrhosis in Rats. Nutrients 2018, 10, 1400. [Google Scholar] [CrossRef]
- Mori, M.; Izawa, T.; Inai, Y.; Fujiwara, S.; Aikawa, R.; Kuwamura, M.; Yamate, J. Dietary Iron Overload Differentially Modulates Chemically-Induced Liver Injury in Rats. Nutrients 2020, 12, 2784. [Google Scholar] [CrossRef]
- Clegg, M.S.; Keen, C.L.; Lönnerdal, B.; Hurley, L.S. Influence of Ashing Techniques on the Analysis of Trace Elements in Animal Tissue: I. Wet Ashing. Biol. Trace Elem. Res. 1981, 3, 107–115. [Google Scholar] [CrossRef]
- Li, Y.; Yu, P.; Chang, S.-Y.; Wu, Q.; Yu, P.; Xie, C.; Wu, W.; Zhao, B.; Gao, G.; Chang, Y.-Z. Hypobaric Hypoxia Regulates Brain Iron Homeostasis in Rats. J. Cell. Biochem. 2017, 118, 1596–1605. [Google Scholar] [CrossRef] [PubMed]
- Yang, W.M.; Jung, K.J.; Lee, M.O.; Lee, Y.S.; Lee, Y.H.; Nakagawa, S.; Niwa, M.; Cho, S.S.; Kim, D.W. Transient Expression of Iron Transport Proteins in the Capillary of the Developing Rat Brain. Cell. Mol. Neurobiol. 2011, 31, 93–99. [Google Scholar] [CrossRef]
- Ghiani, C.A.; Ying, Z.; de Vellis, J.; Gomez-Pinilla, F. Exercise Decreases Myelin-Associated Glycoprotein Expression in the Spinal Cord and Positively Modulates Neuronal Growth. Glia 2007, 55, 966–975. [Google Scholar] [CrossRef]
- Paintlia, M.K.; Paintlia, A.S.; Barbosa, E.; Singh, I.; Singh, A.K. N-Acetylcysteine Prevents Endotoxin-Induced Degeneration of Oligodendrocyte Progenitors and Hypomyelination in Developing Rat Brain. J. Neurosci. Res. 2004, 78, 347–361. [Google Scholar] [CrossRef]
- Ueno, T.; Ito, J.; Hoshikawa, S.; Ohori, Y.; Fujiwara, S.; Yamamoto, S.; Ohtsuka, T.; Kageyama, R.; Akai, M.; Nakamura, K.; et al. The Identification of Transcriptional Targets of Ascl1 in Oligodendrocyte Development. Glia 2012, 60, 1495–1505. [Google Scholar] [CrossRef]
- Dittmer, A.; Dittmer, J. β-Actin Is Not a Reliable Loading Control in Western Blot Analysis. Electrophoresis 2006, 27, 2844–2845. [Google Scholar] [CrossRef] [PubMed]
- Gilda, J.E.; Gomes, A.V. Stain-Free Total Protein Staining Is a Superior Loading Control to β-Actin for Western Blots. Anal. Biochem. 2013, 440, 186–188. [Google Scholar] [CrossRef]
- Colella, A.D.; Chegenii, N.; Tea, M.N.; Gibbins, I.L.; Williams, K.A.; Chataway, T.K. Comparison of Stain-Free Gels with Traditional Immunoblot Loading Control Methodology. Anal. Biochem. 2012, 430, 108–110. [Google Scholar] [CrossRef] [PubMed]
- Bailey, S.A.; Zidell, R.H.; Perry, R.W. Relationships Between Organ Weight and Body/Brain Weight in the Rat: What Is the Best Analytical Endpoint? Toxicol. Pathol. 2004, 32, 448–466. [Google Scholar] [CrossRef] [PubMed]
- Nemeth, E. Hepcidin Regulates Cellular Iron Efflux by Binding to Ferroportin and Inducing Its Internalization. Science 2004, 306, 2090–2093. [Google Scholar] [CrossRef]
- Muckenthaler, M.U.; Rivella, S.; Hentze, M.W.; Galy, B. A Red Carpet for Iron Metabolism. Cell 2017, 168, 344–361. [Google Scholar] [CrossRef]
- Billesbølle, C.B.; Azumaya, C.M.; Kretsch, R.C.; Powers, A.S.; Gonen, S.; Schneider, S.; Arvedson, T.; Dror, R.O.; Cheng, Y.; Manglik, A. Structure of Hepcidin-Bound Ferroportin Reveals Iron Homeostatic Mechanisms. Nature 2020, 586, 807–811. [Google Scholar] [CrossRef]
- Chiu, M.K.; Davey, A.M. Neonatal Hemochromatosis. Clin. Pediatr. (Phila.) 1997, 36, 607–610. [Google Scholar] [CrossRef]
- Corradini, E.; Buzzetti, E.; Pietrangelo, A. Genetic Iron Overload Disorders. Mol. Asp. Med. 2020, 75, 100896. [Google Scholar] [CrossRef]
- Joshi, R.; Shvartsman, M.; Morán, E.; Lois, S.; Aranda, J.; Barqué, A.; Cruz, X.; Bruguera, M.; Vagace, J.M.; Gervasini, G.; et al. Functional Consequences of Transferrin Receptor-2 Mutations Causing Hereditary Hemochromatosis Type 3. Mol. Genet. Genom. Med. 2015, 3, 221–232. [Google Scholar] [CrossRef] [PubMed]
- Yun, S.; Vincelette, N.D. Update on Iron Metabolism and Molecular Perspective of Common Genetic and Acquired Disorder, Hemochromatosis. Crit. Rev. Oncol. Hematol. 2015, 95, 12–25. [Google Scholar] [CrossRef]
- Bardou-Jacquet, E.; Brissot, P. Diagnostic Evaluation of Hereditary Hemochromatosis (HFE and Non-HFE). Hematol. Oncol. Clin. N. Am. 2014, 28, 625–635. [Google Scholar] [CrossRef] [PubMed]
- Kajarabille, N.; Latunde-Dada, G.O. Programmed Cell-Death by Ferroptosis: Antioxidants as Mitigators. Int. J. Mol. Sci. 2019, 20, 4968. [Google Scholar] [CrossRef] [PubMed]
- Focht, S.J.; Snyder, B.S.; Beard, J.L.; Van Gelder, W.; Williams, L.R.; Connor, J.R. Regional Distribution of Iron, Transferrin, Ferritin, and Oxidatively-Modified Proteins in Young and Aged Fischer 344 Rat Brains. Neuroscience 1997, 79, 255–261. [Google Scholar] [CrossRef]
- Erikson, K.M.; Pinero, D.J.; Connor, J.R.; Beard, J.L. Regional Brain Iron, Ferritin and Transferrin Concentrations during Iron Deficiency and Iron Repletion in Developing Rats. J. Nutr. 1997, 127, 2030–2038. [Google Scholar] [CrossRef] [PubMed]
- Bradbury, M.W. Transport of Iron in the Blood-Brain-Cerebrospinal Fluid System. J. Neurochem. 1997, 69, 443–454. [Google Scholar] [CrossRef]
- Siddappa, A.J.M.; Rao, R.B.; Wobken, J.D.; Leibold, E.A.; Connor, J.R.; Georgieff, M.K. Developmental Changes in the Expression of Iron Regulatory Proteins and Iron Transport Proteins in the Perinatal Rat Brain. J. Neurosci. Res. 2002, 68, 761–775. [Google Scholar] [CrossRef]
- Houglum, K.; Filip, M.; Witztum, J.L.; Chojkier, M. Malondialdehyde and 4-Hydroxynonenal Protein Adducts in Plasma and Liver of Rats with Iron Overload. J. Clin. Investig. 1990, 86, 1991–1998. [Google Scholar] [CrossRef] [PubMed]
- Stadtman, E.R. Metal Ion-Catalyzed Oxidation of Proteins: Biochemical Mechanism and Biological Consequences. Free Radic. Biol. Med. 1990, 9, 315–325. [Google Scholar] [CrossRef]
- Downes, N.; Mullins, P. The Development of Myelin in the Brain of the Juvenile Rat. Toxicol. Pathol. 2014, 42, 913–922. [Google Scholar] [CrossRef]
- Roth, A.D.; Núñez, M.T. Oligodendrocytes: Functioning in a Delicate Balance Between High Metabolic Requirements and Oxidative Damage. In Glial Cells in Health and Disease of the CNS; von Bernhardi, R., Ed.; Advances in Experimental Medicine and Biology; Springer International Publishing: Cham, Switzerland, 2016; Volume 949, pp. 167–181. ISBN 978-3-319-40762-3. [Google Scholar]
- Stassart, R.M.; Möbius, W.; Nave, K.-A.; Edgar, J.M. The Axon-Myelin Unit in Development and Degenerative Disease. Front. Neurosci. 2018, 12, 467. [Google Scholar] [CrossRef]
- Szymlek-Gay, E.A.; Domellöf, M.; Hernell, O.; Hurrell, R.F.; Lind, T.; Lönnerdal, B.; Zeder, C.; Egli, I.M. Mode of Oral Iron Administration and the Amount of Iron Habitually Consumed Do Not Affect Iron Absorption, Systemic Iron Utilisation or Zinc Absorption in Iron-Sufficient Infants: A Randomised Trial. Br. J. Nutr. 2016, 116, 1046–1060. [Google Scholar] [CrossRef] [PubMed]
- Camaschella, C.; Nai, A.; Silvestri, L. Iron Metabolism and Iron Disorders Revisited in the Hepcidin Era. Haematologica 2020, 105, 260–272. [Google Scholar] [CrossRef] [PubMed]
- Pasricha, S.-R.; Hayes, E.; Kalumba, K.; Biggs, B.-A. Effect of Daily Iron Supplementation on Health in Children Aged 4-23 Months: A Systematic Review and Meta-Analysis of Randomised Controlled Trials. Lancet Glob. Health 2013, 1, e77–e86. [Google Scholar] [CrossRef]
- Petry, N.; Olofin, I.; Boy, E.; Donahue Angel, M.; Rohner, F. The Effect of Low Dose Iron and Zinc Intake on Child Micronutrient Status and Development during the First 1000 Days of Life: A Systematic Review and Meta-Analysis. Nutrients 2016, 8, 773. [Google Scholar] [CrossRef] [PubMed]
- Lozoff, B.; Beard, J.; Connor, J.; Barbara, F.; Georgieff, M.; Schallert, T. Long-Lasting Neural and Behavioral Effects of Iron Deficiency in Infancy. Nutr. Rev. 2006, 64, S34–S43. [Google Scholar] [CrossRef] [PubMed]
- Gahagan, S.; Yu, S.; Kaciroti, N.; Castillo, M.; Lozoff, B. Linear and Ponderal Growth Trajectories in Well-Nourished, Iron-Sufficient Infants Are Unimpaired by Iron Supplementation. J. Nutr. 2009, 139, 2106–2112. [Google Scholar] [CrossRef] [PubMed]
- Uemitsu, N.; Nishimura, C.; Nakayoshi, H. Evaluation of Liver Weight Changes Following Repeated Administration of Carbon Tetrachloride in Rats and Body-Liver Weight Relationship. Toxicology 1986, 40, 181–190. [Google Scholar] [CrossRef]
- Berggren, K.L.; Chen, J.; Fox, J.; Miller, J.; Dodds, L.; Dugas, B.; Vargas, L.; Lothian, A.; McAllum, E.; Volitakis, I.; et al. Neonatal Iron Supplementation Potentiates Oxidative Stress, Energetic Dysfunction and Neurodegeneration in the R6/2 Mouse Model of Huntington’s Disease. Redox Biol. 2015, 4, 363–374. [Google Scholar] [CrossRef] [PubMed]
- Miwa, C.P.; de Lima, M.N.M.; Scalco, F.; Vedana, G.; Mattos, R.; Fernandez, L.L.; Hilbig, A.; Schröder, N.; Vianna, M.R.M. Neonatal Iron Treatment Increases Apoptotic Markers in Hippocampal and Cortical Areas of Adult Rats. Neurotox. Res. 2011, 19, 527–535. [Google Scholar] [CrossRef] [PubMed]
- Rathnasamy, G.; Murugan, M.; Ling, E.-A.; Kaur, C. Hypoxia-Induced Iron Accumulation in Oligodendrocytes Mediates Apoptosis by Eliciting Endoplasmic Reticulum Stress. Mol. Neurobiol. 2016, 53, 4713–4727. [Google Scholar] [CrossRef]


| Species | Diet | Diet Intake | Dietary Iron (ppm) | Daily Iron Intake 1 (mg/kg BW) | Iron Absorption (%) | Adjusted Daily IronIntake 2 (mg/kg BW) |
|---|---|---|---|---|---|---|
| Human | Human milk (HM) | 600–800 mL [6] | 0.35 [44] | 0.04–0.07 | 50 [27] | 0.02–0.035 |
| Human | Iron-Fortified Formula (IF) | 600–800 mL [6] | 12 [7] | 1.4 | 10 [28] | 0.14 |
| Rat (pup) | Rat Milk (RM) | 4–10 mL [45] | 5 [46] | 1.6–2.0 | 100 [30] | 1.6–2.0 |
| Rat (adult) | Standard Chow | 25–30 g [47] | 35–250 [48] | 3.5–21 | 100 [49] | 3.5–21 |
| Rat (adult) | Iron Overload | 25–30 g [47] | 8000–10,000 [50,51] | 800–2500 | NA | NA |
| Gene | Primer Sequence | Reference |
|---|---|---|
| Actb | F: GAAATCGTGCGTGACATTAAAGAG R: GCGGCAGTGGCCATCTC | [53] |
| Hamp | F: GCTGCCTGTCTCCTGCTTCT R: CTGCAGAGCCGTAGTCTGTCTCGTC | [29] |
| Tf | F: GCATCAGACTCCAGCATCAA R: CAGGACAGTCTGGTGCTTCA | [54] |
| TfR1 | F: GAGTTCACTGACATCATCAA R: GCAATCCAGATGACTGAGAT | [53] |
| Mag | F: TGTGTAGCTGAGAAGGAGTATGG R: ACAGTGCGATTCCAGAAGGATTAT | [55] |
| Mbp | F: CTCTGGCAAGGACTCACACAC R: TCTGCTGAGGGACAGGCCTCTC | [56] |
| Plp | F: GTGTTCTCCCATGGAATGCT R: TGAAGGTGAGCAGGGAAACT | [57] |
Publisher’s Note: MDPI stays neutral with regard to jurisdictional claims in published maps and institutional affiliations. |
© 2021 by the authors. Licensee MDPI, Basel, Switzerland. This article is an open access article distributed under the terms and conditions of the Creative Commons Attribution (CC BY) license (https://creativecommons.org/licenses/by/4.0/).
Share and Cite
McMillen, S.; Lönnerdal, B. Postnatal Iron Supplementation with Ferrous Sulfate vs. Ferrous Bis-Glycinate Chelate: Effects on Iron Metabolism, Growth, and Central Nervous System Development in Sprague Dawley Rat Pups. Nutrients 2021, 13, 1406. https://doi.org/10.3390/nu13051406
McMillen S, Lönnerdal B. Postnatal Iron Supplementation with Ferrous Sulfate vs. Ferrous Bis-Glycinate Chelate: Effects on Iron Metabolism, Growth, and Central Nervous System Development in Sprague Dawley Rat Pups. Nutrients. 2021; 13(5):1406. https://doi.org/10.3390/nu13051406
Chicago/Turabian StyleMcMillen, Shasta, and Bo Lönnerdal. 2021. "Postnatal Iron Supplementation with Ferrous Sulfate vs. Ferrous Bis-Glycinate Chelate: Effects on Iron Metabolism, Growth, and Central Nervous System Development in Sprague Dawley Rat Pups" Nutrients 13, no. 5: 1406. https://doi.org/10.3390/nu13051406
APA StyleMcMillen, S., & Lönnerdal, B. (2021). Postnatal Iron Supplementation with Ferrous Sulfate vs. Ferrous Bis-Glycinate Chelate: Effects on Iron Metabolism, Growth, and Central Nervous System Development in Sprague Dawley Rat Pups. Nutrients, 13(5), 1406. https://doi.org/10.3390/nu13051406