
Dampened Muscle mTORC1 Response Following Ingestion of High-Quality Plant-Based Protein and Insect Protein Compared to Whey

Abstract
1. Introduction
2. Materials and Methods
2.1. Animals
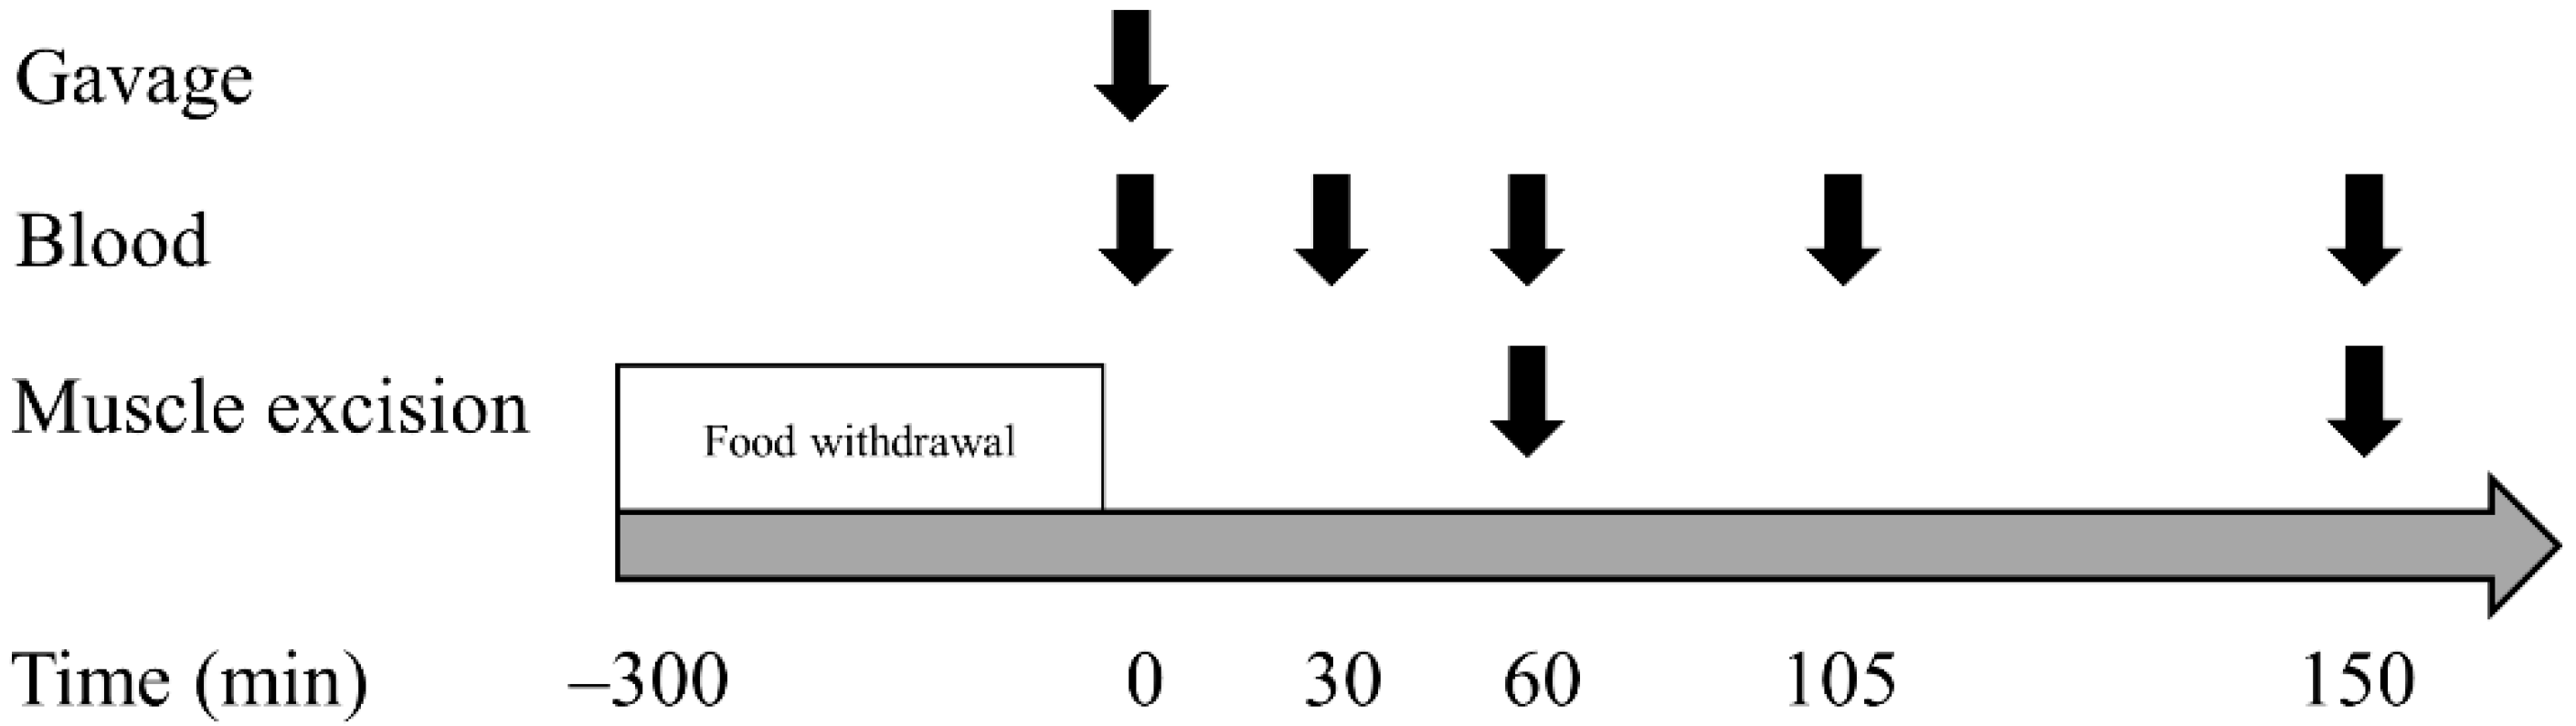
2.2. Experimental Procedures
2.3. Sample Collection
2.4. Protein Extraction and Western Blot
2.5. Amino Acid Determination from Blood
2.6. Statistical and Data Analyses
3. Results
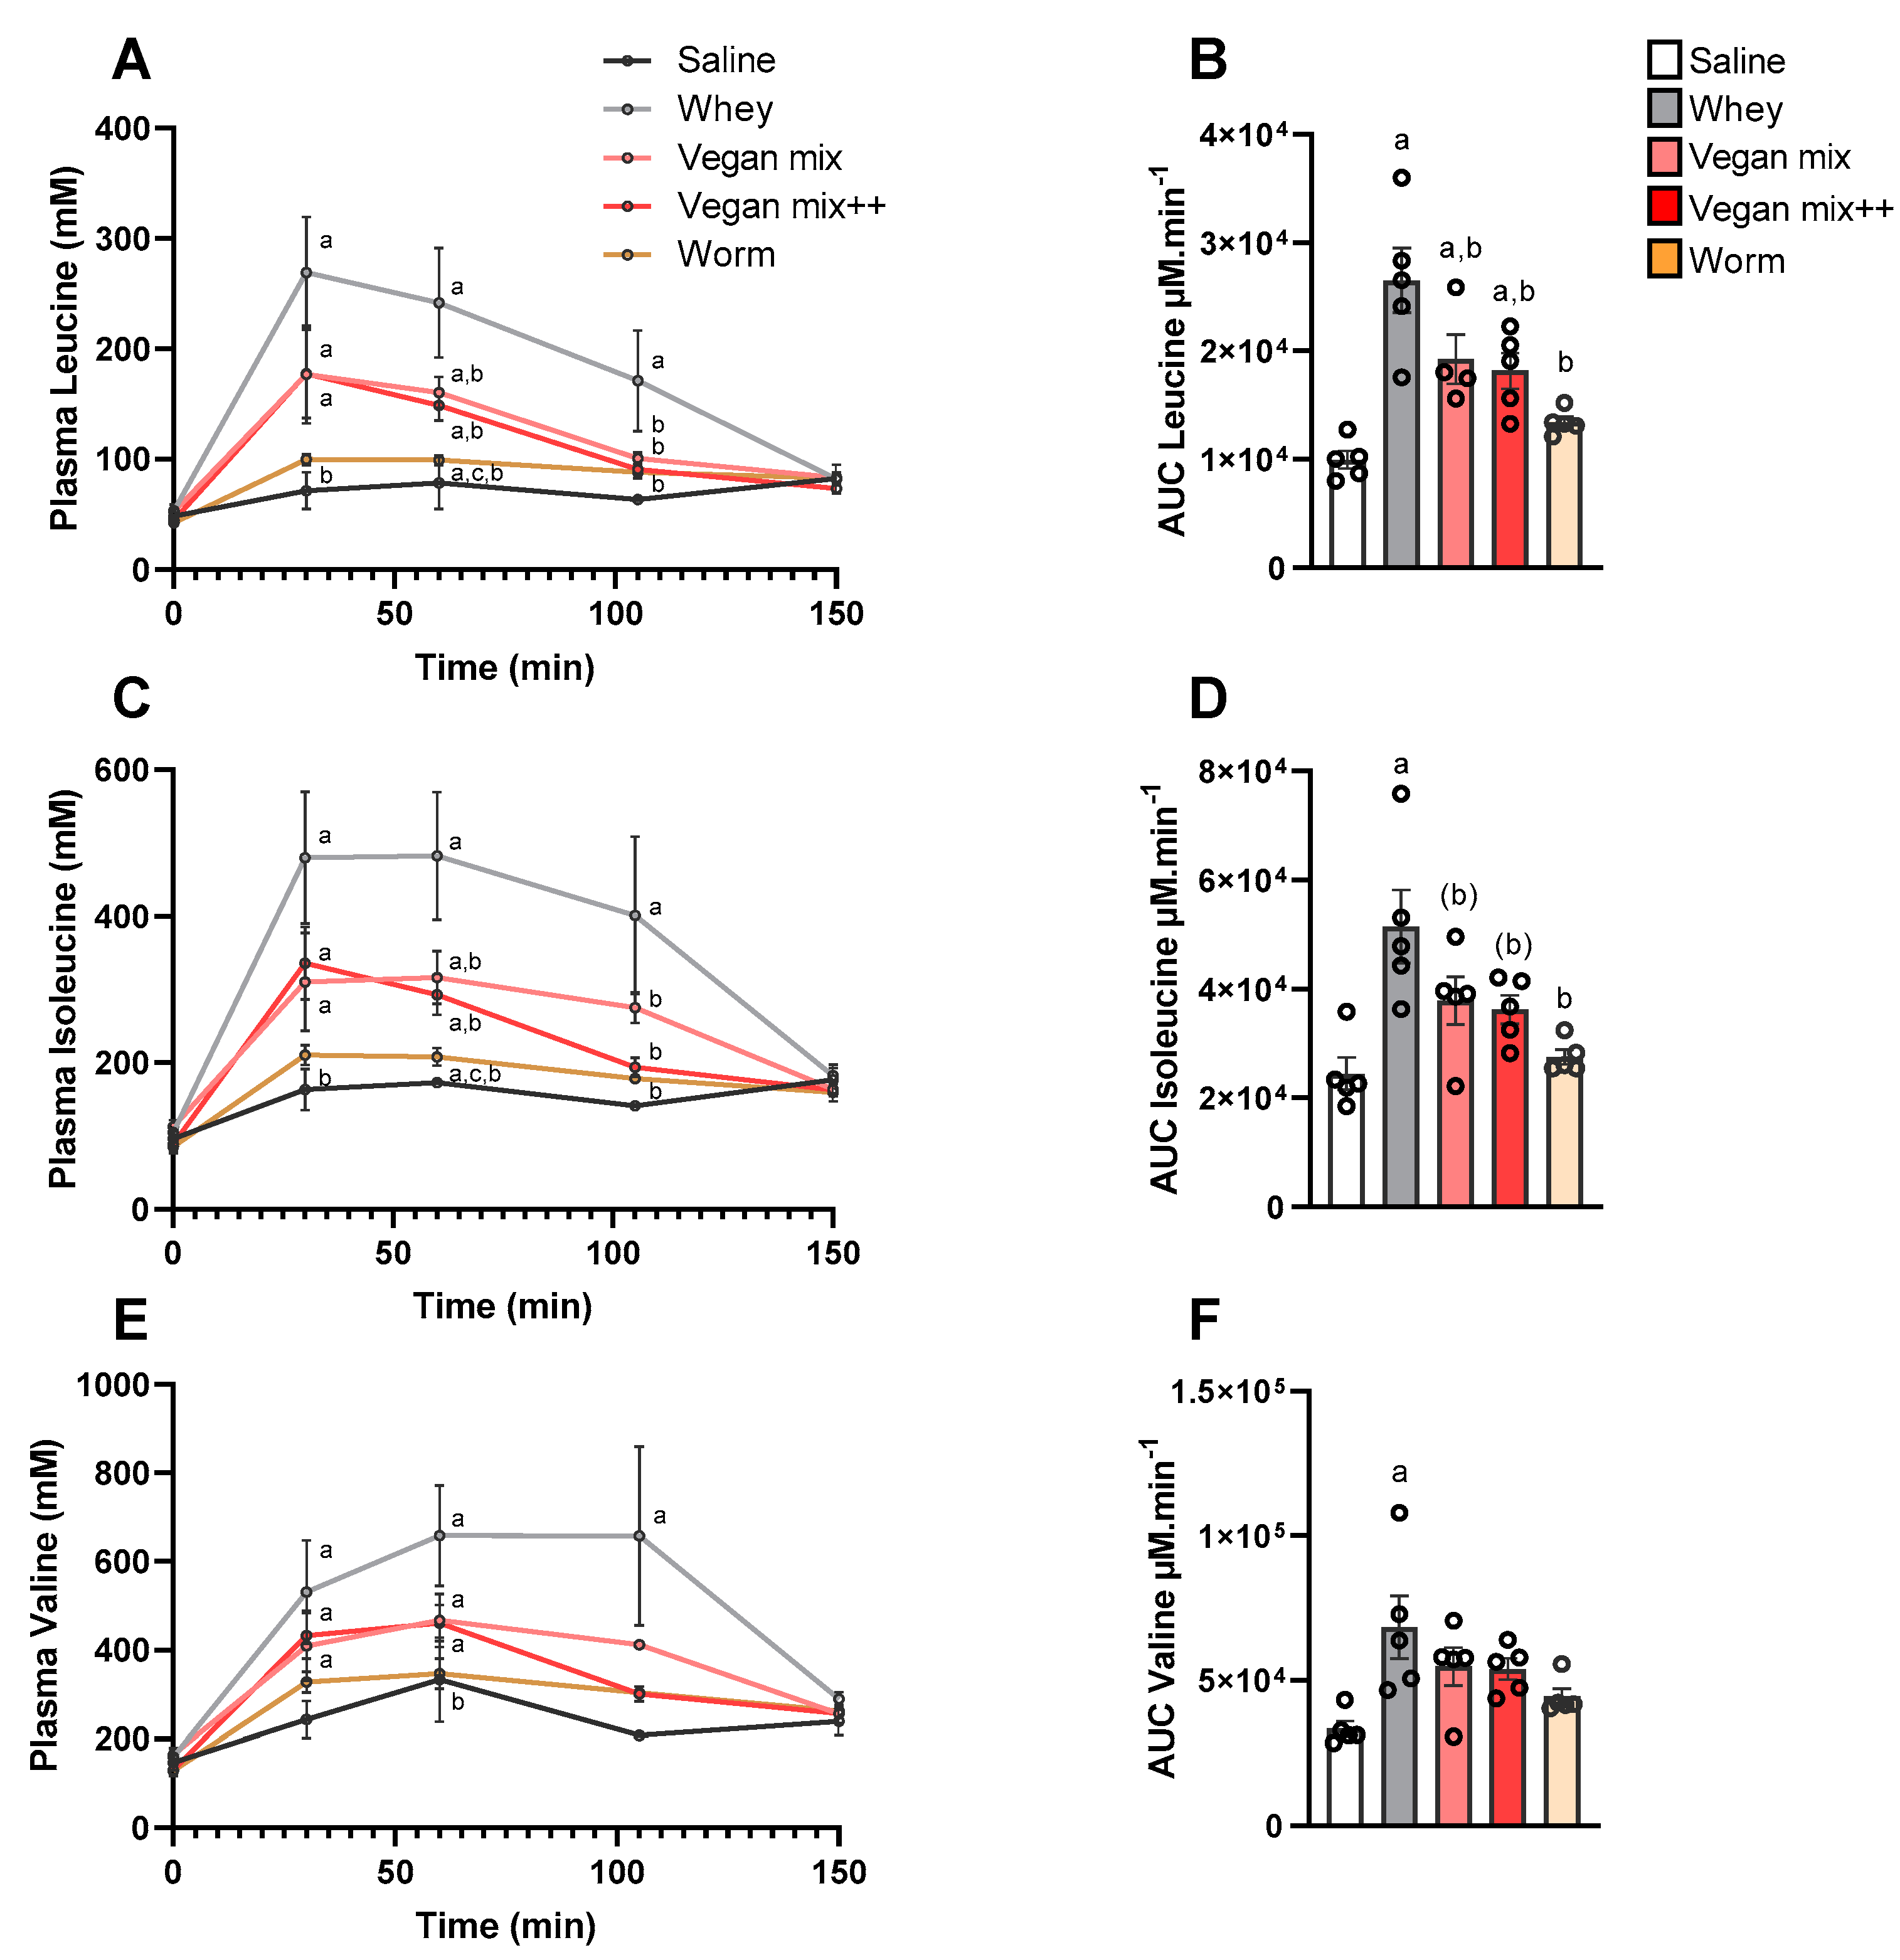
3.1. Amino Acid Concentrations in Plasma
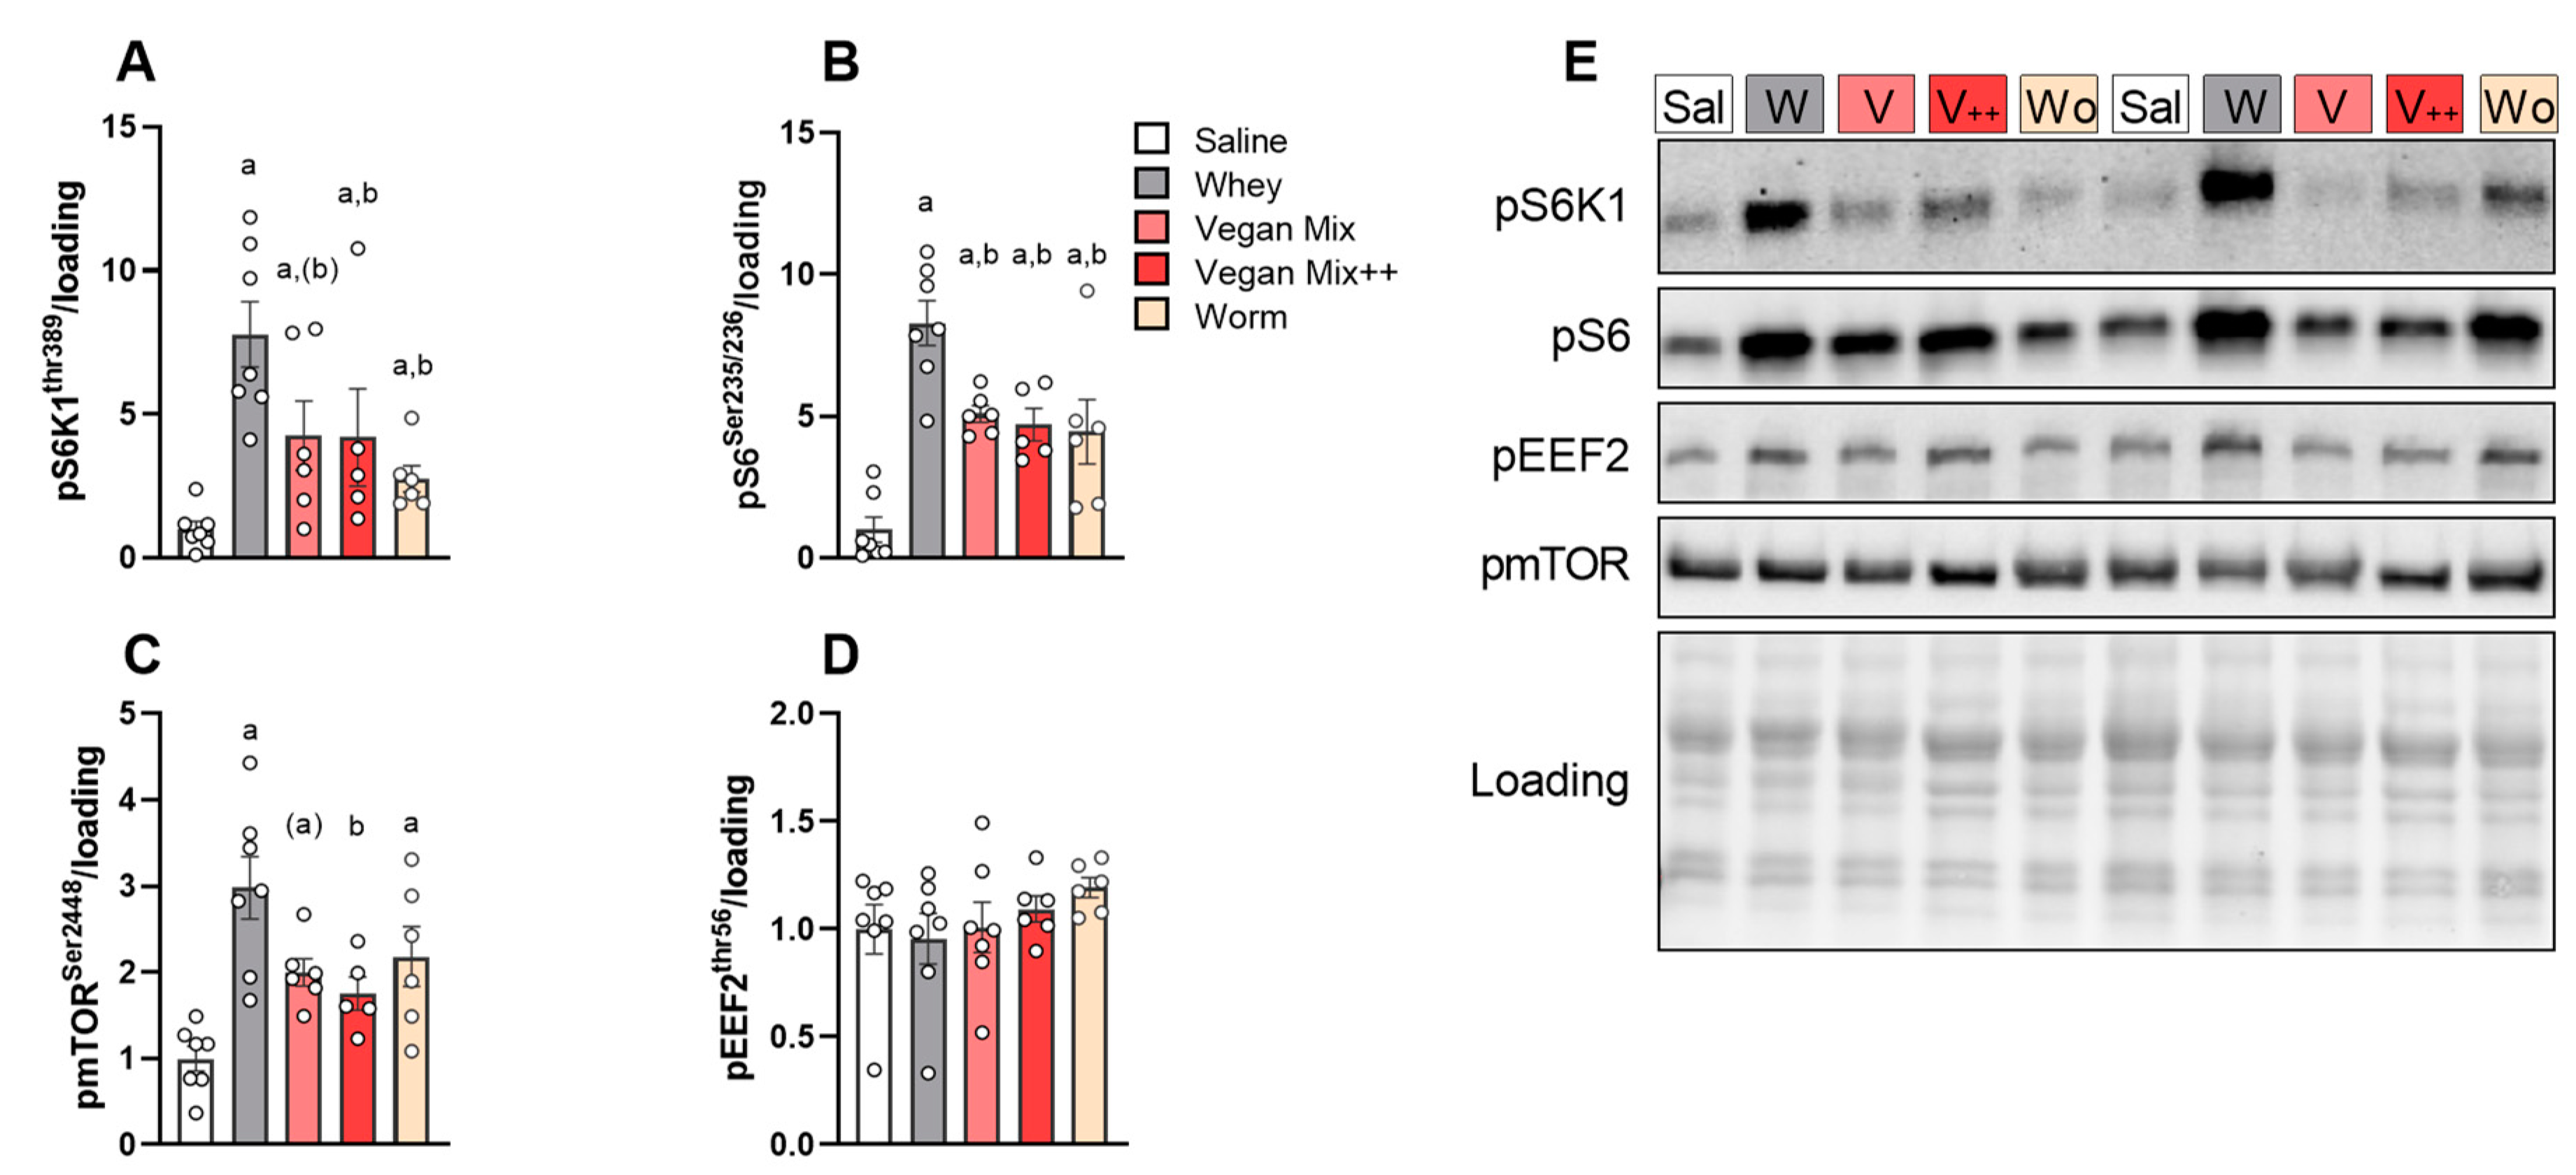
3.2. Higher Acute mTORC1 Response with Whey Compared to Plant- and Insect-Based Protein
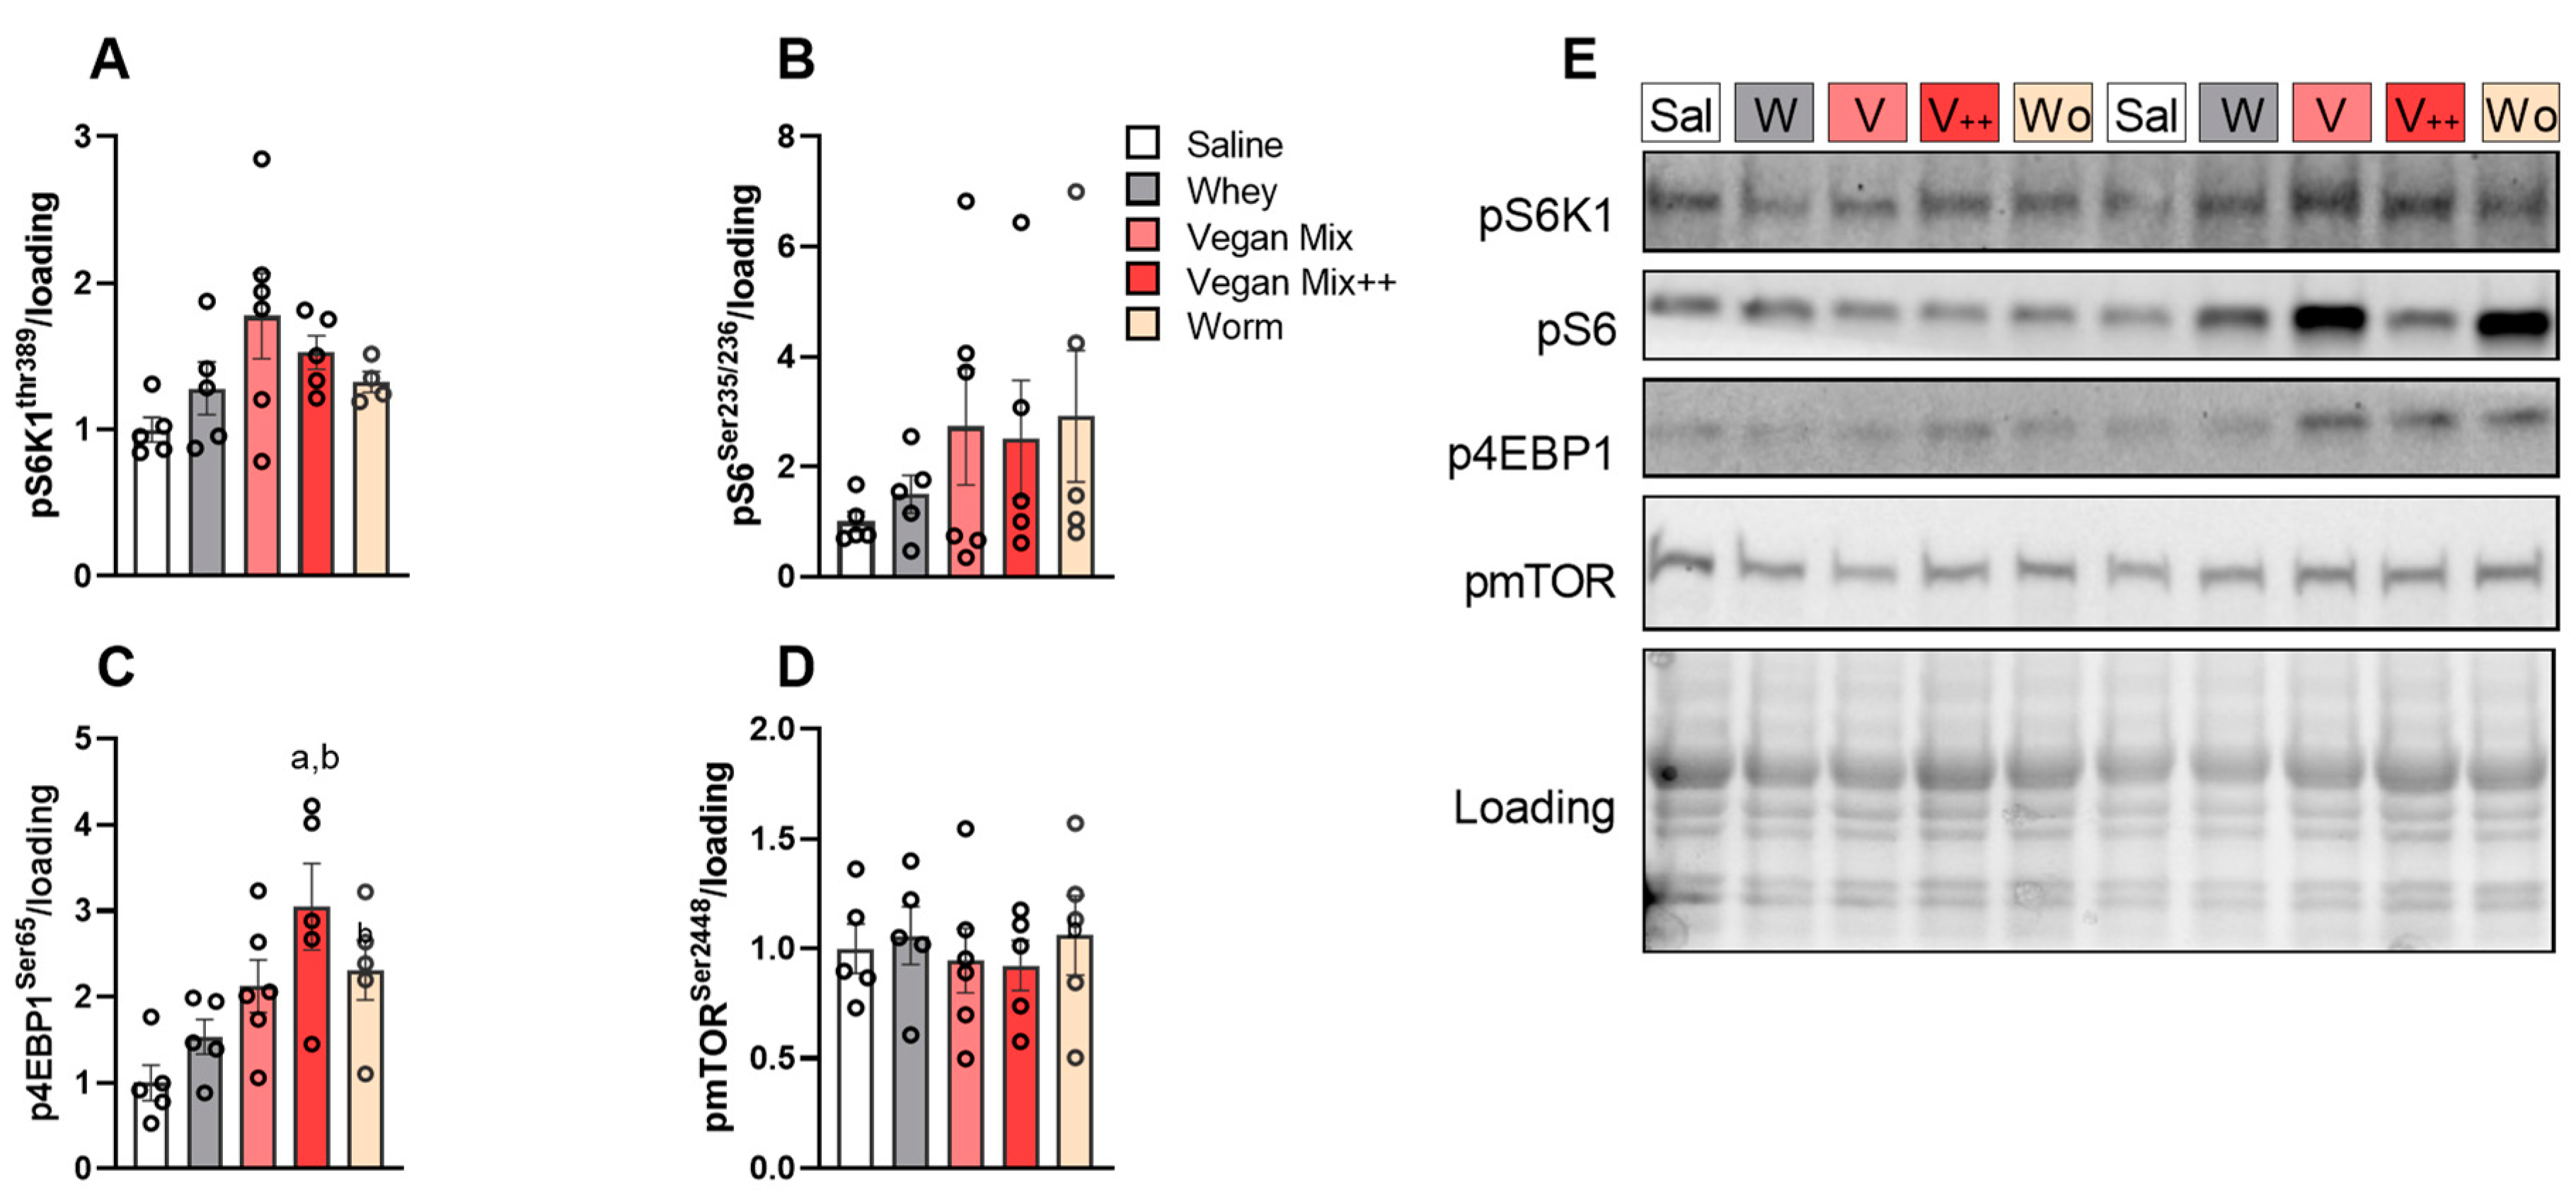
3.3. No Prolonged mTORC1 Response with Plant- or Insect-Based Protein
4. Discussion
5. Conclusions
Author Contributions
Funding
Institutional Review Board Statement
Informed Consent Statement
Data Availability Statement
Conflicts of Interest
References
- Larsson, L.; Degens, H.; Li, M.; Salviati, L.; Lee, Y.I.; Thompson, W.; Kirkland, J.L.; Sandri, M. Sarcopenia: Aging-Related Loss of Muscle Mass and Function. Physiol. Rev. 2019, 99, 427–511. [Google Scholar] [CrossRef] [PubMed]
- Joanisse, S.; Lim, C.; McKendry, J.; McLeod, J.C.; Stokes, T.; Phillips, S.M. Recent advances in understanding resistance exercise training-induced skeletal muscle hypertrophy in humans. F1000Research 2020, 9, 141. [Google Scholar] [CrossRef] [PubMed]
- Koopman, R.; Van Loon, L.J.C. Aging, exercise, and muscle protein metabolism. J. Appl. Physiol. 2009, 106, 2040–2048. [Google Scholar] [CrossRef]
- D’Hulst, G.; Soro-arnaiz, I.; Masschelein, E.; Veys, K.; Smeuninx, B.; Kim, S.; Deldicque, L.; Blaauw, B.; Breen, L.; Koivunen, P.; et al. PHD1 controls muscle mTORC1 in a hydroxylation-independent manner by stabilizing leucyl tRNA synthetase. Nat. Commun. 2020, 11, 1–15. [Google Scholar] [CrossRef] [PubMed]
- Wang, X.; Proud, C.G. The mTOR Pathway in the Control of Protein Synthesis. Physiol. 2006, 21, 362–369. [Google Scholar] [CrossRef]
- Huo, Y.; Iadevaia, V.; Proud, C.G. Differing effects of rapamycin and mTOR kinase inhibitors on protein synthesis. Biochem. Soc. Trans. 2011, 39, 446–450. [Google Scholar] [CrossRef]
- Drummond, M.J.; Fry, C.S.; Glynn, E.L.; Dreyer, H.C.; Dhanani, S.; Timmerman, K.L.; Volpi, E.; Rasmussen, B.B. Rapamycin administration in humans blocks the contraction-induced increase in skeletal muscle protein synthesis. J. Physiol. 2009, 587, 1535–1546. [Google Scholar] [CrossRef]
- Huang, J.; Manning, B.D. The TSC1–TSC2 complex: A molecular switchboard controlling cell growth. Biochem. J. 2008, 412, 179–190. [Google Scholar] [CrossRef]
- Han, J.M.; Jeong, S.J.; Park, M.C.; Kim, G.; Kwon, N.H.; Kim, H.K.; Ha, S.H.; Ryu, S.H.; Kim, S. Leucyl-tRNA Synthetase Is an Intracellular Leucine Sensor for the mTORC1-Signaling Pathway. Cell 2012, 149, 410–424. [Google Scholar] [CrossRef]
- Wolfson, R.L.; Sabatini, D.M. The Dawn of the Age of Amino Acid Sensors for the mTORC1 Pathway. Cell Metab. 2017, 26, 301–309. [Google Scholar] [CrossRef]
- Wolfson, R.L.; Chantranupong, L.; Saxton, R.A.; Shen, K.; Scaria, S.M.; Cantor, J.R.; Sabatini, D.M. Sestrin2 is a leucine sensor for the mTORC1 pathway. Science 2015, 351, 43–48. [Google Scholar] [CrossRef] [PubMed]
- World Population Prospects: The 2017 Revision, Key Findings and Advance Tables; UN Department of Economic and Social Affairs: New York, NY, USA, 2017.
- Henchion, M.; Hayes, M.; Mullen, A.M.; Fenelon, M.; Tiwari, B. Future Protein Supply and Demand: Strategies and Factors Influencing a Sustainable Equilibrium. Foods 2017, 6, 53. [Google Scholar] [CrossRef] [PubMed]
- FAO. Mapping Supply and Demand for Animal-Source Foods to 2030, Animal Production and Health Working Paper; FAO: Rome, Italy, 2011; ISBN 9789251070413. [Google Scholar]
- Houston, D.; Nicklas, B.; Ding, J.; Harris, T.B.; Tylavsky, F.; Newman, A.; Sun, L.J.; Sahyoun, N.; Visser, M.; Kritchevsy, S. Dietary protein intake is associated with lean mass change in older, community-dwelling adults: The Health, Aging, and Body Composition (Health ABC). Am. J. Clin. Nutr. 2008, 87, 150–155. [Google Scholar] [CrossRef] [PubMed]
- Statistics Division, FAO. FAOSTAT Food Balance Sheets; FAOSTAT: Rome, Italy, 2011. [Google Scholar]
- Van Vliet, S.; Burd, N.A.; van Loon, L.J. The Skeletal Muscle Anabolic Response to Plant- versus Animal-based Protein consumption. J. Nutr. 2015, 145, 1981–1991. [Google Scholar] [CrossRef] [PubMed]
- Hackney, K.J.; Trautman, K.; Johnson, N.; McGrath, R.; Stastny, S. Protein and muscle health during aging: Benefits and concerns related to animal-based protein. Anim. Front. 2019, 9, 12–17. [Google Scholar] [CrossRef]
- Benzie, I.F.F.; Wachtel-Galor, S. Vegetarian Diets and Public Health: Biomarker and Redox Connections. Antioxidants Redox Signal. 2010, 13, 1575–1591. [Google Scholar] [CrossRef] [PubMed]
- Joy, J.M.; Lowery, R.P.; Wilson, J.M.; Purpura, M.; De Souza, E.O.; Mc Wilson, S.; Kalman, D.S.; Dudeck, J.E.; Jäger, R. The effects of 8 weeks of whey or rice protein supplementation on body composition and exercise performance. Nutr. J. 2013, 12, 86. [Google Scholar] [CrossRef]
- Haub, M.D.; Wells, A.M.; Tarnopolsky, M.A.; Campbell, W.W. Effect of protein source on resistive-training-induced changes in body composition and muscle size in older men. Am. J. Clin. Nutr. 2002, 76, 511–517. [Google Scholar] [CrossRef] [PubMed]
- Berrazaga, I.; Micard, V.; Gueugneau, M.; Walrand, S. The Role of the Anabolic Properties of Plant- versus Animal-Based Protein Sources in Supporting Muscle Mass Maintenance: A Critical Review. Nutrients 2019, 11, 1825. [Google Scholar] [CrossRef]
- Monteyne, A.J.; Coelho, M.O.C.; Porter, C.; Abdelrahman, D.R.; Jameson, T.S.O.; Jackman, S.R.; Blackwell, J.R.; Finnigan, T.J.A.; Stephens, F.B.; Dirks, M.L.; et al. Mycoprotein ingestion stimulates protein synthesis rates to a greater extent than milk protein in rested and exercised skeletal muscle of healthy young men: A randomized controlled trial. Am. J. Clin. Nutr. 2020, 112, 318–333. [Google Scholar] [CrossRef]
- Gorissen, S.H.M.; Horstman, A.M.H.; Franssen, R.; Crombag, J.J.R.; Langer, H.; Bierau, J.; Respondek, F.; Van Loon, L.J. Ingestion of Wheat Protein Increases In Vivo Muscle Protein Synthesis Rates in Healthy Older Men in a Randomized Trial. J. Nutr. 2016, 146, 1651–1659. [Google Scholar] [CrossRef]
- Wilkinson, S.B.; Tarnopolsky, M.A.; Macdonald, M.J.; Macdonald, J.R.; Armstrong, D.; Phillips, S.M. Consumption of fluid skim milk promotes greater muscle protein accretion after resistance exercise than does consumption of an isonitrogenous and isoenergetic soy-protein beverage. Am. J. Clin. Nutr. 2007, 85, 1031–1040. [Google Scholar] [CrossRef] [PubMed]
- Tang, J.E.; Moore, D.R.; Kujbida, G.W.; Tarnopolsky, M.A.; Phillips, S.M. Ingestion of whey hydrolysate, casein, or soy protein isolate: Effects on mixed muscle protein synthesis at rest and following resistance exercise in young men. J. Appl. Physiol. 2009, 107, 987–992. [Google Scholar] [CrossRef]
- Yang, Y.; Churchward-venne, T.; Burd, N.A.; Breen, L.; Tarnopolsky, M.A.; Phillips, S.M. Greater stimulation of myofibrillar protein synthesis with ingestion of whey protein isolate v. micellar casein at rest and after resistance exercise in elderly men. Nutr. Metab. 2012, 108, 958–962. [Google Scholar] [CrossRef]
- Dijk, F.J.; Van Dijk, M.; Walrand, S.; Van Loon, L.J.C.; Van Norren, K.; Luiking, Y.C. Differential effects of leucine and leucine-enriched whey protein on skeletal muscle protein synthesis in aged mice. Clin. Nutr. ESPEN 2018, 24, 127–133. [Google Scholar] [CrossRef]
- Crozier, S.J.; Kimball, S.R.; Emmert, S.W.; Anthony, J.C.; Jefferson, L.S. Oral Leucine Administration Stimulates Protein Synthesis in Rat Skeletal Muscle. J. Nutr. 2005, 135, 376–382. [Google Scholar] [CrossRef] [PubMed]
- Gilani, G.S.; Xiao, C.W.; Cockell, K.A. Impact of Antinutritional Factors in Food Proteins on the Digestibility of Protein and the Bioavailability of Amino Acids and on Protein Quality. Br. J. Nutr. 2012, 108, S315–S332. [Google Scholar] [CrossRef]
- Bos, C.; Metges, C.C.; Gaudichon, C.; Petzke, K.J.; Pueyo, M.E.; Morens, C.; Everwand, J.; Benamouzig, R.; Tomeé, D. Postprandial Kinetics of Dietary Amino Acids Are the Main Determinant of Their Metabolism after Soy or Milk Protein Ingestion in Humans. J. Nutr. 2003, 133, 1308–1315. [Google Scholar] [CrossRef] [PubMed]
- Vangsoe, M.T.; Thogersen, R.; Bertram, H.C.; Heckmann, L.-H.L.; Hansen, M. Ingestion of Insect Protein Isolate Enhances Blood Amino Acid Concentrations Similar to Soy Protein in A Human Trial. Nutrients 2018, 10, 1357. [Google Scholar] [CrossRef]
- Yoshizawa, F.; Mochizuki, S.; Sugahara, K. Differential Dose Response of mTOR Signaling to Oral Administration of Leucine in Skeletal Muscle and Liver of Rats. Biosci. Biotechnol. Biochem. 2013, 77, 839–842. [Google Scholar] [CrossRef] [PubMed]
- Boulos, S.; Tännler, A.; Nyström, L. Nitrogen-to-Protein Conversion Factors for Edible Insects on the Swiss Market: T. molitor, A. domesticus, and L. migratoria. Front. Nutr. 2020, 7, 89. [Google Scholar] [CrossRef] [PubMed]
- Mariotti, F.; Tomé, D.; Mirand, P. Converting Nitrogen into Protein–Beyond 6.25 and Jones’ Factors. Crit. Rev. Food Sci. Nutr. 2008, 2, 177–184. [Google Scholar] [CrossRef] [PubMed]
- Elgar, D.F.; Hill, J.P.; Holroyd, S.E.; Peddie, G.S. Comparison of analytical methods for measuring protein content of whey protein products and investigation of influences on nitrogen conversion factors. Int. J. Dairy Technol. 2020, 73, 790–794. [Google Scholar] [CrossRef]
- Impact Whey Protein—Myprotein—Amino Acid Analysis. Available online: https://www.supplementlabtest.com/tests/impact-whey-protein-myprotein-amino-acid-analysis-carbs-and-sugars-supplementlabtestcom (accessed on 31 August 2015).
- Adams, K.J.; Pratt, B.; Bose, N.; Dubois, L.G.; St. John-Williams, L.S.; Perrott, K.M.; Ky, K.; Kapahi, P.; Sharma, V.; MacCoss, M.J.; et al. Skyline for Small Molecules: A Unifying Software Package for Quantitative Metabolomics. J. Proteome Res. 2020, 19, 1447–1458. [Google Scholar] [CrossRef] [PubMed]
- Phillips, S.M. Nutrient-rich meat proteins in offsetting age-related muscle loss. Meat Sci. 2012, 92, 174–178. [Google Scholar] [CrossRef]
- Mensa-Wilmot, Y.; Phillips, R.; Hargrove, J. Protein quality evaluation of cowpea-based extrusion cooked cereal/legume weaning mixtures. Nutr. Res. 2001, 21, 849–857. [Google Scholar] [CrossRef]
- Scrimshaw, N.S.; Bressani, R.; Béhar, M.; Viteri, F. Supplementation of Cereal Proteins with Amino Acids: I. Effect of Amino Acid Supplementation of Corn-Masa at High Levels of Protein Intake on the Nitrogen Retention of Young Children. J. Nutr. 1958, 66, 485–499. [Google Scholar] [CrossRef]
- Brennan, J.L.; Keerati-U-Rai, M.; Yin, H.; Daoust, J.; Nonnotte, E.; Quinquis, L.; St-Denis, T.; Bolster, D.R. Differential Responses of Blood Essential Amino Acid Levels Following Ingestion of High-Quality Plant-Based Protein Blends Compared to Whey Protein—A Double-Blind Randomized, Cross-Over, Clinical Trial. Nutrients 2019, 11, 2987. [Google Scholar] [CrossRef]
- Moberg, M.; Apró, W.; Ekblom, B.; Van Hall, G.; Holmberg, H.-C.; Blomstrand, E. Activation of mTORC1 by leucine is potentiated by branched-chain amino acids and even more so by essential amino acids following resistance exercise. Am. J. Physiol. Cell Physiol. 2016, 310, C874–C884. [Google Scholar] [CrossRef]
- Borgenvik, M.; Apró, W.; Blomstrand, E. Intake of branched-chain amino acids influences the levels of MAFbx mRNA and MuRF-1 total protein in resting and exercising human muscle. Am. J. Physiol. Endocrinol. Metab. 2012, 302, E510–E521. [Google Scholar] [CrossRef]
- Moro, T.; Brightwell, C.R.; Velarde, B.; Fry, C.S.; Nakayama, K.; Sanbongi, C.; Volpi, E.; Rasmussen, B.B. Whey Protein Hydrolysate Increases Amino Acid Uptake, mTORC1 Signaling, and Protein Synthesis in Skeletal Muscle of Healthy Young Men in a Randomized Crossover Trial. J. Nutr. 2019, 149, 1149–1158. [Google Scholar] [CrossRef]
- Burd, N.A.; Gorissen, S.H.; Van Vliet, S.; Snijders, T.; van Loon, L.J. Differences in postprandial protein handling after beef compared with milk ingestion during postexercise recovery: A randomized controlled trial. Am. J. Clin. Nutr. 2015, 102, 828–836. [Google Scholar] [CrossRef] [PubMed]
- Márquez-Mota, C.C.; Rodriguez-Gaytan, C.; Adjibade, P.; Mazroui, R.; Gálvez, A.; Granados, O.; Tovar, A.R.; Torres, N. The mTORC1-Signaling Pathway and Hepatic Polyribosome Profile Are Enhanced after the Recovery of a Protein Restricted Diet by a Combination of Soy or Black Bean with Corn Protein. Nutrients 2016, 8, 573. [Google Scholar] [CrossRef] [PubMed]
- Phillips, S.M. A Brief Review of Critical Processes in Exercise-Induced Muscular Hypertrophy. Sports Med. 2014, 44, 71–77. [Google Scholar] [CrossRef] [PubMed]
- Reagan-Shaw, S.; Nihal, M.; Ahmad, N. Dose translation from animal to human studies revisited. FASEB J. 2007, 22, 659–661. [Google Scholar] [CrossRef] [PubMed]
- Schwarz, R.; Kaspar, A.; Seelig, J.; Künnecke, B. Gastrointestinal transit times in mice and humans measured with27Al and19F nuclear magnetic resonance. Magn. Reson. Med. 2002, 48, 255–261. [Google Scholar] [CrossRef]


| Composition (g/100g Mix) | Whey | Vegan Mix | Worm Protein | |||
|---|---|---|---|---|---|---|
| Protein | 80.0 | 78.0 | 61.7 | |||
| Fat | 6.7 | 0.9 | 24.3 | |||
| Carbohydrate | 5.0 | 3.2 | 8.0 | |||
| AA profile (g/100g) | 100 g AA | 100 g mix | 100 g AA | 100 g mix | 100 g AA | 100 g mix |
| Lysine | 9.24 | 7.39 | 6.60 | 5.15 | 7.08 | 4.05 |
| Histidine | 1.89 | 1.51 | 2.40 | 1.87 | 3.58 | 2.05 |
| Methionine | 2.01 | 1.61 | 1.60 | 1.25 | 1.50 | 0.86 |
| Phenylanine | 3.10 | 2.48 | 5.30 | 4.13 | 4.72 | 2.70 |
| Threonine | 6.68 | 5.34 | 3.40 | 2.65 | 4.37 | 2.50 |
| leucine | 10.43 | 8.34 | 8.30 | 6.47 | 7.20 | 4.12 |
| Isoleucine | 6.31 | 5.05 | 4.30 | 3.35 | 4.61 | 2.64 |
| Valine | 5.80 | 4.64 | 5.30 | 4.13 | 6.08 | 3.48 |
| Alanine | 4.93 | 3.94 | 4.40 | 3.43 | 7.08 | 4.05 |
| Arginine | 2.38 | 1.90 | 8.60 | 6.71 | 5.80 | 3.32 |
| Aspartic Acid | 10.74 | 8.59 | 11.20 | 8.74 | 9.67 | 5.53 |
| Glycine | 1.75 | 1.40 | 4.10 | 3.20 | 4.95 | 2.83 |
| Glutamic Acid | 17.73 | 14.18 | 19.10 | 14.90 | 12.50 | 7.15 |
| Cystine | 1.87 | 1.50 | 1.80 | 1.40 | 0.94 | 0.54 |
| Proline | 6.27 | 5.02 | 4.00 | 3.12 | 6.33 | 3.62 |
| Serine | 4.55 | 3.64 | 5.00 | 3.90 | 4.53 | 2.59 |
| Tyrosine | 2.88 | 2.30 | 3.60 | 2.81 | 7.80 | 4.46 |
| Tryptophan | 1.45 | 1.16 | 1.10 | 0.86 | 1.26 | 0.72 |
| Amount gavaged (g·kg−1) | Saline | Whey | Vegan Mix | Vegan Mix++ | Worm | |
| Total protein | 0 | 4.57 | 4.57 | 5.48 | 4.57 | |
| Leucine | 0 | 0.48 | 0.38 | 0.48 | 0.30 | |
| 0 min | 30 min | 60 min | 105 min | 150 min | |||||||||||||||||||||
|---|---|---|---|---|---|---|---|---|---|---|---|---|---|---|---|---|---|---|---|---|---|---|---|---|---|
| Saline | Whey | Vegan Mix | Vegan Mix++ | Worm | Saline | Whey | Vegan Mix | Vegan Mix++ | Worm | Saline | Whey | Vegan Mix | Vegan Mix++ | Worm | Saline | Whey | Vegan Mix | Vegan Mix++ | Worm | Saline | Whey | Vegan Mix | Vegan Mix++ | Worm | |
| Essential AA (µM) n = 5 | |||||||||||||||||||||||||
| Lysine | 229.4 ± 22.5 | 253.2 ± 15.5 | 267.4 ± 20.2 | 211.7 ± 19.1 | 216.9 ± 15.9 | 396.5 ± 65.3 | 840.6 ± 167.3 a | 635.8 ± 122.0 a | 643.1 ± 88.5 a | 477.8 ± 45.2 bd | 505.7 ± 128.6 | 938.9 ± 201.5 a | 664.9 ± 70.3 a | 663.0 ± 61.8 a | 446.0 ± 41.8 bcd | 301.4 ± 45.2 | 1014.1 ± 452.1 | 580.2 ± 7.1 | 410.1 ± 34.0 | 435.2 ± 50.1 | 304.5 ± 42.2 | 399.4 ± 73.5 | 332.9 ± 25.3 | 294.9 ± 25.1 | 308.9 ± 18.0 |
| Histidine | 47.9 ± 4.6 | 59.2 ± 5.6 | 69.0 ± 5.3 | 56.3 ± 4.7 | 51.6 ± 3.3 | 65.5 ± 5.0 | 75.5 ± 12.5 | 78.2 ± 4.2 | 80.4 ± 10.7 | 74.9 ± 4.2 | 94.8 ± 17.0 | 95.7 ± 17.4 | 98.9 ± 2.4 | 96.0 ± 13.5 | 79.0 ± 3.5 c | 72.0 ± 6.0 | 125.3 ± 18.6 | 90.1 ± 8.0 | 76.8 ± 8.1 | 84.4 ± 9.0 | 84.1 ± 14.1 | 73.4 ± 4.3 | 64.3 ± 4.8 | 66.2 ± 4.8 | 65.5 ± 1.9 |
| Methionine | 56.7 ± 7.7 | 53.7 ± 3.7 | 61.7 ± 7.0 | 46.8 ± 4.8 | 44.6 ± 6.7 | 64.1 ± 3.1 | 124.4 ± 29.1 a | 83.9 ± 15.2 b | 78.8 ± 15.3 b | 71.9 ± 5.6 | 64.0 ± 1.9 | 128.8 ± 32.0 a | 66.3 ± 10.1 b | 56.9 ± 8.9 b | 70.1 ± 6.0 b | 44.5 ± 5.0 | 119.3 ± 30.0 a | 62.1 ± 3.7 b | 44.4 ± 0.2 b | 56.2 ± 6.0 b | 39.4 ± 1.9 | 39.9 ± 2.6 | 34.3 ± 2.1 | 31.5 ± 1.2 | 37.4 ± 2.0 |
| Phenyalanine | 114.7 ± 6.7 | 139.8 ± 4.2 | 132.7 ± 16.2 | 116.8 ± 9.9 | 115.1 ± 6.1 | 173.4 ± 15.2 | 231.4 ± 28.2 a | 231.0 ± 13.4 a | 246.5 ± 7.8 a | 214.1 ± 10.2 ad | 193.1 ± 9.0 | 226.6 ± 30.7 | 241.3 ± 9.9 a | 259.8 ± 11.5 a | 217.1 ± 5.9 cd | 178.7 ± 2.0 | 245.8 ± 83.6 | 234.1 ± 8.8 | 210.6 ± 4.9 | 226.6 ± 7.8 | 183.9 ± 12.0 | 170.1 ± 12.9 | 180.6 ± 8.0 | 170.7 ± 5.2 | 178.1 ± 12.1 |
| Threonine | 129.3 ± 19.7 | 136.3 ± 9.5 | 143.5 ± 22.3 | 115.4 ± 14.2 | 118.8 ± 13.2 | 183.3 ± 8.7 | 376.3 ± 83.2 a | 287.8 ± 53.1 a | 268.3 ± 49.1 a | 217.4 ± 22.4 b | 232.0 ± 29.3 | 455.9 ± 96.4 a | 294.1 ± 22.9 | 266.9 ± 29.2 b | 215.5 ± 22.4 bc | 145.0 ± 19.5 | 479.1 ± 176.2 | 259.8 ± 14.6 | 187.7 ± 7.6 | 192.3 ± 8.0 | 143.6 ± 19.1 | 157.7 ± 22.8 | 132.3 ± 5.4 | 137.1 ± 15.9 | 122.9 ± 9.4 |
| Leucine | 48.4 ± 6.5 | 53.1 ± 1.4 | 52.4 ± 6.4 | 44.7 ± 4.9 | 42.4 ± 3.3 b | 71.6 ± 16.7 | 269.2 ± 50.5 a | 177.0 ± 44.5 a | 177.5 ± 40.0 a | 99.9 ± 4.9 b | 78.5 ± 23.7 | 241.8 ± 49.5 a | 160.6 ± 14.2 ab | 148.8 ± 13.9 ab | 99.3 ± 4.5 bcd | 63.5 ± 15.5 | 171.2 ± 46.5 a | 100.9 ± 5.5 b | 90.8 ± 8.0 b | 88.2 ± 4.9 b | 82.6 ± 12.8 | 81.7 ± 5.8 | 83.4 ± 5.8 | 73.5 ± 4.4 | 82.8 ± 5.3 |
| Isoleucine | 96.5 ± 10.4 | 104.8 ± 2.6 | 112.3 ± 9.3 | 88.6 ± 9.3 | 85.1 ± 9.3 b | 163.3 ± 28.1 | 479.7 ± 89.9 a | 310.3 ± 67.1 a | 335.9 ± 49.4 a | 210.4 ± 5.1 b | 172.9 ± 87.0 | 482.1 ± 36.2 a | 316.3 ± 27.9 ab | 293.0 ± 12.3 ab | 208.0 ± 10.9 bcd | 141.2 ± 15.2 | 401.4 ± 107.7 a | 275.4 ± 21.2 b | 194.0 ± 13.3 b | 178.2 ± 15.5 b | 176.6 ± 20.4 | 182.2 ± 9.8 | 163.8 ± 9.8 | 162.5 ± 6.3 | 159.2 ± 13.45 |
| Valine | 147.1 ± 16.5 | 159.3 ± 5.8 | 164.6 ± 14.7 | 130.2 ± 13.2 | 128.5 ± 10.3 | 243.5 ± 42.1 b | 531.2 ± 116 a | 409.9 ± 79.5 a | 433.1 ± 51.5 a | 328.2 ± 23.7 | 333.8 ± 94.7 | 658.7 ± 113 a | 467.3 ± 60.6 a | 461.4 ± 41.4 a | 347.3 ± 34.3 b | 208.2 ± 50.1 | 657.9 ± 202 a | 411.7 ± 4.8 | 300.8 ± 16.8 | 304.0 ± 20.3 | 239.9 ± 32.4 | 289.9 ± 16.2 | 256.3 ± 21.0 | 257.5 ± 6.3 | 262.6 ± 13.4 |
| Non-essential AA (µM) | |||||||||||||||||||||||||
| Alanine | 205. ± 23.4 | 213.2 ± 15.6 | 228.8 ± 29.0 | 170.0 ± 18.8 | 197.6 ± 18.6 | 263.8 ± 19.7 | 364.7 ± 73.9 | 350.1 ± 35.2 | 336.9 ± 43.3 | 305.9 ± 21.0 | 372.5 ± 59.3 | 412.6 ± 71.8 | 374.1 ± 18.1 | 389.0 ± 48.3 | 325.9 ± 21.9 | 221.7 ± 20.3 | 420.3 ± 170.3 | 357.3 ± 67.5 | 287.2 ± 22.6 | 306.3 ± 19.2 | 219.8 ± 29.5 | 204.6 ± 15.3 | 199.0 ± 4.5 | 228.7 ± 28.5 | 223.0 ± 20.3 |
| Arginine | 85.9 ± 10.4 | 90.9 ± 7.2 | 94.6 ± 7.0 | 69.4 ± 5.3 | 84.8 ± 4.5 | 106.4 ± 29.8 | 144.4 ± 21.9 | 172.3 ± 29.4 a | 168.2 ± 7.8 | 127.7 ± 15.1 d | 113.2 ± 26.1 | 155.1 ± 37.3 | 152.2 ± 26.2 | 176.3 ± 25.9 | 109.5 ± 8.2 d | 48.7 ± 16.2 | 121.2 ± 23.5 | 157.8 ± 39.4 | 135.5 ± 29.8 | 104.8 ± 10.2 | 46.9 ± 14.2 | 25.9 ± 7.9 | 35.2 ± 8.2 | 34.0 ± 7.5 | 24.4 ± 4.7 |
| Aspartate | 70.2 ± 14.7 | 81.0 ± 10.8 | 82.7 ± 15.1 | 72.2 ± 8.6 | 78.9 ± 20.7 | 68.0 ± 11.5 | 130.0 ± 41.6 a | 84.1 ± 15.0 | 106.7 ± 18.6 | 65.4 ± 11.2 | 93.4 ± 33.8 | 133.7 ± 35.8 a | 95.4 ± 8.1 | 106.6 ± 18.9 | 81.4 ± 13.3 | 52.3 ± 25.6 | 128.2 ± 35.5 a | 85.5 ± 16.4 | 97.7 ± 15.9 | 76.8 ± 17.9 | 36.3 ± 14.8 | 23.1 ± 8.9 | 19.1 ± 4.2 | 15.2 ± 4.1 | 17.6 ± 2.0 |
| Cysteine | 1.1 ± 0.4 | 0.5 ± 0.2 | 0.7 ± 0.3 | 0.4 ± 0.2 | 0.9 ± 0.5 | 2.4 ± 1.4 a | 1.3 ± 0.6 | 1.0 ± 0.5 | 1.3 ± 0.3 | 2.2 ± 1.1 | 1.4 ± 0.6 | 4.9 ± 3.3 a | 1.7 ± 0.4 | 1.5 ± 0.3 | 1.5 ± 0.3 | 3.0 ± 0.1 | 6.3 ± 3.8 | 1.5 ± 0.3 | 1.5 ± 0.8 | 1.4 ± 0.5 | 2.3 ± 0.5 | 2.0 ± 0.3 | 3.0 ± 1.1 | 2.1 ± 0.3 | 3.3 ± 0.8 |
| Glutamine | 84.2 ± 12.6 | 98.0 ± 19.2 | 95.8 ± 10.7 | 88.5 ± 7.9 | 71.8 ± 11.7 | 75.8 ± 11.3 | 159.1 ± 75.2 a | 125.8 ± 21.8 a | 126.6 ± 16.0 a | 88.9 ± 11.2 | 137.2 ± 42.0 | 201.3 ± 67.9 a | 130.2 ± 11.7 b | 162.9 ± 30.4 b | 113.2 ± 32.3 | 64.2 ± 18.3 | 225.1 ± 75.6 | 189.3 ± 71.0 | 181.3 ± 42.1 | 142.0 ± 23.6 | 44.6 ± 11.0 | 25.6 ± 2.0 | 27.7 ± 3.1 | 27.6 ± 4.6 | 28.9 ± 3.7 |
| Glycine | 1.1 ± 0.4 | 0.5 ± 0.2 | 0.7 ± 0.3 | 0.4 ± 0.2 | 0.9 ± 0.5 | 2.4 ± 1.4 a | 1.3 ± 0.6 | 1.0 ± 0.5 | 1.3 ± 0.3 | 2.2 ± 1.1 | 1.4 ± 0.6 | 4.9 ± 3.3 a | 1.7 ± 0.4 | 1.5 ± 0.3 | 1.5 ± 0.3 | 3.0 ± 0.2 | 6.3 ± 3.8 | 1.5 ± 0.3 | 1.5 ± 0.8 | 1.4 ± 0.5 | 2.3 ± 0.5 | 2.0 ± 0.3 | 3.0 ± 1.0 | 2.1 ± 0.3 | 3.3 ± 0.3 |
| Proline | 71.2 ± 6.6 | 76.4 ± 2.9 | 83.1 ± 12.5 | 62.6 ± 5.8 | 67.6 ± 5.6 | 103.7 ± 12.8 | 176.0 ± 32.4 | 147.3 ± 15.9 | 153.4 ± 24.5 | 149.1 ± 11.9 | 148.8 ± 26.9 | 176.2 ± 60.2 | 150.2 ± 6.8 | 163.6 ± 23.4 | 141.0 ± 7.7 | 69.2 ± 20.2 | 192.5 87.5± | 137.1 ± 27.1 | 110.6 ± 11.9 | 130.4 ± 8.2 | 62.7 ± 12.0 | 51.2 ± 3.5 | 52.4 ± 4.6 | 51.8 ± 4.4 | 55.3 ± 4.8 |
| Serine | 80.9 ± 10.2 | 98.5 ± 12.6+ | 92.9 ± 14.7 | 82.9 ± 11.8 | 88.3 ± 15.2 | 98.6 ± 4.9 | 127.6 ± 18.7 a | 122.6 ± 6.5 a | 126.6 ± 15.3 a | 106.6 ± 5.3 | 161.4 ± 30.5 | 154.1 ± 49.6 | 143.6 ± 11.4 | 161.6 ± 26.8 | 130.3 ± 19.1 | 80.4 ± 8.0 | 201.1 ± 80.5 | 162.4 ± 49.8 | 141.6 ± 19.2 | 132.2 ± 11.2 | 101.2 ± 29.3 | 66.2 ± 8.3 | 61.9 ± 4.5 | 62.7 ± 11.0 | 56.2 ± 4.1 |
| Tyrosine | 60.2 ± 8.0 | 63.2 ± 7.0 | 67.3 ± 11.4 | 56.2 ± 8.7 | 53.4 ± 7.9 | 119.0 ± 20.9 | 231.5 ± 44.6 a | 192.6 ± 31.9 a | 209.9 ± 16.4 a | 176.1 ± 11.0 a | 130.6 ± 44.6 | 265.8 ± 63.7 | 189.6 ± 32.8 | 196.7 ± 19.2 | 175.2 ± 12.0 | 62.7 ± 12.1 | 212.8 ± 134.0 | 152.5 ± 37.5 | 94.5 ± 1.4 | 145.1 ± 45.2 | 66.2 ± 13.7 | 62.2 ± 14.0 | 62.6 ± 8.1 | 57.8 ± 6.3 | 76.9 ± 11.2 |
Publisher’s Note: MDPI stays neutral with regard to jurisdictional claims in published maps and institutional affiliations. |
© 2021 by the authors. Licensee MDPI, Basel, Switzerland. This article is an open access article distributed under the terms and conditions of the Creative Commons Attribution (CC BY) license (https://creativecommons.org/licenses/by/4.0/).
Share and Cite
D’Hulst, G.; Masschelein, E.; De Bock, K. Dampened Muscle mTORC1 Response Following Ingestion of High-Quality Plant-Based Protein and Insect Protein Compared to Whey. Nutrients 2021, 13, 1396. https://doi.org/10.3390/nu13051396
D’Hulst G, Masschelein E, De Bock K. Dampened Muscle mTORC1 Response Following Ingestion of High-Quality Plant-Based Protein and Insect Protein Compared to Whey. Nutrients. 2021; 13(5):1396. https://doi.org/10.3390/nu13051396
Chicago/Turabian StyleD’Hulst, Gommaar, Evi Masschelein, and Katrien De Bock. 2021. "Dampened Muscle mTORC1 Response Following Ingestion of High-Quality Plant-Based Protein and Insect Protein Compared to Whey" Nutrients 13, no. 5: 1396. https://doi.org/10.3390/nu13051396
APA StyleD’Hulst, G., Masschelein, E., & De Bock, K. (2021). Dampened Muscle mTORC1 Response Following Ingestion of High-Quality Plant-Based Protein and Insect Protein Compared to Whey. Nutrients, 13(5), 1396. https://doi.org/10.3390/nu13051396