Article

Olfactory Function in Patients with Inflammatory Bowel Disease (IBD) Is Associated with Their Body Mass Index and Polymorphism in the Odor Binding-Protein (OBPIIa) Gene

1
Department of Biomedical Sciences, University of Cagliari, Monserrato, 09042 Cagliari, Italy
2
Department of Medical Sciences and Public Health, University of Cagliari, Presidio Policlinico of Monserrato, 09042 Cagliari, Italy
3
Smell and Taste Clinic, Department of Otorhinolaryngology, TU Dresden, 01067 Dresden, Germany
*
Author to whom correspondence should be addressed.
Nutrients 2021, 13(2), 703; https://doi.org/10.3390/nu13020703
Submission received: 25 January 2021 / Revised: 9 February 2021 / Accepted: 19 February 2021 / Published: 22 February 2021
(This article belongs to the Section Nutrition and Public Health)

Abstract

:
Smell strongly contributes to food choice and intake, influencing energy balance and body weight; its reduction or loss has been related to malnutrition problems. Some patients with inflammatory bowel disease (IBD), mainly Crohn’s disease (CD) and ulcerative colitis (UC), are underweight, while others are overweight. Some studies suggest that changes in eating habits could be linked to specific disorders of the olfactory functions. We assessed the olfactory performance in 199 subjects (healthy control (HC) n = 99, IBD n = 100), based on the olfactory Threshold, Discrimination and Identification score (TDI score), measured with the “Sniffin’ Sticks” test. Subjects were genotyped for the rs2590498 polymorphism of the OBPIIa gene. IBD patients showed both a slightly, but significantly, lower olfactory function and a higher BMI compared to HC subjects. Threshold (in both population) and Discrimination (in IBD patients) olfactory score were affected by the OBPIIa genotype. BMI was influenced by both health status and OBPIIa genotype. A lower olfactory function may delay the satiety sensation and thus increase meal duration and body weight in IBD patients. However, the AA genotype of the OBPIIa seems to “protect” IBD patients from more severe olfactory dysfunction.

1. Introduction

The olfactory system is traditionally responsible for the perception of volatile chemicals, odorous compounds or odorants, providing information from the external environment, and recently, it is becoming widely considered a sensor of the internal environment to the individual [1]. The sense of smell plays a critical role in various aspects of human life, and its important functions can be grouped into three broad categories: avoidance of environmental hazards, social communication and ingestive behavior [2]. Olfaction draws attention to warning signs, such as predators, fire, smoke, toxic substances or poisons and spoiled food [3,4]; it impacts reproductive behavior [5,6,7,8,9]; it affects interpersonal communication, such as between a mother and her baby [10]; it contributes to the localization, choice and intake of food, and it modulates appetite [2,11,12,13,14,15,16,17,18,19].
Human perception of odors differs among individuals, and this diversity is due to both environmental and genetic factors [20,21,22,23,24]. The variations in chemosensory sensitivity can be quite large, and individuals can have high sensitivity (hyperosmia), reduced sensitivity (hyposmia), general and/or partial inability to perceive odorants or a specific odor (general or specific anosmia) [22,23,25,26,27,28]. Olfactory deficits, present in about 12%–20% of the population, have a strong effect on the quality of life; people with olfactory dysfunctions report an increased number of domestic accidents, severe social insecurity, a tendency for depression and eating disorders [2,13]. In particular, people with olfactory impairment report having changed their eating behavior as they find food less flavorful and less enjoyable, have problems with cooking and often eat spoiled or burnt foods [12,29,30].
Progressive loss of smell is associated with the presence of chronic diseases, such as hypertension, neurodegenerative diseases (Parkinson’s, Alzheimer’s), depression and obesity [31,32,33,34]. Furthermore, recent studies have highlighted a relationship between olfactory function and autoimmune/inflammatory diseases, such as rheumatoid arthritis, psoriasis, myastenia gravis, Sjogren’s syndrome and inflammatory bowel diseases [35,36,37,38,39,40,41].
Crohn’s disease (CD) and ulcerative colitis (UC) are the major clinical manifestations of gastrointestinal diseases known as inflammatory bowel diseases (IBD) [36,42,43,44,45]. The precise etiology of IBD is not yet fully understood, but several studies have shown that interactions between genetic and environmental factors are associated with this pathogenesis [46,47,48,49,50,51]. Since the incidence of IBD is higher in Western countries and, in recent decades, it has also been increasing in countries, such as China and India, as a consequence of the industrialization and westernization of lifestyle, it is believed that environmental exposure is the factor of more significant risk for developing IBD [43,44,52,53]. Environmental risk factors in the pathogenesis of IBD patients include smoking, oral contraceptives, stress, appendectomy and dietary changes [54,55]. Among these factors, it seems that the diet has a prominent role, by way of a mechanism not well defined [56]. Sugihara and collaborators [43] report that the nutrients in the diet are known to have an impact on the health of individuals, through complex interactions with the intestinal immune system; therefore, a well-balanced diet is crucial for good health. In agreement, the consumption of foods low in fiber, high in refined sugars and animal fats has been observed to increase the risk of IBD [56,57,58]. Similar food preferences have been found in individuals with hyposmia (i.e., reduced olfactory function), who show a higher consumption of sugars, fats and salt to make meals more palatable and thus compensate for the less flavorful and enjoyable sensation resulting from the reduced olfactory sensitivity [12,30,36].
Given the importance that olfactory performance plays in the dietary behavior and food choices of individuals, the main objective of this study was to assess the olfactory function in IBD patients and in a control group of healthy subjects (HC), who were age- and gender-matched. Since both weight loss and weight gain have been observed in IBD patients [36,59] and reported as a consequence of a loss of olfactory function [30], we evaluated differences in body mass index (BMI) between IBD patients and HC subjects, also according to their olfactory function. Finally, as the physiological variations of olfactory performance can be attributed, at least partially, to the rs2590498 (A/G) polymorphism of the gene encoding for human odorant binding protein (hOBPIIa) [24,60,61], we investigated the role of this polymorphism in the olfactory function of IBD patients and HC subjects, also according to their BMI.

2. Materials and Methods

2.1. Subjects

One hundred and ninety-nine Caucasian volunteers were recruited in the metropolitan area of Cagliari (Sardinia, Italy) and were divided into two groups. The first group was represented by the Inflammatory Bowel disease (IBD) patients (n = 100; 54 men, 46 women; age 51.2 ± 1.41 year), recruited for the study at the clinic of the Gastroenterology Unit of the University Hospital Company (AOU) Monserrato (CA), Italy and included Crohn’s disease (CD) (n = 44) and ulcerative colitis (UC) patients (n = 56); the second group included healthy control (HC) subjects (n = 99; 59 men, 40 women; age 47.3 ± 1.42 year) recruited by means of a public announcement at the local University, so as to have two populations matched for age (χ2 = 4.33, p = 0.12) and gender (χ2 = 0.64, p = 0.43). IBD diagnosis was obtained by a combination of clinical examination, endoscopy and radiology, and by means of the Crohn’s Disease Activity Index (CDAI) and Partial Mayo Score (PMS), the disease activity was evaluated for CD and UC patients, respectively [62]. All tested patients with CD and UC were recovering from the disease and were treated with cortisone or mesalamine or 5-ASA agents or monoclonal antibodies against TNF-α. BMI of IBD patients was stable and did not change over time due to disease remission conditions. For all HC subjects and IBD patients, exclusion criteria were diabetes, major systemic diseases, pregnancy or lactation, use of medicines interfering with smell perception, head trauma, sinusitis or nasal septum disorders. Prior to testing, controls and patients were asked if they had a cold or had any allergic reactions, in which case they were discarded. All subjects were free of perfumes and fasted for at least 2 hours prior to testing.
The study was conducted in accordance with the Declaration of Helsinki and was approved by the Ethical Committee of the University Hospital of Cagliari. Before being tested, each subject was informed on the purpose of the study and the experimental procedures and was asked to sign an informed consent.

2.2. Olfactory Sensitivity Screening

The standardized “Sniffin’ Sticks” test battery (Burghart Instruments, Wedel, Germany) comprising three subtests for olfactory threshold (T-test), olfactory discrimination (D-test) and olfactory identification (I-test) was used to evaluate the orthonasal olfactory function of individuals [63]. This test is widely used for olfactory screening, and its validity, also in the health field, is internationally recognized. Odors were presented by means of felt-tip pens: the pen cap was removed, and the pen tip was then positioned under the nose, approximately 2 cm away from the nostrils for 3 sec. During the T-test and D-test, the subject was also blindfolded or otherwise asked to keep their eyes closed in order to prevent them from learning to identify the pen containing the odor by sight [63].
For the determination of the olfactory threshold, the experimenter had 48 pens available, divided into 16 triplets, each of them consisting of two pens containing a solvent and the third soaked in a growing concentration of n-butanol. Triplets were presented in ascending order until the subject identified, for two consecutive times in the same triplet, the pen containing n-butanol. This was the starting point and represented the first reversal, that is, the point where the triplets were presented in descending dilution order of n-butanol. Each time the subject failed to recognize the target pen, the dilution order with which the triplets were presented was reversed. The experiment ended when the seventh reversal was reached, and the threshold score was given by the average of the last four reversals. Additionally, for the determination of odor discrimination, the experimenter had 16 triplets available, each formed by two pens containing the same odor and one filled with a different one (target pen). The participant’s goal was to identify the target pen. The score obtained corresponds to the number of correct answers from 0 to 16. To determine the identification of odors, 16 pens were used containing as many odors familiar to the subjects. Each pen was associated with 4 possibilities from which the subject was required to choose. The score corresponds to the number of correct identifications from 0 to 16.
During the test, the experimenter compiled a protocol in which the scores obtained for each sub-test, age, gender, height, weight and BMI were reported. The sum of the scores obtained with the T-test, D-test and I-test gave the total Threshold, Discrimination and Identification (TDI) score, by which the subjects were classified for their general olfactory performance as normosmic or hyposmic. On the basis of the score obtained with the T-test, D-test and I-test, subjects could also be classified by olfactory threshold, olfactory discrimination and olfactory identification [64].

2.3. Genetic Analysis

The “QIAamp® DNA” Mini Kit (Qiagen srl, Milan, Italy) was used to extract the DNA from the saliva samples, in accordance with the instructions. Saliva samples (approx. 2 mL) were collected from each subject in DNA- and RNA-free Eppendorf Safe-Lock tubes the day they came to the laboratories to be subjected to the olfactory tests. The purity and concentration of the DNA were estimated by measuring the optical density at the wavelength of 260 and 280 nm, respectively. Subjects were genotyped for the rs2590498 (A/G) polymorphism of the OBPIIa gene, and DNA was amplified using custom TaqMan® SNP Genotyping Assay (Applied Biosystems by Life-Technologies Italia, Europe BV). The PCR reactions were run in duplicate in a StepOnePlus™ instrument (Applied Biosystems) using the following two primers: sense primer 5′-GCCAGGCAGGGACAGA-3′ and the antisense primer 5′-CTACACCTGAGACCCCACAAG-3′. Two TaqMan probes were drawn according to the OBPIIa gene (bold and underlined), probe/reporter 1: VIC- TCGGTGACATGAACC and probe/reporter 2: FAM-TCGGTGACGTGAACC. After the PCR runs, the samples were read by a gene sequence reading system at 60 °C for 1 min, and the allelic discrimination was determined with sequence detector software (Applied Biosystems). Positive controls (whose polymorphism was already known) and no-template controls (NTC) were included in all reactions.

2.4. Data Analyses

IBD patients are represented as a single panel, because no differences were found between CD and UC patients for all statistical analyses.
Stepwise, multiple linear regression was used to determine the relative contribution of T, D and I scores as predictor variables of TDI score, in both HC subjects and IBD patients. The relative contribution of each significant variable and the semipartial correlations (sr) for each of them are reported in Table 2.
One-way ANOVA was used to analyze the effect of the health status (HC or IBD) of the subjects on the score obtained with the T-test, D-test, I-test and their sum TDI.
Two-way ANOVA was used to test for a significant interaction between health status (HC or IBD) × OBPIIa genotype on the T, D and I scores.
Two-way multivariate analysis of variance (MANOVA) was used to analyze differences of the T, D and I scores (within factors) according to the OBPIIa genotype and health status of the subjects (HC or IBD) (between factors).
Data were checked for the assumptions of homogeneity of variance and normality. Post-hoc comparisons were conducted with the Fisher’s least significant difference (LSD) test or Duncan’s test when the assumption of homogeneity of variance was violated [65,66]. Statistical analyses were performed using STATISTICA for WINDOWS (version 7.0; StatSoft Inc., Tulsa, OK, USA). P values < 0.05 were considered to be significant.
Fisher’s Exact Test was used to analyze differences in the TDI, T, D and I olfactory statuses between HC subjects and IBD patients.
Differences in genotype distribution and allele frequencies at the OBPIIa locus between HC subjects and IBD patients were analyzed by using Fisher’s method (Genepop software version 4.2; http://genepop.curtin.edu.au/genepop_op3.html) [67].

3. Results

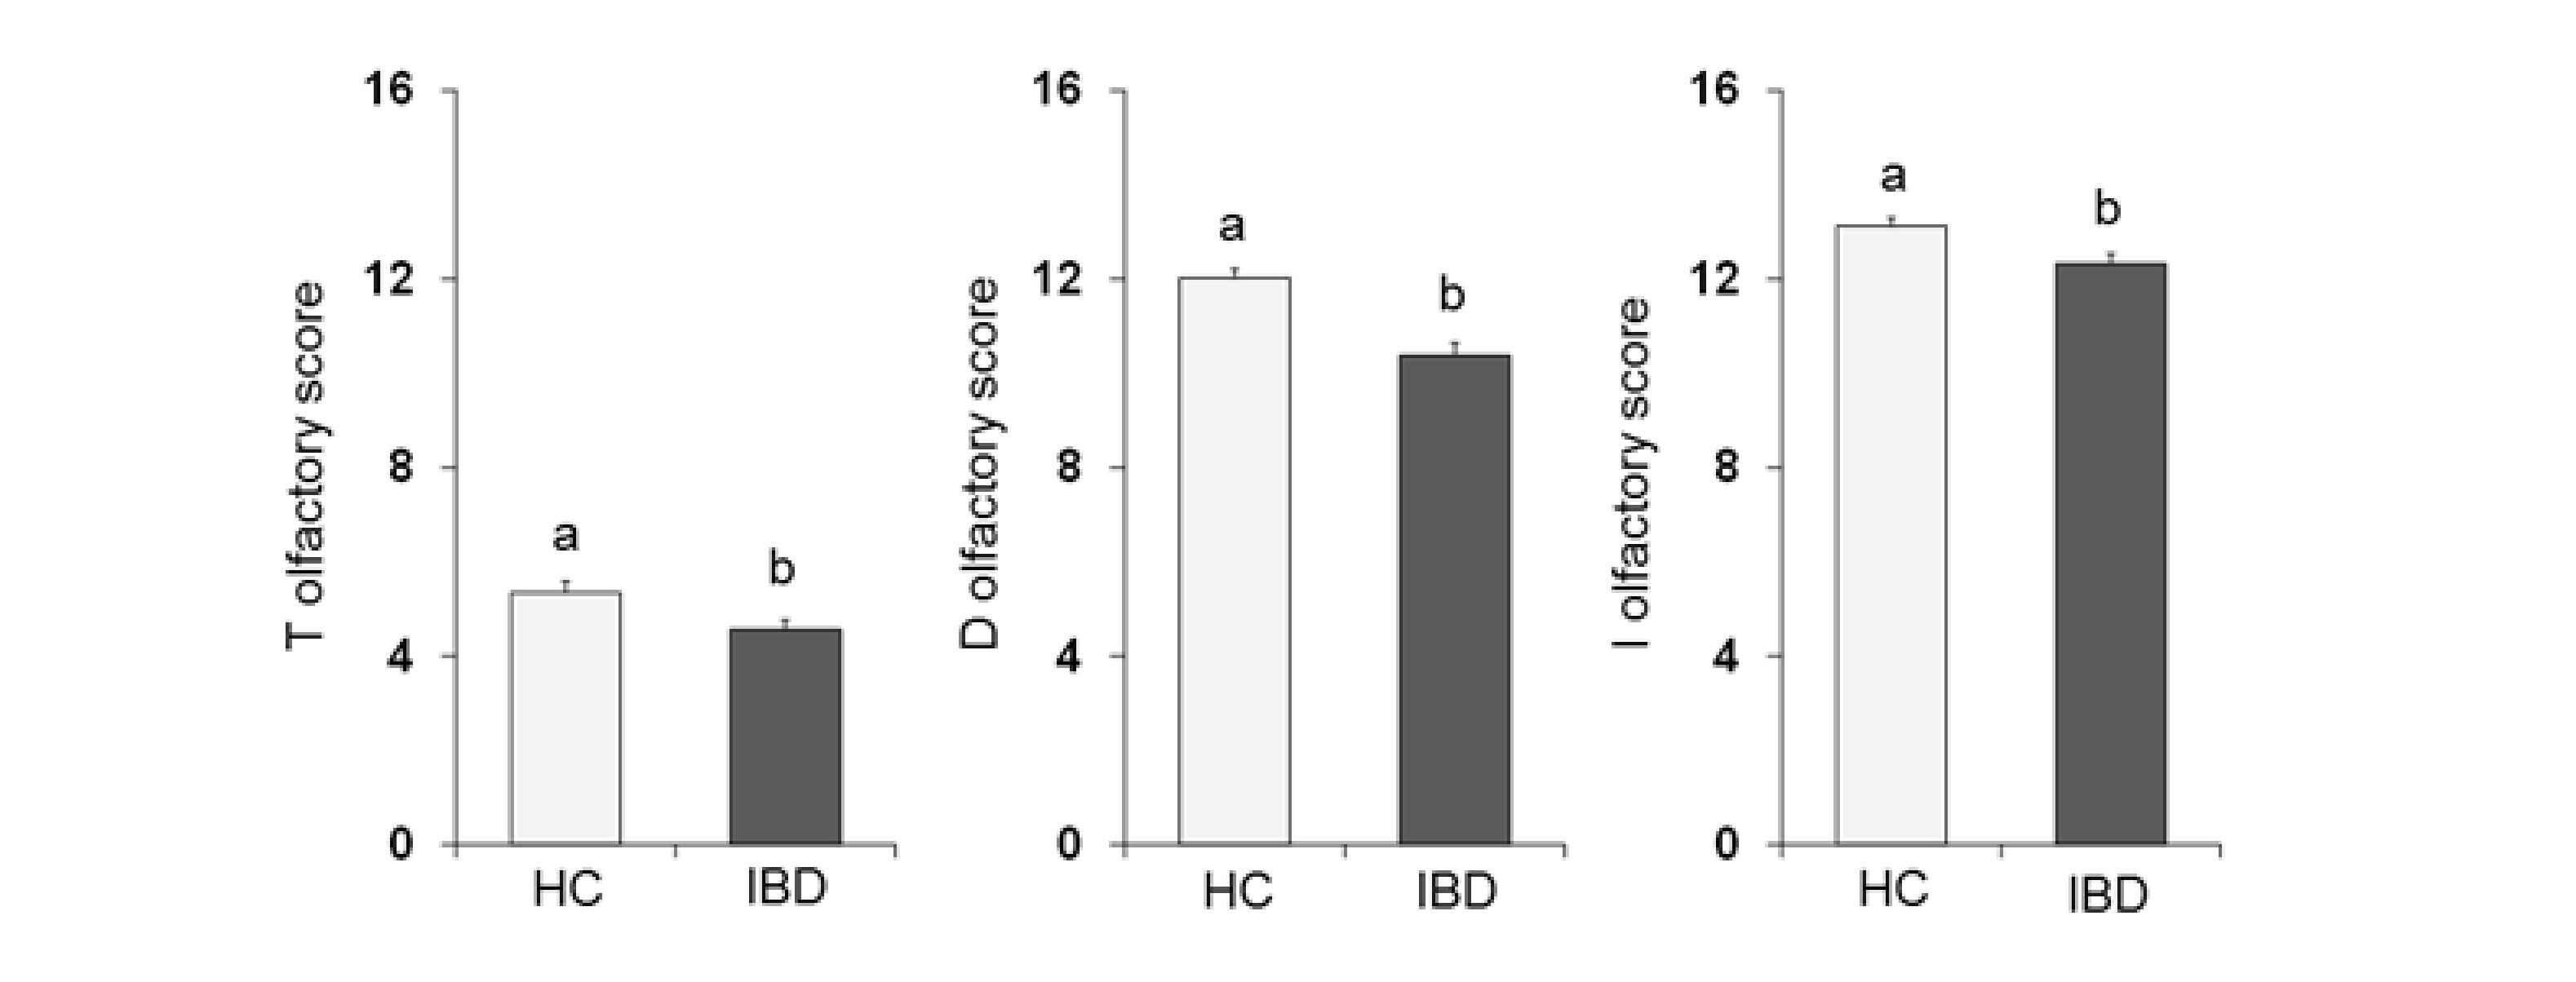
3.1. Olfactory Scores and Subjects Classification
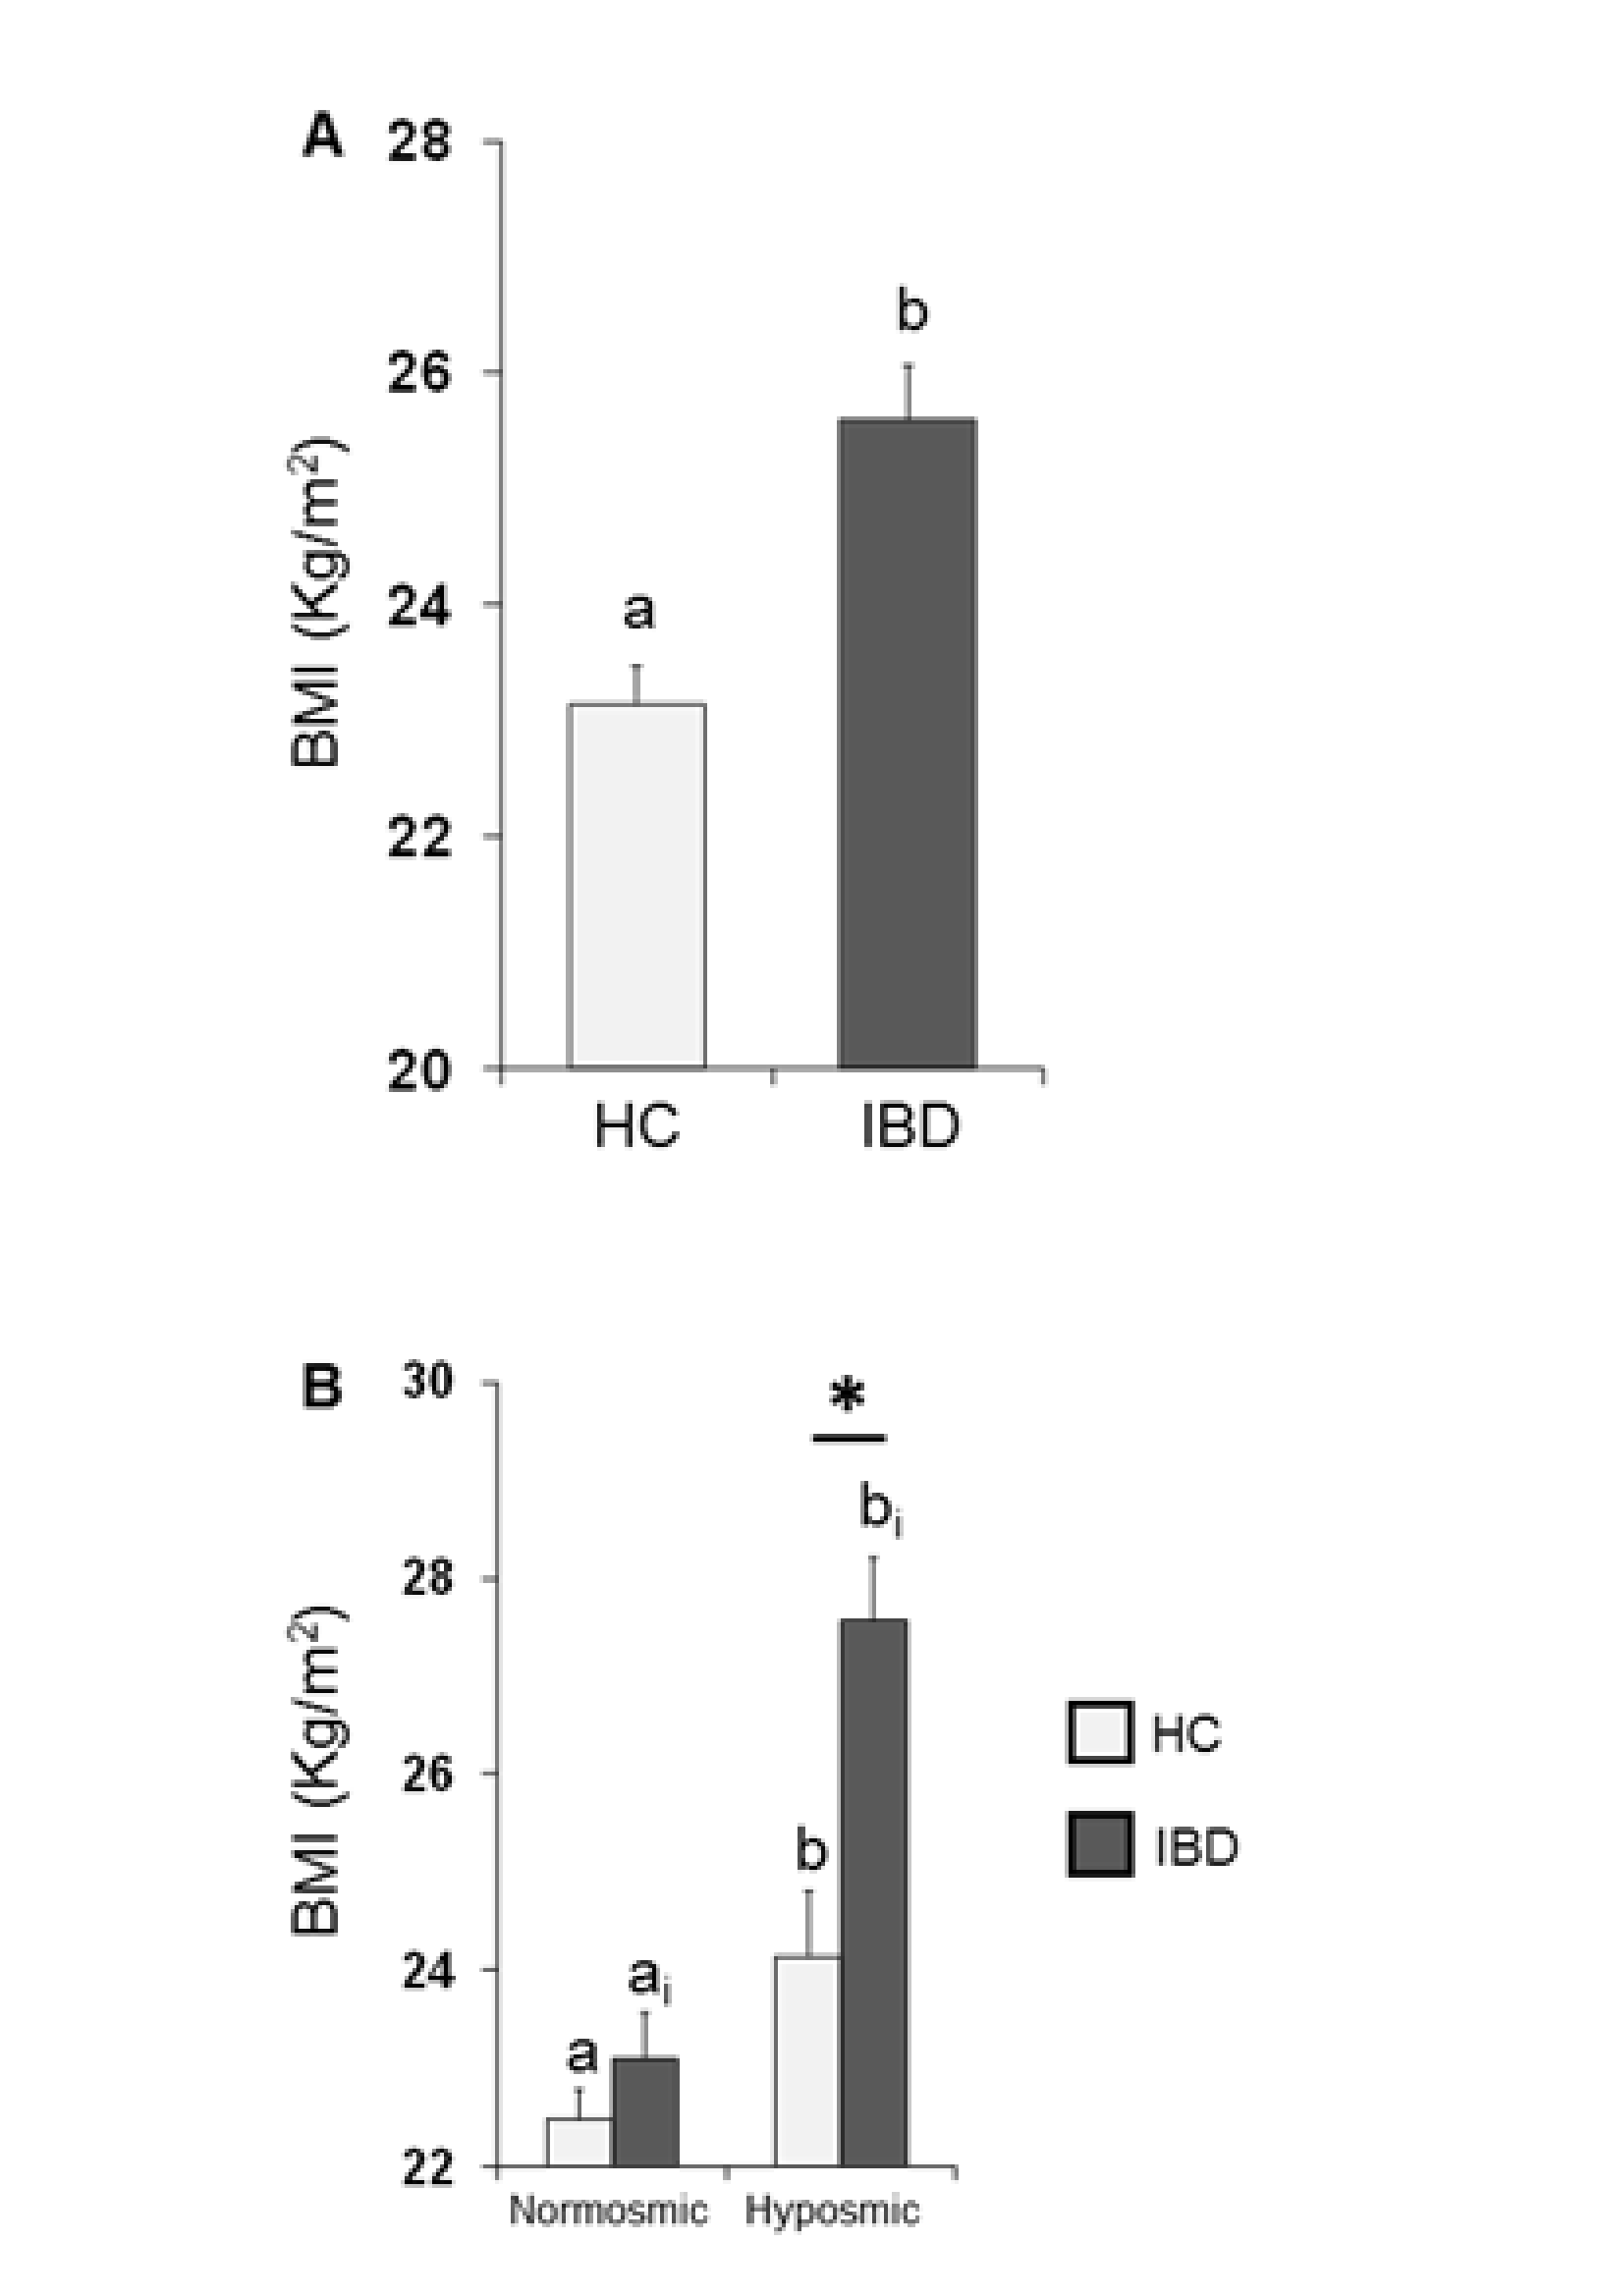
Figure 1 shows the mean values ± SE of the total TDI olfactory score obtained from each population considered: HC subjects and IBD patients. One-way ANOVA showed that the TDI score obtained by HC subjects was significantly higher than that obtained by IBD patients (F1,197 = 22.75; p < 0.001).
The percentage of subjects who were classified as normosmic or hyposmic for their TDI olfactory status in HC subjects differed from that determined for IBD patients (χ2 = 5.499, p = 0.019) (Table 1). In detail, 60.61% (n = 60) and 39.39% (n = 39) of HC subjects were, respectively, normosmic or hyposmic, while 44% and 56% of IBD patients were normosmic or hyposmic, respectively.
Table 2 shows that the relative contribution of each subtest to the TDI score was significant for both HC subjects and IBD patients, albeit in a different way. Indeed, in HC subjects, the major contributor to the model was the T score (52.05%), secondly the D score (20.90%) and finally the I score (24.20%). Instead, in IBD patients, the major contributor to the model was the score obtained with the D-test (70.33%) and, to follow, the T (17.11%) and I (12.88%) scores.
One-way ANOVA (Figure 2) showed that the olfactory score obtained by HC subjects was significantly higher than that obtained by IBD patients for the T-test (F1,197 = 6.02; p = 0.015), D-test (F1,197 = 24.28; p < 0.001) and I-test (F1,197 = 8.88; p = 0.003).
Table 3 shows the distribution of the HC subjects and IBD patients classified as normosmic or hyposmic based on their Threshold (T), Discrimination (D) and Identification (I) olfactory status. Fisher’s method evidenced that the percentage of HC subjects who were classified as normosmic or hyposmic for their D olfactory status differed from that determined in IBD patients (χ2 = 7.27, p = 0.007). Specifically, 85.86% (n = 85) and 14.14% (n = 14) of HC subjects were, respectively, normosmic or hyposmic, while in the case of IBD patients, 70% were classified as normosmic and 30% as hyposmic. No differences in percentage between subjects classified as normosmic or hyposmic on the basis of T and I olfactory status were found.

3.2. BMI Effects

The mean values ± SE of BMI determined in HC subjects and IBD patients are shown in Figure 3A. One-way ANOVA revealed that the BMI of HC subjects was significantly lower than that of IBD patients (F1,197 = 18.44; p < 0.001). Figure 3B shows the same data according to their overall olfactory status (TDI status). Two-way ANOVA highlighted significant interactions of the health state × TDI olfactory status (F1,195 = 4.84, p = 0.029); post-hoc comparisons revealed that individuals who were hyposmic showed a BMI higher than those who were normosmic (HC p = 0.032; IBD p < 0.001; Fisher’s LSD test) and that IBD patients who were hyposmic had a higher BMI than hyposmic HC subjects (p < 0.001; Fisher’s LSD test), while no difference was observed between normosmic HC and IBD individuals (p > 0.05; Fisher’s LSD test).

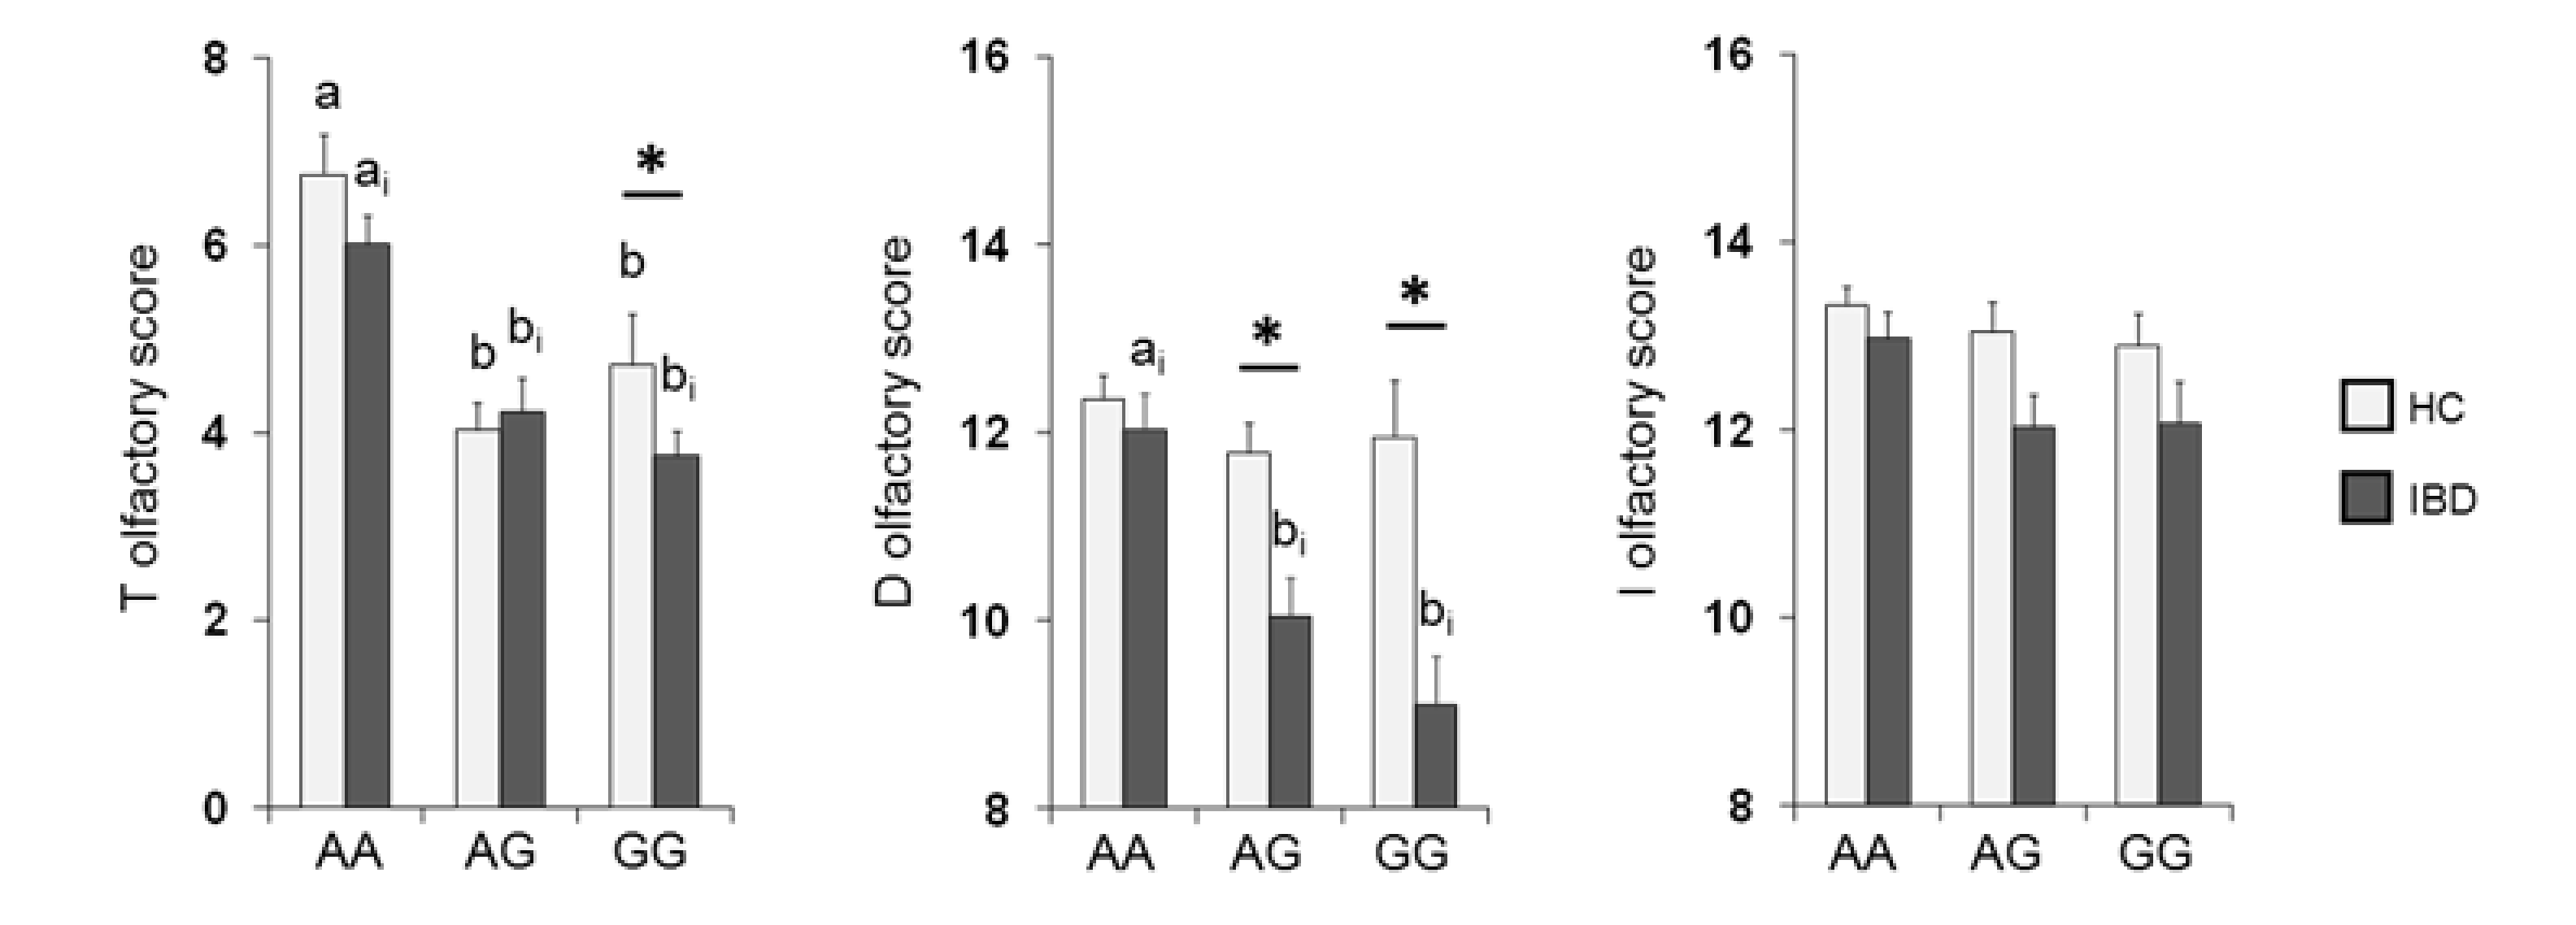
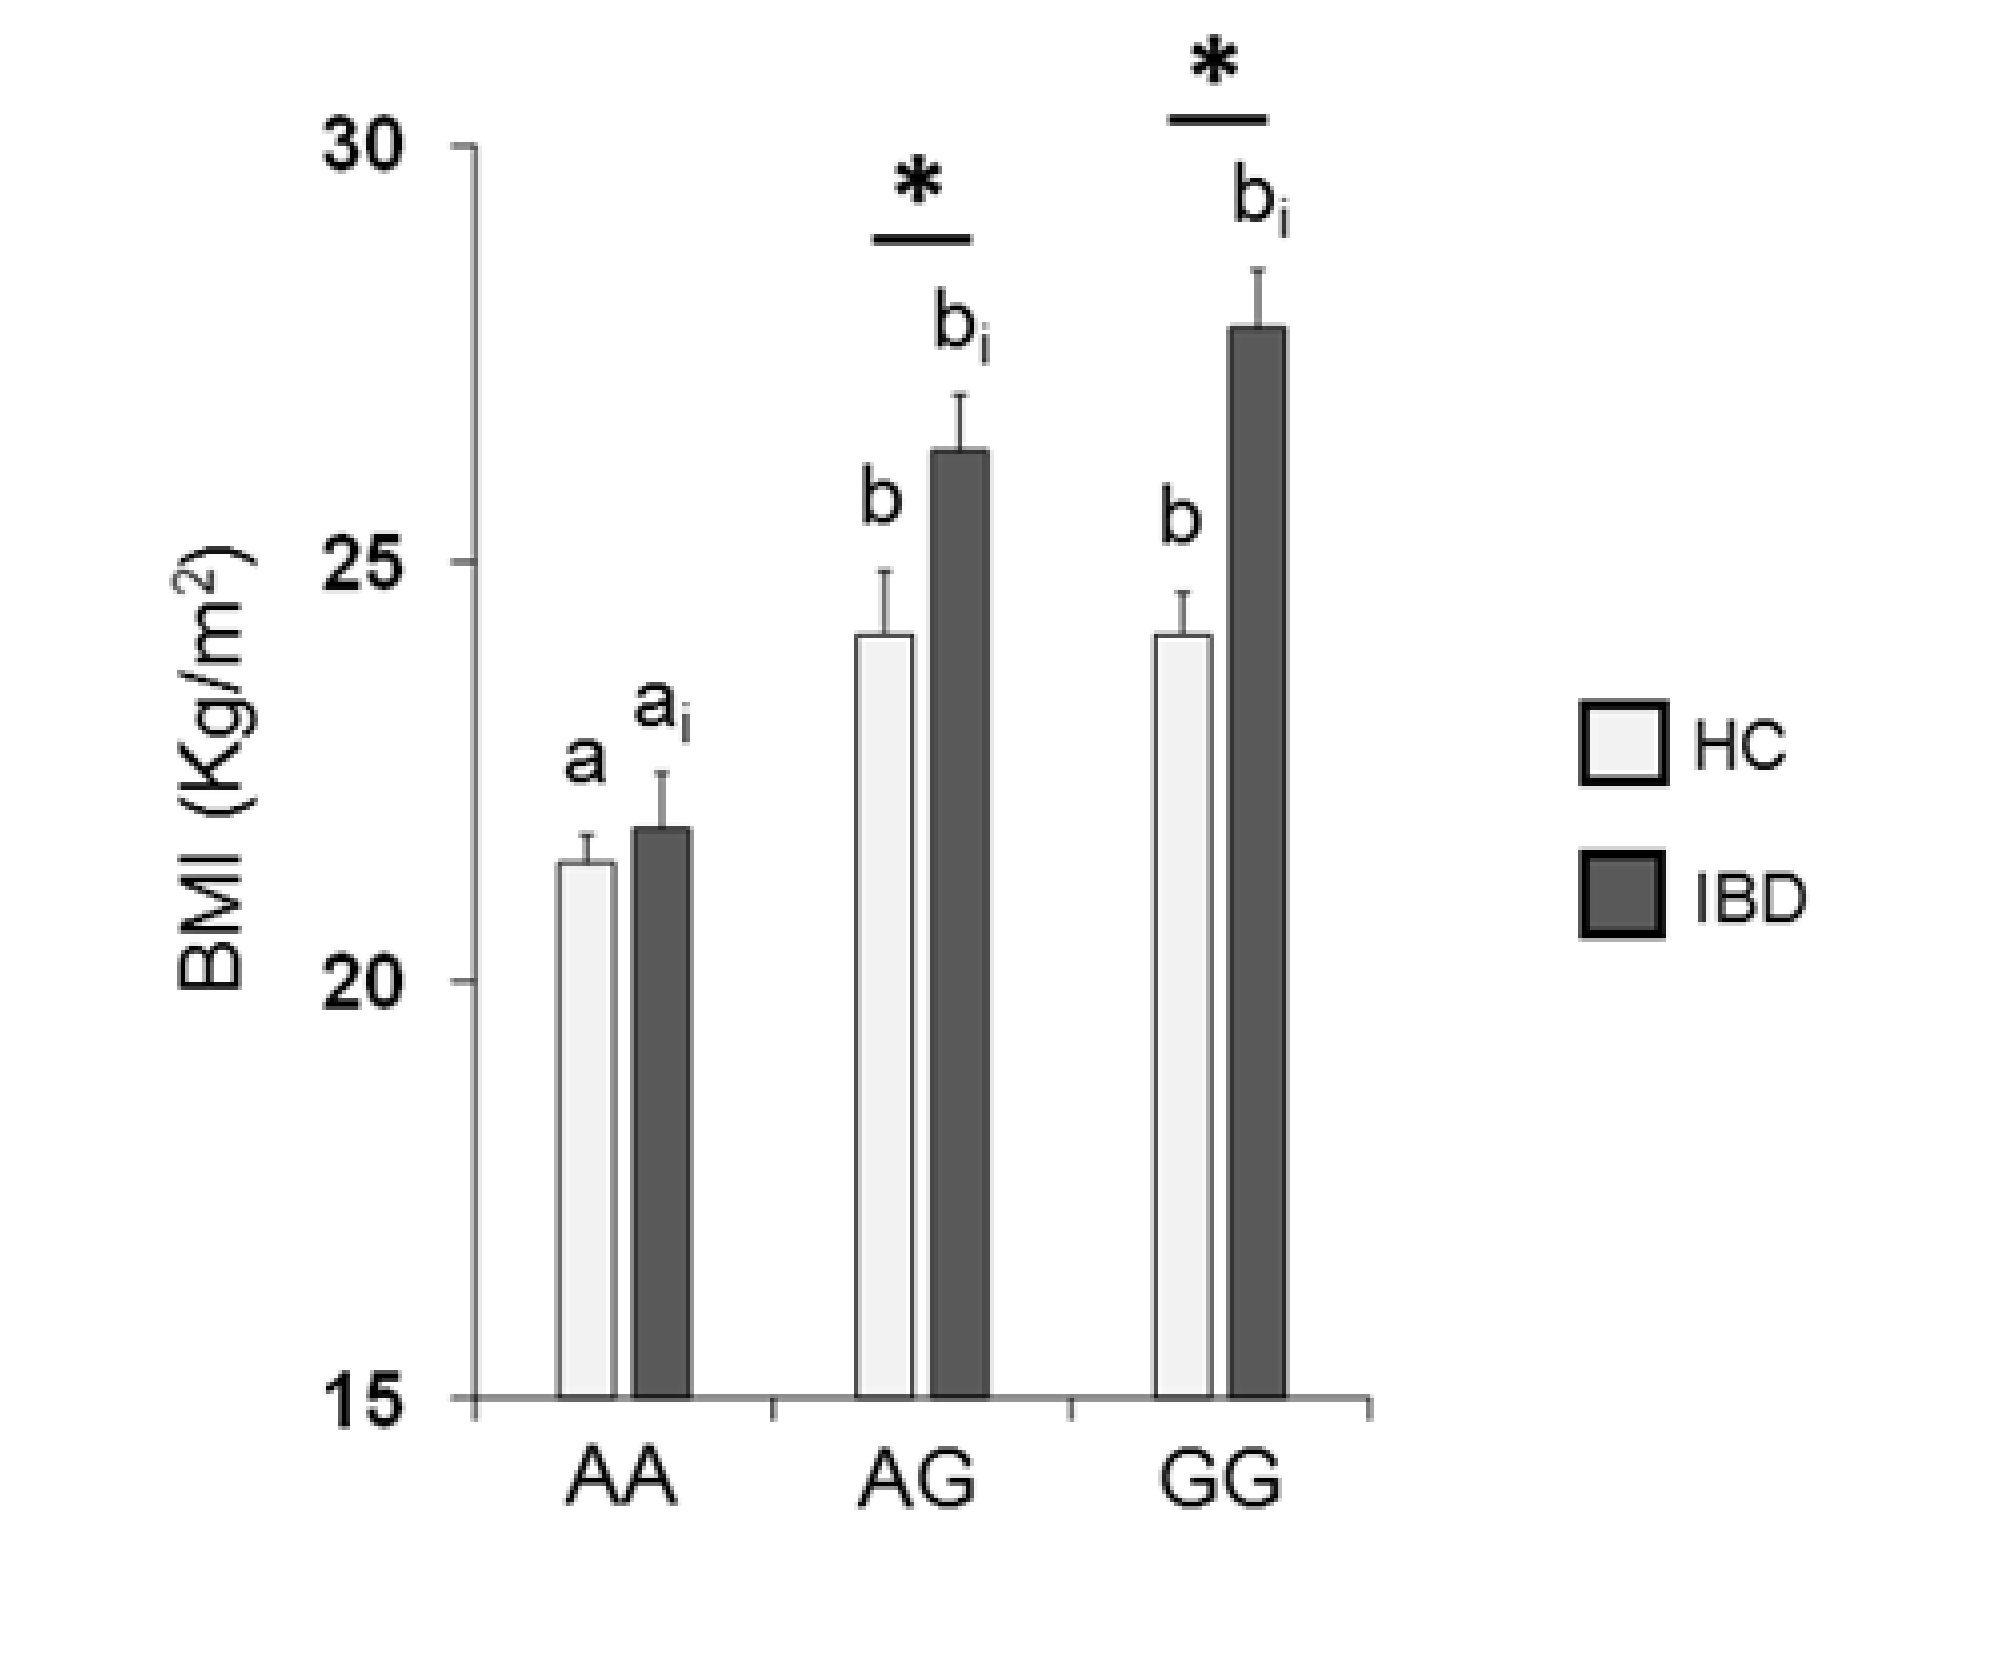
3.3. Olfactory Function and Genotyping for OBPIIa Polymorphism, rs2590498 (A/G)

Molecular analysis revealed that HC subjects and IBD patients did not differ on the basis of their genotype distribution (χ2= 0.14, p = 0.935) and allele frequency (χ2= 0.16, p = 0.924) (Table 4).
The mean values ± SE of the T, D and I scores obtained from HC subjects and IBD patients according to OBPIIa locus are shown in Figure 4. Two-way MANOVA revealed a significant interaction of the health state × OBPIIa genotypes on the T, D and I scores (F 6,382 = 2.18; p = 0.04). In detail, pairwise comparisons showed that individuals who were homozygous for the major allele A exhibited T (both in HC subjects and IBD patients) and D scores (only in IBD patients) that were statistically higher than those of heterozygous individuals (T score: p < 0.01; D score: p < 0.001; Fisher’s LSD test) or homozygous for the minor allele G (T score: p < 0.001; D score: p < 0.001; Fisher’s LSD test). In addition, we found that IBD patients who were heterozygous or GG homozygous reached significantly lower T (p = 0.024; Fisher’s LSD test) and D (p < 0.001; Fisher’s LSD test) scores than HC subjects, and IBD patients who were heterozygous reached significantly lower D scores than HC subjects (p < 0.001; Fisher’s LSD test). No other differences between HC subjects and IBD patients according to the OBPIIa genotype were found.
Figure 5 shows the mean values ± SE of BMI determined in HC subjects and IBD patients according to the rs2890498 polymorphism of the OBPIIa gene. Two-way ANOVA revealed a significant interaction of health state × OBPIIa genotype on BMI (F2,193 = 4.05, p = 0.018). For HC subjects, post-hoc comparisons indicated that subjects who were homozygous for the A-allele exhibited a lower BMI than subjects that were homozygous for the G-allele (p < 0.001; Fisher’s LSD test) or heterozygous (p = 0.008; Fisher’s LSD test). In addition, pairwise comparison revealed that IBD patients who were homozygous for the G-allele or heterozygous exhibited a higher BMI than patients that were AA homozygous (p < 0.001; Fisher’s LSD test). The BMI of HC subjects who had the GG or AG genotype was significantly lower than that of IBD patients with the same genotype (GG genotype: p < 0.001; AG genotype: p = 0.017; Fisher’s test LSD).

4. Discussion

The main goal of this study was to evaluate the olfactory function of IBD patients and compare it with that of a group of healthy control (HC) subjects. The results we obtained show that the general olfactory sensitivity of IBDs is significantly impaired when compared with HC subjects, as shown by the lower performance they reached in the total TDI score and by the increased number of hyposmic subjects. Since the TDI olfactory status depends on the abilities of olfactory threshold, odor discrimination and odor identification, we investigated which of them were compromised. The results we obtained show that IBD patients reached T, D and I values that were significantly lower than those obtained by HC subjects. We also found a significantly higher number of hyposmic subjects for the D olfactory status (30% of IBD patients were hyposmic compared to 14% of HC subjects), in accordance with the fact that the D score is the main contributor to the total TDI score obtained by IBD patients. The lower olfactory threshold scores (which means that individuals showed a higher olfactory threshold) we observed in IBD patients, as compared to controls, can be explained by the elevated levels of tumor necrosis factor (TNF-α) which were identified in the blood and intestinal mucosa of IBD patients. High levels of TNF-α have been reported to cause the loss of mature olfactory sensory neurons (OSNs) in the olfactory epithelium [45,68,69], thus affecting the olfactory threshold which, to some degree, represents the peripheral olfactory function [70,71,72]. The relationship between elevated TNF-α levels and olfactory function is supported by the data in Supplementary Figure S1, which show that HC subjects reached T olfactory scores significantly higher than IBD patients not treated with anti-TNF-α, while no difference was observed in IBD patients treated with the same drug.
While a threshold impairment has already been observed in a previous study on the olfactory performance of IBD patients [36], these are the first results highlighting an impairment in odor discrimination and odor identification, higher-order olfactory functions, that require a more pronounced involvement of cognitive factors [70,71]. IBD patients sometimes show depression [73], and some of the altered brain areas in depressed patients are essential for the processing of olfactory information [74,75,76]. Additionally, previous studies have shown a relationship between deficits in D and I olfactory ability and depression [13,77,78]. However, since none of the patients recruited for this study were on antidepressant therapy, future studies will be needed in order to better understand the relationship between IBD and impairment in odor discrimination and odor identification.
The second aim of our study was to compare the body weight of IBD patients (by calculating the BMI) with that of HC subjects, also in relation to their olfactory status. In fact, olfactory sensitivity plays a role in food choices and intake, and its impairment affects eating behavior [2,12,19,70]. Individuals with olfactory dysfunction tend to experience a lower reward from food, report that food is less flavorful and less enjoyable, and compensate for this deficiency by changing their feeding habits (e.g., eating saltier, sweeter, more spicy foods) and by decreasing their intake of low-fat foods [12,15,30]. A similar eating behavior has been observed in IBD patients, who increase their consumption of sucrose and refined carbohydrates and reduce that of fruits and vegetables [79,80]. Both individuals with olfactory dysfunction and IBD patients may display variations in body weight [12,30,36,59]. The results we obtained show that: first, the BMI of hyposmic IBD patients was significantly higher than that of hyposmic HC controls, while no statistical difference was found between normosmic IBD and normosmic controls; second, the BMI of normosmic was lower than that of hyposmic individuals in both HC subjects and IBD patients. Based on these findings, we speculate that olfactory impairment may be considered a more important factor than the disease in causing an increase in BMI. These results are in agreement with previous studies that have shown that obese adults show reduced olfactory sensitivity [81] and that a negative correlation exists between body weight and orthonasal olfactory ability [82]. The sense of smell participates in the cephalic phase responses to food, which play a direct role in regulating meal size [83], by acting on appetite and satiety [1,15,19,84]. Several studies have shown that a reduced olfactory sensitivity determines a reduced response of the cephalic phase, with a consequent delay in reaching the sense of satiety and an increase in the duration of the meal: this leads to an over-feeding of gratifying and palatable foods that causes an increase in body weight [85,86,87]. Finally, the expression of olfactory receptors (ORs) has been found in the enterochromaffin cells of the gut, and their activation by odors leads to the release of serotonin that affects gut motility and increases satiety [88,89]; this means that an increase in their threshold leads to a lower release of serotonin, a reduced sense of satiety, a higher intake of calories and longer duration of meals [36].
Individuals exhibit a physiological variability in their olfactory function due to environmental and genetic factors [20,21,22,23,24]. Recent studies on different groups of healthy subjects have shown that this variability can be, at least partially, determined by the rs2590498 (A/G) polymorphism of the OBPIIa gene, both in terms of the ability to perceive complex odors and single molecules [24,60,61]. In particular, these authors found that individuals who were homozygous for the major allele A showed a lower olfactory threshold than heterozygotes and homozygotes for the minor allele G. The results of this study show that both IBD patients and HC subjects who were homozygous AA achieved higher T-scores than heterozygous and homozygous GG and surprisingly, among IBD patients, those with the AA genotype also achieved higher scores than those with genotype AG and GG in the D-test. These results are in agreement with previous studies that report that OBPs play an important role both in carrying odorous molecules, generally lipophilic, through the mucus layer to the ORs, and in odor discrimination [90,91,92,93]. Patients with GG genotype reached a significantly lower T-score than controls with the same genotype, while no difference was observed between patients and controls with at least one A allele. This suggests that the lowest T-score obtained by patients, as shown in Figure 2, is mainly determined by GG homozygous ones. Additionally, the D olfactory performances of IBD patients carrying two sensitive alleles (AA) were not different from those of HC subjects. Similarly, recent evidence has shown that women with Parkinson’s Disease (PD) who are AA homozygous exhibit a better olfactory performance than heterozygous or GG homozygous PD women and that their olfactory scores are not different from those of HC subjects [94]. Finally, we found that both controls and patients who were homozygous for the A-allele exhibited a lower BMI than individuals who were homozygous for the G-allele or heterozygous, and patients with at least one G-allele showed a higher BMI than controls. Based on these findings, we can hypothesize the following: (a) in IBD patients, the presence of at least one sensitive allele (A) prevents the decline in the olfactory threshold compared to controls; (b) the presence of at least one G allele, on the one hand, is sufficient to impair odor discrimination, and on the other, it increases the BMI of patients compared to controls.

5. Conclusions

In conclusion, our findings show an inverse relationship between olfactory function and BMI in IBD patients. This may be partially explained by a delay in the satiety sensation and by an increase in meal duration, resulting in over-feeding on gratifying and palatable foods. In addition, the AA genotype for OBPIIa, as shown in this study for the first time, appears to protect IBD patients from both olfactory dysfunctions and BMI increases. AA individuals may better tolerate a nutritional therapy aimed at reducing the consumption of foods rich in fats and proteins, as possible treatment to improve their quality of life. Therefore, further studies will be needed to better understand the relationship between olfactory function, food selection and tolerance to nutritional therapy in IBD patients.

Supplementary Materials

The following are available online at https://www.mdpi.com/2072-6643/13/2/703/s1, Figure S1: Mean (± SE) values of the T olfactory score determined in HC subjects (n = 99), and IBD patients not treated with anti-TNF-α (A; n = 78) or IBD patients treated with anti-TNF-α (B; n = 22). One-way ANOVA revealed a significant effect of the health status on the T olfactory score in the IBD patients treated with anti-TNF-α (F1,175 = 6.02; p = 0.005), while no difference was observed between HC subjects and IBD patients not treated with anti-TNF-α(F1,119 = 0.02; p = 0.889) α. Different letters indicate a significant difference (p = 0.005, Fisher’s LSD test).

Author Contributions

Conceptualization, G.S. and R.C.; methodology, G.S., M.M. (Melania Melis), M.M. (Mariano Mastinu), D.P., F.C. and S.M.; statistical analysis, G.S.; data curation, G.S., M.M. (Melania Melis) and M.M. (Mariano Mastinu); writing—original draft preparation, G.S.; writing—review and editing, P.U., T.H., I.T.B. and R.C.; supervision, P.U., T.H., I.T.B. and R.C.; project administration, G.S.; funding acquisition, G.S., P.U., I.T.B. and R.C. All authors have read and agreed to the published version of the manuscript.

Funding

This work was supported by a grant from the University of Cagliari (Fondo Integrativo per la Ricerca, FIR 2018–2019).

Institutional Review Board Statement

The study was conducted according to the guidelines of the Declaration of Helsinki and approved by the Ethical Committee of the University Hospital of Cagliari (Prot. PG/2018/22 del 2 January 2018).

Informed Consent Statement

Informed consent was obtained from all subjects involved in the study.

Data Availability Statement

The data presented in this study are available on request from the corresponding author. The data are not publicly available due to restrictions, e.g., privacy or ethical.

Acknowledgments

The authors thank the volunteers, without contribution of whom this study would not have been possible.

Conflicts of Interest

The authors declare no conflict of interest. The funders had no role in the design of the study; in the collection, analyses, or interpretation of data; in the writing of the manuscript, or in the decision to publish the results.

References

  1. Julliard, A.K.; Al Koborssy, D.; Fadool, D.A.; Palouzier-Paulignan, B. Nutrient sensing: Another chemosensitivity of the olfactory system. Front. Physiol. 2017, 8, 468. [Google Scholar] [CrossRef] [Green Version]
  2. Stevenson, R.J. An initial evaluation of the functions of human olfaction. Chem. Senses 2010, 35, 3–20. [Google Scholar] [CrossRef] [PubMed] [Green Version]
  3. Cain, W.S.; Turk, A. Smell of danger: An analysis of LP-gas odorization. Am. Ind. Hyg. Assoc. J. 1985, 46, 115–126. [Google Scholar] [CrossRef] [PubMed]
  4. Cain, W.S.; Leaderer, B.P.; Cannon, L.; Tosun, T.; Ismail, H. Odorization of inert gas for occupational safety: Psychophysical considerations. Am. Ind. Hyg. Assoc. J. 1987, 48, 47–55. [Google Scholar] [CrossRef]
  5. Gelstein, S.; Yeshurun, Y.; Rozenkrantz, L.; Shushan, S.; Frumin, I.; Roth, Y.; Sobel, N. Human tears contain a chemosignal. Science 2011, 331, 226–230. [Google Scholar] [CrossRef] [PubMed] [Green Version]
  6. Touhara, K.; Vosshall, L.B. Sensing odorants and pheromones with chemosensory receptors. Annu. Rev. Physiol. 2009, 71, 307–332. [Google Scholar] [CrossRef]
  7. Liberles, S.D.; Buck, L. A second class of chemosensory receptors in the olfactory epithelium. Nature 2006, 442, 645–650. [Google Scholar] [CrossRef]
  8. Sollai, G.; Solari, P.; Crnjar, R. Olfactory sensitivity to major, intermediate and traces components of sex pheromone in Ceratitis capitata is related to mating and circadian rhythm. J. Insect Physiol. 2018, 110, 23–33. [Google Scholar] [CrossRef] [PubMed]
  9. Sollai, G.; Solari, P.; Crnjar, R. Differences in the Olfactory Sensitivity of Ceratitis capitata to Headspace of Some Host Plants in Relation to Sex, Mating Condition and Population. Diversity 2020, 12, 207. [Google Scholar] [CrossRef]
  10. Croy, I.; Mohr, T.; Weidner, K.; Hummel, T.; Junge-Hoffmeister, J. Mother-child bonding is associated with the maternal perception of the child’s body odor. Physiol. Behav. 2019, 198, 151–157. [Google Scholar] [CrossRef]
  11. Nordin, S. Sensory perception of food and ageing. In Food for the Ageing Population; Raats, M.M., van Staveren, W., de Groot, L., Eds.; Woodhead Publishing Limited: Cambridge, UK, 2009; pp. 73–94. [Google Scholar]
  12. Duffy, V.B.; Backstrand, J.-R.; Ferris, A.M. Olfactory dusfunction and related nutritional risk in free-living, elderly women. J. Am. Diet. Assoc. 1995, 95, 879–884. [Google Scholar] [CrossRef]
  13. Croy, I.; Nordin, S.; Hummel, T. Olfactory Disorders and Quality of Life—An Updated Review. Chem. Senses 2014, 39, 185–194. [Google Scholar] [CrossRef] [Green Version]
  14. Sorokowska, A.; Schoen, K.; Cornelia Hummel, C.; Pengfei Han, P.; Jonathan Warr, J.; Hummel, T. Food-Related Odors Activate Dopaminergic Brain Areas. Front. Hum. Neurosci. 2017, 11, 625. [Google Scholar] [CrossRef] [Green Version]
  15. Fine, L.G.; Riera, C.E. Sense of Smell as the Central Driver of Pavlovian Appetite Behavior in Mammals. Front. Physiol. 2019, 10, 1151. [Google Scholar] [CrossRef] [PubMed]
  16. Boesveldt, S.; de Graaf, K. The differential role of smell and taste for eating behavior. Perception 2017, 46, 307–319. [Google Scholar] [CrossRef] [PubMed]
  17. Morquecho-Campos, P.; Bikker, F.J.; Nazmi, K.; de Graaf, K.; Laine, M.L.; Boesveldt, S. Impact of food odors signaling specific taste qualities and macronutrient content on saliva secretion and composition. Appetite 2019, 143, 104399. [Google Scholar] [CrossRef] [PubMed]
  18. Arikawa, E.; Kaneko, N.; Nohara, K.; Yamaguchi, T.; Mitsuyama, M.; Mitsuyama, T.; Sakai, T. Influence of olfactory function on appetite and nutritional status in the elderly requiring nursing care. J. Nutr. Health Aging 2020, 24, 398–403. [Google Scholar] [CrossRef] [PubMed]
  19. Palouzier-Paulignan, B.; Lacroix, M.C.; Aime, P.; Baly, C.; Caillol, M.; Congar, P.; Julliard, A.K.; Tucker, K.; Fadool, D.A. Olfaction under metabolic influences. Chem. Senses 2012, 37, 769–797. [Google Scholar] [CrossRef] [PubMed]
  20. Cain, W.S.; Gent, J.F. Olfactory sensitivity: Reliability, generality, and association with aging. J. Exp. Psychol. Hum. Percept. Perform. 1991, 17, 382–391. [Google Scholar] [CrossRef] [PubMed]
  21. Keller, A.; Zhuang, H.; Chi, Q.; Vosshall, L.B.; Matsunami, H. Genetic variation in a human odorant receptor alters odour perception. Nature 2007, 449, 468–472. [Google Scholar] [CrossRef]
  22. Menashe, I.; Abaffy, T.; Hasin, Y.; Goshen, S.; Yahalom, V.; Luetje, C.W.; Lancet, D. Genetic elucidation of human hyperosmia to isovaleric acid. PLoS Biol. 2007, 11, e284. [Google Scholar] [CrossRef] [PubMed]
  23. Silva-Teixeira, C.S.; Cerqueira, N.M.F.S.A.; Silva Ferreira, A.C. Unravelling the olfactory sense: From gene to odor perception. Chem. Senses 2016, 41, 105–121. [Google Scholar] [CrossRef] [Green Version]
  24. Sollai, G.; Melis, M.; Magri, S.; Usai, P.; Hummel, T.; Tomassini Barbarossa, I.; Crnjar, R. Association between the rs2590498 polymorphism of Odorant Binding Protein (OBPIIa) gene and olfactory performance in healthy subjects. Behav. Brain Res. 2019, 372, 112030. [Google Scholar] [CrossRef] [PubMed]
  25. Jafek, B.W.; Gordon, A.S.; Moran, D.T.; Eller, P.M. Congenital anosmia. Ear Nose Throat J. 1990, 69, 331–337. [Google Scholar]
  26. Bremmer, E.A.; Mainland, J.D.; Khan, R.M.; Sobel, N. The prevalence of androstenone anosmia. Chem. Senses 2003, 28, 423–432. [Google Scholar] [CrossRef] [PubMed] [Green Version]
  27. Croy, I.; Olgun, S.; Mueller, L.; Schmidt, A.; Muench, M.; Hummel, C.; Gisselmann, G.; Hatt, H.; Hummel, T. Peripheral adaptive filtering in human olfaction? Three studies on prevalence and effects of olfactory training in specific anosmia in more than 1600 participants. Cortex 2015, 73, 180–187. [Google Scholar] [CrossRef]
  28. Sollai, G.; Tomassini Barbarossa, I.; Usai, P.; Hummel, T.; Crnjar, R. Association between human olfactory performance and ability to detect single compounds in complex chemical mixtures. Physiol. Behav. 2020, 217, 112820. [Google Scholar] [CrossRef]
  29. Temmel, A.F.P.; Quint, C.; Schickinger-Fischer, B.; Klimek, L.; Stoller, E.; Hummel, T. Characteristics of olfactory disorders in relation to major causes of olfactory loss. Arch. Otolaryngol. Head Surg. 2002, 128, 635–641. [Google Scholar] [CrossRef] [Green Version]
  30. Aschenbrenner, K.; Hummel, C.; Teszmer, K.; Krone, F.; Ishimaru, T.; Han-Seok Seo, H.S.; Hummel, T. The influence of olfactory loss on dietary behaviors. Laryngoscope 2008, 118, 135–144. [Google Scholar] [CrossRef]
  31. Graves, A.B.; Bowen, J.D.; Rajaram, L.; McCormick, W.C.; McCurry, S.M.; Schellenberg, G.D.; Larsson, E.B. Impaired olfaction as a marker for cognitive decline interaction with apolipoprotein E ε4 status. Neurology 1999, 53, 1480. [Google Scholar] [CrossRef]
  32. Ross, G.W.; Petrovitch, H.; Abbott, R.D.; Tanner, C.M.; Popper, J.; Masaki, K.; Launer, L.; White, L.R. Association of olfactory dysfunction with risk for future Parkinson’s disease. Ann. Neurol. 2008, 63, 167–173. [Google Scholar] [CrossRef] [PubMed]
  33. Wilson, R.S.; Arnold, S.E.; Schneider, J.A.; Boyle, P.A.; Buchman, A.S.; Bennett, D.A. Olfactory impairment in presymptomatic Alzheimer’s disease. Ann. N. Y. Acad. Sci. 2009, 1170, 730–735. [Google Scholar] [CrossRef] [PubMed] [Green Version]
  34. Pinto, J.M.; Wroblewski, K.E.; Kern, D.W.; Schumm, L.P.; McClintock, M.K. Olfactory dysfunction predicts 5-year mortality in older adults. PLoS ONE 2014, 9, e107541. [Google Scholar] [CrossRef] [Green Version]
  35. Steinbach, S.; Proft, F.; Schulze-Koops, H.; Hundt, W.; Heinrich, P.; Schulz, S.; Gruenke, M. Gustatory and olfactory function in rheumatoid arthritis. Scand. J. Rheumatol. 2011, 40, 169–177. [Google Scholar] [CrossRef] [PubMed]
  36. Steinbach, S.; Reindl, W.; Dempfle, A.; Schuster, A.; Wolf, P.; Hundt, W.; Huber, W. Smell and taste in inflammatory bowel disease. PLoS ONE 2013, 8, e73454. [Google Scholar] [CrossRef]
  37. Aydın, E.; Tekeli, H.; Karabacak, E.; Altunay, I.K.; Aydın, C.; Cerman, A.A.; Altundag, A.; Salihoglu, M.; Cayonu, M. Olfactory functions in patients with psoriasis vulgaris: Correlations with the severity of the disease. Arch. Dermatol. Res. 2016, 308, 409–414. [Google Scholar] [CrossRef]
  38. Perricone, C.; Shoenfeld, N.; Agmon-Levin, N.; de Carolis, C.; Perricone, R.; Shoenfeld, Y. Smell and autoimmunity: A comprehensive review. Clin. Rev. Allergy Immunol. 2013, 45, 87–96. [Google Scholar] [CrossRef]
  39. Tekeli, H.; Senol, M.G.; Altundag, A.; Yalcinkaya, E.; Kendirli, M.T.; Yasar, H.; Salihoglu, M.; Saglam, O.; Cayonu, M.; Cesmeci, E.; et al. Olfactory and gustatory dysfunction in Myasthenia gravis: A study in Turkish patients. J. Neurol. Sci. 2015, 356, 188–192. [Google Scholar] [CrossRef] [PubMed]
  40. Midilli, R.; Gode, S.; Oder, G.; Kabasakal, Y.; Karci, B. Nasal and paranasal involvement in primary Sjogren’s syndrome. Rhinology 2013, 51, 265–267. [Google Scholar] [PubMed] [Green Version]
  41. Walliczek-Dworschek, U.; Wendler, J.; Khan, T.; Aringer, M.; Hahner, A.; Hummel, T. Chemosensory function is decreased in rheumatoid arthritis. Eur. Arch. Oto-Rhino-Laryngol. 2020, 277, 1675–1680. [Google Scholar] [CrossRef]
  42. Kaser, A.; Zeissig, S.; Blumberg, R.S. Inflammatory Bowel Disease. Annu. Rev. Immunol. 2010, 28, 573–621. [Google Scholar] [CrossRef] [PubMed] [Green Version]
  43. Sugihara, K.; Morhardt, T.L.; Kamada, N. The Role of Dietary Nutrients in Inflammatory Bowel Disease. Front. Immunol. 2019, 9, 3183. [Google Scholar] [CrossRef] [PubMed]
  44. Molodecky, N.A.; Kaplan, G.G. Environmental Risk Factors for Inflammatory Bowel Disease. Gastroenterol. Hepatol. 2010, 6, 339–346. [Google Scholar]
  45. Fischer, M.; Zopf, Y.; Elm, C.; Pechmann, G.; Hahn, E.G.; Schwab, D.; Kornhuber, J.; Thuerauf, N.J. Subjective and Objective Olfactory Abnormalities in Crohn’s disease. Chem. Senses 2014, 39, 529–538. [Google Scholar] [CrossRef] [Green Version]
  46. Ananthakrishnan, A.N. Epidemiology and risk factors for IBD. Nat. Rev. Gastroenterol. Hepatol. 2015, 12, 205–217. [Google Scholar] [CrossRef] [PubMed]
  47. Loddo, I.; Romano, C. Inflammatory bowel disease: Genetics, epigenetics, and pathogenesis. Front. Immunol. 2015, 6, 6–11. [Google Scholar] [CrossRef] [PubMed] [Green Version]
  48. Gaya, D.R.; Russell, R.K.; Nimmo, E.R.; Satsangi, J. New genes in inflammatory bowel disease: Lessons for complex diseases? Lancet 2006, 367, 1271–1284. [Google Scholar] [CrossRef]
  49. Loftus, E.V., Jr. Clinical epidemiology of inflammatory bowel disease: Incidence, prevalence, and environmental influences. Gastroenterology 2004, 126, 1504–1517. [Google Scholar] [CrossRef]
  50. Danese, S.; Sans, M.; Fiocchi, C. Inflammatory bowel disease: The role of environmental factors. Autoimmun. Rev. 2004, 3, 394–400. [Google Scholar] [CrossRef]
  51. Mikhailov, T.A.; Furner, S.E. Breastfeeding and genetic factors in the etiology of inflammatory bowel disease in children. World J. Gastroenterol. 2009, 15, 270–279. [Google Scholar] [CrossRef] [PubMed]
  52. Zheng, J.J.; Zhu, X.S.; Huangfu, Z.; Gao, Z.X.; Guo, Z.R.; Wang, Z. Crohn’s disease in mainland China: A systematic analysis of 50 years of research. Chin. J. Dig. Dis. 2005, 6, 175–181. [Google Scholar] [CrossRef] [PubMed]
  53. Desai, H.G.; Gupte, P.A. Increasing incidence of Crohn’s disease in India: Is it related to improved sanitation? Indian J. Gastroenterol. 2005, 24, 23–24. [Google Scholar] [PubMed]
  54. Calkins, B.M. A meta-analysis of the role of smoking in inflammatory bowel disease. Dig. Dis. Sci. 1989, 34, 1841–1854. [Google Scholar] [CrossRef] [PubMed]
  55. Reif, S.; Lavy, A.; Keter, D.; Broide, E.; Niv, Y.; Halak, A.; Ron, Y.; Eliakim, R.; Odes, S.; Patz, A.; et al. Appendectomy is more frequent but not a risk factor in Crohn’s disease while being protective in ulcerative colitis: A comparison of surgical procedures in inflammatory bowel disease. Am. J. Gastroenterol. 2001, 96, 829–832. [Google Scholar] [CrossRef]
  56. Reif, S.; Klein, I.; Lubin, F.; Farbstein, M.; Hallak, A.; Gilat, T. Pre-illness dietary factors in inflammatory bowel disease. Gut 1997, 40, 754–760. [Google Scholar] [CrossRef] [Green Version]
  57. Mahmud, N.; Weir, D.G. The urban diet and Crohn’s disease: Is there a relationship? Eur. J. Gastroenterol. Hepatol. 2001, 13, 93–95. [Google Scholar] [CrossRef] [PubMed]
  58. Sakamoto, N.; Kono, S.; Wakai, K.; Fukuda, Y.; Satomi, M.; Shimoyama, T.; Inaba, Y.; Miyake, Y.; Sasaki, S.; Okamoto, K.; et al. Dietary risk factors for inflammatory bowel disease: A multicenter case-control study in japan. Inflamm. Bowel Dis. 2005, 11, 154–163. [Google Scholar] [CrossRef]
  59. Melis, M.; Mastinu, M.; Sollai, G.; Paduano, D.; Chicco, F.; Magri, S.; Usai, P.; Crnjar, R.; Tepper, B.J.; Tomassini Barbarossa, I. Taste Changes in Patients with Inflammatory Bowel Disease: Associations with PROP Phenotypes and polymorphisms in the salivary protein, Gustin and CD36 Receptor Genes. Nutrients 2020, 12, 409. [Google Scholar] [CrossRef] [PubMed] [Green Version]
  60. Tomassini Barbarossa, I.; Ozdener, M.H.; Melis, M.; Love-Gregory, L.; Mitreva, M.; Abumrad, N.A.; Pepino, M.Y. Variant in a common odorant-binding protein gene is associated with bitter sensitivity in people. Behav. Brain Res. 2017, 329, 200–204. [Google Scholar] [CrossRef]
  61. Melis, M.; Tomassini Barbarossa, I.; Hummel, T.; Crnjar, R.; Sollai, G. Effect of the rs2890498 polymorphism of the OBPIIa gene on the human ability to smell single molecules. Behav. Brain Res. 2021, 402, 113127. [Google Scholar] [CrossRef] [PubMed]
  62. Chicco, F.; Magri, S.; Cingolani, A.; Paduano, D.; Pesenti, M.; Zara, F.; Tumbarello, F.; Urru, E.; Melis, A.; Casual, L.; et al. Multidimensional Impact of Mediterranean Diet on IBD Patients. Inflamm. Bowel Dis. 2021, 27, 1–9. [Google Scholar] [CrossRef]
  63. Hummel, T.; Sekinger, B.; Wolf, S.R.; Pauli, E.; Kobal, G. ’Sniffin’ sticks’: Olfactory performance assessed by the combined testing of odor identification, odor discrimination and olfactory threshold. Chem. Senses 1997, 22, 39–52. [Google Scholar] [CrossRef]
  64. Hummel, T.; Kobal, G.; Gudziol, H.; Mackay-Sim, A. Normative data for the “Sniffin’ Sticks” including tests of odor identification, odor discrimination, and olfactory thresholds: An upgrade based on a group of more than 3000 subjects. Eur. Arch. Otorhinolaryngol. 2007, 264, 237–243. [Google Scholar] [CrossRef] [PubMed]
  65. Sollai, G.; Tomassini Barbarossa, I.; Masala, C.; Solari, P.; Crnjar, R. Gustatory sensitivity and food acceptance in two phylogenetically closely related Papilionid species: Papilio hospiton and Papilio machaon. PLoS ONE 2014, 9, e100675. [Google Scholar] [CrossRef] [PubMed] [Green Version]
  66. Sollai, G.; Tomassini Barbarossa, I.; Solari, P.; Crnjar, R. Taste discriminating capability to different bitter compounds by the larval styloconic sensilla in the insect herbivore Papilio hospiton (Géné). J. Insect Physiol. 2015, 74, 45–55. [Google Scholar] [CrossRef]
  67. Rousset, F. GENEPOP’007: A complete re-implementation of the GENEPOP software for Windows and Linux. Mol. Ecol. Resour. 2008, 8, 103–106. [Google Scholar] [CrossRef]
  68. Turner, J.H.; Liang, K.L.; May, L.; Lane, A.P. Tumor necrosis factor alpha inhibits olfactory regeneration in a transgenic model of chronic rhinosinusitis-associated olfactory loss. Am. J. Rhinol. Allergy 2010, 24, 336–340. [Google Scholar] [CrossRef] [PubMed] [Green Version]
  69. Sultan, B.; May, L.A.; Lane, A.P. The role of TNF-alpha in inflammatory olfactory loss. Laryngoscope 2011, 121, 2481–2486. [Google Scholar] [CrossRef] [Green Version]
  70. Albrecht, J.; Schreder, T.; Kleemann, A.M.; Schöpf, V.; Kopietz, R.; Anzinger, A.; Demmel, M.; Linn, J.; Kettenmann, B.; Wiesmann, M. Olfactory detection thresholds and pleasantness of a food-related and a non-food odour in hunger and satiety. Rhinology 2009, 47, 160–165. [Google Scholar]
  71. Hednder, M.; Larsson, M.; Arnold, N.; Zucco, G.M.; Hummel, T. Cognitive factors in odor detection, odor discrimination, and odor identification tesks. J. Clin. Exp. Neuropsychol. 2010, 32, 1062–1067. [Google Scholar] [CrossRef]
  72. Whitcroft, K.L.; Cuevas, M.; Haehner, A.; Hummel, T. Patterns of olfactory impairment reflect underlying disease etiology. Laryngoscope 2017, 127, 291–295. [Google Scholar] [CrossRef]
  73. Ghia, J.E.; Blennerhassett, P.; Deng, Y.; Verdu, E.F.; Khan, W.I.; Collins, S.M. Reactivation of inflammatory bowel disease in a mouse model of depression. Gastroenterology 2009, 136, 2280–2288. [Google Scholar] [CrossRef] [Green Version]
  74. Khil, L.; Rahe, C.; Wellmann, J.; Baune, B.T.; Wersching, H.; Berger, K. Association between major depressive disorder and odor identification impairment. J. Affect Dis. 2016, 203, 332–338. [Google Scholar] [CrossRef]
  75. Martzke, J.S.; Kopala, L.C.; Good, K.P. Olfactory dysfunction in neuropsychiatric disorders: Review and methodological considerations. Biol. Psychiatry 1997, 42, 721–732. [Google Scholar] [CrossRef]
  76. Wilson, D.A.; Xu, W.; Sadrian, B.; Courtiol, E.; Cohen, Y.; Barnes, D.C. Cortical odor processing in health and disease. Prog. Brain Res. 2014, 208, 275–305. [Google Scholar] [PubMed] [Green Version]
  77. Larsson, M.; Semb, H.; Winblad, B.; Amberla, K.; Wahlund, L.O.; Backman, L. Odor identification in normal aging and ealry Alzheimer’s disease: Effects of retrieval support. Neuropsychology 1999, 13, 47–53. [Google Scholar] [CrossRef]
  78. Zucco, G.M.; Amodio, P.; Gatta, A. Olfactory deficits in patients affected by minimal hepatic encephalopathy: A pilot study. Chem. Senses 2006, 31, 273–278. [Google Scholar] [CrossRef] [Green Version]
  79. Martini, G.A.; Brandes, J.W. Increased consumption of refined carbohydrates in patients with Crohn’s disease. Klin. Wochenschr. 1976, 54, 367–371. [Google Scholar] [CrossRef]
  80. Mayberry, J.F.; Rhodes, J.; Allan, R.; Newcombe, R.G.; Regan, G.M.; Chamberlain, L.M.; Wragg, K.G. Diet in Crohns disease two studies of current and previous habits in newly diagnosed patients. Dig. Dis. Sci. 1981, 26, 444–448. [Google Scholar] [CrossRef]
  81. Richardson, B.E.; VanderWoude, E.A.; Sudan, R.; Thompson, J.S.; Leopold, D.A. Altered olfactory acuity in the morbidly obese. Obes. Surg. 2004, 14, 967–969. [Google Scholar] [CrossRef] [PubMed]
  82. Besser, G.; Erlacher, B.; Aydinkoc-Tuzcu, K.; Liu, D.T.; Pablik, E.; Niebauer, V.; Koenihofer, M.; Renner, B.; Mueller, C.A. Body-Mass-Index associated differences in ortho- and retronasal olfactory function and the individuals significance of olfaction in health and disease. J. Clin. Med. 2020, 9, 366. [Google Scholar] [CrossRef] [Green Version]
  83. Power, M.L.; Schulkin, J. Anticipatory physiological regulation in feeding biology: Cephalic phase responses. Appetite 2008, 50, 194–206. [Google Scholar] [CrossRef] [Green Version]
  84. Connor, E.E.; Zhou, Y.; Liu, G.E. The essence of appetite: Does olfactory receptor variation play a role? J. Anim. Sci. 2018, 96, 1551–1558. [Google Scholar] [CrossRef]
  85. Egecioglu, E.; Skibicka, K.P.; Hansson, C.; Alvarez-Crespo, M.; Friberg, P.A.; Jerlhag, E.; Engel, J.A.; Dickson, S.L. Hedonic and incentive signals for body weight control. Rev. Endocr. Metab. Disord. 2011, 12, 141–151. [Google Scholar] [CrossRef] [Green Version]
  86. Smeets, P.A.M.; Erkner, A.; de Graaf, C. Cephalic phase responses and appetite. Nutr. Rev. 2010, 68, 643–655. [Google Scholar] [CrossRef] [PubMed]
  87. Stafford, L.D. Olfactory specific satiety depends on degree of association between odour and food. Appetite 2016, 98, 63–66. [Google Scholar] [CrossRef] [Green Version]
  88. Braun, T.; Voland, P.; Kunz, L.; Prinz, C.; Gratzl, M. Enterochromaffin cells of the human gut: Sensors for spices and odorants. Gastroenterology 2007, 132, 1890–1901. [Google Scholar] [CrossRef] [PubMed]
  89. Voigt, J.P.; Fink, H. Serotonin controlling feeding and satiety. Behav. Brain Res. 2015, 277, 14–31. [Google Scholar] [CrossRef] [PubMed]
  90. Archunan, G. Odorant Binding Proteins: A key player in the sense of smell. Bioinformation 2018, 14, 36–37. [Google Scholar] [CrossRef] [Green Version]
  91. Matarazzo, V.; Clot-Faybesse, O.; Marcet, B.; Guiraudie-Capraz, G.; Atanasova, B.; Devauchelle, G.; Cerutti, M.; Etievant, P.; Ronin, C. Functional characterization of two olfactory receptros expressed in the baculovirus Sf9 insect cell system. Chem. Senses 2005, 30, 195–207. [Google Scholar] [CrossRef] [Green Version]
  92. Brito, F.; Moreira, M.F.; Melo, A.C. A look inside odorant binding proteins in insect chemoreception. J. Insect Physiol. 2016, 95, 51–65. [Google Scholar] [CrossRef] [PubMed]
  93. Swarup, S.; Williams, T.I.; Anholt, R.R. Functional dissection of Odorant binding protein genes in Drosophila melanogaster. Genes Brain Behav. 2011, 10, 648–657. [Google Scholar] [CrossRef] [PubMed]
  94. Melis, M.; Sollai, G.; Masala, C.; Pisanu, C.; Cossu, G.; Melis, M.; Sarchioto, M.; Oppo, V.; Morelli, M.; Crnjar, R.; et al. Odor Identification Performance in Idiopathic Parkinson’s Disease Is Associated with Gender and the Genetic Variability of the Olfactory Binding Protein. Chem. Senses 2019, 44, 311–318. [Google Scholar] [CrossRef] [PubMed]
Figure 1. Mean (± SE) values of the Threshold, Discrimination and Identification (TDI) olfactory score determined in healthy control (HC) subjects (n = 99) and inflammatory bowel disease (IBD) patients (n = 100). Different letters (a and b) indicate a significant difference (p < 0.001, Duncan’s test).
Nutrients 13 00703 g001
Figure 2. Mean (± SE) values of the T, D and I olfactory score determined in HC subjects (n = 99), and IBD patients (n = 100). Different letters (a and b) indicate a significant difference (T score: p = 0.015, Fisher’s LSD test subsequent one-way ANOVA; D score: p < 0.001; I score: p = 0.003; Duncan’s test subsequent one-way ANOVA).
Nutrients 13 00703 g002
Figure 3. Mean (± SE) values of BMI determined in HC subjects (n = 99) and IBD patients (n = 100) (A) and according to their overall TDI olfactory status (B). (A) Different letters (a and b) indicate a significant difference between HC and IBD (p < 0.001; Fisher’s LSD test). (B) Different letters indicate a significant difference between normosmic and hyposmic individuals within the same population (HC subjects or IBD patients) (a and b for HC: TDI status p = 0.032; ai and bi for IBD: TDI status p < 0.001; Fisher’s LSD test). (*) indicates a significant difference between HC subjects and IBD patients within the same olfactory status (normosmic or hyposmic individuals) (p < 0.001; Fisher’s LSD test).
Nutrients 13 00703 g003
Figure 4. Mean (± SE) values of the T, D and I olfactory score according to genotypes of the OBPIIa locus determined in HC subjects (n = 99; 36 AA, 17 AG, 46 GG) and IBD (n = 100; 30 AA, 28 AG, 42 GG). Different letters indicate a significant difference: a-b for HC subjects (p < 0.001; Fisher’s LSD test); ai-bi for IBD patients (T score p < 0.01, Fisher’s LSD test; D score p < 0.001, Duncan’s test). (*) indicates a significant difference with respect to the corresponding value of HC subjects (T score GG: 0.024, Fisher’s LSD test; D score AG: p < 0.001, GG: p < 0.001, Duncan’s test).
Nutrients 13 00703 g004
Figure 5. Mean (± SE) values of BMI according to genotypes of the OBPIIa locus determined in HC subjects (n = 99; 36 AA, 17 AG, 46 GG) and IBD patients (n = 100; 30 AA, 28 AG, 42 GG). Different letters indicate a significant difference: a-b for HC subjects (p < 0.01; Fisher’s LSD) test; ai-bi for IBD patients (p < 0.001; Fisher’s LSD test). (*) indicates a significant difference with respect to the corresponding value of HC subjects (AG: p = 0.017; GG: p < 0.001).
Nutrients 13 00703 g005
Table 1. Distribution of the healthy control (HC) subjects and inflammatory bowel disease (IBD) patients classified as normosmic or hyposmic based on their overall olfactory status (TDI).
GroupHCIBDp-Value
VariableOlfactory statusn (%)n (%)
TDINormosmic60 (61)44 (44)0.019
Hyposmic39 (39)56 (56)
p-value derived from Fisher’s Exact Test. HC subjects (n = 99), IBD patients (n = 100).
Table 2. Stepwise forward multiple regression models for TDI score in HC subjects (n = 99) and IBD patients (n = 100).
PopulationsVariableOverall ModelParameter EstimateEach Step
(adj R2)(p)(sr)(p)(R2)
HCT
D
I
0.9949<0.000010.5709
0.4576
0.3930
<0.00001
<0.00001
<0.00001
0.5496
0.8372
0.9949
IBDD
T
I
0.9999 <0.000010.4088
0.3798
0.3553
<0.00001
<0.00001
<0.00001
0.7033
0.8711
0.9999
Independent variables included: Threshold (T), Discrimination (D) and Identification (I) score. Adj = adjusted; sr = semipartial correlation.
Table 3. Distribution of the healthy control (HC) subjects and inflammatory bowel disease (IBD) patients classified as normosmic or hyposmic based on their Threshold (T), Discrimination (D) and Identification (I) olfactory status.
GroupHCCDp-Value
VariableOlfactory Statusn (%)n (%)
TNormosmic57 (57.58)65 (65.00)0.282
Hyposmic42 (42.42)35 (35.00)
DNormosmic85 (85.86)70 (70.00)0.007
Hyposmic14 (14.14)30 (30.00)
INormosmic91 (91.92)88 (88.00)0.358
Hyposmic8 (8.08)12 (12.00)
p-value derived from Fisher’s Exact Test. HC subjects (n = 99), IBD patients (n = 100).
Table 4. Genotype distribution and allele frequency of the rs2590498 polymorphism of the OBPIIa gene (A/G) in HC subjects and IBD patients.
TDIHC
n (%)
IBD
n (%)
p-Value
Genotype
AA
AG
GG
36 (36.36)
17 (17.17)
46 (46.47)
30 (30.00)
28 (28.00)
42 (42.00)
0.935
Allele
A
G
89 (44.95)
109 (50.05)
88 (44.00)
112 (56.00)
0.924
p-value derived from Fisher’s Exact Test. HC subjects (n = 99), IBD patients (n = 100).
Publisher’s Note: MDPI stays neutral with regard to jurisdictional claims in published maps and institutional affiliations.

