
Vegan Diet and Bone Health—Results from the Cross-Sectional RBVD Study

 , , ,
, , ,  ,
,
Abstract
1. Introduction
2. Materials and Methods
2.1. Study Population
2.2. Quantitative Ultrasound Measurement
2.3. Assessment of Lifestyle Characteristics
2.4. Blood and Urine Collection and Laboratory Analysis
2.5. Sample Size Estimation
2.6. Statistical Analysis
3. Results
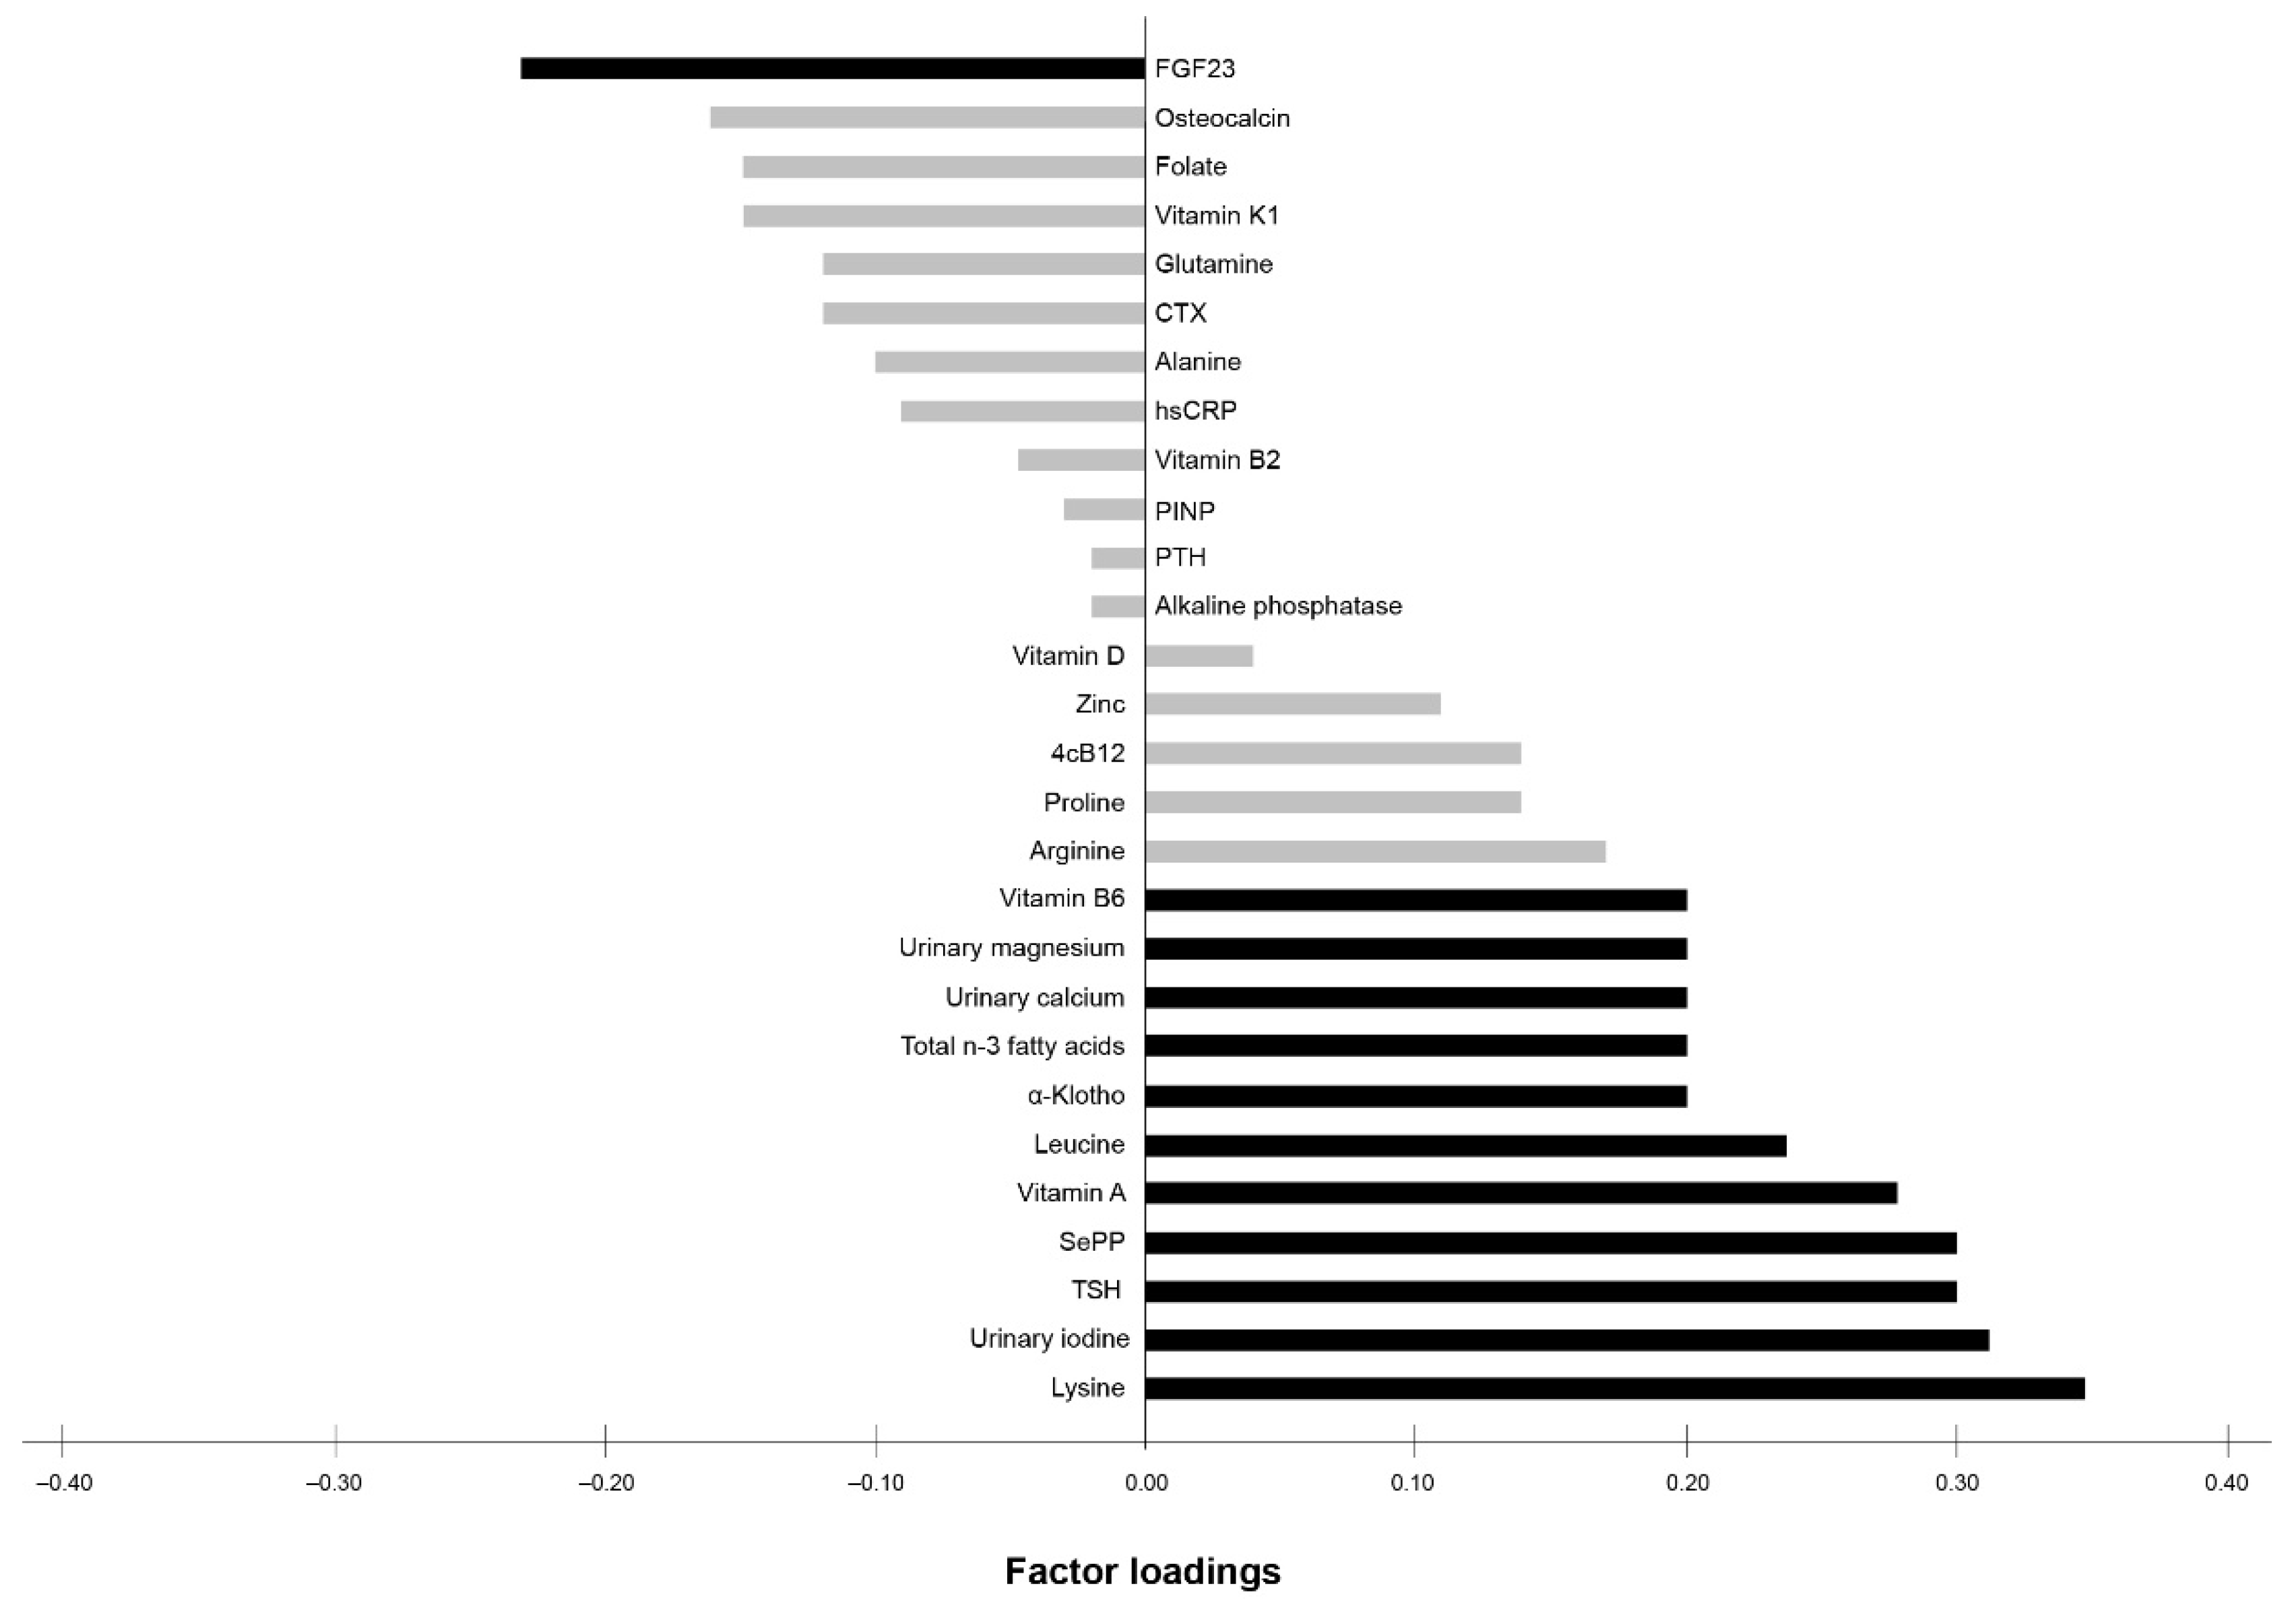
Exploratory RRR
4. Discussion
Exploratory RRR
Supplementary Materials
Author Contributions
Funding
Institutional Review Board Statement
Informed Consent Statement
Data Availability Statement
Acknowledgments
Conflicts of Interest
References
- Janssen, M.; Busch, C.; Rödiger, M.; Hamm, U. Motives of consumers following a vegan diet and their attitudes towards animal agriculture. Appetite 2016, 105, 643–651. [Google Scholar] [CrossRef]
- Allès, B.; Baudry, J.; Méjean, C.; Touvier, M.; Péneau, S.; Hercberg, S.; Kesse-Guyot, E. Comparison of Sociodemographic and Nutritional Characteristics between Self-Reported Vegetarians, Vegans, and Meat-Eaters from the NutriNet-Santé Study. Nutrients 2017, 9, 1023. [Google Scholar] [CrossRef]
- Lee, Y.; Park, K. Adherence to a Vegetarian Diet and Diabetes Risk: A Systematic Review and Meta-Analysis of Observational Studies. Nutrients 2017, 9, 603. [Google Scholar] [CrossRef]
- Kahleova, H.; Levin, S.; Barnard, N.D. Vegetarian Dietary Patterns and Cardiovascular Disease. Prog. Cardiovasc. Dis. 2018, 61, 54–61. [Google Scholar] [CrossRef]
- Dinu, M.; Abbate, R.; Gensini, G.F.; Casini, A.; Sofi, F. Vegetarian, vegan diets and multiple health outcomes: A systematic review with meta-analysis of observational studies. Crit. Rev. Food Sci. Nutr. 2017, 57, 3640–3649. [Google Scholar] [CrossRef] [PubMed]
- Iguacel, I.; Miguel-Berges, M.L.; Gómez-Bruton, A.; A Moreno, L.; Julián, C. Veganism, vegetarianism, bone mineral density, and fracture risk: A systematic review and meta-analysis. Nutr. Rev. 2019, 77, 1–18. [Google Scholar] [CrossRef] [PubMed]
- Knurick, J.R.; Johnston, C.S.; Wherry, S.J.; Aguayo, I. Comparison of Correlates of Bone Mineral Density in Individuals Adhering to Lacto-Ovo, Vegan, or Omnivore Diets: A Cross-Sectional Investigation. Nutrients 2015, 7, 3416–3426. [Google Scholar] [CrossRef]
- Tucker, K.L. Vegetarian diets and bone status. Am. J. Clin. Nutr. 2014, 100, 329S–335S. [Google Scholar] [CrossRef]
- Office of the Surgeon General (US). Determinants of Bone Health: Bone Health and Osteoporosis: A Report of the Surgeon General; Office of the Surgeon General (US): Rockville, MD, USA, 2004; Volume 6. Available online: https://www.ncbi.nlm.nih.gov/books/NBK45503/ (accessed on 19 February 2021).
- Richter, M.; Boeing, H.; Grünewald-Funk, D.; Heseker, H.; Kroke, A.; Leschik-Bonnet, E.; Oberritter, H.; Strohm, D.; Watzl, B. Vegan Diet Position of the German Nutrition Society (DGE). Ernaehrungs Umschau Int. 2016, 63, 92–104. [Google Scholar] [CrossRef]
- Palermo, A.; Tuccinardi, D.; D’Onofrio, L.; Watanabe, M.; Maggi, D.; Maurizi, A.R.; Greto, V.; Buzzetti, R.; Napoli, N.; Pozzilli, P.; et al. Vitamin K and osteoporosis: Myth or reality? Metababolism 2017, 70, 57–71. [Google Scholar] [CrossRef]
- Davey, G.K.; Spencer, E.A.; Appleby, P.N.; Allen, N.E.; Knox, K.H.; Key, T.J. EPIC–Oxford:lifestyle characteristics and nutrient intakes in a cohort of 33 883 meat-eaters and 31 546 non meat-eaters in the UK. Public Health Nutr. 2003, 6, 259–268. [Google Scholar] [CrossRef]
- Dai, Z.; Koh, W.-P. B-Vitamins and Bone Health–A Review of the Current Evidence. Nutrients 2015, 7, 3322–3346. [Google Scholar] [CrossRef] [PubMed]
- Kalimeri, M.; Leek, F.; Wang, N.X.; Koh, H.R.; Roy, N.C.; Cameron-Smith, D.; Kruger, M.C.; Henry, C.J.; Totman, J.J. Folate and Vitamin B-12 Status Is Associated with Bone Mineral Density and Hip Strength of Postmenopausal Chinese-Singaporean Women. JBMR Plus 2020, 4. [Google Scholar] [CrossRef] [PubMed]
- Goltzman, D.; Mannstadt, M.; Marcocci, C. Physiology of the Calcium-Parathyroid Hormone-Vitamin D Axis. Front. Horm. Res. 2018, 50, 1–13. [Google Scholar] [CrossRef] [PubMed]
- Menzel, J.; Biemann, R.; Longree, A.; Isermann, B.; Mai, K.; Schulze, M.B.; Abraham, K.; Weikert, C. Associations of a vegan diet with inflammatory biomarkers. Sci. Rep. 2020, 10, 1933–1938. [Google Scholar] [CrossRef]
- General Electric Company. Achilles EXPII—Affordable and Convenient Fracture Risk Assessment Using Quantitative Ultrasound. Available online: https://www3.gehealthcare.com/en/nonav-marquee/~/media/57f9c197945d4eadb9c29221fc815624.ashx2017 (accessed on 19 February 2021).
- The InterAct Consortium Validity of a short questionnaire to assess physical activity in 10 European countries. Eur. J. Epidemiol. 2012, 27, 15–25. [CrossRef]
- Weitkunat, K.; Schumann, S.; Nickel, D.; Hornemann, S.; Petzke, K.J.; Schulze, M.B.; Pfeiffer, A.F.H.; Klaus, S. Odd-chain fatty acids as a biomarker for dietary fiber intake: A novel pathway for endogenous production from propionate. Am. J. Clin. Nutr. 2017, 105, 1544–1551. [Google Scholar] [CrossRef]
- Fedosov, S.N.; Brito, A.; Miller, J.W.; Green, R.; Allen, L.H. Combined indicator of vitamin B12 status: Modification for missing biomarkers and folate status and recommendations for revised cut-points. Clin. Chem. Lab. Med. 2015, 53, 1215–1225. [Google Scholar] [CrossRef]
- Weikert, C.; Trefflich, I.; Menzel, J.; Obeid, R.; Longree, A.; Dierkes, J.; Meyer, K.; Herter-Aeberli, I.; Mai, K.; Stangl, G.I.; et al. Vitamin and Mineral Status in a Vegan Diet. Dtsch. Arztebl. Int. 2020, 117, 575–582. [Google Scholar]
- Hoffmann, K.; Schulze, M.B.; Schienkiewitz, A.; Nöthlings, U.; Boeing, H. Application of a New Statistical Method to Derive Dietary Patterns in Nutritional Epidemiology. Am. J. Epidemiol. 2004, 159, 935–944. [Google Scholar] [CrossRef]
- Chiu, J.-F.; Lan, S.-J.; Yang, C.-Y.; Wang, P.-W.; Yao, W.-J.; Su, I.-H.; Hsieh, C.-C. Long-Term Vegetarian Diet and Bone Mineral Density in Postmenopausal Taiwanese Women. Calcif. Tissue Int. 1997, 60, 245–249. [Google Scholar] [CrossRef]
- Barr, S.I.; Prior, J.C.; Janelle, K.; Lentle, B.C. Spinal Bone Mineral Density in Premenopausal Vegetarian and Nonvegetarian Women: Cross-Sectional and Prospective Comparisons. J. Am. Diet. Assoc. 1998, 98, 760–765. [Google Scholar] [CrossRef]
- Lau, E.; Kwok, T.; Woo, J.; Ho, S.C. Bone mineral density in Chinese elderly female vegetarians, vegans, lacto-vegetarians and omnivores. Eur. J. Clin. Nutr. 1998, 52, 60–64. [Google Scholar] [CrossRef]
- Outila, T.A.; Kärkkäinen, M.U.M.; Seppänen, R.H.; Lamberg-Allardt, C.J.E. Dietary Intake of Vitamin D in Premenopausal, Healthy Vegans was Insufficient to Maintain Concentrations of Serum 25-hydroxyvitamin D and Intact Parathyroid Hormone Within Normal Ranges During the Winter in Finland. J. Am. Diet. Assoc. 2000, 100, 434–441. [Google Scholar] [CrossRef]
- Fontana, L.; Shew, J.L.; Holloszy, J.O.; Villareal, D.T. Low Bone Mass in Subjects on a Long-term Raw Vegetarian Diet. Arch. Intern. Med. 2005, 165, 684–689. [Google Scholar] [CrossRef] [PubMed]
- Ho-Pham, L.T.; Nguyen, P.L.T.; Le, T.T.T.; Doan, T.A.T.; Tran, N.T.; Nguyen, T.V.; Le, T.A. Veganism, bone mineral density, and body composition: A study in Buddhist nuns. Osteoporos. Int. 2009, 20, 2087–2093. [Google Scholar] [CrossRef]
- Ambroszkiewicz, J.; Klemarczyk, W.; Gajewska, J.; Chełchowska, M.; Franek, E.; Laskowska-Klita, T. The influence of vegan diet on bone mineral density and biochemical bone turnover markers. Pediatr. Endocrinol. Diabetes Metab. 2010, 16, 201–204. [Google Scholar]
- Busse, B.; Bale, H.A.; Zimmermann, E.A.; Panganiban, B.; Barth, H.D.; Carriero, A.; Vettorazzi, E.; Zustin, J.; Hahn, M.; Ager, J.W., 3rd; et al. Vitamin D Deficiency Induces Early Signs of Aging in Human Bone, Increasing the Risk of Fracture. Sci. Transl. Med. 2013, 5, 193ra188. [Google Scholar] [CrossRef] [PubMed]
- Majchrzak, D.; Singer, I.; Männer, M.; Rust, P.; Genser, D.; Wagner, K.-H.; Elmadfa, I. B-Vitamin Status and Concentrations of Homocysteine in Austrian Omnivores, Vegetarians and Vegans. Ann. Nutr. Metab. 2006, 50, 485–491. [Google Scholar] [CrossRef]
- Schüpbach, R.; Wegmuller, R.; Berguerand, C.; Bui, M.; Herteraeberli, I. Micronutrient status and intake in omnivores, vegetarians and vegans in Switzerland. Eur. J. Nutr. 2017, 56, 283–293. [Google Scholar] [CrossRef] [PubMed]
- Navarro-Valverde, C.; Caballero-Villarraso, J.; Mata-Granados, J.M.; Casado-Diaz, A.; Sosa-Henríquez, M.; Malouf-Sierra, J.; Nogues-Solan, X.; Rodriguez-Mañas, L.; Cortés-Gil, X.; Delgadillo-Duarte, J.; et al. High Serum Retinol as a Relevant Contributor to Low Bone Mineral Density in Postmenopausal Osteoporotic Women. Calcif. Tissue Int. 2018, 102, 651–656. [Google Scholar] [CrossRef] [PubMed]
- Burdge, G.C.; Tan, S.-Y.; Henry, C.J. Long-chain n-3 PUFA in vegetarian women: A metabolic perspective. J. Nutr. Sci. 2017, 6, e58. [Google Scholar] [CrossRef] [PubMed]
- Tur, J.A.; Bibiloni, M.M.; Sureda, A.; Pons, A. Dietary sources of omega 3 fatty acids: Public health risks and benefits. Br. J. Nutr. 2012, 107, S23–S52. [Google Scholar] [CrossRef]
- Bao, M.; Zhang, K.; Wei, Y.; Hua, W.; Gao, Y.; Li, X.; Ye, L. Therapeutic potentials and modulatory mechanisms of fatty acids in bone. Cell Prolif. 2019, 53, e12735. [Google Scholar] [CrossRef]
- Sadeghi, O.; Djafarian, K.; Ghorabi, S.; Khodadost, M.; Nasiri, M.; Shab-Bidar, S. Dietary intake of fish, n-3 polyunsaturated fatty acids and risk of hip fracture: A systematic review and meta-analysis on observational studies. Crit. Rev. Food Sci. Nutr. 2017, 59, 1320–1333. [Google Scholar] [CrossRef]
- Orchard, T.S.; Pan, X.; Cheek, F.; Ing, S.W.; Jackson, R.D. A systematic review of omega-3 fatty acids and osteoporosis. Br. J. Nutr. 2012, 107, S253–S260. [Google Scholar] [CrossRef]
- Abdelhamid, A.; Hooper, L.; Sivakaran, R.; Hayhoe, R.P.G.; Welch, A.; the PUFAH Group. The Relationship Between Omega-3, Omega-6 and Total Polyunsaturated Fat and Musculoskeletal Health and Functional Status in Adults: A Systematic Review and Meta-analysis of RCTs. Calcif. Tissue Int. 2019, 105, 353–372. [Google Scholar] [CrossRef]
- Hoeg, A.; Gogakos, A.; Murphy, E.; Mueller, S.; Köhrle, J.; Reid, D.M.; Glüer, C.C.; Felsenberg, D.; Roux, C.; Eastell, R.; et al. Bone Turnover and Bone Mineral Density Are Independently Related to Selenium Status in Healthy Euthyroid Postmenopausal Women. J. Clin. Endocrinol. Metab. 2012, 97, 4061–4070. [Google Scholar] [CrossRef]
- Hoeflich, J.; Hollenbach, B.; Behrends, T.; Hoeg, A.; Stosnach, H.; Schomburg, L. The choice of biomarkers determines the selenium status in young German vegans and vegetarians. Br. J. Nutr. 2010, 104, 1601–1604. [Google Scholar] [CrossRef] [PubMed]
- Pietschmann, N.; Rijntjes, E.; Hoeg, A.; Stoedter, M.; Schweizer, U.; Seemann, P.; Schomburg, L. Selenoprotein P is the essential selenium transporter for bones. Metallomics 2014, 6, 1043–1049. [Google Scholar] [CrossRef]
- Della Pepa, G.; Brandi, M.L. Microelements for bone boost: The last but not the least. Clin. Cases Miner. Bone Metab. 2016, 13, 181–185. [Google Scholar] [CrossRef]
- Hyun, T.H.; Barrett-Connor, E.; Milne, D.B. Zinc intakes and plasma concentrations in men with osteoporosis: The Rancho Bernardo Study. Am. J. Clin. Nutr. 2004, 80, 715–721. [Google Scholar] [CrossRef]
- Nouvenne, A.; Ticinesi, A.; Morelli, I.; Guida, L.; Borghi, L.; Meschi, T. Fad diets and their effect on urinary stone formation. Transl. Androl. Urol. 2014, 3, 303–312. [Google Scholar]
- Jahnen-Dechent, W.; Ketteler, M. Magnesium basics. Clin. Kidney J. 2012, 5, i3–i14. [Google Scholar] [CrossRef]
- Foley, K.F.; Boccuzzi, L. Urine Calcium: Laboratory Measurement and Clinical Utility. Lab. Med. 2010, 41, 683–686. [Google Scholar] [CrossRef]
- Tapsell, L.C.; Neale, E.P.; Satija, A.; Hu, F.B. Foods, Nutrients, and Dietary Patterns: Interconnections and Implications for Dietary Guidelines. Adv. Nutr. 2016, 7, 445–454. [Google Scholar] [CrossRef] [PubMed]
- Arslanca, T.; Korkmaz, V.; Arslanca, S.B.; Karadag, B.; Ergün, Y. Body iodine status in women with postmenopausal osteoporosis. Menopause 2018, 25, 320–323. [Google Scholar] [CrossRef]
- Abrahamsen, B.; Jørgensen, H.L.; Laulund, A.S.; Nybo, M.; Brix, T.H.; Hegedüs, L. Low Serum Thyrotropin Level and Duration of Suppression as a Predictor of Major Osteoporotic Fractures—The Openthyro Register Cohort. J. Bone Miner. Res. 2014, 29, 2040–2050. [Google Scholar] [CrossRef]
- Murphy, E.; Glüer, C.C.; Reid, D.M.; Felsenberg, D.; Roux, C.; Eastell, R.; Williams, G.R. Thyroid Function within the Upper Normal Range Is Associated with Reduced Bone Mineral Density and an Increased Risk of Nonvertebral Fractures in Healthy Euthyroid Postmenopausal Women. J. Clin. Endocrinol. Metab. 2010, 95, 3173–3181. [Google Scholar] [CrossRef] [PubMed]
- Liu, Z.; Jeppesen, P.B.; Gregersen, S.; Chen, X.; Hermansen, K. Dose- and Glucose-Dependent Effects of Amino Acids on Insulin Secretion from Isolated Mouse Islets and Clonal INS-1E Beta-Cells. Rev. Diabet. Stud. 2008, 5, 232–244. [Google Scholar] [CrossRef] [PubMed]
- Yang, J.; Zhang, X.; Wang, W.; Liu, J. Insulin stimulates osteoblast proliferation and differentiation through ERK and PI3K in MG-63 cells. Cell Biochem. Funct. 2010, 28, 334–341. [Google Scholar] [CrossRef]
- Jennings, A.; MacGregor, A.; Spector, T.; Cassidy, A. Amino Acid Intakes Are Associated with Bone Mineral Density and Prevalence of Low Bone Mass in Women: Evidence from Discordant Monozygotic Twins. J. Bone Miner. Res. 2015, 31, 326–335. [Google Scholar] [CrossRef]
- Fujita, S.; Volpi, E. Amino Acids and Muscle Loss with Aging. J. Nutr. 2006, 136, 277S–280S. [Google Scholar] [CrossRef] [PubMed]
- Guo, Y.-C.; Yuan, Q. Fibroblast growth factor 23 and bone mineralisation. Int. J. Oral Sci. 2015, 7, 8–13. [Google Scholar] [CrossRef] [PubMed]
- Fukumoto, S. FGF23 and Bone and Mineral Metabolism. In Bone Regulators and Osteoporosis Therapy. Handbook of Experimental Pharmacology; Springer: Cham, Switzerland, 2019; Volume 262, pp. 281–308. [Google Scholar] [CrossRef]
- Richter, B.; Faul, C. FGF23 Actions on Target Tissues—With and Without Klotho. Front. Endocrinol. 2018, 9, 189. [Google Scholar] [CrossRef] [PubMed]
- Isakova, T.; Cai, X.; Lee, J.; Katz, R.; Cauley, J.A.; Fried, L.F.; Hoofnagle, A.N.; Satterfield, S.; Harris, T.B.; Shlipak, M.G.; et al. Associations of FGF23 With Change in Bone Mineral Density and Fracture Risk in Older Individuals. J. Bone Miner. Res. 2016, 31, 742–748. [Google Scholar] [CrossRef] [PubMed]
- Han, W.; Bai, X.-J.; Han, L.-L.; Sun, X.-F.; Chen, X.-M. The relationship between serum fibroblast growth factor 23, Klotho, and lumbar spine bone mineral density in northern Chinese postmenopausal women. Menopause 2019, 26, 546–553. [Google Scholar] [CrossRef] [PubMed]
- Shen, J.; Fu, S.; Song, Y. Relationship of Fibroblast Growth Factor 23 (FGF-23) Serum Levels with Low Bone Mass in Postmenopausal Women. J. Cell. Biochem. 2017, 118, 4454–4459. [Google Scholar] [CrossRef]
- Jovanovich, A.; Bùžková, P.; Chonchol, M.; Robbins, J.; Fink, H.A.; De Boer, I.H.; Kestenbaum, B.; Katz, R.; Carbone, L.; Lee, J.; et al. Fibroblast Growth Factor 23, Bone Mineral Density, and Risk of Hip Fracture Among Older Adults: The Cardiovascular Health Study. J. Clin. Endocrinol. Metab. 2013, 98, 3323–3331. [Google Scholar] [CrossRef]
- Zheng, S.; Chen, Y.; Zheng, Y.; Zhou, Z.; Li, Z. Correlation of serum levels of fibroblast growth factor 23 and Klotho protein levels with bone mineral density in maintenance hemodialysis patients. Eur. J. Med Res. 2018, 23, 18. [Google Scholar] [CrossRef]
- Chalhoub, D.; Marques, E.; Meirelles, O.; Semba, R.D.; Ferrucci, L.; Satterfield, S.; Nevitt, M.; Cauley, J.A.; Harris, T.; Health ABC Study. Association of Serum Klotho with Loss of Bone Mineral Density and Fracture Risk in Older Adults. J. Am. Geriatr. Soc. 2016, 64, e304–e308. [Google Scholar] [CrossRef] [PubMed]
- Weikert, C.; Schulze, M.B. Evaluating dietary patterns: The role of reduced rank regression. Curr. Opin. Clin. Nutr. Metab. Care 2016, 19, 341–346. [Google Scholar] [CrossRef] [PubMed]
- Myint, P.K.; Clark, A.B.; Kwok, C.S.; Loke, Y.K.; Yeong, J.K.-Y.; Luben, R.N.; Wareham, N.J.; Khaw, K.-T. Bone Mineral Density and Incidence of Stroke: European prospective investigation into cancer-norfolk population-based study, systematic review, and meta-analysis. Stroke 2014, 45, 373–382. [Google Scholar] [CrossRef] [PubMed]


| Characteristics | Vegans (n = 36) | Omnivores (n = 36) | p-Value |
|---|---|---|---|
| Duration vegan diet (years) | 4.8 (3.1–8.7) | ||
| Men | 50.0% (18) | 50.0% (18) | 1.00 |
| Age (years) | 37.5 (32.5–44.0) | 38.5 (32.0–46.0) | 0.75 |
| Anthropometry | |||
| BMI (kg/m2) | 22.9 ± 3.2 | 24.0 ± 2.1 | 0.08 |
| Fat mass (%) | 24.1 ± 7.8 | 26.2 ± 7.7 | 0.27 |
| Muscle mass (%) | 33.9 ± 5.2 | 33.5 ± 5.2 | 0.72 |
| Waist circumference (cm) | |||
| Women | 73.1 ± 6.9 | 77.2 ± 6.2 | 0.07 |
| Men | 84.5 ± 8.9 | 86.0 ± 6.1 | 0.56 |
| Education (%) | 0.60 | ||
| Low | 0.0% (0) | 2.8% (1) | |
| Intermediate | 30.6% (11) | 30.6% (11) | |
| High | 69.5% (25) | 66.7% (24) | |
| Lifestyle | |||
| Physical activity (h/week) | 2.8 (0.88–3.75) | 2.3 (1.2–4.1) | 0.69 |
| Walking (h/week) | 7.0 (5.0–12.0) | 5.5 (3.5–11.8) | 0.15 |
| Smoking status | 0.30 | ||
| Non-smoker | 66.7% (24) | 58.3% (21) | |
| Ex-smoker | 22.2% (8) | 16.7% (6) | |
| Smoker | 11.1% (4) | 25.0% (9) | |
| Alcohol consumption (g/d) | |||
| Women | 0.10 (0.00–4.69) | 0.21 (0.02–4.88) | 0.22 |
| Men | 0.04 (0.00–2.00) | 3.85 (0.36–16.2) | 0.09 |
| Taking supplements | 97.2% (35) | 33.3% (12) | <0.0001 |
| Vitamin B12 | 91.7% (33) | 8.3% (3) | <0.0001 |
| Vitamin D3 | 50.0% (18) | 11.1% (4) | 0.0003 |
| Characteristics | Vegans (n = 36) | Omnivores (n = 36) | p-Value |
|---|---|---|---|
| Quantitative ultrasound | |||
| BUA (dB/MHz) a | 111.8 ± 10.7 | 118.0 ± 10.8 | 0.02 |
| SOS (m/s) a | 1581.7 ± 28.3 | 1592.3 ± 9.27 | 0.20 |
| SI a | 97.3 ± 13.3 | 104.3 ± 16.9 | 0.05 |
| Bone turnover | |||
| CTX (ng/mL) a | 0.45 ± 0.19 | 0.36 ± 0.16 | 0.03 |
| Osteocalcin (ng/mL) | 20.8 ± 5.49 | 18.2 ± 6.83 | 0.08 |
| PINP (µg/L) | 60.7 ± 17.0 | 52.7 ± 18.2 | 0.06 |
| Alkaline phosphatase (U/L) | 64.5 (57.0–80.0) | 59.5 (50.5–79.5) | 0.13 |
| Calcium homeostasis | |||
| PTH (pg/mL) | 52.3 ± 21.0 | 44.1 ± 19.0 | 0.09 |
| Vitamin D3 (nmol/L) | 63.2 (21.5–88.1) | 45.4 (34.6–68.6) | 0.49 |
| Urinary calcium (mg/L) | 55.5 (36.5–73.0) | 86.0 (49.0–165.5) | 0.004 |
| FGF23–α-klotho axis | |||
| α-Klotho (pg/mL) | 780.3 (621.1–976.2) | 640.1 (520.8–770.2) | 0.01 |
| FGF23 (RU/mL) | 64.5 (54.4–83.2) | 63.6 (57.7–72.5) | 0.75 |
| Vitamin B12 status | |||
| Vitamin B12 (pmol/L) | 337.9 (218.0–559.1) | 267.6 (227.2–364.5) | 0.12 |
| Holotranscobalamin (pmol/L) | 89.4 (58.9–205.0) | 84.3 (67.6–100.4) | 0.35 |
| Total homocysteine (µmol/L) | 8.60 (6.70–11.3) | 8.75 (7.25–10.5) | 0.90 |
| Methylmalonic acid (µmol/L) | 0.17 (0.15–0.22) | 0.18 (0.16–0.21) | 0.62 |
| 4cB12 | 0.54 (0.07–1.24) | 0.42 (0.19–0.70) | 0.47 |
| Vitamins | |||
| Vitamin A (µmol/L) | 1.80 (1.56–1.92) | 2.07 (1.80–2.33) | 0.004 |
| Vitamin B2 (nmol/L) | 6.00 (4.39–10.70) | 9.05 (6.82–11.8) | 0.03 |
| Vitamin B6 (nmol/L) | 67.2 (49.1–89.4) | 78.8 (47.1–99.7) | 0.62 |
| Vitamin K1 (nmol/L) | 1.55 (1.30–2.23) | 0.78 (0.54–1.13) | <0.0001 |
| Folate (ng/mL) | 10.9 (7.71–12.8) | 7.82 (6.36–11.2) | 0.03 |
| Amino acids | |||
| Alanine (µmol/L) | 373.2 ± 98.1 | 348.7 ± 66.2 | 0.22 |
| Arginine (µmol/L) | 64.1 (52.7–74.4) | 69.1 (59.0–76.0) | 0.35 |
| Glutamine (µmol/L) | 629.4 ± 83.2 | 546.9 ± 64.3 | <0.0001 |
| Leucine (µmol/L) | 117.5 (103.6–137.0) | 120.0 (114.4–143.8) | 0.07 |
| Lysine (µmol/L) | 128.5 (119.0–147.7) | 171.4 (152.3–189.3) | <0.0001 |
| Proline (µmol/L) | 174.7 (146.5–244.4) | 174.6 (139.2–195.7) | 0.24 |
| Iodine and thyroid | |||
| Urinary iodine (µg/L) | 28.1 (17.1–41.6) | 74.1 (41.5–101.7) | <0.0001 |
| TSH (µg/L) | 2.13 ± 0.92 | 2.35 ± 1.05 | 0.34 |
| Other bone-related biomarkers | |||
| Zinc (µg/dL) | 79.3 ± 11.6 | 87.3 ± 13.3 | 0.008 |
| Selenium (µg/L) | 67.7 (59.8–82.1) | 76.2 (68.4–83.5) | 0.11 |
| SePP (mg/L) | 3.26 (2.61–4.47) | 4.97 (4.22–5.46) | <0.0001 |
| hsCRP (mg/L) | 0.39 (0.21–0.88) | 0.63 (0.24–1.74) | 0.25 |
| Total n-3 fatty acids (%) | 3.07 (2.66–3.53) | 5.11 (4.22–5.77) | <0.0001 |
| Urinary magnesium (mg/L) | 57.0 (44.8–66.9) | 56.4 (43.5–81.9) | 0.88 |
| Characteristics | T1 (n = 23) | T2 (n = 24) | T3 (n = 23) | p for Trend |
|---|---|---|---|---|
| Vegans/omnivores | 16/7 | 14/10 | 6/17 | 0.009 |
| Duration vegan diet (years) | 3.5 (3.1–6.0) | 4.9 (2.3–6.3) | 8.2 (4.2–12.2) | 0.27 |
| Men | 39.1% (9) | 50.0% (12) | 56.5% (13) | 0.49 |
| Age (years) | 40.0 (35.0–47.0) | 36.0 (31.0–44.5) | 35.0 (31.0–44.0) | 0.09 |
| BMI (kg/m2) | 22.4 ± 2.5 | 24.0 ± 3.1 | 23.7 ± 2.5 | 0.13 |
| Physical activity (h/week) | 1.50 (0.67–3.54) | 2.42 (1.07–3.44) | 2.67 (1.75–4.33) | 0.01 |
| Smoker | 26.1% (6) | 16.7% (4) | 13.0% (3) | 0.17 |
| Alcohol consumption (g/d) | ||||
| Women | 0.27 (0.01–9.90) | 0.10 (0.01–2.50) | 0.13 (0.02–1.51) | 0.16 |
| Men | 2.00 (0.21–19.8) | 0.03 (0.00–1.99) | 1.16 (0.00–4.40) | 0.42 |
| Quantitative ultrasound | ||||
| BUA (dB/MHz) | 108.8 ± 10.8 | 113.2 ± 9.06 | 122.4 ± 9.37 | <0.0001 |
| SOS (m/s) | 1569.1 ± 27.4 | 1581.5 ± 28.2 | 1611.7 ± 33.4 | <0.0001 |
| SI | 91.8 ± 12.9 | 98.1 ± 12.1 | 112.7 ± 14.3 | <0.0001 |
| Calcium homeostasis | ||||
| Urinary calcium (mg/L) | 60.0 (39.0–82.0) | 55.5 (40.0–103.5) | 82.0 (50.0–167.0) | 0.20 |
| FGF23–α-klotho axis | ||||
| α-Klotho (pg/mL) | 666.4 (515.8–865.9) | 652.5 (557.8–807.4) | 763.0 (689.6–860.4) | 0.21 |
| FGF23 (RU/mL) | 73.7 (58.9–91.3) | 62.6 (57.7–70.9) | 63.9 (50.3–78.0) | 0.04 |
| Vitamins | ||||
| Vitamin A (µmol/L) | 1.77 (1.53–1.95) | 1.91 (1.61–2.21) | 2.04 (1.79–2.31) | 0.003 |
| Vitamin B6 (nmol/L) | 60.0 (44.1–84.1) | 72.3 (46.4–95.0) | 84.4 (53.3–126.0) | 0.01 |
| Amino acids | ||||
| Leucine (µmol/L) | 117.7 (106.5–136.8) | 118.2 (106.7–137.6) | 118.9 (111.7–152.8) | 0.14 |
| Lysine (µmol/L) | 129.7 (113.9–155.8) | 146.3 (128.4–165.8) | 166.1 (146.3–187.5) | 0.0002 |
| Iodine and thyroid | ||||
| Urinary iodine (µg/L) | 26.7 (14.8–53.3) | 44.6 (29.7–63.2) | 70.7 (34.1–103.6) | 0.002 |
| TSH (µg/L) | 1.75 ± 0.81 | 2.38 ± 1.12 | 2.64 ± 0.83 | 0.002 |
| Other bone-related biomarkers | ||||
| SePP (mg/L) | 3.37 (2.32–4.77) | 3.82 (3.07–5.25) | 5.08 (4.15–5.32) | 0.0004 |
| Total n-3 fatty acids (%) | 3.45 (2.79–4.32) | 3.98 (3.02–4.93) | 4.36 (3.68–5.65) | 0.03 |
| Urinary magnesium (mg/L) | 50.2 (44.0–59.0) | 59.1 (43.3–93.0) | 59.1 (46.6–74.3) | 0.19 |
Publisher’s Note: MDPI stays neutral with regard to jurisdictional claims in published maps and institutional affiliations. |
© 2021 by the authors. Licensee MDPI, Basel, Switzerland. This article is an open access article distributed under the terms and conditions of the Creative Commons Attribution (CC BY) license (http://creativecommons.org/licenses/by/4.0/).
Share and Cite
Menzel, J.; Abraham, K.; Stangl, G.I.; Ueland, P.M.; Obeid, R.; Schulze, M.B.; Herter-Aeberli, I.; Schwerdtle, T.; Weikert, C. Vegan Diet and Bone Health—Results from the Cross-Sectional RBVD Study. Nutrients 2021, 13, 685. https://doi.org/10.3390/nu13020685
Menzel J, Abraham K, Stangl GI, Ueland PM, Obeid R, Schulze MB, Herter-Aeberli I, Schwerdtle T, Weikert C. Vegan Diet and Bone Health—Results from the Cross-Sectional RBVD Study. Nutrients. 2021; 13(2):685. https://doi.org/10.3390/nu13020685
Chicago/Turabian StyleMenzel, Juliane, Klaus Abraham, Gabriele I. Stangl, Per Magne Ueland, Rima Obeid, Matthias B. Schulze, Isabelle Herter-Aeberli, Tanja Schwerdtle, and Cornelia Weikert. 2021. "Vegan Diet and Bone Health—Results from the Cross-Sectional RBVD Study" Nutrients 13, no. 2: 685. https://doi.org/10.3390/nu13020685
APA StyleMenzel, J., Abraham, K., Stangl, G. I., Ueland, P. M., Obeid, R., Schulze, M. B., Herter-Aeberli, I., Schwerdtle, T., & Weikert, C. (2021). Vegan Diet and Bone Health—Results from the Cross-Sectional RBVD Study. Nutrients, 13(2), 685. https://doi.org/10.3390/nu13020685