
Effects of Water Restriction and Water Replenishment on the Content of Body Water with Bioelectrical Impedance among Young Adults in Baoding, China: A Randomized Controlled Trial (RCT)


Abstract
1. Introduction
2. Methods
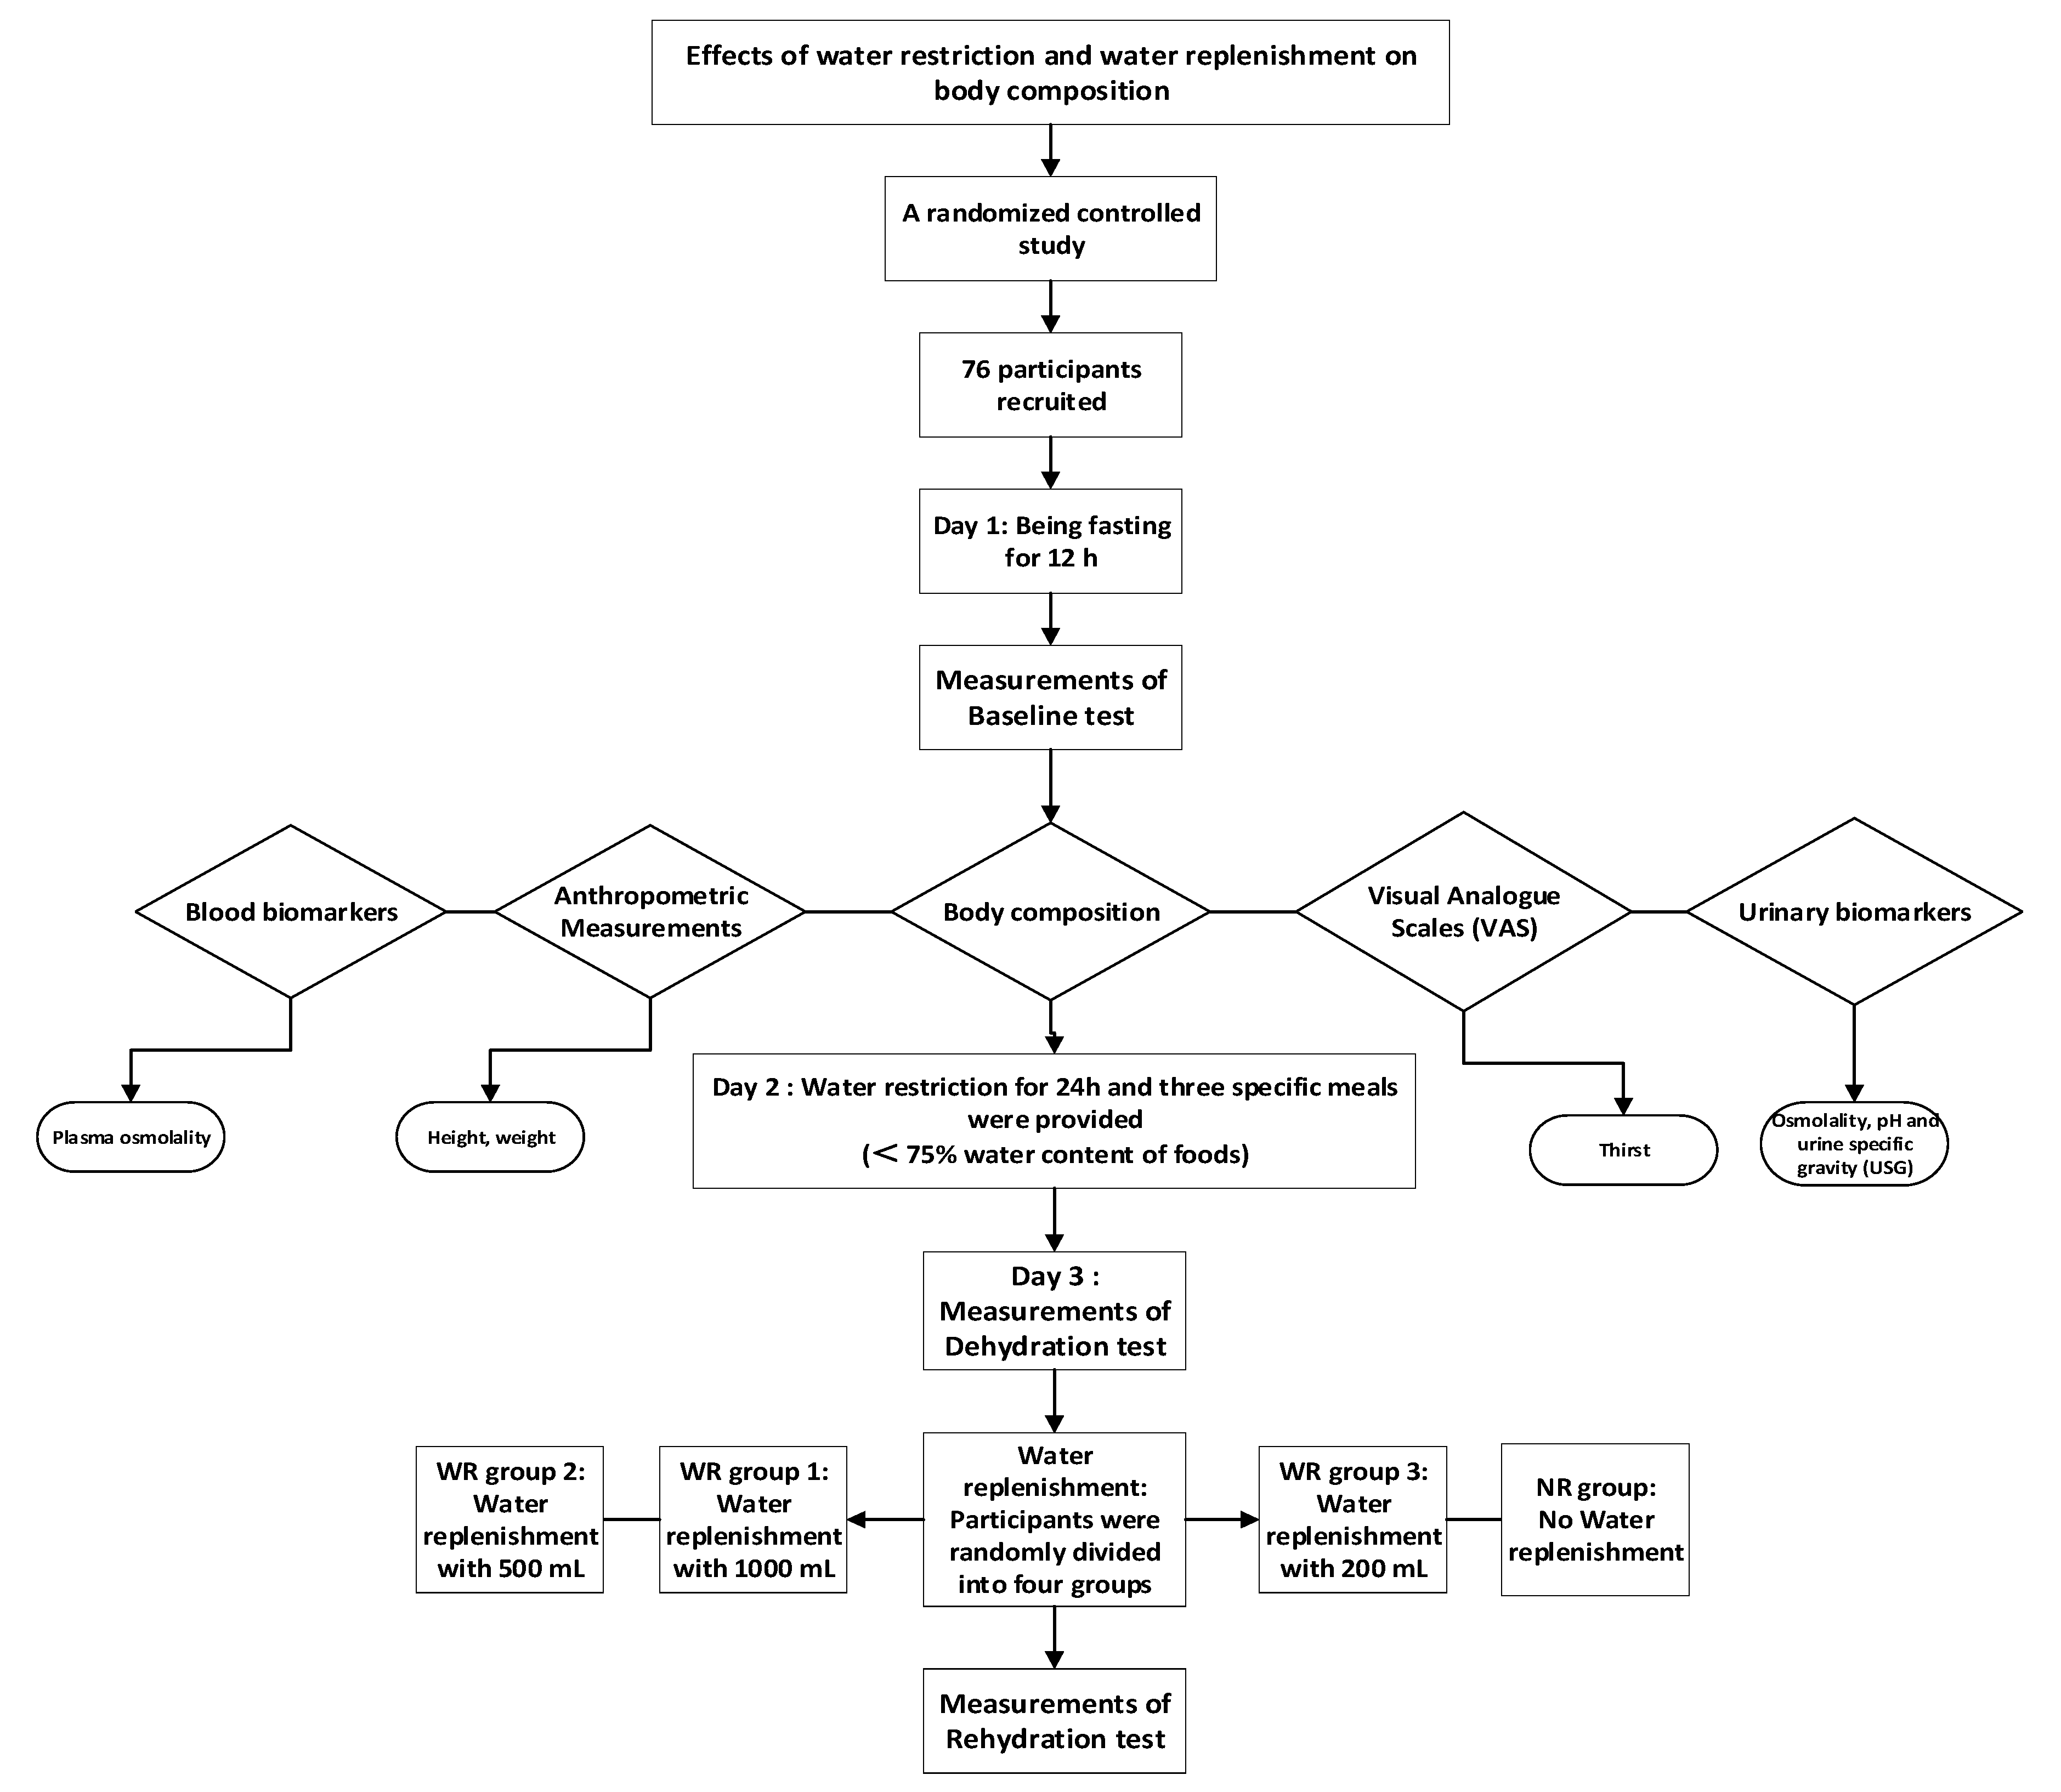
2.1. Study Design
2.2. Sample Size Calculation
2.3. Study Participants
2.4. Ethics
2.5. Study Design and Procedure
2.6. Assessment of Water from Food
2.7. Temperature and Humidity of the Environment
2.8. Anthropometry
2.9. Urine and Plasma Biomarkers
2.10. Statistics
3. Results
3.1. Characteristics of Participants
3.2. Water Supplementation Effects on Body Composition
4. Discussion
5. Conclusions
Supplementary Materials
Author Contributions
Funding
Institutional Review Board Statement
Informed Consent Statement
Data Availability Statement
Acknowledgments
Conflicts of Interest
Ethics Approval
Trial Registration
Abbreviations
| TWI | Total water intake |
| TBW | Total body water |
| ICW | Intracellular water |
| ECW | Extracellular water |
| BW | Body weight |
| EFSA | European Food Safety Authority |
References
- Jéquier, E.; Constant, F. Water as an essential nutrient: The physiological basis of hydration. Eur. J. Clin. Nutr. 2009, 64, 115–123. [Google Scholar] [CrossRef]
- Siwach, P.; Levy, E.; Livshits, L.; Feldman, Y.; Kaganovich, D. Water is a biomarker of changes in the cellular environment in live animals. Sci. Rep. 2020, 10, 9095. [Google Scholar] [CrossRef]
- Popkin, B.M.; D’Anci, K.E.; Rosenberg, I.H. Water, hydration, and health. Nutr. Rev. 2010, 68, 439–458. [Google Scholar] [CrossRef] [PubMed]
- Chinese Nutrition Society. Chinese Dietary Reference Intakes 2013; Science Press: Beijing, China, 2014; pp. 48–51. [Google Scholar]
- Wang, Z.; Deurenberg, P.; Wang, W.; Pietrobelli, A.; Baumgartner, R.N.; Heymsfield, S.B. Hydration of fat-free body mass: Review and critique of a classic body-composition constant. Am. J. Clin. Nutr. 1999, 69, 833–841. [Google Scholar] [CrossRef]
- Chumlea, W.C.; Guo, S.S.; Zeller, C.M.; Reo, N.V.; Baumgartner, R.N.; Garry, P.J.; Wang, J.; Pierson, R.J.; Heymsfield, S.B.; Siervogel, R.M. Total body water reference values and prediction equations for adults. Kidney Int. 2001, 59, 2250–2258. [Google Scholar] [CrossRef] [PubMed]
- Jae, K.M.; Woo, L.S.; Ho, S.J. Normal Values of Total Body Water in Healthy Korean Adults: Comparison with Data from Western Populations. Yonsei Med J. 2002, 43, 363. [Google Scholar]
- Łątka, M.; Wójtowicz, K.; Drożdż, T.; Dąbrowska, E.; Kwinta, P.; Pietrzyk, J.A.; Drożdż, D. Relationship between water compartments, body composition assessed by bioelec-trical imped-ance analysis and blood pressure in school children. Prz. Le-karski. 2016, 73, 1. [Google Scholar]
- Kozio-Kozakowska, A. Body Composition and a School Day Hydration State among Polish Children—A Cross-Sectional Study. Int. J. Env. Res. Pub. He. 2020, 17, 7181. [Google Scholar] [CrossRef] [PubMed]
- Verlaan, S.; Aspray, T.J.; Bauer, J.M.; Cederholm, T.; Hemsworth, J.; Hill, T.R.; McPhee, J.S.; Piasecki, M.; Seal, C.; Sieber, C.C.; et al. Nutritional status, body composition, and quality of life in community-dwelling sarcopenic and non-sarcopenic older adults: A case-control study. Clin. Nutr. 2017, 36, 267–274. [Google Scholar] [CrossRef]
- Serra-Prat, M.; Lorenzo, I.; Palomera, E.; Ramírez, S.; Yébenes, J.C. Total Body Water and Intracellular Water Relationships with Muscle Strength, Frailty and Functional Performance in an Elderly Population. A Cross-Sectional Study. J. Nutr. Heal. Aging 2018, 23, 96–101. [Google Scholar] [CrossRef] [PubMed]
- Noda, Y.; Suzuki, H.; Kanai, T.; Samejima, Y.; Nasu, S.; Tanaka, A.; Morishita, N.; Okamoto, N.; Hirashima, T. The Association Between Extracellular Water-to-Total Body Water Ratio and Therapeutic Durability for Advanced Lung Cancer. Anticancer. Res. 2020, 40, 3931–3937. [Google Scholar] [CrossRef] [PubMed]
- Tanaka, S.; Ando, K.; Kobayashi, K.; Hida, T.; Seki, T.; Suzuki, K.; Ito, K.; Tsushima, M.; Morozumi, M.; Machino, M.; et al. Relationship between locomotive syndrome and body composition among com-munity-dwelling middle-age and elderly individuals in Japan: The Yakumo study. Mod. Rheumatol. 2019, 29, 491–495. [Google Scholar] [CrossRef]
- Tanaka, S.; Ando, K.; Kobayashi, K.; Nakashima, H.; Seki, T.; Ishizuka, S.; Machino, M.; Morozumi, M.; Kanbara, S.; Ito, S.; et al. Higher extracellular water-to-total body water ratio more strongly reflects the locomotive syndrome risk and frailty than sarcopenia. Arch. Gerontol. Geriatr. 2020, 88, 104042. [Google Scholar] [CrossRef]
- Nishikawa, H.; Yoh, K.; Enomoto, H.; Ishii, N.; Iwata, Y.; Nakano, C.; Takata, R.; Nishimura, T.; Aizawa, N.; Sakai, Y.; et al. Extracellular Water to Total Body Water Ratio in Viral Liver Diseases: A Study Using Bioimpedance Analysis. Nutrients 2018, 10, 1072. [Google Scholar] [CrossRef]
- Ohashi, Y.; Otani, T.; Tai, R.; Tanaka, Y.; Sakai, K.; Aikawa, A. Assessment of Body Composition Using Dry Mass Index and Ratio of Total Body Water to Estimated Volume Based on Bioelectrical Impedance Analysis in Chronic Kidney Disease Patients. J. Renal Nutr. 2013, 23, 28–36. [Google Scholar] [CrossRef]
- Park, S.; Lee, C.J.; Jhee, J.H.; Yun, H.; Kim, H.; Jung, S.; Kee, Y.K.; Yoon, C.; Park, J.T.; Kim, H.C.; et al. Extracellular Fluid Excess Is Significantly Associated with Coronary Artery Calcification in Patients with Chronic Kidney Disease. J. Am. Hear. Assoc. 2018, 7, e008935. [Google Scholar] [CrossRef] [PubMed]
- Sergi, G.; Lupoli, L.; Volpato, S.; Bertani, R.; Coin, A.; Perissinotto, E.; Calliari, I.; Inelmen, E.M.; Busetto, L.; Enzi, G. Body fluid distribution in elderly subjects with congestive heart failure. Ann. Clin. Lab. Sci. 2004, 34, 416–422. [Google Scholar]
- Taniguchi, M.; Yamada, Y.; Fukumoto, Y.; Sawano, S.; Minami, S.; Ikezoe, T.; Watanabe, Y.; Kimura, M.; Ichihashi, N. Increase in echo intensity and extracellular-to-intracellular water ratio is independently associated with muscle weakness in elderly women. Graefe’s Arch. Clin. Exp. Ophthalmol. 2017, 117, 2001–2007. [Google Scholar] [CrossRef] [PubMed]
- Ohashi, Y.; Joki, N.; Yamazaki, K. Changes in the fluid volume balance between intra- and extracellular water in a sample of Japanese adults aged 15–88 years old: A cross-sectional study. Am. J. Physiol-Renal. 2017, 314, F614–F622. [Google Scholar] [CrossRef] [PubMed]
- Booth, J.; Pinney, J.; Davenport, A. N-terminal proBNP—Marker of Cardiac Dysfunction, Fluid Overload, or Malnutrition in Hemodialysis Patients? Clin. J. Am. Soc. Nephrol. 2010, 5, 1036–1040. [Google Scholar] [CrossRef]
- Johansen, K.L.; Dalrymple, L.S.; Delgado, C.; Kaysen, G.A.; Kornak, J.; Grimes, B.; Chertow, G.M. Association between Body Composition and Frailty among Prevalent Hemodialysis Patients: A US Renal Data System Special Study. J. Am. Soc. Nephrol. 2013, 25, 381–389. [Google Scholar] [CrossRef]
- Mikkola, T.M.; Kautiainen, H.; Bonsdorff, M.B.; Salonen, M.K.; Wasenius, N.; Kajantie, E.; Eriksson, J.G. Body composition and changes in health-related quality of life in older age: A 10-year follow-up of the Helsinki Birth Cohort Study. Qual. Life. Res. 2020, 29, 2039–2050. [Google Scholar] [CrossRef]
- Zhang, N.; Zhang, J.; Du, S.; He, H.; Yan, X.; Ma, G. Association between the content of intracellular and extracellular fluid and the amount of water intake among Chinese college students. Nutr. Metab. 2019, 16, 1–10. [Google Scholar] [CrossRef]
- Laja García, A.; Moráis-Moreno, C.; Samaniego-Vaesken, M.; Puga, A.; Varela-Moreiras, G.; Partearroyo, T. Association be-tween Hydration Status and Body Composition in Healthy Adolescents from Spain. Nutrients 2019, 11, 2692. [Google Scholar] [CrossRef]
- Ferreirapego, C.; Guelinckx, I.; Moreno, L.A.; A Kavouras, S.; Gandy, J.J.; Martinez, H.; Bardosono, S.; Abdollahi, M.; Nasseri, E.; Jarosz, A.; et al. Total fluid intake and its determinants: Cross-sectional surveys among adults in 13 countries worldwide. Eur. J. Nutr. 2015, 54, 35–43. [Google Scholar] [CrossRef] [PubMed]
- Iglesia, I.; Guelinckx, I.; De Miguel-Etayo, P.M.; González-Gil, E.M.; Salas-Salvadó, J.; Kavouras, S.S.A.; Gandy, J.; Martínez, H.; Bardosono, S.; Abdollahi, M.; et al. Total fluid intake of children and adolescents: Cross-sectional surveys in 13 countries worldwide. Eur. J. Nutr. 2015, 54, 57–67. [Google Scholar] [CrossRef] [PubMed]
- Ma, G.; Zhang, Q.; Liu, A.; Zuo, J.; Zhang, W.; Zou, S.; Li, X.; Lu, L.; Pan, H.; Hu, X. Fluid intake of adults in four Chinese cit-ies. Nutr. Rev. 2012, 70, S105. [Google Scholar] [CrossRef]
- Zhang, J.; Zhang, N.; Liang, S.; Wang, Y.; Liu, S.; Liu, S.; Du, S.; He, H.; Xu, Y.; Cai, H.; et al. The amounts and contributions of total drinking fluids and water from food to total water intake of young adults in Baoding, China. Eur. J. Nutr. 2018, 58, 2669–2677. [Google Scholar] [CrossRef] [PubMed]
- Goulet, E.D.B.; Mélançon, M.O.; Lafrenière, D.; Paquin, J.; Maltais, M.; Morais, J.A. Impact of Mild Hypohydration on Muscle Endurance, Power and Strength in Healthy, Active Older Men. J. Strength Cond. Res. 2018, 32, 3405–3415. [Google Scholar] [CrossRef]
- Zhang, N.; Du, S.; Zhang, J.; Ma, G. Effects of Dehydration and Rehydration on Cognitive Performance and Mood among Male College Students in Cangzhou, China: A Self-Controlled Trial. Int. J. Environ. Res. Public Heal. 2019, 16, 1891. [Google Scholar] [CrossRef]
- Zhang, J.; Zhang, N.; He, H.; Du, S.; Ma, G. Different Amounts of Water Supplementation Improved Cognitive Performance and Mood among Young Adults after 12 h Water Restriction in Baoding, China: A Randomized Controlled Trial (RCT). Int. J. Environ. Res. Public Heal. 2020, 17, 7792. [Google Scholar] [CrossRef]
- Heavens, K.R.; Charkoudian, N.; O’Brien, C.; Kenefick, R.W.; Cheuvront, S.N. Noninvasive assessment of extracellular and intracellular dehydration in healthy humans using the resistance-reactance–score graph method. Am. J. Clin. Nutr. 2016, 103, 724–729. [Google Scholar] [CrossRef]
- Pross, N.; Demazieres, A.; Girard, N.; Barnouin, R.; Metzger, D.; Klein, A.; Perrier, E.; Guelinckx, I. Effects of changes in wa-ter intake on mood of high and low drinkers. PLoS ONE 2014, 9, e94754. [Google Scholar] [CrossRef] [PubMed]
- Khalil, S.F.; Mohktar, M.S.; Ibrahim, F. The Theory and Fundamentals of Bioimpedance Analysis in Clinical Status Monitoring and Diagnosis of Diseases. Sensors 2014, 14, 10895–10928. [Google Scholar] [CrossRef]
- Wu, C.-S.; Chen, Y.-Y.; Chuang, C.-L.; Chiang, L.-M.; Dwyer, G.B.; Hsu, Y.-L.; Huang, A.-C.; Lai, C.-L.; Hsieh, K.-C. Predicting body composition using foot-to-foot bioelectrical impedance analysis in healthy Asian individuals. Nutr. J. 2015, 14, 1–9. [Google Scholar] [CrossRef] [PubMed]
- Andreoli, A.; Garaci, F.; Cafarelli, F.P.; Gugliemi, G. Body composition in clinical practice. Eur. J. Radiol. 2016, 85, 1461–1468. [Google Scholar] [CrossRef] [PubMed]
- Ling, C.H.Y.; Craen, A.J.M.D.; Slagboom, P.E.; Gunn, D.A.; Stokkel, M.P.M.; Westendorp, R.G.J.; Maier, A.B. Accuracy of direct segmental multi-frequency bioimpedance analysis in the assessment of total body and segmental body composition in middle-aged adult population. Clin. Nutr. 2011, 30, 610–615. [Google Scholar] [CrossRef] [PubMed]
- Rabe, E.F. Relationship between absolute body-fluid deficits and fluid intake in the rat. J. Comp. Physiol. Psychol. 1975, 89, 468–477. [Google Scholar] [CrossRef]
- Anna, B.; Pau, E.; Bescós, R. Energy Balance of Triathletes during an Ultra-Endurance Event. Nutrients 2015, 7, 209–222. [Google Scholar]
- Utter, A.C.; McAnulty, S.R.; Riha, B.F.; Pratt, B.A.; Grose, J.M. The Validity of Multifrequency Bioelectrical Impedance Measures to Detect Changes in the Hydration Status of Wrestlers During Acute Dehydration and Rehydration. J. Strength Cond. Res. 2012, 26, 9–15. [Google Scholar] [CrossRef]
- Patterson, M.J.; Stocks, J.M.; Taylor, N.A. Whole-body fluid distribution in humans during dehydration and recovery, be-fore and after humid-heat acclimation induced using controlled hyperthermia. Acta Physiol. 2014, 210, 899–912. [Google Scholar] [CrossRef] [PubMed]
- Colt, E.W.; Wang, J.; Pierson, R.N. Effect on body water of running 10 miles. J. Appl. Physiol. 1978, 45, 999–1001. [Google Scholar] [CrossRef]
- Knechtle, B.; Duff, B.; Schulze, I.; Kohler, G. A Multi-Stage Ultra-Endurance Run over 1200 KM Leads to a Continuous Ac-cumulation of Total Body Water. J. Sports Sci. Med. 2008, 7, 357–364. [Google Scholar]
- Silva, A.M.; Wang, J.; Pierson, R.N.; Wang, Z.; Heymsfield, S.B.; Sardinha, L.B.; Heshka, S. Extracellular water: Greater ex-pansion with age in African Americans. J. Appl. Physiol. 2005, 99, 261–267. [Google Scholar] [CrossRef] [PubMed]
- Guillermo, F.L.; Łukasz, R.; Maria, S.; Joanna, J.; Lee, S.; Dorota, W.; Zbigniew, J. Body Composition, Physical Fitness, Physical Activity and Nutrition in Polish and Spanish Male Students of Sports Sciences: Differences and Correlations. Int. J. Env. Res. Pub. He. 2019, 16, 1148. [Google Scholar]
- Aloia, J.F.; Vaswani, A.; Flaster, E.; Ma, R. Relationship of body water compartments to age, race, and fat-free mass. J. Lab. Clin. Med. 1998, 132, 483–490. [Google Scholar] [CrossRef]
- Gibson, A.L.; Beam, J.R.; Alencar, M.K.; Zuhl, M.N.; Mermier, C.M. Time course of supine and standing shifts in total body, intracellular and extracellular water for a sample of healthy adults. Eur. J. Clin. Nutr. 2014, 69, 14–19. [Google Scholar] [CrossRef] [PubMed]
- Stookey, J.D.; Hamer, J.; Killilea, D.W. Change in hydration indices associated with an increase in total water intake of more than 0.5 L/day, sustained over 4 weeks, in healthy young men with initial total water intake below 2 L/day. Physiol. Rep. 2017, 5, e13356. [Google Scholar] [CrossRef]
- Ugras, S. Evaluating of altered hydration status on effectiveness of body composition analysis using bioelectric impedance analysis. Libyan J. Med. 2020, 15, 1741904. [Google Scholar] [CrossRef]
- Nakamura, Y.; Watanabe, H.; Tanaka, A.; Yasui, M.; Nishihira, J.; Murayama, N. Effect of Increased Daily Water Intake and Hydration on Health in Japanese Adults. Nutrients 2020, 12, 1191. [Google Scholar] [CrossRef] [PubMed]
- Laja, G.A.; Morais-Moreno, C.; Samaniego-Vaesken, M.L.; Puga, A.M.; Partearroyo, T.; Varela-Moreiras, G. Influence of Water Intake and Balance on Body Composition in Healthy Young Adults from Spain. Nutrients 2019, 11, 1923. [Google Scholar]
- Heinrich, W.; Kim, N.; Julia, M. Total Body Water, Electrolyte, and Thermoregulatory Responses to Ad Libitum Water Replacement Using Two Different Water Delivery Systems During a 19-km Route March. J. Strength. Cond. Res. 2015, 29, S88–S93. [Google Scholar]
- Tucker, M.A.; Adams, J.D.; Brown, L.A.; Ridings, C.B.; Burchfield, J.M.; Robinson, F.B.; McDermott, J.L.; Schreiber, B.A.; Moyen, N.E.; Washington, T.A.; et al. No Change in 24-Hour Hydration Status Following a Moderate Increase in Fluid Consumption. J. Am. Coll. Nutr. 2015, 35, 308–316. [Google Scholar] [CrossRef] [PubMed]
- Lebus, D.K.; Casazza, G.A.; Hoffman, M.D.; Van Loan, M.D. Can changes in body mass and total body water accurately pre-dict hyponatremia after a 161-km running race? Clin. J. Sport Med. 2010, 20, 193–199. [Google Scholar] [CrossRef] [PubMed]


| Baseline Test | Dehydration Test | t | p | Rehydration Test | F | p | ||||||||||||
|---|---|---|---|---|---|---|---|---|---|---|---|---|---|---|---|---|---|---|
| Total | WR Group 1 (n = 20) | WR Group 2 (n = 20) | WR Group 3 (n = 18) | NR Group (n = 18) | Total | WR Group 1 (n = 20) | WR Group 2 (n = 20) | WR Group 3 (n = 18) | NR Group (n = 18) | Total | WR Group 1 (n = 20) | WR Group 2 (n = 20) | WR Group 3 (n = 18) | NR Group (n = 18) | ||||
| ICW | 21.4 ± 3.6 | 21.3 ± 4.8 | 20.1 ± 4.1 | 20.8 ± 3.7 | 20.9 ± 4.0 | 21.5 ± 3.8 | 21.1 ± 4.8 a | 20.1 ± 4.1 a | 20.7 ± 3.7 a | 20.9 ± 4.1 | 1.347 | 0.182 | 21.5 ± 3.7 | 21.0 ± 4.8 | 19.9 ± 4.2 | 20.4 ± 3.7 | 3.002 | 0.036 |
| ICW/TBW (%) | 62.2 ± 0.6 | 62.4 ± 0.6 | 62.3 ± 0.6 | 62.4 ± 0.6 | 62.3 ± 0.6 a | 62.5 ± 0.7 a | 62.6 ± 0.5 | 62.7 ± 0.7 | 62.8 ± 0.7 a | 62.7 ± 0.6 | −9.937 | <0.001 | 62.3 ± 0.8 | 62.5 ± 0.6 | 62.6 ± 0.7 | 62.6 ± 0.8 | 1.073 | 0.366 |
| ECW | 13.0 ± 2.0 | 12.8 ± 2.7 | 12.1 ± 2.2 | 12.5 ± 2.1 | 12.6 ± 2.3 a | 12.9 ± 2.1 | 12.6 ± 2.7 | 11.9 ± 2.2 a | 12.3 ± 2.1 a | 12.4 ± 2.3 | 6.946 | <0.001 | 13.0 ± 2.0 | 12.5 ± 2.7 | 11.8 ± 2.3 | 12.2 ± 2.1 | 2.592 | 0.059 |
| ECW/TBW (%) | 37.8 ± 0.5 | 37.6 ± 0.5 | 37.8 ± 0.6 | 37.6 ± 0.7 | 37.7 ± 0.6 a | 37.5 ± 0.7 a | 37.4 ± 0.5 | 37.3 ± 0.7 | 37.2 ± 0.7 a | 37.4 ± 0.6 | 9.936 | <0.001 | 37.7 ± 0.8 | 37.4 ± 0.6 | 37.4 ± 0.7 | 37.4 ± 0.8 | 1.076 | 0.365 |
| ECW/ICW (%) | 60.8 ± 1.5 | 60.2 ± 1.5 | 60.5 ± 1.5 | 60.2 ± 1.8 | 60.4 ± 1.6 a | 60.1 ± 1.7 a | 59.7 ± 1.3 | 59.5 ± 1.7 | 59.3 ± 1.8 a | 59.6 ± 1.6 | 9.926 | <0.001 | 60.4 ± 2.1 | 60.0 ± 1.4 | 59.7 ± 1.9 | 59.8 ± 2.0 | 1.056 | 0.373 |
| TBW | 34.5 ± 5.6 | 34.0 ± 7.4 | 32.2 ± 6.3 | 33.3 ± 5.8 | 33.5 ± 6.3 a | 34.3 ± 5.9 | 33.7 ± 7.5 a | 32.0 ± 6.3 a | 33.0 ± 5.8 a | 33.3 ± 6.4 | 3.768 | <0.001 | 34.5 ± 5.6 | 33.5 ± 7.5 | 31.7 ± 6.5 | 32.6 ± 5.8 | 2.907 | 0.040 |
| TBW/BW (%) | 54.3 ± 6.8 | 52.4 ± 5.7 | 55.3 ± 4.9 | 54.8 ± 4.1 | 54.9 ± 5.5 | 54.3 ± 7.1 a | 52.4 ± 5.7 a | 55.1 ± 4.9 a | 54.7 ± 3.7 a | 54.1 ± 5.5 | 0.942 | 0.349 | 53.6 ± 7.2 | 52.0 ± 5.7 | 54.6 ± 4.9 | 54.2 ± 3.8 | 0.594 | 0.621 |
| Baseline Test | Dehydration Test | t | p | Rehydration Test | F | p | ||||||||||||
|---|---|---|---|---|---|---|---|---|---|---|---|---|---|---|---|---|---|---|
| Males | WR Group 1 (n = 10) | WR Group 2 (n = 10) | WR Group 3 (n = 10) | NR Group (n = 10) | Total | WR Group 1 (n = 10) | WR Group 2 (n = 10) | WR Group 3 (n = 10) | NR Group (n = 10) | Total | WR Group 1 (n = 10) | WR Group 2 (n = 10) | WR Group 3 (n = 10) | NR Group (n = 10) | ||||
| ICW | 24.4 ± 1.5 c | 24.7 ± 4.2 c | 23.4 ± 2.7 c | 23.5 ± 2.3 c | 24.0 ± 2.8 d | 24.5 ± 1.7 c | 24.5 ± 4.4 c | 23.4 ± 2.6 c | 23.4 ± 2.4 bc | 24.0 ± 2.9 d | 0.268 | 0.790 | 24.5 ± 1.8 c | 24.5 ± 4.3 c | 23.3 ± 2.6 c | 23.2 ± 2.3 c | 3.061 | 0.040 |
| ICW/TBW (%) | 62.5 ± 0.4 c | 62.8 ± 0.4 c | 62.7 ± 0.3 c | 62.8 ± 0.5 c | 62.7 ± 0.4 ad | 62.8 ± 0.4 c | 62.9 ± 0.3 c | 63.1 ± 0.4 c | 63.2 ± 0.6 bc | 63.0 ± 0.5 d | −7.291 | <0.001 | 62.8 ± 0.4 c | 62.9 ± 0.3 c | 62.1 ± 0.5 c | 63.0 ± 0.6 c | 2.702 | 0.060 |
| ECW | 14.6 ± 0.9 c | 14.6 ± 2.5 c | 13.9 ± 1.5 c | 13.9 ± 1.6 c | 14.3 ± 1.7 ad | 14.5 ± 1.0 c | 14.4 ± 2.6 c | 13.7 ± 1.5 c | 13.7 ± 1.5 c | 14.1 ± 1.7 d | 3.979 | <0.001 | 14.5 ± 1.0 c | 14.4 ± 2.5 c | 13.6 ± 1.5 c | 13.6 ± 1.5 c | 1.475 | 0.238 |
| ECW/TBW (%) | 37.5 ± 0.4 c | 37.2 ± 0.4 c | 37.2 ± 0.3 c | 37.2 ± 0.5 c | 37.3 ± 0.4 ad | 37.2 ± 0.4 c | 37.1 ± 0.3 c | 36.9 ± 0.4 c | 36.8 ± 0.6 bc | 37.0 ± 0.5 d | 7.291 | <0.001 | 37.2 ± 0.4 c | 37.1 ± 0.3 c | 37.9 ± 0.5 c | 37.0 ± 0.6 c | 2.702 | 0.060 |
| ECW/ICW (%) | 60.1 ± 1.1 c | 59.2 ± 1.1 c | 59.3 ± 0.9 c | 59.2 ± 1.3 c | 59.5 ± 1.1 ad | 59.2 ± 1.0 c | 58.9 ± 0.9 c | 58.4 ± 1.1 c | 58.3 ± 1.4 bc | 58.7 ± 1.1 d | 7.338 | <0.001 | 59.2 ± 1.1 c | 59.0 ± 0.7 c | 58.4 ± 1.2 c | 58.7 ± 1.6 c | 2.697 | 0.060 |
| TBW | 39.0 ± 2.4 c | 39.3 ± 6.7 c | 37.2 ± 4.1 c | 37.4 ± 3.8 c | 38.3 ± 4.4 d | 39.0 ± 2.6 c | 38.9 ± 7.0 c | 37.1 ± 4.1 c | 37.1 ± 3.8 bc | 38.1 ± 4.6 d | 1.772 | 0.084 | 39.0 ± 2.8 c | 38.9 ± 6.8 c | 36.9 ± 4.1 c | 36.8 ± 3.7 c | 2.500 | 0.075 |
| TBW/BW (%) | 58.5 ± 5.1 c | 55.5 ± 5.7 c | 57.2 ± 5.0 | 56.3 ± 4.7 | 56.9 ± 5.1 d | 58.7 ± 5.4 bc | 55.5 ± 5.9 c | 57.0 ± 4.8 | 56.1 ± 4.3 b | 56.8 ± 5.1 d | 0.419 | 0.677 | 58.2 ± 5.3 c | 55.3 ± 5.7 c | 56.7 ± 4.7 | 55.8 ± 4.3 c | 0.628 | 0.602 |
| Females | WR group 1 (n = 10) | WR group 2 (n = 10) | WR group 3 (n = 8) | NR group (n = 8) | Total | WR group 1 (n = 10) | WR group 2 (n = 10) | WR group 3 (n = 8) | NR group (n = 8) | Total | t | p | WR group 1 (n = 10) | WR group 2 (n = 10) | WR group 3 (n = 8) | NR group (n = 8) | F | p |
| ICW | 17.9 ± 1.4 | 17.8 ± 2.0 | 16.8 ± 2.1 | 17.4 ± 1.7 | 17.5 ± 1.8 a | 17.7 ± 1.4 | 17.8 ± 1.9 b | 16.7 ± 2.0 b | 17.4 ± 1.7 b | 17.4 ± 1.8 | 2.622 | 0.013 | 17.9 ± 0.8 | 17.5 ± 1.9 | 16.4 ± 2.1 | 17.0 ± 1.7 | 3.002 | 0.036 |
| ICW/TBW (%) | 61.8 ± 0.6 | 62.1 ± 0.5 | 61.9 ± 0.4 | 61.9 ± 0.6 | 61.9 ± 0.5 a | 62.1 ± 0.7 b | 62.4 ± 0.5 b | 62.3 ± 0.6 b | 62.3 ± 0.5 b | 62.3 ± 0.6 | −6.777 | <0.001 | 61.8 ± 0.6 | 62.2 ± 0.6 | 62.1 ± 0.5 | 62.0 ± 0.6 | 1.073 | 0.366 |
| ECW | 11.1 ± 1.0 | 10.9 ± 1.2 | 10.4 ± 1.2 | 10.7 ± 1.1 | 10.8 ± 1.1 a | 10.8 ± 1.0 | 10.7 ± 1.1 b | 10.1 ± 1.1 | 10.5 ± 1.2 | 10.5 ± 1.1 | 6.744 | <0.001 | 11.1 ± 0.7 | 10.6 ± 1.1 | 10.0 ± 1.2 | 10.4 ± 1.1 | 2.592 | 0.059 |
| ECW/TBW (%) | 38.2 ± 0.6 | 38.0 ± 0.5 | 38.1 ± 0.4 | 38.1 ± 0.6 | 38.1 ± 0.5 a | 37.9 ± 0.7 b | 37.7 ± 0.5 b | 37.7 ± 0.5 b | 37.7 ± 0.5 b | 37.7 ± 0.6 | 6.776 | <0.001 | 38.3 ± 0.7 | 37.8 ± 0.6 | 37.9 ± 0.5 | 38.0 ± 0.6 | 1.076 | 0.365 |
| ECW/ICW (%) | 61.8 ± 1.5 | 61.2 ± 1.3 | 61.6 ± 1.1 | 61.5 ± 1.5 | 61.5 ± 1.3 a | 61.1 ± 1.8 b | 60.4 ± 1.4 b | 60.5 ± 1.5 b | 60.5 ± 1.3 b | 60.6 ± 1.5 | 6.758 | <0.001 | 62.0 ± 1.9 | 60.9 ± 1.5 | 61.1 ± 1.4 | 61.2 ± 1.4 | 1.056 | 0.373 |
| TBW | 28.9 ± 2.4 | 28.7 ± 3.2 | 27.2 ± 3.3 | 28.1 ± 2.8 | 28.3 ± 2.9 a | 28.5 ± 2.3 | 28.5 ± 3.0 b | 26.9 ± 3.1 b | 27.9 ± 2.9 b | 27.9 ± 2.8 | 4.864 | <0.001 | 29.0 ± 1.4 | 28.1 ± 2.9 | 26.4 ± 3.2 | 27.4 ± 2.8 | 2.907 | 0.040 |
| TBW/BW (%) | 49.2 ± 5.1 | 49.4 ± 3.8 | 53.4 ± 4.2 | 53.0 ± 2.2 | 51.2 ± 4.3 | 49.0 ± 5.1 | 49.3 ± 3.5 b | 53.3 ± 4.5 b | 53.0 ± 1.9 b | 51.1 ± 4.3 | 1.148 | 0.259 | 48.0 ± 4.9 | 48.7 ± 3.6 | 52.5 ± 4.3 | 52.2 ± 2.0 | 0.594 | 0.621 |
Publisher’s Note: MDPI stays neutral with regard to jurisdictional claims in published maps and institutional affiliations. |
© 2021 by the authors. Licensee MDPI, Basel, Switzerland. This article is an open access article distributed under the terms and conditions of the Creative Commons Attribution (CC BY) license (http://creativecommons.org/licenses/by/4.0/).
Share and Cite
Zhang, J.; Zhang, N.; Du, S.; Liu, S.; Ma, G. Effects of Water Restriction and Water Replenishment on the Content of Body Water with Bioelectrical Impedance among Young Adults in Baoding, China: A Randomized Controlled Trial (RCT). Nutrients 2021, 13, 553. https://doi.org/10.3390/nu13020553
Zhang J, Zhang N, Du S, Liu S, Ma G. Effects of Water Restriction and Water Replenishment on the Content of Body Water with Bioelectrical Impedance among Young Adults in Baoding, China: A Randomized Controlled Trial (RCT). Nutrients. 2021; 13(2):553. https://doi.org/10.3390/nu13020553
Chicago/Turabian StyleZhang, Jianfen, Na Zhang, Songming Du, Shufang Liu, and Guansheng Ma. 2021. "Effects of Water Restriction and Water Replenishment on the Content of Body Water with Bioelectrical Impedance among Young Adults in Baoding, China: A Randomized Controlled Trial (RCT)" Nutrients 13, no. 2: 553. https://doi.org/10.3390/nu13020553
APA StyleZhang, J., Zhang, N., Du, S., Liu, S., & Ma, G. (2021). Effects of Water Restriction and Water Replenishment on the Content of Body Water with Bioelectrical Impedance among Young Adults in Baoding, China: A Randomized Controlled Trial (RCT). Nutrients, 13(2), 553. https://doi.org/10.3390/nu13020553