Article

Evaluation of Nutri-Score in Relation to Dietary Guidelines and Food Reformulation in The Netherlands

by
Sovianne ter Borg
,
Elly Steenbergen
,
Ivon E. J. Milder
and
Elisabeth H. M. Temme
*
National Institute for Public Health and the Environment, 3721 MA Bilthoven, The Netherlands
*
Author to whom correspondence should be addressed.
Nutrients 2021, 13(12), 4536; https://doi.org/10.3390/nu13124536
Submission received: 10 November 2021 / Revised: 8 December 2021 / Accepted: 14 December 2021 / Published: 17 December 2021
(This article belongs to the Section Nutrition and Public Health)

Abstract

:
An unhealthy dietary pattern is an important risk factor for non-communicable diseases. Front-of-Pack nutritional labels such as Nutri-Score can be used to improve food choices. In addition, products can be improved through reformulation. The current study investigates to what extent Nutri-Score aligns with the Dutch Health Council dietary guidelines and whether it can be used as an incentive for reformulation. Nutri-Score calculations were based on the Dutch Branded Food database (2018). The potential shift in Nutri-Score was calculated with product improvement scenarios. The Nutri-Score classification is in line with these dietary guidelines: increase the consumption of fruit and vegetables, pulses, and unsalted nuts. It is, however, less in line with the recommendations to limit (dairy) drinks with added sugar, reduce the consumption of red meat and replace refined cereal products with whole-grain products. The scenario analyses indicated that a reduction in sodium, saturated fat or sugars resulted in a more favourable Nutri-Score in a large variety of food groups. However, the percentage of products with an improved Nutri-Score varied greatly between the different food groups. Alterations to the algorithm may strengthen Nutri-Score in order to help consumers with their food choices.

1. Introduction

An unhealthy dietary pattern is an important risk factor for non-communicable diseases [1]. To help consumers make informed, healthier food choices, the World Health Organization recommends product reformulation and the use of nutritional labelling [1,2,3]. Although food packages contain nutritional declarations at the back-of-pack there is a need for easier ways to inform the consumer about nutritional content. Front-of-Pack (FoP) labels are labels which are easy to understand and are clearly visible.
Nutri-Score is a FoP label developed in France by the National Epidemiology Research Institute [4] and was developed based on the existing evidence of the association between food consumption and chronic disease risk. In 2017, Nutri-Score was selected as the official national label in France [4]. Since then, Nutri-Score has been adopted by several European countries: Belgium, Spain, Germany, Switzerland, and Luxembourg [5]. In 2020, after considering different FoP labels [6], it was decided that Nutri-Score will be implemented in the Netherlands [7]. The use of Nutri-Score is voluntary in countries where it is being used. The Nutri-Score logo has two objectives: first, to guide consumers towards healthier food choices for packaged foods [4] and second to stimulate food reformulation [8].
Dietary guidelines and FoP labels such as Nutri-Score can be complementary and synergic measures, although based on different approaches and principles. Both are based on the existing evidence on associations between food consumption and risk and mortality from chronic diseases [9]. In the Netherlands, the evidence is summarized by the dietary guidelines of the Health Council [10]. Dietary guidelines identify food groups that are encouraged (e.g., fruits, vegetables, legumes etc.) and those that should be limited (e.g., red meat, salt), and recommend amounts for certain food groups (e.g., at least 200 g of vegetables and fruit daily) [10]. The Health Council dietary guidelines are subsequently translated into food based dietary guidelines, such as the Wheel of Five in the Netherlands. The Wheel of Five combines the food based dietary guidelines and daily recommended values into practical guidelines for consumers, to obtain healthy and complete food patterns, i.e., reducing the risk of disease and obtaining sufficient nutrients [11]. This translation covers a wider food consumption pattern and serves specific target groups such as children, men and (pregnant) women and older adults. In this study we take the guidelines from the Health Council as a starting point as these are closest to the evidence on the association between food consumption and chronic diseases. In addition, it enables comparison with international diet guidelines and studies.
Nutri-Score can be a helpful tool for consumers to identify healthier products and discriminate nutritional quality across and within packaged food groups with nutrient declarations [5]. Nutri-Score consists of five coloured categories (ranging from A: dark green to E: dark orange, Figure 1), which indicate the overall nutritional quality of the product within a food group [4,12,13]. The Nutri-Score is based on the United Kingdom Food Standards Agency Nutrient Profiling System. Points are allocated to the energy, sugar, saturated fat and sodium contents (‘negative point’), and for the fruit, vegetables, pulses and nuts, fibre, and protein content (‘positive points’). An algorithm is used to calculate an overall score which is subsequently categorized into five categories (A to E) representing the range of products with a higher nutritional quality to products with a lower nutritional quality. Slightly different algorithms are used for beverages, fats and oils, and cheeses. For additional details on the Nutri-Score calculation see [13].
In a study [5] in eight countries (i.e., Finland, France, Norway, Poland, Portugal, Slovakia, Sweden, Switzerland, but not including the Netherlands) the overall distribution of foods in the different Nutri-Score classes was compared with the food-based dietary guidelines from these countries and the general guidelines from the WHO. The study showed high discriminating ability (i.e., containing at least three Nutri-Score categories) for all food groups, with similar results in the different countries, and consistency with nutritional recommendations [5]. For instance, 91–96% of fruit and vegetable products were classified in the two healthiest Nutri-Score categories, while sugar (products) and butter/animal fats were mainly classified in the two less healthy categories of the Nutri-Score (88% in both groups respectively). For the food groups meat, meat products and milk, milk products and milk substitutes, however, differences were found in the Nutri-Score distribution between the countries. The authors state that this is possibly due to the large diversity of these food groups. Although previous studies in European countries have shown promising results, it is unclear to what extent Nutri-Score can discriminate packaged foods on their nutritional quality in line with the Dutch food-based dietary guidelines.
The other objective of Nutri-Score is to stimulate food product improvement [4]. The ability of a FoP logo to stimulate food reformulation was shown in previous research on the Dutch Choices logo [15]. For Nutri-Score, however, this is scarcely studied. The ratings of the FoP logo, based on the algorithm, may provide an incentive for the producer for, e.g., salt or sugar reduction or increased fibre content. For example, by lowering the salt content, a better Nutri-Score rating and colour may be reached.
Therefore, the aims of the current study are: (1) to investigate to what extent the Nutri-Score classification of foods and drinks aligns with the Dutch food-based dietary guidelines and (2) to perform theoretical scenario analyses as to whether Nutri-Score can be an incentive for reformulation of (un)favourable components.

2. Materials and Methods

2.1. Data Preparation for the Calculation of Nutri-Score

For the current analyses, food composition data from the Dutch Branded Food database [16,17] were used. This database contains the back-of-pack nutritional information and includes both private brands as well as supermarket brands. Data from 2018 were used. Food groups were defined according to the Dutch RIVM Reformulation Monitor 2018 [18]. Food groups not classified within the Reformulation Monitor (such as unprocessed meat) were created based on characteristics available within the Branded Food Composition Database. Nutri-Scores were calculated for foods with a mandatory nutrient declaration, as stated in the EU Regulation No 1169/2011 [19]. Nutri-Scores were also calculated for un/minimally processed fruit and vegetables and fresh meat products, for the evaluation of alignment with dietary guidelines. These product groups are at the moment not eligible for a Nutri-Score as they do not have a mandatory nutrient declaration. Other food groups for which the nutrient declaration is not mandatory (alcoholic drinks, coffee, tea, and eggs), alcohol-free beverages and nutritional supplements were excluded. A total of 52,357 records were included in the analyses.
Nutri-Score calculation guidelines [13] were followed. Walnut, rapeseed and olive oils in the food group ‘Oils and fats’ were assigned a Nutri-Score C. These oils can also be included as an ingredient in products. However, as the type of oil is not always listed on the nutrition label, these were not included in the Nutri-Score calculation. Dairy drinks were assumed to contain more than 80% milk and were considered as foods, following the calculation guidelines. Information on the content of fruit, vegetables, pulses and nuts (%) in foods was not available. Therefore, an estimation was made per food group, based on the ingredient lists (see Appendix A, Table A1).
Products with missing values (i.e., energy, sugar, saturated fat, sodium, protein, fibre, and fruit, vegetables, pulses and nuts content) were excluded, except for fresh fruit, fresh vegetables and bottled water: these products were assigned a Nutri-Score A. As declaration of fibre content is not mandatory, depending on the food groups there was a relatively high proportion of missing values. Therefore, for missing values the mean fibre content was imputed at food group level (see Appendix A, Table A2).
Outliers were removed at food group level by removing products with values below the first percentile and above the 99th percentile for nutrients needed for the calculation of the Nutri-Score. The Nutri-Score was computed based on the algorithm of Santé Publique France [14]. ‘Negative points’ (0–10) were allocated to the energy, sugar, saturated fat and sodium content, and ‘positive points’ (0–5) to the fruit, vegetables, pulses and nuts, fibre, and protein content. The overall score (range −15 to +40) was calculated by subtracting the ‘positive points’ from the ‘negative points’. If the total for fruits and vegetables was below five points, then the total points for protein was not subtracted from the ‘negative points’ for the calculation of the overall score. Depending on the score, one of the five Nutri-Score categories was assigned (A–E). ‘A’ represents foods with a higher nutritional quality; ‘E’ represents foods with a lower nutritional quality.

2.2. Evaluation of Aligment with Food-Based Dietary Guidelines

To determine to what extent the Nutri-Score is consistent with the dietary guidelines, the percentage of products per Nutri-Score category was calculated and compared to the Dutch food-based dietary guidelines 2015 [10,20]. These guidelines were derived from existing scientific evidence and include 15 specific guidelines on the consumption of foods and nutrients.
The dietary guidelines for food groups are to increase consumption (e.g., vegetables and fruits), to limit consumption (e.g., sugar-containing beverages), to moderate consumption (e.g., dairy) or to replace products (e.g., refined by whole grain cereal products or hard fats by oils) (see Table 1). The Nutri-Score category distribution was calculated for the food groups specified in the dietary guidelines. The dietary guidelines include the recommendation to limit the total salt intake (i.e., from foods and added by the consumer in the kitchen or at the table) to 6 g per day. The guidelines, however, do not specify which salt-rich foods should be limited. Bread, cheeses, meat preparations, savoury snacks and ready meals are mentioned as examples of products high in salt and are therefore included in the current analyses as foods to limit consumption of [10]. Other food groups, such as soups and sauces, contribute to the salt intake, but are not specifically mentioned in the guidelines, and are therefore not included in the analyses.
For the comparison between Nutri-Score and the guidelines, a similar method was used as described previously [21]. In case of good agreement with the dietary guidelines, it was expected that foods for which an increased consumption is recommended would mainly have a Nutri-Score A or B. Foods for which the consumption should be limited would mainly have a Nutri-Score D or E. The Nutri-Score and the dietary guidelines were considered to agree when >80% of the products in ‘increase consumption’ food groups scored an A or B and if >80% of the products in ‘limit consumption’ or ‘minimize consumption’ food groups scored a Nutri-Score D or E. The guidelines recommend the ‘replacement’ of refined cereal products with unrefined or whole-grain products to increase the fibre intake. To see whether fibre-rich products scored a more favourable Nutri-Score, the Nutri-Score categories in the product group ‘Cereals’ were analysed per quartile of fibre content. In addition, the fibre content was analysed per type of bread (e.g., whole grain) and Nutri-Score. The guidelines also recommend replacement of saturated by unsaturated fatty acids; therefore within the groups ‘Oils and fats’ the Nutri-Score distribution was calculated per quartile of ratio saturated fat/total fat. The Nutri-Score categories for ‘Meat preparations’, ‘Savoury snacks’ and ‘Ready meals’ were analyses per quartile of sodium content. The results of the quartile analyses were visually inspected.

2.3. Evaluation of Stimulation of Food Reformulation

To evaluate whether Nutri-Score could be an incentive for food reformulation, food groups with processed foods were selected based on their contribution to the total daily salt, saturated fat and sugar intake. The contribution to the total daily nutrient intake was based on the Dutch Food Consumption Survey 2012–2016 [22]. This survey includes a representative sample of the Dutch population aged 1–79 years (n = 4313). For fibre, a selection of food groups was chosen: cereal products and composite dishes. Food groups for which the contribution to the total daily nutrient (i.e., sodium, sugar, saturated fat) was assumed to be relevant (intake above 3%) and for which product reformulation on the specific nutrient is feasible were included. These include processed and composite products with added salt and/or sugar such as sauces, snacks, sweets, sugar-sweetened beverages and processed meats. The food groups are—to a large extent—the food groups of which consumption should be limited according to the Dutch food-based dietary guidelines.
The potential shift in Nutri-Score was calculated with theoretical product improvement scenarios. It was assessed whether a 1-point decrease in the Nutri-Score sub score could result in a more favourable Nutri-Score. As a reference, food compositions from the Dutch Branded Food database were used. In the sodium product improvement scenario sodium levels were modelled to decrease by 90 mg/100 g (1 point on the Nutri-Score sub score). In the saturated fat product improvement scenario, saturated fatty acid levels were decreased by 1 g/100 g (1 point on the Nutri-Score sub score). For the sugar product improvement scenario sugar levels were decreased −4.5 g for foods and −1.5 g for drinks per 100 g (−1 point on the Nutri-Score sub score). The product improvement scenario was also calculated for fibre content: scoring 1 point more (+0.9 g/100 g) on the Nutri-Score scale. All other components did not change. For all scenarios, the Nutri-Score for each food was recalculated and the number of foods per Nutri-Score were compared with the reference situation. The percentage of foods in each Nutri-Score category was calculated and compared with the reference situation for each score (A–E) as well as the total percentage of change.

3. Results

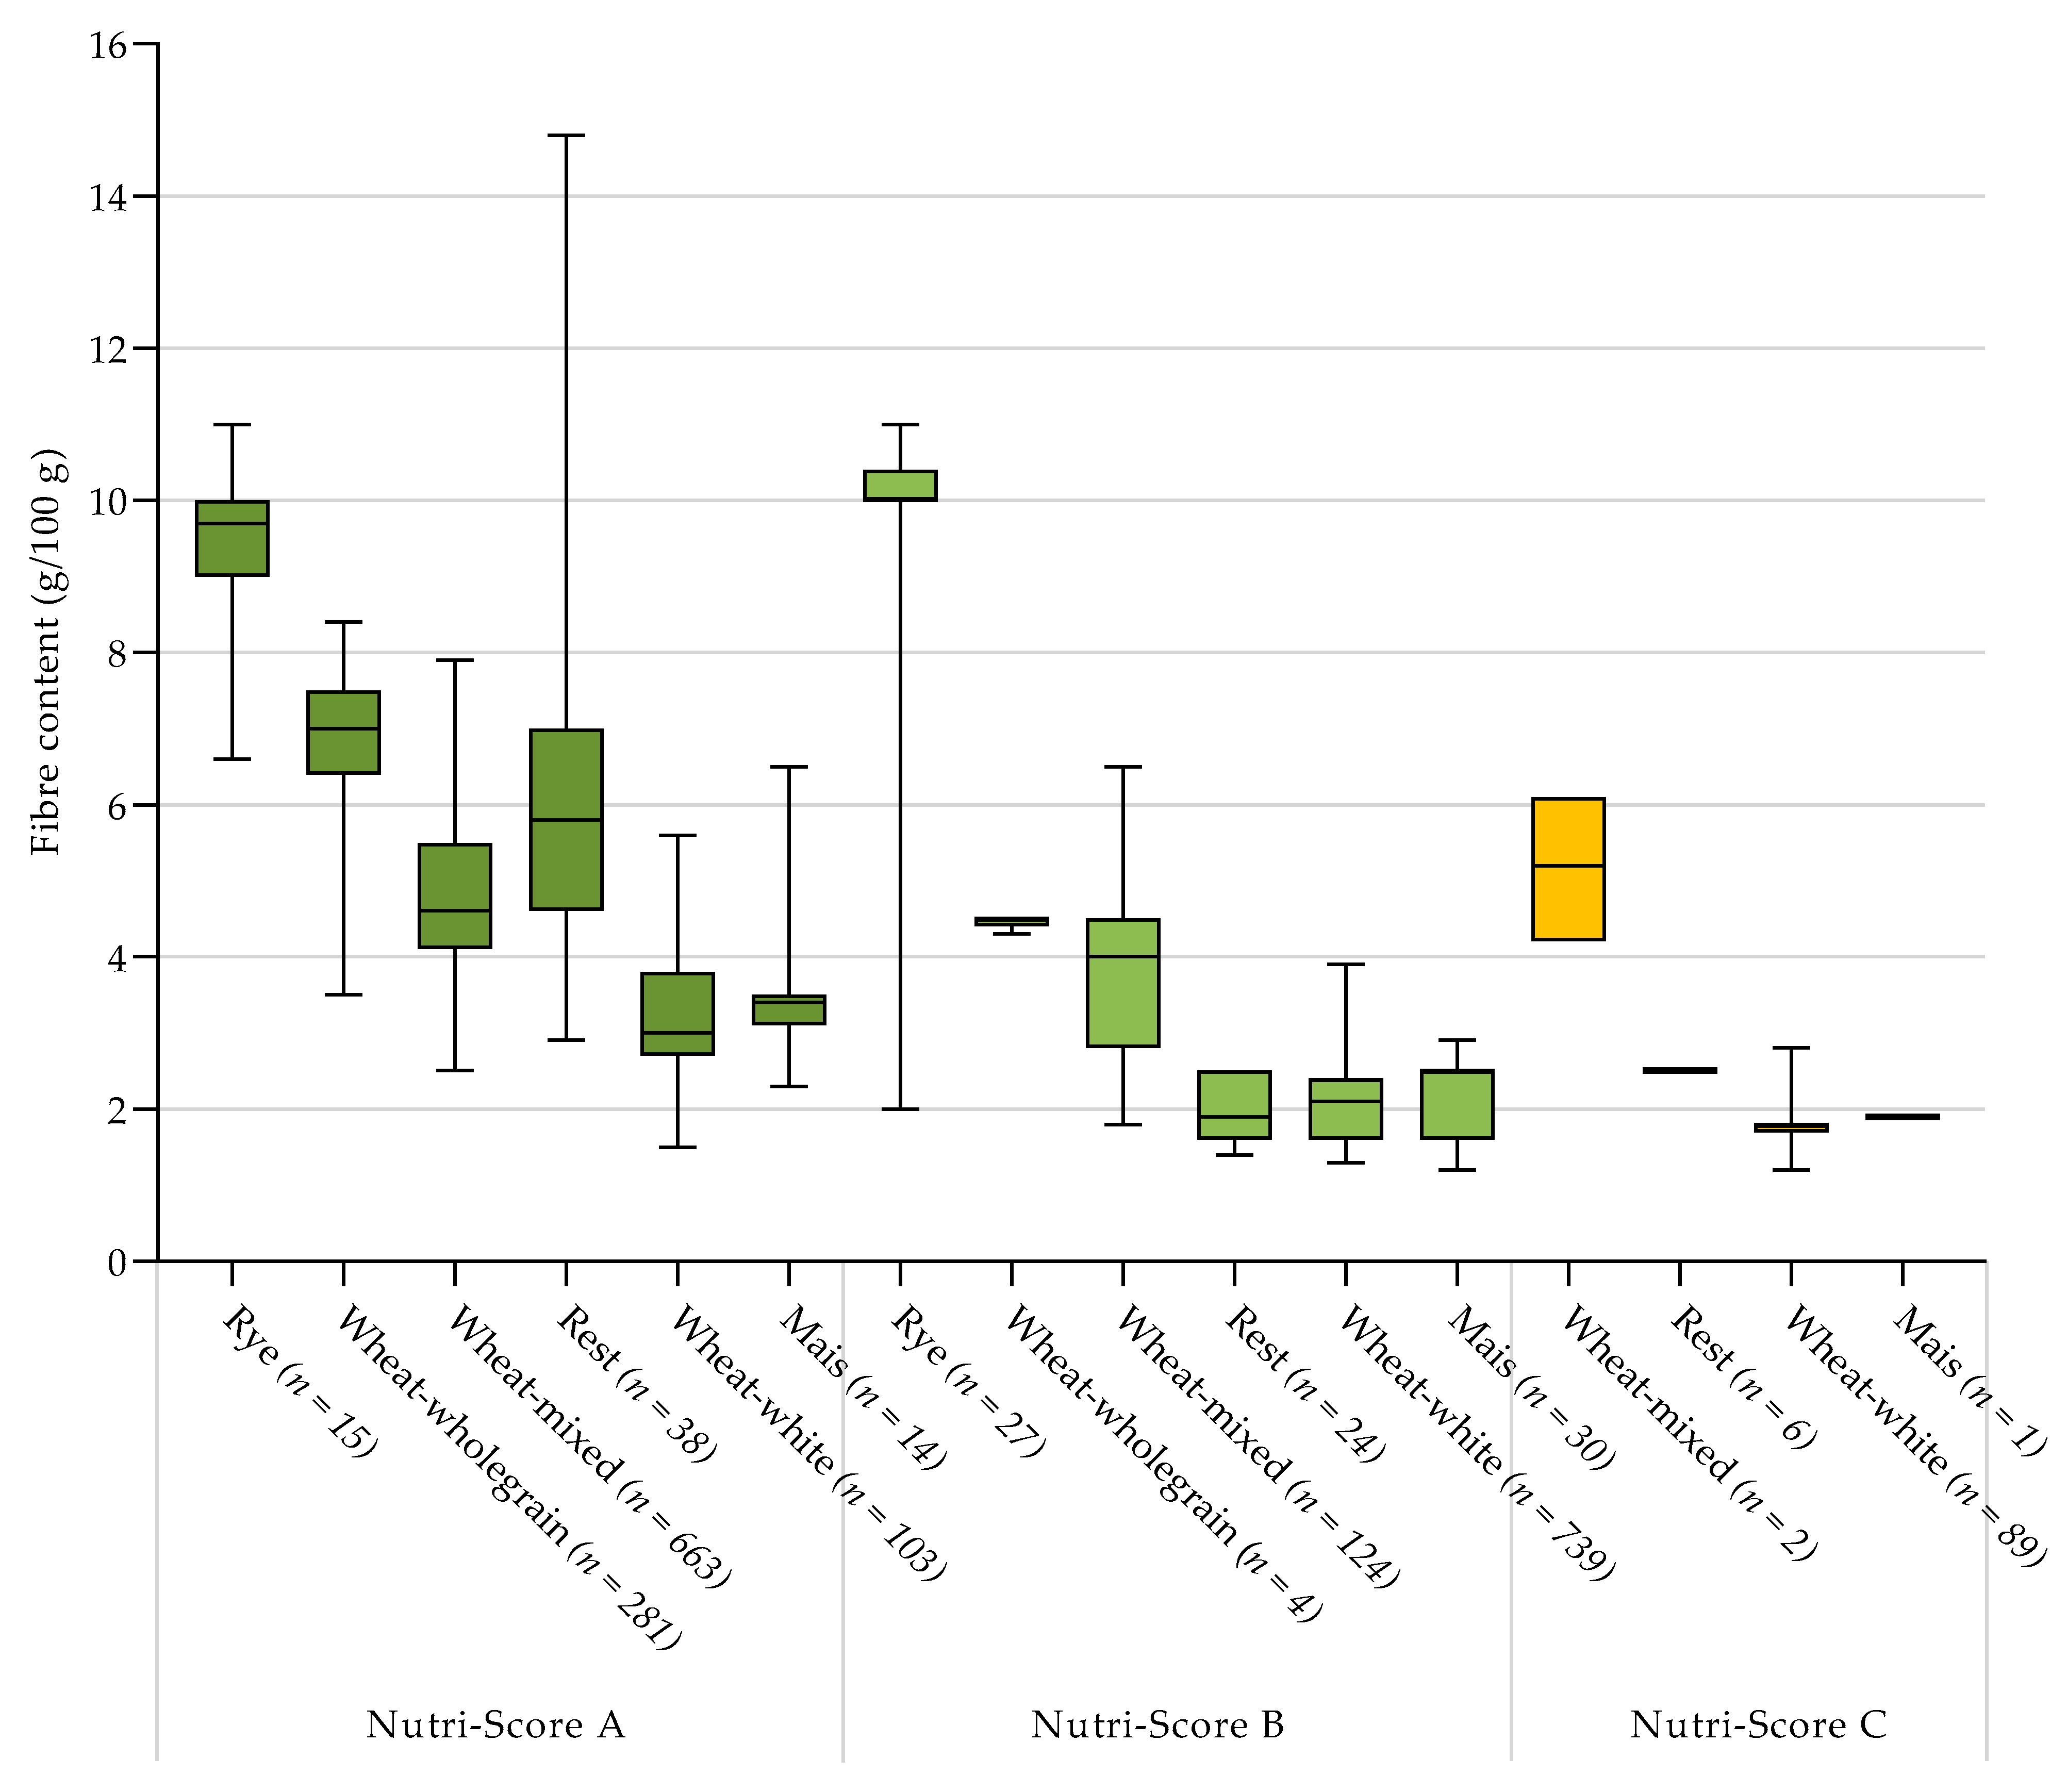
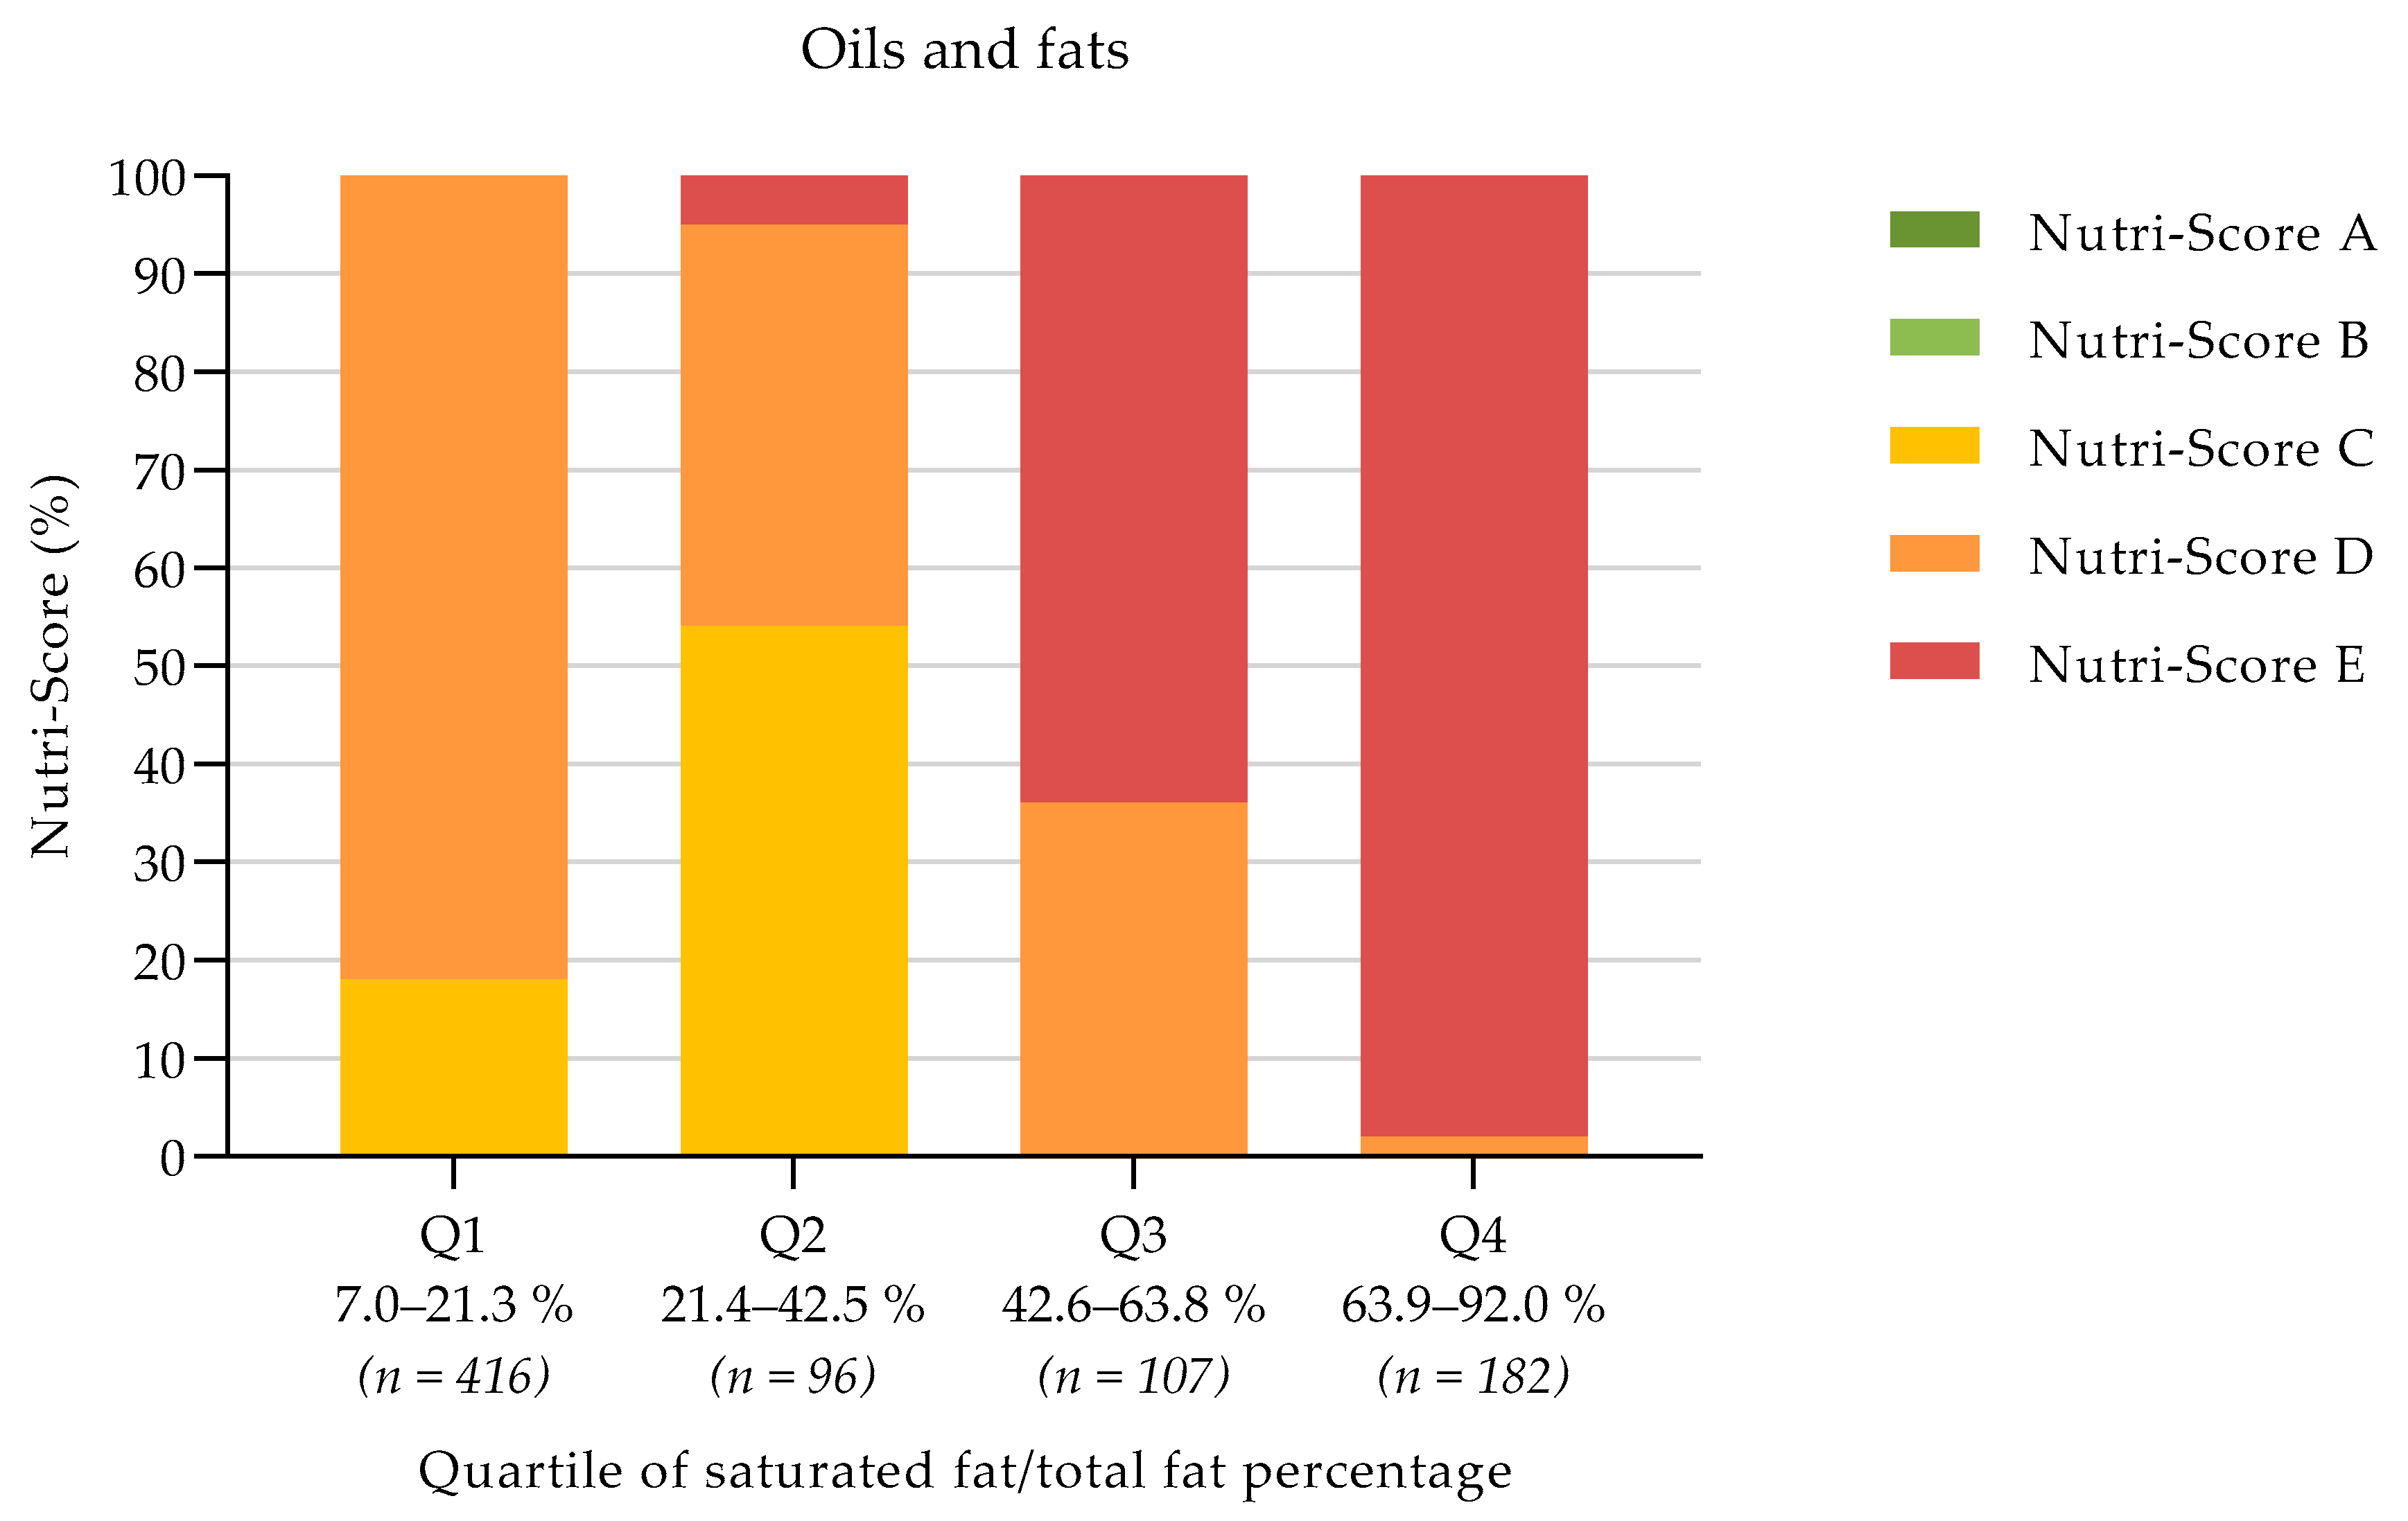
3.1. Evaluation of Alignment with Food-Based Dietary Guidelines

See Table 1 for an overview of the Nutri-Score distribution per food group. The dietary guidelines recommend an increase in the consumption of fruit and vegetables, legumes and unsalted nuts. The Nutri-Score is in line with these guidelines as the food groups fruit and vegetables and unsalted nuts and seeds were mainly classified as Nutri-Score A or B (93% and 90% respectively). All pulses were classified as Nutri-Score A.
A higher consumption of fish is recommended in the guidelines, preferably fatty fish. Nutri-Score is not in line with this recommendation as fish is classified as Nutri-Score A or B (61%), C (17%) and D (22%). Fish is a very heterogenic group, including both processed and unprocessed foods.
The guidelines recommend a more plant-based and a less animal-based dietary pattern. The consumption of red meat, particularly processed meat, should be limited. The Nutri-Score classification differs between the types of meat product. Unprocessed meats are mainly classified as Nutri-Score A or B (87% for red meat products, 97% for white meat products). Composed and single processed meat and meat preparations score mainly a Nutri-Score D or E (95% and 57%, respectively). The Nutri-Score classification of meat alternatives is not in line with the recommendation, as 61% score a Nutri-Score A or B (61%), and about one third (30%) received a C score. The C score is mostly because of a high salt content.
Dutch dietary guidelines recommend maintenance of dairy consumption (including milk and yoghurt). For dairy, Nutri-Score varies between the different types of dairy product (i.e., dairy drink, yoghurt or dessert). Dairy drinks and yoghurt, with no added sugar, are classified as a Nutri-Score A (100%). Dairy drinks and yoghurts with added sugar score Nutri-Score A or B (dairy drinks 94% and yoghurt 57%). Desserts score more frequently a Nutri-Score C or D and two percent (2%) of desserts with added sugar are classified as Nutri-Score E.
The consumption of sugar-containing beverages should be limited. Bottled water and soft drinks without added sugar mainly score a Nutri-Score A or B (100% and 91%, respectively). A large proportion of syrups, squash and cordial, fruit juice, fruit juice drink and soft drinks with added sugar score a C (27–57%).
The guidelines include the recommendation to limit salt intake. Cheeses, meat preparations, savoury snacks, bread and ready-to-eat meals are mentioned in the guidelines as examples of products high in (added) salt. When comparing the guidelines with the Nutri-Score classification, there is a mixed result. Cheeses are mainly classified as Nutri-Score D and E (99%). Bread is classified differently according to the type of bread: bread was classified as Nutri-Score A or B (95–100%); however, savoury bread is mainly classified as a Nutri-Score B and D (40% and 40%). Meat preparations and savoury snacks are often classified as a Nutri-Score D or E (57% and 66% respectively). Ready meals are often classified as Nutri-Score A or B (64%) and less frequently as Nutri-Score D or E (7%). When analysed per quartile of salt content, meat preparations, savoury snacks and ready meals with a lower salt content receive a more favourable Nutri-Score compared to products with a higher salt content (see Appendix A, Figure A1, Figure A2 and Figure A3).
To increase the fibre intake, the guidelines recommend replacement of refined products with unrefined or wholegrain products. Cereal products with the highest fibre content more frequently scored a Nutri-Score A or B (85%, see Appendix A, Figure A4), compared to products in the other quartiles. The Nutri-Score classification, however, does not discriminate between products high and low in fibre content: more than half of the cereal products were classified as a Nutri-Score A or B, independently of the fibre content (i.e., in all quartiles). Only a few cereal products were classified as Nutri-Score E (up to 3%). The Nutri-Score A and B classes contained wholegrain bread types, but also white bread types (see Appendix A, Figure A5).
Saturated fatty acids should be replaced with unsaturated fatty acids. None of the oils and fats was classified as a Nutri-Score A or B (see Appendix A, Figure A6). Oils and fats with a lower ratio of saturated fat to total fat content were classified as a Nutri-Score C or D (quartile 1 = 100%, quartile 2 = 95%), whereas oils and fats with a higher ratio were also classified as Nutri-Score E (quartile 3 = 36%, quartile 4 = 98%).

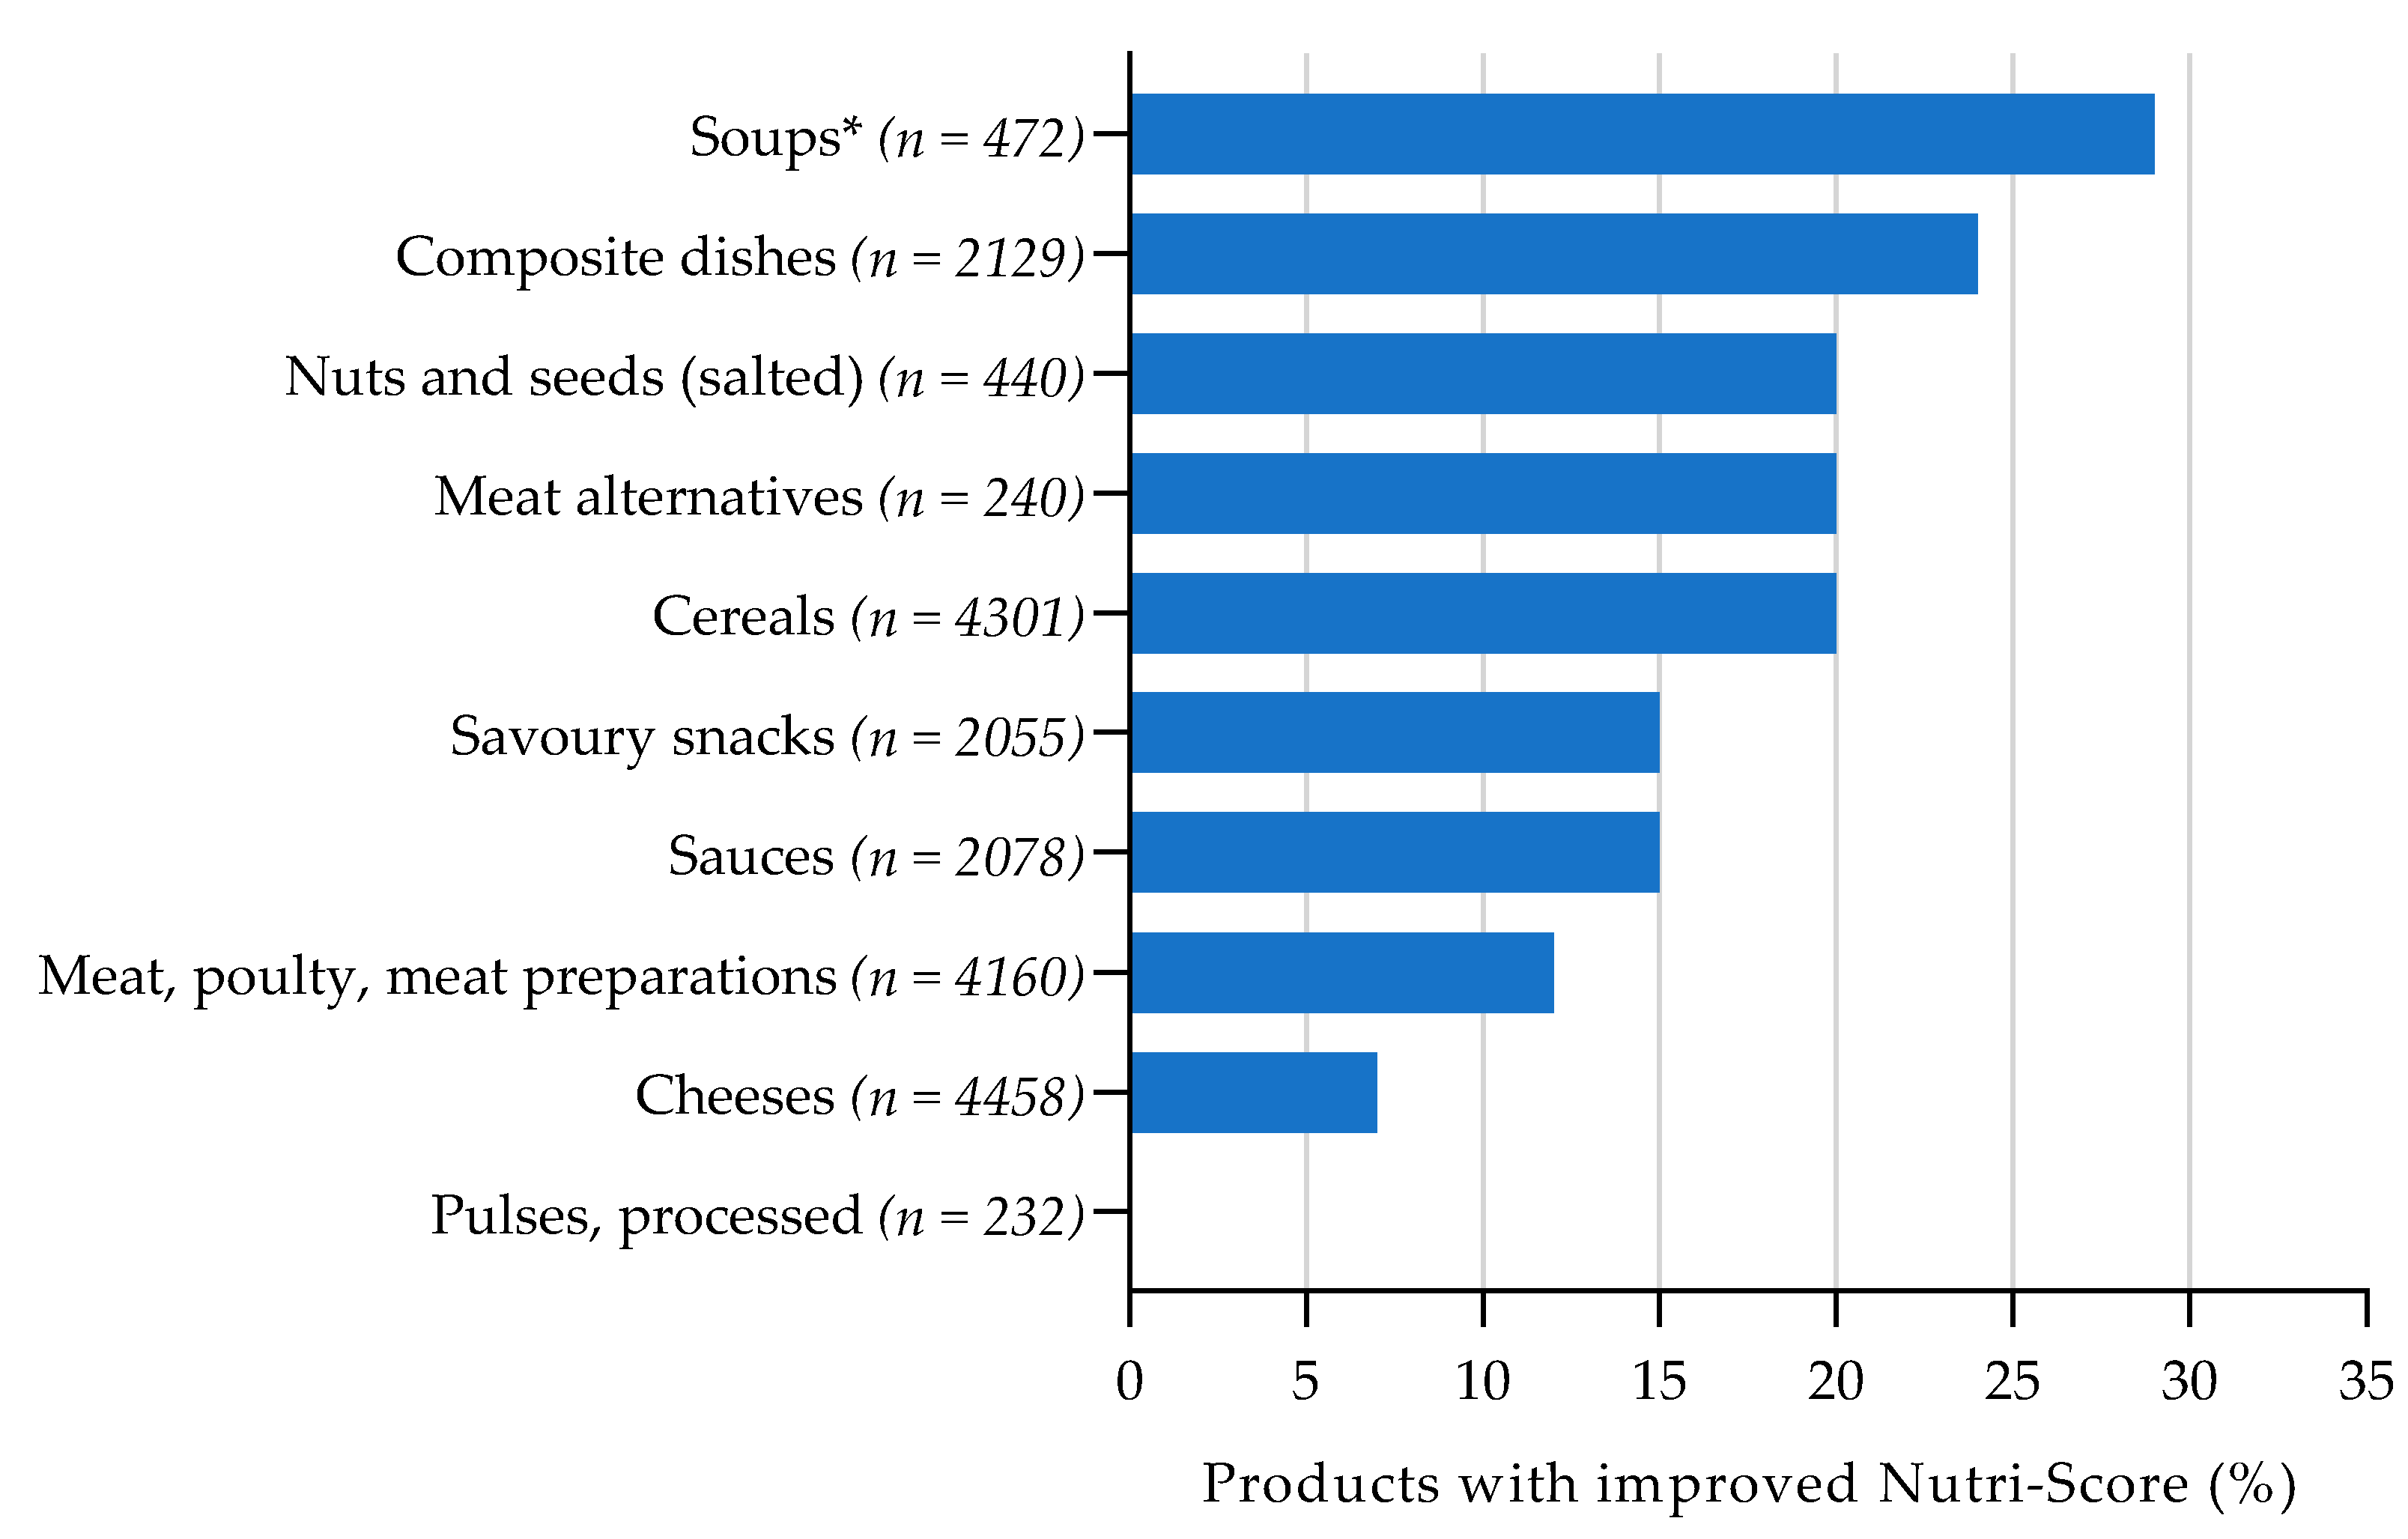
3.2. Ability to Stimulate Food Reformulation

Figure 2, Figure 3, Figure 4 and Figure 5 show the total percentage of foods that shifted to a more favourable Nutri-Score after reformulation of a nutrient with 1 point on the Nutri-Score sub score. For the complete overview of the Nutri-Score distribution per food group regarding the reference situation and product improvement scenario for reformulation, see Appendix A Table A3, Table A4, Table A5 and Table A6.
For sodium, the Nutri-Score (could be) improved in all food groups, except for pulses, when sodium content was decreased by one point (see Figure 2). The largest proportion of products that shifted to a more favourable Nutri-Score was found for soups (29%), composite dishes (24%) and nuts and seeds (20%). The potential improvement in Nutri-Scores was the lowest for meat, poultry and meat preparations (12%) and cheeses (7%). All processed pulses were classified as Nutri-Score A in the reference scenario, so no further improvement was observed after reformulation of sodium content. A one-point decrease in sodium content (90 mg/100 g) is relatively large for soups, as this is about a quarter (27%) of the median sodium content. For meat, poultry and meat preparations, a one-point decrease is smaller (11%) compared to the median content. A decrease of one point may therefore be more achievable for meats than for soups.
For saturated fat, the largest overall improvements in Nutri-Score by reformulation were found for spreads and cooking fats (19%), cereals (18%) and composite dishes (17%) (see Figure 3). For cheeses, potential improvements by lower saturated fat content were the smallest (0.2%). A one-point decrease in saturated fat content (i.e., −1 g per 100 g) is relatively large compared to the median content for cereals (63%) and composite dishes (67%), whereas this is smaller for spreads and cooking fats (3%). Decreasing the saturated fat content by one point may therefore be more achievable in spreads and cooking fats compared to cereals and composite dishes.
For sugar, the largest potential improvement in Nutri-Score was found for milk products (with added sugar) (31%), followed by sugary drinks and sweetened cereals (see Figure 4). The smallest overall improvement was found for sweetened baked goods and confectionery (6%). A one-point decrease in sugar content (i.e., −4.5 g per 100 g food and −1.5 g per 100 g for drinks) is relatively large compared to the median content in milk products (38%), whereas this is smaller in cereals (8%). Reducing the sugar content in cereals, by one point, may be achievable.
By reformulating the fibre content the Nutri-Score improved more for composite dishes (16%) than for cereals (12%) (see Figure 5). A one-point increase in fibre content (+0.9 g per 100 g) in composite dishes is relatively large (56%) compared to the median content. A one-point increase in fibre content in cereals is relatively small (23%) and therefore more feasible.

4. Discussion

In this paper we compared the Dutch food-based dietary guidelines with the Nutri-Score and explored whether the Nutri-Score can be (used as) an incentive for food reformulation.

4.1. Nutri-Score and the Food-Based Dietary Guidelines

Nutri-Score aims to guide consumers towards foods with a higher nutritional quality for packaged foods. Nutri-Score is based on a selection of specific nutrients (energy, sugars, saturated fat, sodium, fibre, protein) and other elements (percentage of fruit, vegetables, pulses and nuts), and does not include other aspects related to the healthiness of a food, such as portion-size, level of processing or additives.
Nutri-Score provides an overall evaluation as to whether a product had a higher or lower nutritional quality within a food group. For certain food groups, the Nutri-Score is in line with the food-based dietary guidelines. Fruit and vegetables, pulses, and unsalted nuts were mainly classified as Nutri-Score A or B (93%, 100% and 90%, respectively). Nutri-Score is less in line with the guidelines to limit the consumption of dairy drinks with added sugar, to reduce red meat and to replace refined grain products. These foods were also frequently classified as a Nutri-Score A, B or C rather than a Nutri-Score D or E.
Recently, a study using nutritional composition data from eight European countries (i.e., Finland, France, Norway, Poland, Portugal, Slovakia, Sweden, Switzerland) [5] and a similar study using German composition data [21] showed that Nutri-Score was mostly consistent with WHO and German dietary guidelines and that Nutri-Score discriminates foods, based on their nutritional quality, within a food group. They found similar results in the different countries. Our results are in line with these findings: fruits, vegetables and pulses were mostly classified in the Nutri-Score categories A/B, and cereals and nuts and seeds were mainly categorized as A to C. Oils and fats were mainly classified in the category D, with vegetable fats more frequently scoring a C and animal fats a Nutri-Score E. Although we did not analyse vegetable and animal fats separately, our analysis also indicates that products higher in saturated fat more often score a Nutri-Score E.
The dietary guidelines recommend following a more plant-based diet and consuming less animal-based products. The majority of plant-based foods such as fruits, vegetables and pulses were classified as expected. The majority of unprocessed meat (87–97%) were, however, classified as a Nutri-Score A–B, and are not in line with this recommendation. It must be noted that Nutri-Scores were calculated for un/minimally processed fruit and vegetables and unprocessed meat products, for the evaluation of alignment with dietary guidelines. These product groups are at the moment not eligible for a Nutri-Score as they do not have a mandatory nutrient declaration. To stimulate a more plant-based diet and limit the intake of (red) meat within the context of Nutri-Score, several aspects can be considered. First, fresh fruits and vegetables are not always packaged and with nutrient declaration and thus will not show a Nutri-Score. To guide the consumer to a more plant-based diet, showing Nutri-Score on all products, or on shelves, may be considered. Second, an option is to include the percentage of (red) meat in the product (like the percentage of saturated fat), in the Nutri-Score algorithm. As a result, meat will have a less favourable Nutri-Score. The ingredients list on the label might be used, as it is mandatory to report the percentage of meat in the product when greater than two percent [19]. Third, the Nutri-Score was assigned based on the nutrient declaration of unprepared meat as sold. Calculating the Nutri-Score based on prepared meat (including more salt and fat, based on a common cooking practice), may result in a less favourable Nutri-Score. Fourth, some of the meat alternatives scored moderately (i.e., Nutri-Score C) compared to certain types of meat, which does not stimulate consumers towards a more plant-based diet. Meat alternatives, however, can be reformulated to contain less salt and to shift to a more favourable Nutri-Score, as shown in our results.. Future research is needed on the feasibility of these suggested alterations. In addition, the effects on purchasing behaviour should be studied to see whether these alterations in Nutri-Score are able to stimulate a more plant-based diet. It should be warranted that alterations in the Nutri-Score algorithm do not result in a more favourable score for animal-based products and do not stimulate the consumption of such products.
Within the packaged meat and fish categories, Nutri-Score may discriminate between processed and raw/unprocessed foods [5]. Our results show that unprocessed meats scored more favourably than processed meats. A range of Nutri-Scores was found in the fish food group: 61% in A/B, 17% in C and 22% in D. This food group included both processed and unprocessed fish products.
Dréano-Trécant et al. [5] concluded that Nutri-Score can discriminate between refined and whole grain products in many of the countries studied. Our results, however, show that cereal foods often score an A or B, even though they have a low fibre content. To improve the ability to discriminate between whole and refined grain, the Nutri-Score algorithm might be adapted, increasing the number of points for fibre content, and so its contribution to the total sum score. To stimulate the consumption of fibre-rich wholegrain cereal products, the algorithm’s maximum fibre amount might be adapted. For fibre, the maximum amount for scoring ‘positive’ points is set at 3.5 g/100 g, and wholegrain bread and whole grain pasta contain 7 g/100 g. This may limit further product reformulation. Another option is to include whole grain as a positive component in the algorithm, instead of the fibre content, in order to stimulate the use of whole grains in products.
The Nutri-Score classification was partly in line with the recommendation to limit sugar-containing drinks. Water and soft drinks without added sugar had a favourable Nutri-Score, whereas drinks containing sugar frequently scored a Nutri-Score C. Dairy drinks with added sugar are not in line with the recommendation, and 94% were classified as A or B. Although it is recommended to maintain the consumption of dairy, this is not in line with minimizing the intake of sugar-containing drinks. Soft drinks with artificial sweeteners score favourably. Nutri-Score, however, promotes the consumption of water, rather than artificial sweetened beverages, by assigning a Nutri-Score A [13]. The Dutch health council diet guidelines did not include a recommendation concerning artificially sweetened drinks, but they advise alternatives: water, tea and unfiltered coffee without sugar [10,20].
The Dutch food-based dietary guidelines also include recommendations to increase the consumption of tea and replace coffee with filtered coffee. These were not included in the analyses, as these products do not contain a nutrition declaration on their packaging. The Dutch health council diet guidelines did not include recommendations on saturated fatty acids, trans fatty acids and added sugar in foods and are therefore not included in the analyses. Criteria for these nutrients are, however, included in the translated food based dietary guidelines of the Wheel of Five [11]. To help the consumer, it is important that Nutri-Score is in line with the Health Council dietary guidelines as well as with the Wheel of Five. Consistent communication and education are recommended during the implementation of the logo [5,23]. Posting health-oriented displays or slogans in sales locations may aid public awareness and understanding. The effectiveness of possible interventions must be further explored.
It must also be noted that many other aspects influence dietary choices, such as individual preferences and social, economic and environmental factors [24]. Previous online studies have indicated that Nutri-Score can help consumers to rank products in a similar product group, from healthy to less healthy options [8,25], and to choose more healthful products in an experimental setting [26]. Additional research is, however, needed on actual purchasing behaviour in a real-life setting [26], and the effect of Nutri-Score on the consumers’ eating pattern [25].

4.2. Nutri-Score’s Ability to Stimulate Food Reformulation

Nutri-Score may be an incentive for manufacturers to stimulate reformulation towards foods with a higher nutritional quality. In our scenario analyses, decreasing the sodium, saturated fat or sugar content by one point resulted in certain products shifting to a more favourable Nutri-Score. Nutri-Score may stimulate reformulation of, for instance, composite dishes towards a lower sodium and saturated fatty acids content, or of cereals with a lower saturated fat and sugar content and higher fibre content. The percentage of products with an improved Nutri-Score varied greatly, however, between the different product groups (ranging from about 0–30%). A one-point reduction in the Nutri-Score sub score does not necessarily result in a more favourable Nutri-Score (e.g., sodium reduction in single processed raw/cured meat). To shift the Nutri-Score in these groups, a larger reduction may be needed or multiple nutrients/components need to be reformulated. In addition, the reformulation scenarios showed that, for some food groups such as pulses and cheese, it might be more difficult to reformulate towards lower salt content since only one or two Nutri-Score categories were covered.
In the study with data from eight European countries [5], Nutri-Score was considered to be discriminating when at least three categories of the Nutri-Score were observed within a food (sub)group. For almost all food groups (except pulses), Nutri-Score was shown to be discriminating. We observed similar results based on the Dutch dataset: the classification of snacks and meals varied over four categories, which may help to choose the less salty and less sugary and fatty foods within these categories. The interpretation of sufficient discrimination differs, however. Van Tongeren et al. [27] concluded that Nutri-Score was not sufficiently discriminating, as not all five Nutri-Score categories were observed in a certain food subgroup [27]. They found a range of Nutri-Score categories for ready meals (A–E), soups (A–C, majority C), meal sauces (A–D, majority C) and cheese (A–E, majority D), comparable to our results.
It is unclear whether our calculated theoretical shift in Nutri-Score will also result in a more favourable Nutri-Score in a real-life setting of product improvement. We analysed a one-point difference in the scoring for a specific nutrient, assuming the remaining food composition remains constant. In reality, the Nutri-Score algorithm sums multiple (positive and negative) nutrients, and scoring better on one component (e.g., vegetables) may disguise another component (e.g., salt). In addition, reformulation of products, in order to score one point less on the Nutri-Score sub score, may not be practically feasible for all products. For soups and bread, for instance, a one-point reduction in sodium (−90 mg per 100 g) is relatively large compared to the median salt content of these products. Reducing the size of a one-point step on the Nutri-Score sub scale may increase feasibility and stimulate reformulation. Even though a one-point reduction in nutrient content will be smaller, the overall impact on the intake may be considerable, as these products are regularly consumed. It will be worthwhile to monitor changes in food composition before and after the introduction of Nutri-Score in the Netherlands to see the effect on consumers’ food choices as well as producers’ food product improvement.

4.3. The Nutri-Score Algorithm

Nutri-Score shows an overall assessment of multiple nutrients/components, which makes it easy to interpret for the consumer. Its design, summing ‘positive’ and ‘negative’ components, also has certain implications. Certain nutrients may compensate for others. Dairy drinks with added sugar, for instance, are generally low in salt and saturated fat, but high in protein, resulting in less than 11 ‘negative’ points. Due to the protein content, they score relatively high on the ‘positive’ points. As a consequence, when subtracting the ‘positive’ from the ‘negative points’, the final score is relatively low, resulting in a favourable Nutri-Score. The protein content therefore may compensate for the sugar content. In addition, some foods may be classified as having a lower nutritional quality, as they do not contain both the ‘positive’ and ‘negative’ components of the algorithm. In the present study 63% of oils and fats scored a D or E. These foods do not shift towards a more favourable Nutri-Score as they are high in ‘negative’ points (energy, saturated fat) and low in ‘positive’ points (e.g., fruits, vegetables). The algorithm, however, partially takes this into account by including specific cut-off points for fats [4]. For certain foods, the summing of ‘positive’ and ‘negative’ components has a positive effect on the Nutri-Score. As vegetables score low on the ‘negative’ points (salt, sugar, saturated fat) and high on the ‘positive’ points (vegetable component) they mainly score an A. For composite dishes, the summing in the algorithm provides an opportunity to improve food composition, as they can be reformulated in both the ‘negative’ (decrease saturated fat, sugar and salt) and ‘positive’ (increase vegetable, fibre) components.

4.4. Strengths and Limitations of the Current Study

For the current analyses, the Dutch Branded Food database was used. This database contains a large amount of nutritional information for products available in Dutch supermarkets. It is estimated that the data in the Branded Food database represent about 75% of the products available in supermarkets. The results of the analyses therefore provide a robust assessment of products on the Dutch market. It must however be noted that the database contains data which are voluntarily supplied by the manufacturers and retailers. Although quality checks are performed, the completeness of the data is dependent on the data provided by the manufacturers. In addition, the database does not reflect the market share of the products. It is unclear which method the manufacturers used to assess the fibre content in their product, and consequently in the Branded Food database. For the current analyses the Association of Official Analytical Chemists (AOAC) method was used, as advised, for calculating the Nutri-Score [13]. We were unable to distinguish certain product groups, such as fatty fish and refined and whole-grain breakfast cereals. In addition, rice and pasta were not included. Adding these food groups would strengthen the interpretation of Nutri-Score and the guidelines. Unpackaged products, such as vegetables and fruits, are not included in the Branded Food database. These products are therefore underestimated in the current analyses. Still, a large amount of packaged vegetables and fruits were included in the analyses, providing valuable insight into the Nutri-Score classification of these healthier products.
It must be noted that we did not study the effect on consumer behaviour, and the effects on actual purchasing behaviour.

5. Conclusions

The Nutri-Score classification is in line with the Dutch food-based dietary guidelines: increase the consumption of fruit and vegetables, pulses, and unsalted nuts. It is however less in line with the recommendations to limit (dairy) drinks with added sugar, to reduce the consumption of red meat and to replace refined cereal products with whole-grain products. In our scenario analyses, decreasing the sodium, saturated fat or sugar content by one Nutri-Score point resulted in certain products (e.g., composite dishes, cereals, milk products) shifting towards a more favourable Nutri-Score (ranging from about 0–30%). Nutri-Score may therefore be an incentive for reformulation of certain foods. Alterations to the algorithm may strengthen Nutri-Score in order to help consumers with their food choices.

Author Contributions

Conceptualization, E.H.M.T.; methodology, S.t.B., E.S., I.E.J.M., E.H.M.T.; analysis, E.S.; writing—original draft preparation, S.t.B.; writing—review and editing, S.t.B., E.S., I.E.J.M., E.H.M.T.; supervision, E.H.M.T. All authors have read and agreed to the published version of the manuscript.

Funding

This research was funded by the Dutch Ministry of Health, Welfare and Sport (VWS).

Data Availability Statement

The data presented in this study are available on request from the corresponding author. The crude data are not publicly available due to legal issues.

Acknowledgments

The authors would like to thank Daniëlle Wolvers (Netherlands Nutrition Centre) for reviewing the manuscript regarding the Wheel of Five.

Conflicts of Interest

From 2021 E.H.M.T. is member of the international scientific committee of Nutri-Score. The other authors declare no conflict of interest. The funders had no role in the design of the study; in the collection, analyses, or interpretation of data; in the writing of the manuscript, or in the decision to publish the results.

Appendix A

Table A1. Estimated percentages of fruit, vegetables, pulses and nuts content, in order to calculate the Nutri-Score.
Food GroupsFruit, Vegetables, Pulses and Nuts Content (%) *
Fruit and vegetables
Fresh fruit; Dried fruit; Fresh vegetables; Preserved vegetables; Pickles and olives≥80
Preserved fruit>80
Meat, poultry, meat preparations≤40
Meat alternatives>40
Milk products
Dairy drinks and desserts ≤40
Cheeses≤40
Pulses≥80
Nuts and seeds≥80
Cereals≤40
Oils and fats≤40
Fish≤40
Drinks
Tea, Coffee, Bottled water, Syrups Squash and Cordial, Fruit Juice drink; Soft drinks, sweetened; Soft drinks, unsweetened; Sports drinks, sweetened; Sports drinks, unsweetened; Energy drinks, sweetened; Energy drinks, unsweetened; Alcoholic beverages≤40
Fruit Juice>40
Vegetable juice>80
Savoury snacks≤40
Soups>40
Sauces
Emulsified sauces; Cooking sauces, based on tomatoes/vegetables; Cooking sauces, oriental; Cooking sauces, other<40
Peanut sauces; Cold sauces based on tomatoes/vegetables>40
Baked goods and confectionary≤40
Composite dishes
Potatoes, vegetabels and meat; Filled wraps, tortillas; Pies, quiches, oven-baked dishes, etc.; Italian ready meals (incl. lasagna); Rice and noodle ready meals; Pizzas; Sandwiches or baguettes≤40
Bean dishes (chili con carne, etc.); Mixed salads with toppings>40
* Estimated based on the ingredient lists in the Dutch Branded Food database and averaged per food group. Included in the Nutri-Score are intact fruits and vegetables (including those that are cooked and dried), minimally processed fruit, vegetables and pulses (peeled, sliced, tinned, frozen, purees, pulp, grilled, roasted or marinated) and roasted nuts [13]. Fruits, vegetables, pulses and nuts only count when their content exceeds 40% [13]. Not included in the Nutri-Score are fruits, vegetables and pulses that are subject to further processing (e.g., concentrated fruit juice sugars, powders, freeze-drying, candied fruits, fruits in stick form, flours leading to loss of water) [13].
Table A2. Imputed mean fibre content for the Nutri-Score calculation, based on the Dutch Branded Food database.
Food GroupsMean Fibre Content (g/100 g)
Fruit and vegetables
Fresh fruit2.1
Dried fruit7.2
Preserved fruit1.2
Fresh vegetables2.4
Pickles and olives2.2
Preserved vegetables2.9
Meat, poultry, meat preparations
Meat preparations0.6
Single processed meat, prepared0.1
Composed processed meat, prepared0.3
Single procssed meat, raw/cured0.1
Composed processed meat, raw/cured0.2
Meat unprocessed, white meat0.4
Meat unprocessed, red meat0.0
Meat alternatives
Meat alternatives4.0
Milk products
Dairy drinks, with added sugar0.4
Dairy drinks, no added sugar0.4
Yoghurt and quark, with added sugar0.2
Yoghurt and quark, no added sugar0.2
Custard, with added sugar0.2
Custard, no added sugar0.0
Pudding, mousse and desserts, with added sugar1.0
Pudding, mousse and desserts, no added sugar2.0
Cheeses
Cheeses, semi-hard and hard0.0
Cheeses, soft0.3
Cheeses, spreads and melting0.0
Pulses
Pulses, processed6.5
Pulses, unprocessed13.7
Nuts and seeds
Nuts and seeds (salted)6.5
Nuts and seeds (unsalted)6.7
Cereals
Bread3.9
Bread luxury, plain and sweet3.3
Bread luxury, savoury2.3
Bread alternatives5.8
Bases2.3
Breakfast cereals8.2
Potatoes
Potatoes, processed2.3
Oils and fats
Oils0.0
Spreads, baking and cooking fats0.1
Fish
Fish, processed0.4
Fish, unprocessed0.1
Savoury snacks
Savoury snack breaded ragout1.3
Savoury snack spring roll2.8
Savoury snack meat1.6
Savoury snack fried or puff pastry bun (no meat)1.7
Crisps (sliced and formed)3.3
Coated nuts4.6
Savoury cookies/biscuits/crackers2.5
Savoury snacks, other1.6
Soups
Soups0.6
Sauces
Emulsified sauces0.5
Peanut sauces2.5
Cooking sauces, based on tomatoes/vegetables1.3
Cooking sauces, other1.3
Cooking sauces, oriental0.8
Cold sauces based on tomatoes/vegetables1.9
Baked goods and confectionary
Pound cake1.2
Biscuit3.1
Dutch spice cake4.4
Bars (muesli, cereal, fruit)8.9
Shortbread2.9
Pies and pastries (sweet)1.3
Waffle1.6
Cookie2.3
Chocolate confectionery3.8
Sweet confectionery1.8
Ice cream0.6
Sweet sauces1.4
Composite dishes
Potatoes, vegetables and meat1.7
Filled wraps, tortillas2.2
Pies, quiches, oven-baked dishes, etc.1.4
Bean dishes (chili con carne, etc.)3.3
Italian ready meals (incl. lasagna)1.3
Rice and noodle ready meals1.3
Pizzas2.0
Mixed salads with toppings1.7
Sandwiches or baguettes1.7
Drinks
Bottled water0.0
Syrups Squash and Cordial0.1
Fruit Juice drink0.2
Fruit Juice0.5
Soft drinks, with added sugar0.0
Soft drinks, no added sugar0.0
Sports drinks, with added sugar0.0
Energy drinks, with added sugar0.0
Energy drinks, no added sugar0.0
Vegetable juice0.7
Figure A1. Nutri-Score classification of meat preparations, according to the quartile (Q) of sodium content.
Nutrients 13 04536 g0a1
Figure A2. Nutri-Score classification of savoury snacks, according to the quartile (Q) of sodium content.
Nutrients 13 04536 g0a2
Figure A3. Nutri-Score classification of ready meals, according to the quartile (Q) of sodium content.
Nutrients 13 04536 g0a3
Figure A4. Nutri-Score classification of cereal foods, according to the quartile (Q) of fibre content.
Nutrients 13 04536 g0a4
Figure A5. Fibre content per bread type and Nutri-Score. Boxplots represent the 1st, 25th, 50th, 75th and 99th percentile.
Nutrients 13 04536 g0a5
Figure A6. Nutri-Score classification of oils and fats, according to the quartile (Q) of saturated fat/total fat content.
Nutrients 13 04536 g0a6
Table A3. Nutri-Score distribution per food group for the reference situation and product improvement scenario for sodium reformulation (scoring 1 point less, −90 mg/100 g, on the Nutri-Score scale), and the proportion of products improved in Nutri-Score.
Nutri-Score Distribution
(% of Product per Category)
Percentage of Products with Improved
Nutri-Score (B–A)
Percentage Improved in Total
Reference Situation (A)Product Improvement Scenario (B)
Food GroupsNABCDEABCDEABCDETotal
Cereal products430137281915248201812112431020
Bread22075442400732530019200020
Bread luxury, plain and sweet467144643621447334110111024
Bread luxury, savoury16944013404844143314893025
Bread alternatives (toast, crackers, etc.)780201229335289312748571021
Bases (pie, shell, crust), etc.2137253323111624292829849031
Breakfast cereals4654194010043113790242008
Meat, poultry, meat preparations416026104240371142361344012
Meat preparations1374616214710821174683842016
Composed processed meat, prepared11720014060002494900110012
Single processed meat, prepared4631521648653746744191029
Composed processed meat, raw/cured78000115840021583001102
Single processed meat, raw/cured37100059410005941000000
Meat alternatives
Meat alternatives240501130905717197071120020
Cheeses44580018712002926001607
Cheeses, semi-hard and hard34810008713001955001809
Cheeses, soft878004878007858003003
Cheeses, spreads and melting990020621800235918003003
Sauces20781733481239344692453015
Emulsified sauces8050018701300256690074011
Peanut sauces11203463913085232805124021
Cooking sauces, based on tomatoes/vegetables23642868001048420062600032
Cooking sauces, oriental2061536372035383519213108
Cold sauces based on tomatoes/vegetables5680830491337354793264014
Cooking sauces, other15128542611513462693911015
Soups
Soups, including broth and stock4724672810108360062210029
Savoury snacks205505294818193441160492015
Savoury snack breaded ragout20408672501176913009110021
Savoury snack spring roll717374114113482810161740027
Savoury snack meat2750172148141222443111684019
Savoury snack fried or puff pastry bun (no meat)11712255121232951151266015
Crisps (sliced and formed)7110340561065241103150019
Savoury cookies/biscuits/crackers31300528670053164000303
Coated nuts18800988300178120092010
Savoury snacks, other1761111444312114838011507
Composite dishes21292044297031442050111120024
Potatoes, vegetables and meat25821631600345790013800021
Italian ready meals (incl. lasagna)219136324002863900161500030
Rice and noodle ready meals2801648351030462310141100025
Filled wraps, tortillas2015451525020501020051050020
Pies, quiches, oven-baked dishes, etc.74927283141230273013543015
Bean dishes (chili con carne, etc.)1573207007327000070007
Pizzas289034471907453990717100034
Mixed salads with toppings8583340270044391700121000022
Sandwiches or baguettes116019295020233540204100015
Pulses
Pulses, processed23210000001000000000000
Nuts and seeds
Nuts and seeds (salted)440103059201439461051410020
Table A4. Nutri-Score distribution per food group for the reference situation and product improvement scenario for saturated fat reformulation (scoring 1 point less,−1 g/100 g, on the Nutri-Score scale), and the proportion of products improved in Nutri-Score.
Distribution Nutri-Score
(% of Product per Category)
Percentage of Products with Improved
Nutri-Score (B–A)
Percentage Improved in Total
Reference Situation (A)Product Improvement Scenario (B)
Food GroupsNABCDEABCDEABCDETotal
Cheeses445800187120018712000000
Cheeses, semi-hard and hard348100087130008713000000
Cheeses, soft878004878005878001000
Cheeses, spreads and melting990020621800235918003003
Meat, poultry, meat preparations416026104240381043361344012
Meat preparations1374616214710723174671943017
Composed processed meat, prepared11720014060002494900111012
Single processed meat, prepared4631521648253750700161017
Composed processed meat, raw/cured78000115840021583001102
Single processed meat, raw/cured37100059410006139000202
Fats and oils
Spreads and cooking fats 507001933480024433300515019
Baked goods and confectionery50300115374701173744014308
Pound cakes63900118800012376001506
Bars (muesli, cereal, fruit)141016374166252839261664033
Biscuit, waffle and cookie164200521730172370012306
Pies and pastries (sweet)14150012464201134739012306
Ice cream1193013559501445150091010
Cereals13141714382842018372143770318
Bread luxury, plain and sweet 4671446436175433503111015
Bread luxury, savoury169440134045461630417100018
Bases (pie, shell, crust), etc.21372533231114233220117540016
Breakfast cereals465419401004617307051330021
Savoury snacks205505294818183342160371012
Savoury snack breaded ragout20408672501176913009110021
Savoury snack spring roll717374114110453211131130017
Savoury snack meat2750172148140232441120682017
Savoury snack fried or puff pastry bun (no meat)1171225512112314819006309
Crisps (sliced and formed) 7110340561064846003111015
Savoury cookies/biscuits/crackers31300528670052966000101
Coated nuts18800988300178120092010
Savoury snacks, other1761111444312114740011306
Composite dishes 212920442970274523507820017
Potatoes, vegetables and meat25821631600306010009600015
Italian ready meals (incl. lasagna)2191363240026651000131400027
Rice and noodle ready meals28016483510215126105800013
Filled wraps, tortillas2015451525015551020001050015
Pies, quiches, oven-baked dishes, etc.74927283141230272743540012
Bean dishes (chili con carne, etc.)1573207007327000070007
Pizzas289034471907453990717100034
Mixed salads with toppings85833402700403822007500012
Sandwiches or baguettes116019295020233540204100015
Sauces127402275714133254111153010
Emulsified sauces8050018701300246790074010
Peanut sauces11203463913155432814124021
Cooking sauces, oriental2061536372024373719100002
Cooking sauces, other151285426115124825103711013
Table A5. Nutri-Score distribution per food group for the reference situation and product improvement scenario for sugars reformulation (scoring 1 point less, −1.5 g/100 g in drinks and −4.5 g/100 g in food and dairy drinks, on the Nutri-Score scale), and the proportion of products improved in Nutri-Score.
Distribution Nutri-Score
(% of Product per Category)
Percentage of Products with Improved
Nutri-Score (B–A)
Percentage Improved in Total
Reference Situation (A)Product Improvement Scenario (B)
Food GroupsNABCDEABCDEABCDETotal
Drinks *21680252406076918505221028
Syrups Squash and Cordial31401029273401440113404160020
Fruit Juice drink42903554200107713007290037
Soft drinks, with added sugar14250057421057422005221027
Milk products *12187403715115541714082210031
Dairy drinks, with added sugar3201183600346600023600029
Yoghurt and quark, with added sugar440124542001862200062300029
Custard, with added sugar215099100073270006400064
Pudding, mousse and desserts, with added sugar243022173404256820262010
Baked goods and confectionery *10,09204842451594342012306
Pound cakes63900118810012376001506
Bars (muesli, cereal, fruit)141016374166262740161665034
Biscuit, waffle and cookie164200521730172368013508
Pies and pastries (sweet)141500124642011352340128011
Chocolate2169000793000892000202
Sweets289311247861124776000000
Ice cream1193013559505405230493016
Cereals *9322174327325153820241370024
Bread luxury, plain and sweet 467144643621447325110111023
Breakfast cereals465419401004817287071530025
* Foods with added sugar.
Table A6. Nutri-Score distribution per food group for the reference situation and product improvement scenario for fibre reformulation (scoring 1 point more, +0.9 g/100 g, on the Nutri-Score-scale), and the proportion of products improved in Nutri-Score.
Distribution Nutri-Score
(% of Product per Category)
Percentage of Products with Improved
Nutri-Score (B–A)
Percentage Improved in Total
Reference Situation (A)Product Improvement Scenario (B)
Food GroupsNABCDEABCDEABCDETotal
Cereals43013728191524521191328221012
Bread22075442400692930015100016
Bread luxury, plain and sweet4671446436165533502111014
Bread luxury, savoury16944013404839193324392017
Bread alternatives780201229335211231325112004
Bases (pie, shell, crust), etc.2137253323111228292925839025
Breakfast cereals4654194010042940100001001
Composite dishes212920442970284323608710016
Potatoes, vegetables and meat25821631600315990010700017
Italian ready meals (incl. lasagna)219136324002167120081200020
Rice and noodle ready meals280164835102844281011700019
Filled wraps, tortillas2015451525020501020051050020
Pies, quiches, oven-baked dishes, etc.74927283141230263033531012
Bean dishes (chili con carne, etc.)1573207007327000070007
Pizzas28903447190436441504730014
Mixed salads with toppings85833402700423920009700016
Sandwiches or baguettes11601929502022354120390011

References

  1. World Health Organization–Regional Office for Europe. European Food and Nutrition Action Plan 2015–2020. Available online: http://www.euro.who.int/__data/assets/pdf_file/0008/253727/64wd14e_FoodNutAP_140426.pdf (accessed on 13 August 2020).
  2. World Health Organization Department for Management of NCDs Disability Violence and Injury Prevention (NVI). ‘Best Buys’ and Other Recommended Interventions for the Prevention and Control of Noncommunicable Diseases. Tackling NCDs. WHO/NMH/NVI/17.9; WHO: Geneva, Switzerland, 2017. [Google Scholar]
  3. World Health Organization–Regional Office for Europe. Action Plan for the Prevention and Control of Noncommunicable Diseases in the WHO European Region; WHO Regional Office for Europe: Copenhagen, Denmark, 2016. [Google Scholar]
  4. Chantal, J.; Hercberg, S.; World Health Organization–Regional Office for Europe. Development of a new front-of-pack nutrition label in France: The five-colour Nutri-Score. Public Health Panor. 2017, 3, 712–725. [Google Scholar]
  5. Dréano-Trécant, L.; Egnell, M.; Hercberg, S.; Galan, P.; Soudon, J.; Fialon, M.; Touvier, M.; Kesse-Guyot, E.; Julia, C. Performance of the Front-of-Pack Nutrition Label Nutri-Score to Discriminate the Nutritional Quality of Foods Products: A Comparative Study across 8 European Countries. Nutrients 2020, 12, 1303. [Google Scholar] [CrossRef] [PubMed]
  6. National Institute for Public Health and the Environment (RIVM). Fact Sheet RIVM. A Closer Look af Front-of Pack Nutrition Labels; RIVM: Bilthoven, The Netherlands, 2019. [Google Scholar]
  7. Dutch Ministry of Health Welfare and Sport. New Front-of-Pack Logo Nutri-Score. Available online: www.rijksoverheid.nl/onderwerpen/voeding/gezonde-voeding/nieuw-voedselkeuzelogo-nutri-score (accessed on 13 August 2020).
  8. Egnell, M.; Talati, Z.; Gombaud, M.; Galan, P.; Hercberg, S.; Pettigrew, S.; Julia, C. Consumers’ Responses to Front-of-Pack Nutrition Labelling: Results from a Sample from The Netherlands. Nutrients 2019, 11, 1817. [Google Scholar] [CrossRef] [PubMed] [Green Version]
  9. Afshin, A.; Sur, P.J.; Fay, K.A.; Cornaby, L.; Ferrara, G.; Salama, J.S.; Mullany, E.C.; Abate, K.H.; Abbafati, C.; Abebe, Z.; et al. Health effects of dietary risks in 195 countries, 1990–2017: A systematic analysis for the Global Burden of Disease Study 2017. Lancet 2019, 393, 1958–1972. [Google Scholar] [CrossRef] [Green Version]
  10. Health Council of the Netherlands. Dutch Dietary Guidelines 2015. Publication nr. 2015/24E.; Health Council of the Netherlands: The Hague, The Netherlands, 2015. [Google Scholar]
  11. Brink, E.; van Rossum, C.; Postma-Smeets, A.; Stafleu, A.; Wolvers, D.; van Dooren, C.; Toxopeus, I.; Buurma-Rethans, E.; Geurts, M.; Ocke, M. Development of healthy and sustainable food-based dietary guidelines for the Netherlands. Public Health Nutr. 2019, 22, 2419–2435. [Google Scholar] [CrossRef] [Green Version]
  12. Santé Publique France. Usage Regulation for the “Nutri-Score” Logo; Santé publique France: Saint-Maurice, France, 2018. [Google Scholar]
  13. Santé Publique France. Nutri-Score Frequently Asked Questions; Santé Publique France: Saint-Maurice, France, 2020. [Google Scholar]
  14. Santé Publique France. Nutri-Score. Available online: https://www.santepubliquefrance.fr/determinants-de-sante/nutrition-et-activite-physique/articles/nutri-score (accessed on 18 August 2020).
  15. Van der Bend, D.L.M.; Jansen, L.; van der Velde, G.; Blok, V. The influence of a front-of-pack nutrition label on product reformulation: A ten-year evaluation of the Dutch Choices programme. Food Chem. X 2020, 6, 100086. [Google Scholar] [CrossRef] [PubMed]
  16. Dutch Nutrition Centre. Food Label Database [Levensmiddelendatabank]. Available online: https://www.voedingscentrum.nl/professionals/productaanbod-en-levensmiddelendatabank/levensmiddelendatabank.aspx (accessed on 13 August 2020).
  17. Westenbrink, S.; van der Vossen-Wijmenga, W.; Toxopeus, I.; Milder, I.; Ocké, M. LEDA, the branded food database in the Netherlands: Data challenges and opportunities. J. Food Compos. Anal. 2021, 102, 104044. [Google Scholar] [CrossRef]
  18. National Institute for Public Health and the Environment (RIVM). Salt, Sugar and Saturated Fatty Acid Content in Foods. Available online: https://www.rivm.nl/en/news/salt-sugar-and-saturated-fatty-acid-content-in-foods-rivm-reformulation-monitor-2018 (accessed on 18 August 2020).
  19. European Parliament and Council. Regulation (EU) No 1169/2011 of the European parliament and of the council. Appendix V Foods which are exempted from the requirement of the mandatory nutrition declaration. Off. J. Eur. Union 2011, 304, 47. [Google Scholar]
  20. Kromhout, D.; Spaaij, C.J.; de Goede, J.; Weggemans, R.M. The 2015 Dutch food-based dietary guidelines. Eur. J. Clin. Nutr. 2016, 70, 869–878. [Google Scholar] [CrossRef] [PubMed]
  21. Szabo de Edelenyi, F.; Egnell, M.; Galan, P.; Druesne-Pecollo, N.; Hercberg, S.; Julia, C. Ability of the Nutri-Score front-of-pack nutrition label to discriminate the nutritional quality of foods in the German food market and consistency with nutritional recommendations. Arch. Public Health 2019, 77, 28. [Google Scholar] [CrossRef] [PubMed] [Green Version]
  22. National Institute for Public Health and the Environment (RIVM). Dutch National Food Consumption Survey 2012–2016. [Voedselconsumptiepeiling. Wat eet en Drinkt Nederland? Resultaten van de Voedselconsumptiepeiling 2012–2016]. Available online: www.wateetnederland.nl/ (accessed on 13 August 2020).
  23. Julia, C.; Fialon, M.; Galan, P.; Deschasaux, M.; Andreeva, V.A.; Kesse-Guyot, E.; Touvier, M.; Hercberg, S. Are foods ‘healthy’ or ‘healthier’? front of pack labelling and the concept of healthiness applied to foods. Br. J. Nutr. 2021, May 5, 1–17. [Google Scholar] [CrossRef]
  24. Kelly, B.; Jewell, J.; World Health Organization–Regional Office for Europe. What Is the Evidence on the Policy Specifications, Development Processes and Effectiveness of Existing Front-of-Pack Food Labelling Policies in the WHO European Region? (Health Evidence Network (HEN) Synthesis Report 61); WHO Regional Office for Europe: Copenhagen, Denmark, 2018. [Google Scholar]
  25. Egnell, M.; Talati, Z.; Galan, P.; Andreeva, V.A.; Vandevijvere, S.; Gombaud, M.; Dreano-Trecant, L.; Hercberg, S.; Pettigrew, S.; Julia, C. Objective understanding of the Nutri-score front-of-pack label by European consumers and its effect on food choices: An online experimental study. Int. J. Behav. Nutr. Phys. Act. 2020, 17, 146. [Google Scholar] [CrossRef]
  26. Song, J.; Brown, M.K.; Tan, M.; MacGregor, G.A.; Webster, J.; Campbell, N.R.C.; Trieu, K.; Ni Mhurchu, C.; Cobb, L.K.; He, F.J. Impact of color-coded and warning nutrition labelling schemes: A systematic review and network meta-analysis. PLoS Med. 2021, 18, e1003765. [Google Scholar] [CrossRef]
  27. Van Tongeren, C.; Jansen, L. Adjustments Needed for the Use of Nutri-Score in the Netherlands: Lack of Selectivity and Conformity with Dutch Dietary Guidelines in Four Product Groups. Int. J. Nutr. Food Sci. 2020, 9, 33–42. [Google Scholar] [CrossRef]
Figure 1. The Nutri-Score logo/Santé publique France 2017. This FoP label indicates the nutritional quality of a food product based on five coloured categories (A–E) [14].
Nutrients 13 04536 g001
Figure 2. Estimated effect of sodium reformulation on Nutri-Score, assuming the levels of the other food components remain constant. Bars represent the proportion of products with an improved Nutri-Score when scoring 1 point less (−90 mg/100 g) on the Nutri-Score sub score for sodium. * Soups including broth and stocks.
Nutrients 13 04536 g002
Figure 3. Estimated effect of saturated fat reformulation on Nutri-Score, assuming the levels of the other food components remain constant. Bars represent the proportion of products with an improved Nutri-Score when scoring 1 point less (−1 g/100 g) on the Nutri-Score sub score for saturated fat. * 1 Nutri-Score point/median ratio % saturated fat content.
Nutrients 13 04536 g003
Figure 4. Estimated effect of sugars reformulation on Nutri-Score, assuming the levels of the other food components remain constant. Bars represent the proportion of sweetened products with an improved Nutri-Score when scoring 1 point less (−1.5 g/100 g in drinks and −4.5 g/100 g in food and dairy drinks) on the Nutri-Score sub score for sugars. * With added sugar.
Nutrients 13 04536 g004
Figure 5. Estimated effect of fibre reformulation on Nutri-Score, assuming the levels of the other food components remain constant. Bars represent the proportion of products with an improved Nutri-Score when scoring 1 point more (+0.9 g/100 g) on the Nutri-Score sub score for fibre.
Nutrients 13 04536 g005
Table 1. Foods classified according to the Nutri-Score and comparison with the Dutch food-based dietary guidelines [10].
Food Group 1Food-Based Dietary Guideline 2NNutri-Score (%)
ABCDE
General guidelineGuidelines: follow a dietary pattern that involves eating more plant-based food and less animal-based food. Limit salt intake to 6 g daily.
Comparison analysis: eat less meat by replacing with meat-alternatives. Limit the consumption of salt-rich products (such as bread, cheeses, meat preparations, savoury snacks and ready meals)
Fruit and vegetables 3Guideline: eat at least 200 grams of vegetables and at least 200 grams of fruit daily.
Comparison analysis: higher consumption recommended
7225894700
Protein-rich products
Meat, poultry, meat preparations 3Guideline: limit the consumption of red meat, particularly processed meat. Limit salt intake to 6 g daily
Comparison analysis: limit the consumption of red meat, particularly processed meat. Limit the consumption of salt-rich products
5557201083330
  Meat preparations 1374616214710
  Composed and single processed meat 4 27860144055
  Meat unprocessed, red meat 3 54664233100
  Meat unprocessed, white meat 3 8517819200
Meat alternatives 24050113090
Milk productsGuideline: take a few portions of dairy produce dialy, including milk and yoghurt
Comparison analysis: maintain the current consumption, including milk and yoghurt
1392173632141
  Dairy drinks, with added sugarGuideline: minimize the consumption of sugar-containing drinks
Comparison analysis: see guideline
3201183600
  Dairy drinks, no added sugar 98964000
  Yoghurt and quark, with added sugar 44012454200
  Yoghurt and quark, no added sugar 45919000
  Desserts, with added sugar 4580554392
  Desserts, no added sugar 3132260420
CheesesGuidelines: limit salt intake to 6 g daily
Comparison analysis: limit the consumption of salt-rich products
44580018712
Pulses 3Guideline: eat legumes weekly
Comparison analysis: higher consumption of legumes recommended
3011000000
Nuts and seedsGuideline: eat at least 15 g of unsalted nuts daily
Comparison analysis: higher consumption unsalted nuts recommended
108127423010
  Nuts and seeds (unsalted) 64139511000
  Nuts and seeds (salted) 44010305920
Carbohydrate- and fibre-rich products
Cereal productsGuidelines: replace refined cereal products with whole-grain products. Eat at least 90 grams of brown bread, wholebread or other whole-grain products daily. Limit salt intake to 6 g daily
Comparison analysis: replace refined cereal products with whole-grain products. Limit the consumption of salt-rich products
4301372819152
  Bread wheat-wholegrain 287991000
  Bread miscellaneous 18614748500
  Bread luxury, plain and sweet 4671446436
  Bread luxury, savoury 16944013404
  Bread alternatives (toast, crackers, etc.) 780201229335
  Bases (wraps, pizzabases, etc.) 213725332311
  Breakfast cereals 46541940100
Oils and fatsGuideline: replace butter, hard margarines and cookong fats by soft margarines, liquid cooking fats and vegetable oils
Comparison analysis: replace hard fats with liquid cooking fats and vegetable oils
80100383132
  Oils 2940069273
  Spreads, baking and cooking fats 50700193348
Fish 3Guideline: eat one serving of fish, preferably fatty oily fish, weekly
Comparison analysis: higher consumption recommended, preferably oily fish
1593253617220
DrinksGuideline: minimize the consumption of sugar-containing drinks
Comparison analysis: see guideline
382291636363
  Bottled water 2971000000
  Syrups Squash and Cordial 314010292734
  Fruit Juice 6980027730
  Fruit Juice drink 4290355420
  Soft drinks, with added sugar 5 14250057421
  Soft drinks, no added sugar 5 621091900
  Vegetable juice 388413300
Savoury snacksGuidelines: limit salt intake to 6 g daily
Comparison analysis: limit the consumption of salt-rich products
205505294818
Ready meals 6Guidelines: limit salt intake to 6 g daily
Comparison analysis: limit the consumption of salt-rich products
212920442970
1 Tea, coffee, alcoholic beverages and egg are not included as these products do not contain a nutrition declaration; 2 dietary guidelines which are not included: increase the consumption of tea, replace coffee with filtered coffee, do not drink alcohol or no more than one glass daily; 3 including processed and unprocessed (not eligible for Nutri-Score) products; 4 including prepared and raw/cured processed meats; 5 including sport drinks and energy drinks; 6 including pizzas.
Publisher’s Note: MDPI stays neutral with regard to jurisdictional claims in published maps and institutional affiliations.

