
Vitamin D Status of the British African-Caribbean Residents: Analysis of the UK Biobank Cohort


 ,
,  , ,
, ,
Abstract
:1. Introduction
2. Materials and Methods
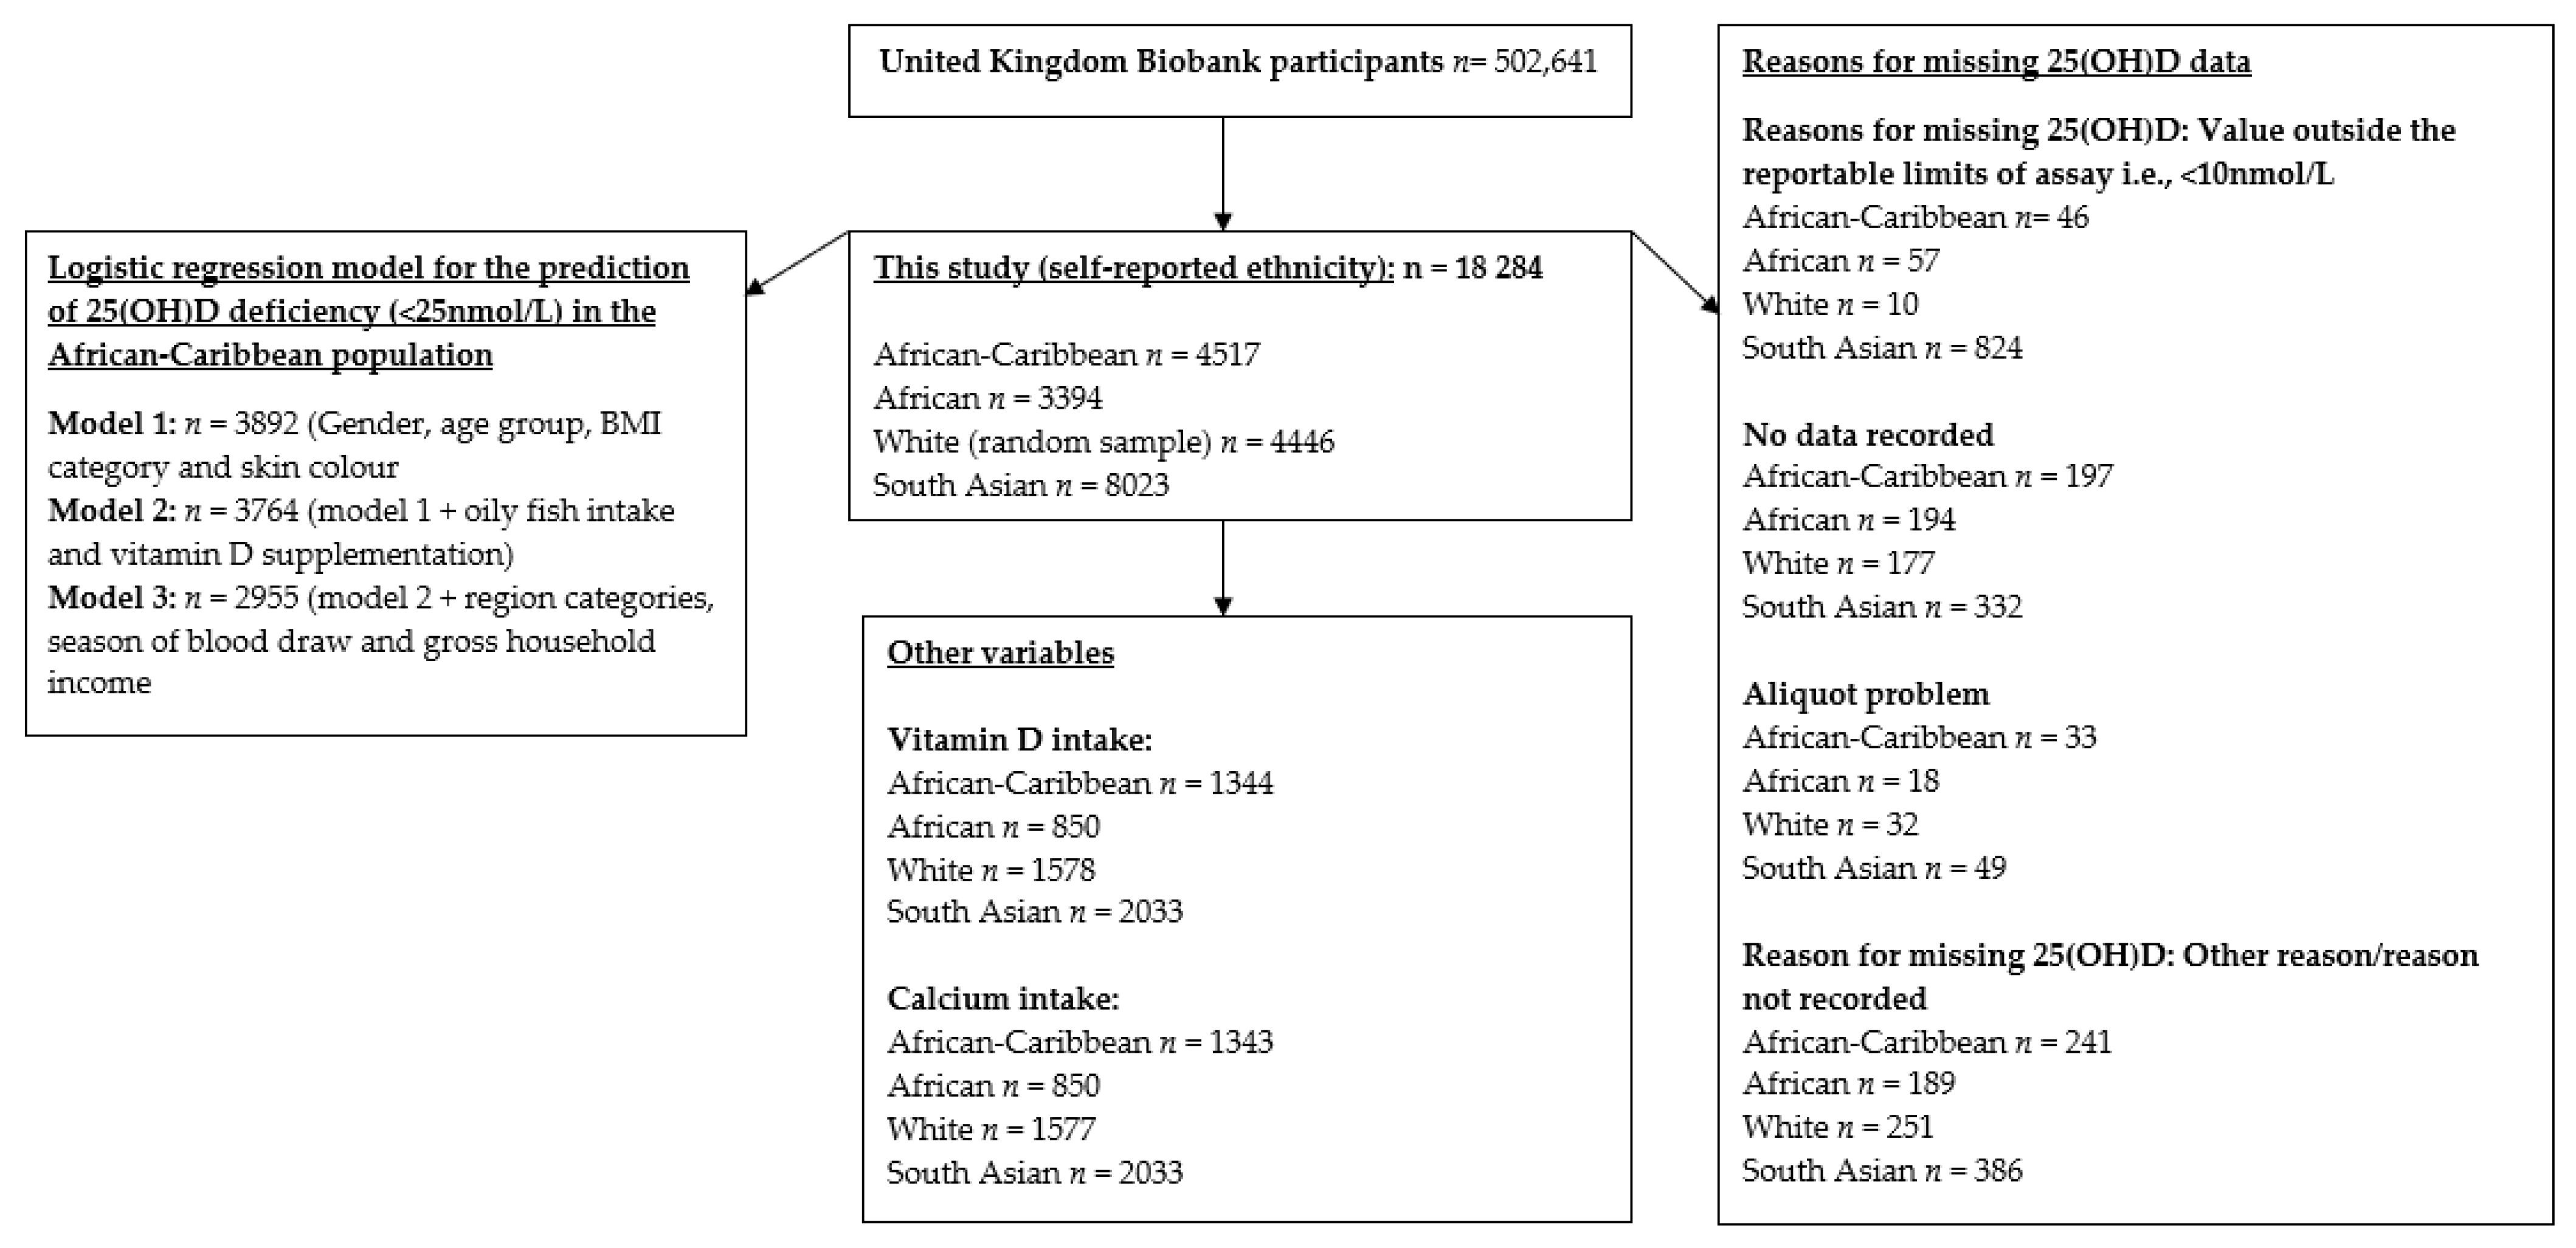
2.1. UK Biobank
2.2. Serum 25(OH)D Concentration
2.3. Dietary Data
2.4. Statistical Analysis
3. Results
3.1. Descriptive Characteristics
3.2. Descriptive Data: Categorical Variables for the African-Caribbean and African Participants
3.3. Reasons for Missing 25(OH)D Data
3.4. Primary Outcomes
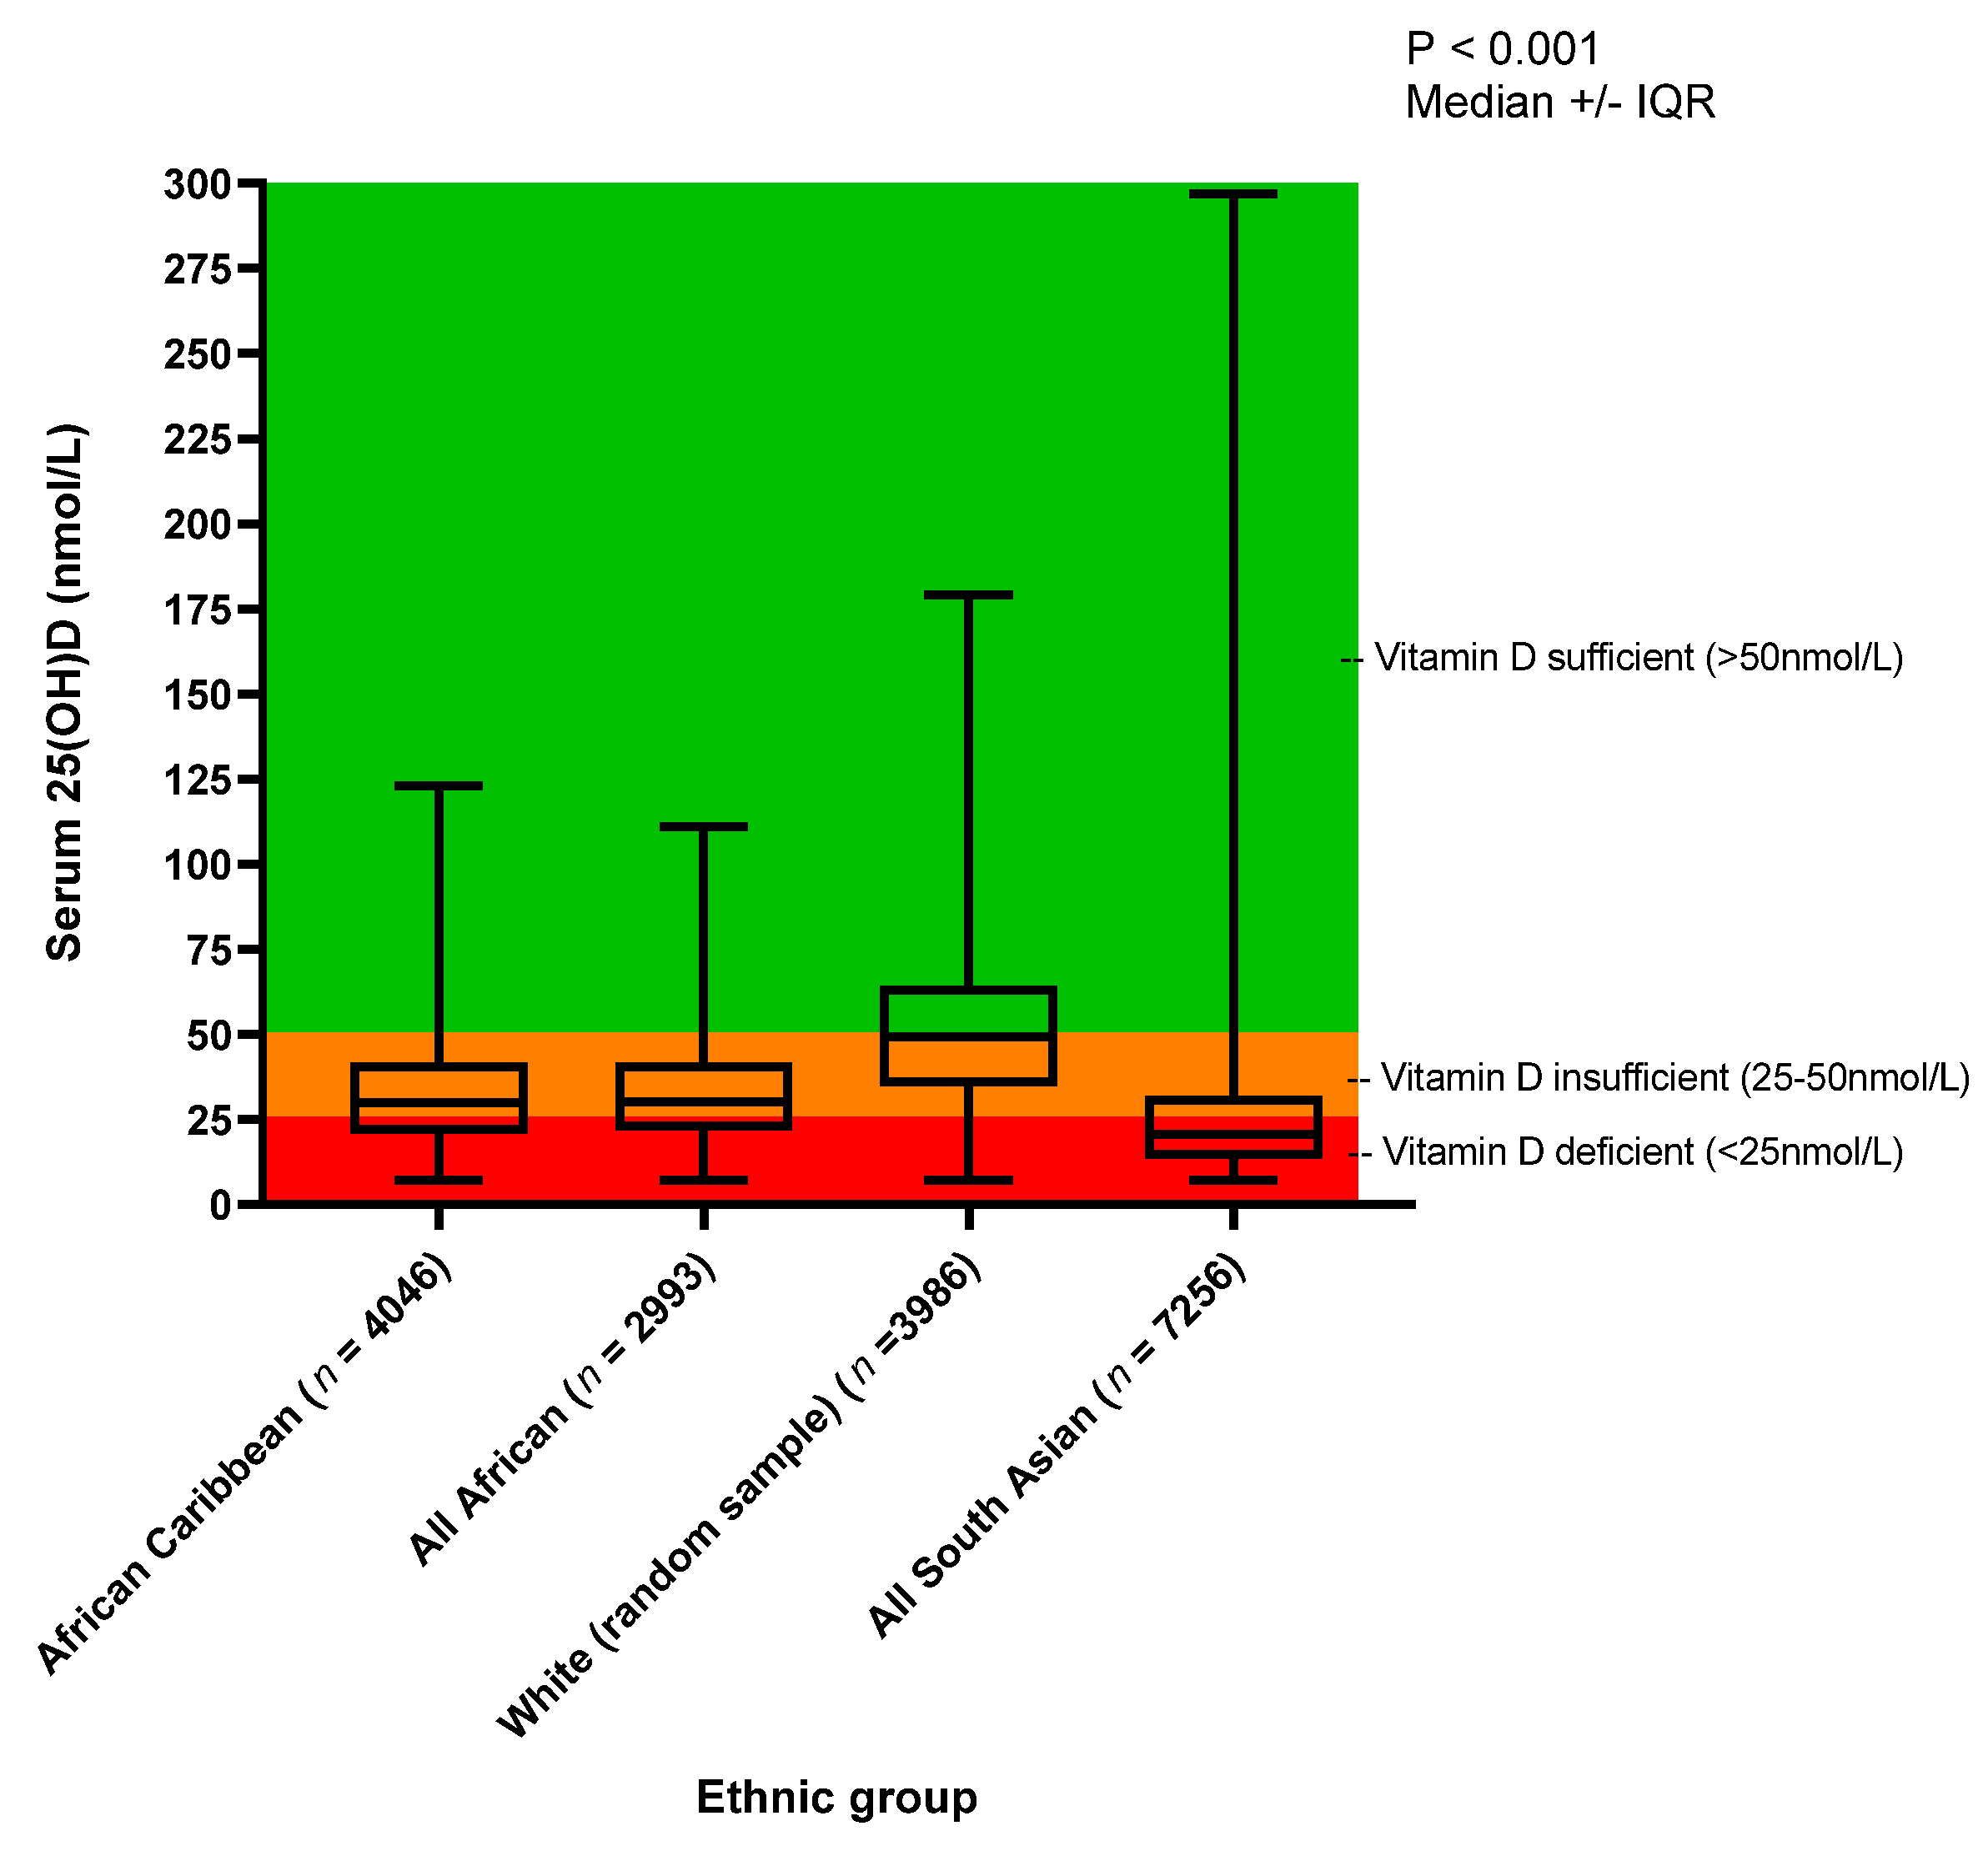
25(OH)D Concentration
3.5. Prediction of 25(OH)D Deficiency: Logistic Regression Model
3.6. Dietary Intake
4. Discussion
5. Conclusions
Author Contributions
Funding
Institutional Review Board Statement
Informed Consent Statement
Data Availability Statement
Conflicts of Interest
References
- Prentice, A.; Schoenmakers, I.; Jones, K.S.; Jarjou, L.M.A.; Goldberg, G.R. Vitamin D Deficiency and Its Health Consequences in Africa. Clin. Rev. Bone Miner. Metab. 2009, 7, 94–106. [Google Scholar] [CrossRef] [Green Version]
- Chen, T.; Chimeh, F.; Lu, Z.; Mathieu, J.; Person, K.S.; Zhang, A.; Kohn, N.; Martinello, S.; Berkowitz, R.; Holick, M.F. Factors that influence the cutaneous synthesis and dietary sources of vitamin D. Arch. Biochem. Biophys. 2007, 460, 213–217. [Google Scholar] [CrossRef] [Green Version]
- Durazo-Arvizu, R.A.; Pacheco-Dominguez, R.L.; Sempos, C.T.; Kramer, H.; Hoofnagle, A.N.; Pirzada, A.; Cooper, R.S.; Daviglus, M.L. The Association between Cardiovascular Disease Risk Factors and 25-Hydroxivitamin D and Related Analytes among Hispanic/Latino Adults: A Pilot Study. Nutrients 2019, 11, 1959. [Google Scholar] [CrossRef] [Green Version]
- Bellavia, D.; Costa, V.; De Luca, A.; Maglio, M.; Pagani, S.; Fini, M.; Giavaresi, G. Vitamin D Level Between Calcium-Phosphorus Homeostasis and Immune System: New Perspective in Osteoporosis. Curr. Osteoporos. Rep. 2016, 1–12. [Google Scholar] [CrossRef]
- Nair, R.; Maseeh, A. Vitamin D: The “sunshine” vitamin. J. Pharmacol. Pharmacother. 2012, 3, 118–126. [Google Scholar] [CrossRef]
- Cashman, K.D. Vitamin D Deficiency: Defining, Prevalence, Causes, and Strategies of Addressing. Calcif. Tissue Int. 2020, 106, 14–29. [Google Scholar] [CrossRef]
- Jones, G. Pharmacokinetics of vitamin D toxicity. Am. J. Clin. Nutr. 2008, 88, 582S–586S. [Google Scholar] [CrossRef] [Green Version]
- Chiang, D.; Kramer, H.; Luke, A.; Cooper, R.; Aloia, J.; Bovet, P.; Plange-Rhule, J.; Forrester, T.; Lambert, V.; Camacho, P.; et al. 25-Hydroxyvitamin D and blood pressure: A plateau effect in adults with African ancestry living at different latitudes. J. Hypertens. 2017, 35, 968–974. [Google Scholar] [CrossRef]
- Bikle, D.D. Vitamin D Metabolism, Mechanism of Action, and Clinical Applications. Chem. Biol. 2014, 21, 319–329. [Google Scholar] [CrossRef] [Green Version]
- Martins, J.S.; Palhares, M.D.O.; Teixeira, O.C.M.; Ramos, M.G. Vitamin D Status and Its Association with Parathyroid Hormone Concentration in Brazilians. J. Nutr. Metab. 2017, 2017, 1–5. [Google Scholar] [CrossRef] [Green Version]
- Christakos, S.; Dhawan, P.; Verstuyf, A.; Verlinden, L.; Carmeliet, G. Vitamin D: Metabolism, Molecular Mechanism of Action, and Pleiotropic Effects. Physiol. Rev. 2016, 96, 365–408. [Google Scholar] [CrossRef]
- Mangin, M.; Sinha, R.; Fincher, K. Inflammation and vitamin D: The infection connection. Inflamm. Res. 2014, 63, 803–819. [Google Scholar] [CrossRef] [Green Version]
- Seamans, K.M.; Cashman, K.D. Existing and potentially novel functional markers of vitamin D status: A systematic review. Am. J. Clin. Nutr. 2009, 89, 1997S–2008S. [Google Scholar] [CrossRef] [Green Version]
- Darling, A.L.; Blackbourn, D.J.; Ahmadi, K.R.; Lanham-New, S.A. Vitamin D supplement use and associated demographic, dietary and lifestyle factors in 8024 South Asians aged 40–69 years: Analysis of the UK Biobank cohort. Public Health Nutr. 2018, 21, 2678–2688. [Google Scholar] [CrossRef] [Green Version]
- Grant, W.B.; Cross, H.S.; Garland, C.F.; Gorham, E.D.; Moan, J.; Peterlik, M.; Porojnicu, A.C.; Reichrath, J.; Zittermann, A. Estimated benefit of increased vitamin D status in reducing the economic burden of disease in western Europe. Prog. Biophys. Mol. Biol. 2009, 99, 104–113. [Google Scholar] [CrossRef]
- SACN, U. Vitamin D and Health. 2016. Available online: https://www.gov.uk/government/groups/scientific-advisory-committee-on-nutrition (accessed on 3 September 2020).
- Wilson, L.R.; Tripkovic, L.; Hart, K.; Lanham-New, S.A. Vitamin D deficiency as a public health issue: Using vitamin D2 or vitamin D3 in future fortification strategies. Proc. Nutr. Soc. 2017, 76, 392–399. [Google Scholar] [CrossRef] [Green Version]
- Wacker, M.; Holick, M.F. Sunlight and Vitamin D. Dermato-Endocrinol. 2013, 5, 51–108. [Google Scholar] [CrossRef] [Green Version]
- Tripkovic, L.; Wilson, L.R.; Hart, K.; Johnsen, S.; De Lusignan, S.; Smith, C.P.; Bucca, G.; Penson, S.; Chope, G.; Elliott, R.; et al. Daily supplementation with 15 μg vitamin D2 compared with vitamin D3 to increase wintertime 25-hydroxyvitamin D status in healthy South Asian and white European women: A 12-wk randomized, placebo-controlled food-fortification trial. Am. J. Clin. Nutr. 2017, 106, 481–490. [Google Scholar] [CrossRef] [Green Version]
- Clemens, T.L.; Henderson, S.L.; Adams, J.S.; Holick, M.F. Increased Skin Pigment Reduces the Capacity of Skin to Synthesise Vitamin D3. Lancet 1982, 319, 74–76. [Google Scholar] [CrossRef]
- Agyemang, C.; Bhopal, R.; Bruijnzeels, M. Negro, Black, Black African, African Caribbean, African American or what? Labelling African origin populations in the health arena in the 21st century. J. Epidemiol. Community Health 2005, 59, 1014–1018. [Google Scholar] [CrossRef]
- Jablonski, N.G.; Chaplin, G. The evolution of human skin coloration. J. Hum. Evol. 2000, 39, 57–106. [Google Scholar] [CrossRef] [Green Version]
- Patel, J.V.; Chackathayil, J.; Hughes, E.A.; Webster, C.; Lip, G.Y.; Gill, P.S. Vitamin D deficiency amongst minority ethnic groups in the UK: A cross sectional study. Int. J. Cardiol. 2013, 167, 2172–2176. [Google Scholar] [CrossRef]
- Rezai, M.-R.; Wallace, A.M.; Sattar, N.; Finn, J.D.; Wu, F.C.; Cruickshank, J.K. Ethnic Differences in Aortic Pulse Wave Velocity Occur in the Descending Aorta and May Be Related to Vitamin D. Hypertension 2011, 58, 247–253. [Google Scholar] [CrossRef] [Green Version]
- Ford, L.; Graham, V.; Wall, A.; Berg, J. Vitamin D concentrations in an UK inner-city multicultural outpatient population. Ann. Clin. Biochem. Int. J. Lab. Med. 2006, 43, 468–473. [Google Scholar] [CrossRef] [Green Version]
- Donin, A.S.; Nightingale, C.M.; Owen, C.G.; Rudnicka, A.R.; McNamara, M.C.; Prynne, C.J.; Stephen, A.M.; Cook, D.G.; Whincup, P.H. Nutritional composition of the diets of South Asian, black African-Caribbean and white European children in the United Kingdom: The Child Heart and Health Study in England (CHASE). Br. J. Nutr. 2010, 104, 276–285. [Google Scholar] [CrossRef] [Green Version]
- Castaneda-Gameros, D.; Redwood, S.; Thompson, J.L. Nutrient Intake and Factors Influencing Eating Behaviors in Older Migrant Women Living in the United Kingdom. Ecol. Food Nutr. 2018, 57, 50–68. [Google Scholar] [CrossRef] [Green Version]
- Sudlow, C.; Gallacher, J.; Allen, N.; Beral, V.; Burton, P.; Danesh, J.; Downey, P.; Elliott, P.; Green, J.; Landray, M.; et al. UK Biobank: An Open Access Resource for Identifying the Causes of a Wide Range of Complex Diseases of Middle and Old Age. PLoS Med. 2015, 12, e1001779. [Google Scholar] [CrossRef] [Green Version]
- UK Biobank. Available online: https://www.ukbiobank.ac.uk/ (accessed on 30 January 2021).
- Institute of Medicine. Dietary Reference Intakes for Calcium and Vitamin D; The National Academies Press, Institute of Medicine: Washington, DC, USA, 2011. [Google Scholar]
- Le Goff, C.; Cavalier, E.; Souberbielle, J.-C.; González-Antuña, A.; Delvin, E. Measurement of circulating 25-hydroxyvitamin D: A historical review. Pract. Lab. Med. 2015, 2, 1–14. [Google Scholar] [CrossRef] [Green Version]
- DEQAS. DEQAS Review 2016-2017. Available online: http://www.deqas.org/downloads/DEQAS%20Review%20October%202017.pdf (accessed on 20 May 2021).
- Finkelstein, M.M.; Verma, D.K. Exposure estimation in the presence of nondetectable values: Another look. AIHA J. 2001, 62, 195–198. [Google Scholar] [CrossRef]
- UK Biobank. 24-hour Dietary Recall Questionnaire Version 1.1. Available online: http://biobank.ctsu.ox.ac.uk/crystal/crystal/docs/DietWebQ.pdf (accessed on 15 July 2021).
- Liu, B.; Young, H.; Crowe, F.; Benson, V.S.; Spencer, E.A.; Key, T.J.; Appleby, P.N.; Beral, V. Development and evaluation of the Oxford WebQ, a low-cost, web-based method for assessment of previous 24 h dietary intakes in large-scale prospective studies. Public Health Nutr. 2011, 14, 1998–2005. [Google Scholar] [CrossRef] [Green Version]
- Holland, B.; Welch, A.A.; Unwin, I.D.; Buss, D.H.; Paul, A.A. McCance and Widdowson’s The Composition of Foods, 5th ed.; Royal Society of Chemistry: Cambridge, UK, 1991. [Google Scholar]
- Crew, K.D.; Campbell, J.; Reynolds, D.; Fulton, L.; Flom, J.D.; Liao, Y.; Tehranifar, P.; Terry, M.B. Mammographic density and serum 25-hydroxyvitamin D levels. Nutr. Metab. 2014, 11, 18. [Google Scholar] [CrossRef] [Green Version]
- Vearing, R.M.; Hart, K.H.; Darling, A.L.; Probst, Y.; Olayinka, A.S.; Mendis, J.; Ribeiro, H.; Thakur, S.; Mendes, M.; Charlton, K.; et al. Global Perspective of the Vitamin D Status of African-Caribbean Populations: A Systematic Review and Meta-analysis. Eur. J. Clin. Nutr. 2021, 1–11. [Google Scholar] [CrossRef]
- Mendes, M.M.; Darling, A.L.; Hart, K.H.; Morse, S.; Murphy, R.J.; Lanham-New, S.A. Impact of high latitude, urban living and ethnicity on 25-hydroxyvitamin D status: A need for multidisciplinary action? J. Steroid Biochem. Mol. Biol. 2019, 188, 95–102. [Google Scholar] [CrossRef]
- Pedersen, M.B.; Hansen, J.C.; Rejnmark, L.; Heickendorff, L.; Lauridsen, A.L.; Mulvad, G.; Siggaard, C.; Skjoldborg, H.; Mosekilde, L.; Pedersen, E.B. Vitamin D Insufficiency in Greenlanders on a Westernized Fare: Ethnic Differences in Calcitropic Hormones Between Greenlanders and Danes. Calcif. Tissue Int. 2003, 74, 255–263. [Google Scholar] [CrossRef]
- Frost, P. Vitamin D deficiency among northern Native Peoples: A real or apparent problem? Int. J. Circumpolar Health 2012, 71, 317. [Google Scholar] [CrossRef] [Green Version]
- Von Hurst, P.R.; Stonehouse, W.; Coad, J. Vitamin D status and attitudes towards sun exposure in South Asian women living in Auckland, New Zealand. Public Health Nutr. 2010, 13, 531–536. [Google Scholar] [CrossRef] [PubMed] [Green Version]
- Darling, A.L.; Blackbourn, D.J.; Ahmadi, K.R.; Lanham-New, S.A. Very high prevalence of 25-hydroxyvitamin D deficiency in 6433 UK South Asian adults: Analysis of the UK Biobank Cohort. Br. J. Nutr. 2021, 125, 448–459. [Google Scholar] [CrossRef]
- Free, R. Health Survey for England. 2010. Available online: https://academic.oup.com/ije/article/41/6/1585/741862?login=true (accessed on 6 November 2018).
- Darling, A.L. Vitamin D deficiency in western dwelling South Asian populations: An unrecognised epidemic. Proc. Nutr. Soc. 2020, 79, 259–271. [Google Scholar] [CrossRef]
- Miljkovic, I.; Bodnar, L.M.; Cauley, J.A.; Bunker, C.H.; Patrick, A.L.; Wheeler, V.W.; Kuller, L.H.; Zmuda, J.M. Low preva-lence of vitamin D deficiency in elderly Afro-Caribbean men. Ethnicity Dis. 2011, 21, 79–84. [Google Scholar]
- Marcinowska-Suchowierska, E.; Kupisz-Urbańska, M.; Łukaszkiewicz, J.; Pludowski, P.; Jones, G. Vitamin D Toxicity—A Clinical Perspective. Front. Endocrinol. 2018, 9, 550. [Google Scholar] [CrossRef] [Green Version]
- MacLaughlin, J.; Holick, M.F. Aging decreases the capacity of human skin to produce vitamin D3. J. Clin. Investig. 1985, 76, 1536–1538. [Google Scholar] [CrossRef] [PubMed] [Green Version]
- Karuppusami, R.; Antonisami, B.; Vasan, S.K.; Gowri, M.; Selliah, H.Y.; Arulappan, G.; Jebasingh, F.; Thomas, N.; Paul, T.V. Association of serum 25-Hydroxy vitamin D with total and regional adiposity and cardiometabolic traits. PLoS ONE 2020, 15, e0243850. [Google Scholar] [CrossRef] [PubMed]
- Forsythe, L.K.; Livingstone, M.B.E.; Barnes, M.S.; Horigan, G.; McSorley, E.M.; Bonham, M.P.; Magee, P.J.; Hill, T.R.; Lucey, A.J.; Cashman, K.D.; et al. Effect of adiposity on vitamin D status and the 25-hydroxycholecalciferol response to supplementation in healthy young and older Irish adults. Br. J. Nutr. 2011, 107, 126–134. [Google Scholar] [CrossRef]
- Martinaityte, I.; Kamycheva, E.; Didriksen, A.; Jakobsen, J.; Jorde, R. Vitamin D Stored in Fat Tissue During a 5-Year Intervention Affects Serum 25-Hydroxyvitamin D Levels the Following Year. J. Clin. Endocrinol. Metab. 2017, 102, 3731–3738. [Google Scholar] [CrossRef] [Green Version]
- Zelzer, S.; Goessler, W.; Herrmann, M. Measurement of vitamin D metabolites by mass spectrometry, an analytical challenge. J. Lab. Precis. Med. 2018, 3, 99. [Google Scholar] [CrossRef]


| African-Caribbean | African | ||||||
|---|---|---|---|---|---|---|---|
| All n = 4046 | Male n = 1496 | Female n = 2549 | All n = 2993 | Male n = 1536 | Female n = 1457 | ||
| Age (at baseline) | 40–60 | 3196 (79.0%) | 1155 (77.2%) | 2042 (80.1%) | 2519 (84.2%) | 1306 (85.0%) | 1213 (83.3%) |
| >60 | 849 (21.0%) | 341 (22.8%) | 508 (19.9%) | 474 (15.8%) | 230 (15.0%) | 244 (16.7%) | |
| p | <0.001 ethnic | 0.62 gender | 0.23 gender | ||||
| BMI | ≤18.5 (underweight) | 6 (0.2%) | 1 (0.1%) | 5 (0.2%) | 2 (0.1%) | 1 (0.1%) | 1 (0.1%) |
| 18.5–24.9 (healthy) | 804 (20.4) | 286 (19.6%) | 518 (20.9%) | 454 (15.7%) | 291 (19.6%) | 163 (11.5%) | |
| 25–29.9 (overweight) | 1605 (40.7%) | 712 (48.8%) | 893 (36.0%) | 1214 (41.9%) | 760 (51.3%) | 454 (32.1%) | |
| >30 (obese) | 1527 (38.7%) | 460 (31.5%) | 1067 (43.0%) | 1227 (42.4%) | 430 (29.0%) | 797 (56.3%) | |
| missing | 104 (2.6%) | 37 (2.5%) | 66 (2.6%) | 96 (3.2%) | 54 (3.5%) | 42 (2.9%) | |
| p | <0.001 ethnic | <0.001 gender | <0.001 gender | ||||
| Self-reported overall health rating | Excellent/good | 2319 (58.0%) | 890 (60.2%) | 1429 (56.8%) | 2035 (70.1%) | 1111 (74.3%) | 924 (65.6%) |
| Fair/poor | 1675 (42.0%) | 588 (39.8%) | 1087 (43.2%) | 869 (29.9%) | 384 (25.7%) | 485 (34.4%) | |
| Missing | 52 (1.3%) | 18 (1.2%) | 33 (2.3%) | 89 (3.0%) | 41 (2.7%) | 48 (3.3%) | |
| p | <0.001 ethnic | 0.03 gender | <0.001 gender | ||||
| Season of blood draw | Spring | 1222 (30.2%) | 458 (30.6%) | 764 (30.0%) | 890 (29.7%) | 465 (30.3%) | 425 (29.2%) |
| Summer | 1022 (25.3%) | 373 (24.9%) | 649 (25.5%) | 889 (29.7%) | 458 (29.8%) | 431 (29.6%) | |
| Autumn | 948 (23.4%) | 344 (23.0%) | 604 (23.7%) | 671 (22.4%) | 334 (21.7%) | 337 (23.1%) | |
| Winter | 854 (21.1%) | 322 (21.5%) | 532 (20.9%) | 543 (18.1%) | 279 (18.2%) | 264 (18.1%) | |
| p | <0.001 ethnic | 0.90 gender | 0.81 gender | ||||
| Vegetarian | Yes | 36 (0.9%) | 8 (0.5%) | 28 (1.1%) | 9 (0.3%) | 3 (0.2%) | 6 (0.4%) |
| No | 4010 (99.1%) | 1489 (99.5%) | 2521 (98.9%) | 2984 (99.7%) | 1533 (99.8%) | 1451 (99.6%) | |
| Missing | - | - | - | - | - | - | |
| p | <0.001 ethnic | 0.07 gender | 0.28 gender | ||||
| Vitamin D containing supplement * | Yes | 1508 (37.9%) | 432 (29.5%) | 1076 (42.8%) | 926 (31.6%) | 394 (26.2%) | 532 (37.2%) |
| No | 2470 (62.1%) | 1033 (70.5%) | 1437 (57.2%) | 2007 (68.4%) | 1110 (73.8%) | 897 (62.8%) | |
| Missing | 68 (1.7%) | 60 (2.0%) | |||||
| p | <0.001 ethnic | <0.001 gender | <0.001 gender | ||||
| Oily fish consumption | Never | 208 (5.2%) | 85 (5.8%) | 123 (4.9%) | 165 (5.8%) | 86 (5.9%) | 79 (5.6%) |
| ≤ once per week | 1138 (28.6%) | 424 (29.0%) | 714 (28.3%) | 873 (30.5%) | 482 (33.1%) | 391 (27.8%) | |
| Once a week | 1484 (37.2%) | 532 (36.4%) | 952 (37.7%) | 916 (32.0%) | 465 (32.0%) | 451 (32.1%) | |
| 2–4 times per week | 1038 (26.1%) | 371 (25.4%) | 667 (26.5%) | 716 (25.0%) | 336 (23.1%) | 380 (27.0%) | |
| ≥ 5 times a week | 115 (2.9%) | 31 (2.1%) | 67 (2.7%) | 191 (6.6%) | 50 (3.4%) | 63 (4.5%) | |
| Missing | 63 (1.6%) | 132 (4.4%) | |||||
| p | <0.001 ethnic | 0.56 gender | 0.01 gender | ||||
| Skin Colour | Brown or black | 3762 (93.0%) | 1406 (94.0%) | 2355 (92.4%) | 2640 (88.2%) | 1366 (88.9%) | 1274 (87.5%) |
| Other | 284 (7.0%) | 90 (6.0%) | 194 (7.6%) | 352 (11.8%) | 170 (11.1%) | 1366 (88.9%) | |
| p | <0.001 ethnic | 0.06 gender | 0.22 gender | ||||
| Ease of skin tanning | Get very or moderately tanned | 2437 (60.2%) | 833 (55.6%) | 1604 (62.9%) | 726 (24.2%) | 294 (19.1%) | 432 (29.7%) |
| Get mildly or occasionally tanned | 651 (16.1%) | 264 (17.6%) | 387 (15.2%) | 465 (15.5%) | 221 (14.4%) | 244 (16.8%) | |
| Never tan, only burn | 266 (6.6%) | 123 (8.2%) | 143 (5.6%) | 561 (18.7%) | 326 (21.2%) | 235 (16.1%) | |
| Do not know/prefer not to answer | 692 (17.1%) | 277 (18.5%) | 415 (16.3%) | 1240 (41.4%) | 695 (45.2%) | 545 (37.5%) | |
| p | <0.001 ethnic | <0.001 gender | <0.001 gender | ||||
| Time spent outdoors in summer (hours) | <1 h | 209 (5.9%) | 63 (4.7%) | 146 (6.6%) | 211 (8.2%) | 99 (7.5%) | 112 (9.0%) |
| 1–2 h | 840 (23.8%) | 262 (19.6%) | 578 (26.3%) | 694 (26.9%) | 364 (27.4%) | 330 (26.4%) | |
| 3–4 h | 1107 (31.3%) | 362 (27.0%) | 745 (33.9%) | 732 (28.4%) | 352 (26.5%) | 380 (30.4%) | |
| ≥5 h | 1379 (39.0%) | 652 (48.7%) | 727 (33.1%) | 942 (36.5%) | 513 (38.6%) | 429 (34.3%) | |
| missing | 511 (12.6%) | 414 (13.8%) | |||||
| p | <0.001 ethnic | <0.001 gender | 0.03 gender | ||||
| Use of sun protection | Never/rarely | 1656 (40.9%) | 769 (51.4%) | 887 (34.8%) | 1980 (66.2%) | 1079 (70.3%) | 901 (61.9%) |
| Sometimes | 1433 (35.4%) | 450 (30.1%) | 983 (38.6%) | 659 (22.0%) | 302 (19.7%) | 357 (24.5%) | |
| Most of the time/always | 825 (20.4%) | 218 (14.6%) | 607 (23.8%) | 189 (6.3%) | 77 (5.0%) | 112 (7.7%) | |
| Do not go out in the sunshine | 64 (1.6%) | 25 (1.7%) | 39 (1.5%) | 72 (2.4%) | 26 (1.7%) | 46 (3.2%) | |
| Missing | 68 (1.7%) | 35 (2.3%) | 33 (1.3%) | 91 (3.0%) | 51 (3.3%) | 40 (2.7%) | |
| p | <0.001 ethnic | <0.001 gender | <0.001 gender | ||||
| Income | <£18,000 | 1034 (33.1%) | 353 (30.9%) | 681 (34.4%) | 847 (37.3%) | 435 (35.7%) | 412 (39.2%) |
| £18,000 to £30,900 | 908 (29.0%) | 306 (26.8%) | 602 (30.4%) | 653 (28.8%) | 340 (27.9%) | 313 (29.8%) | |
| £31,000 to £51,900 | 741 (23.7%) | 272 (23.8%) | 469 (23.7%) | 490 (21.6%) | 285 (23.4%) | 205 (19.5%) | |
| ≥£52 000 | 442 (14.2%) | 213 (18.6%) | 229 (11.6%) | 281 (12.4%) | 159 (13.0%) | 122 (11.6%) | |
| Missing | 921 (22.8%) | 772 (24.1%) | |||||
| p | 0.01 ethnic | <0.001 gender | 0.06 gender | ||||
| Region | London/South England | 2168 (53.6%) | 756 (50.5%) | 1412 (55.4%) | 2022 (67.6%) | 992 (64.6%) | 1030 (70.7%) |
| Midlands/Wales | 1159 (28.6%) | 456 (30.5%) | 703 (27.6%) | 289 (9.7%) | 161 (10.5%) | 128 (8.8%) | |
| Scotland/North England | 719 (17.8%) | 285 (19.0%) | 434 (17.0%) | 682 (22.8%) | 383 (24.9%) | 299 (20.5%) | |
| p | <0.001 ethnic | 0.01 gender | <0.001 gender | ||||
| Born UK/ROI | No | 2351 (58.1%) | 878 (58.7%) | 1473 (57.8%) | 2657 (88.8%) | 1392 (90.6%) | 1265 (86.8%) |
| Yes | 1674 (41.4%) | 612 (40.9%) | 1062 (41.7%) | 271 (9%) | 115 (7.5%) | 156 (10.7%) | |
| Missing | 21 (0.5%) | 7 (0.5%) | 14 (0.5%) | 65 (2.2%) | 29 (1.9%) | 36 (2.5%) | |
| p | <0.001 ethnic | 0.79 gender | 0.02 gender | ||||
| Oral contraceptive use (females) | Yes | - | - | 82 (3.2%) | - | - | 34 (2.3%) |
| No | - | - | 980 (38.4%) | - | - | 581 (39.9%) | |
| Missing | - | - | 1487 (58.3%) | - | - | 842 (57.8%) | |
| p | <0.001 ethnic | ||||||
| Menopause (females) | Yes | - | - | 1043 (40.9%) | - | - | 679 (46.6%) |
| No | - | - | 989 (38.8%) | - | - | 551 (37.8%) | |
| Not sure (had a hysterectomy) | - | - | 344 (13.5%) | - | - | 104 (7.1%) | |
| Not sure (other reason)/Prefer not to say | 152 (6.0%) | 152 (6.0%) | |||||
| Missing | - | - | 1497 (37.0%) | - | - | 1537 (51.4%) | |
| p | <0.001 ethnic | ||||||
| Current tobacco smoker | Yes/occasionally | 676 (16.7%) | 357 (23.8%) | 319 (12.5%) | 206 (6.9%) | 159 (10.4%) | 47 (3.2%) |
| No | 3358 (83.0%) | 1136 (75.9%) | 2222 (87.2%) | 2781 (92.9%) | 1372 (89.3%) | 1409 (96.7%) | |
| Missing | 12 (0.3%) | 4 (0.3%) | 8 (0.3%) | 6 (0.2%) | 5 (0.3%) | 1 (0%) | |
| p | <0.001 ethnic | <0.001 gender | <0.001 gender | ||||
| Inflammatory condition ** | Yes | 189 (4.7%) | 72 (4.8%) | 117 (4.6%) | 87 (2.9%) | 49 (3.2%) | 38 (2.6%) |
| No | 3857 (95.3%) | 1424 (95.2%) | 2432 (95.4%) | 2906 (97.1%) | 1487 (96.8%) | 1419 (97.4%) | |
| p | <0.001 ethnic | 0.74 gender | 0.34 gender | ||||
| Group | n | Median 25(OH)D (nmol/L) | IQR 25(OH)D (nmol/L) | p-Value for Medians * | 25(OH)D Deficient (<25 nmol/L) | 25(OH)D Insufficient (>25–50 nmol/L) | 25(OH)D Sufficient (>50 nmol/L) |
|---|---|---|---|---|---|---|---|
| All African-Caribbean | 4046 | 30.0 | 20.9 | <0.001 ethnicities † p = 0.41 AC vs. AF † p < 0.001 for all other ethnicity vs. ethnicity post hoc tests | 1499 (37.0%) | 1906 (41.1%) | 642 (15.9%) |
| African-Caribbean Male | 1497 | 29.5 | 19.3 | 0.01 gender | 604 (40.3%) | 676 (45.2%) | 217 (14.5%) |
| African-Caribbean Female | 2549 | 30.4 | 21.5 | 895 (35.1%) | 1230 (48.2%) | 424 (16.7%) | |
| All African | 2993 | 30.2 | 20.0 | 1042 (34.8%) | 1539 (51.4%) | 412 (13.8%) | |
| African Male | 1536 | 28.5 | 19.1 | <0.001 gender | 589 (38.3%) | 773 (50.3%) | 174 (11.3%) |
| African Female | 1457 | 32.0 | 20.9 | 453 (31.1%) | 766 (52.6%) | 238 (16.3%) | |
| All White (random sample) | 3986 | 49.2 | 29.5 | 459 (11.5%) | 1591 (39.9%) | 642 (15.9%) | |
| White Male | 1910 | 49.2 | 29.7 | 0.47 gender | 201 (10.5%) | 780 (40.8%) | 929 (48.6%) |
| White Female | 2076 | 49.3 | 29.1 | 258 (12.4%) | 811 (39.0%) | 1007 (48.5%) | |
| All South Asian | 7256 | 20.7 | 18.5 | 4454 (61.4%) | 2280 (31.4%) | 523 (7.2%) | |
| South Asian Male | 3922 | 20.1 | 16.7 | <0.001 gender | 2517 (64.2%) | 1202 (30.6%) | 203 (5.2%) |
| South Asian Female | 3334 | 21.8 | 21.1 | 1936 (58.1%) | 1078 (32.3%) | 320 (9.6%) |
| Group | Spring | Summer | Autumn | Winter | p-Value for Medians * | ||||||||
|---|---|---|---|---|---|---|---|---|---|---|---|---|---|
| n | Median (nmol/L) | IQR (nmol/L) | n | Median (nmol/L) | IQR (nmol/L) | n | Median (nmol/L) | IQR (nmol/L) | n | Median (nmol/L) | IQR (nmol/L) | ||
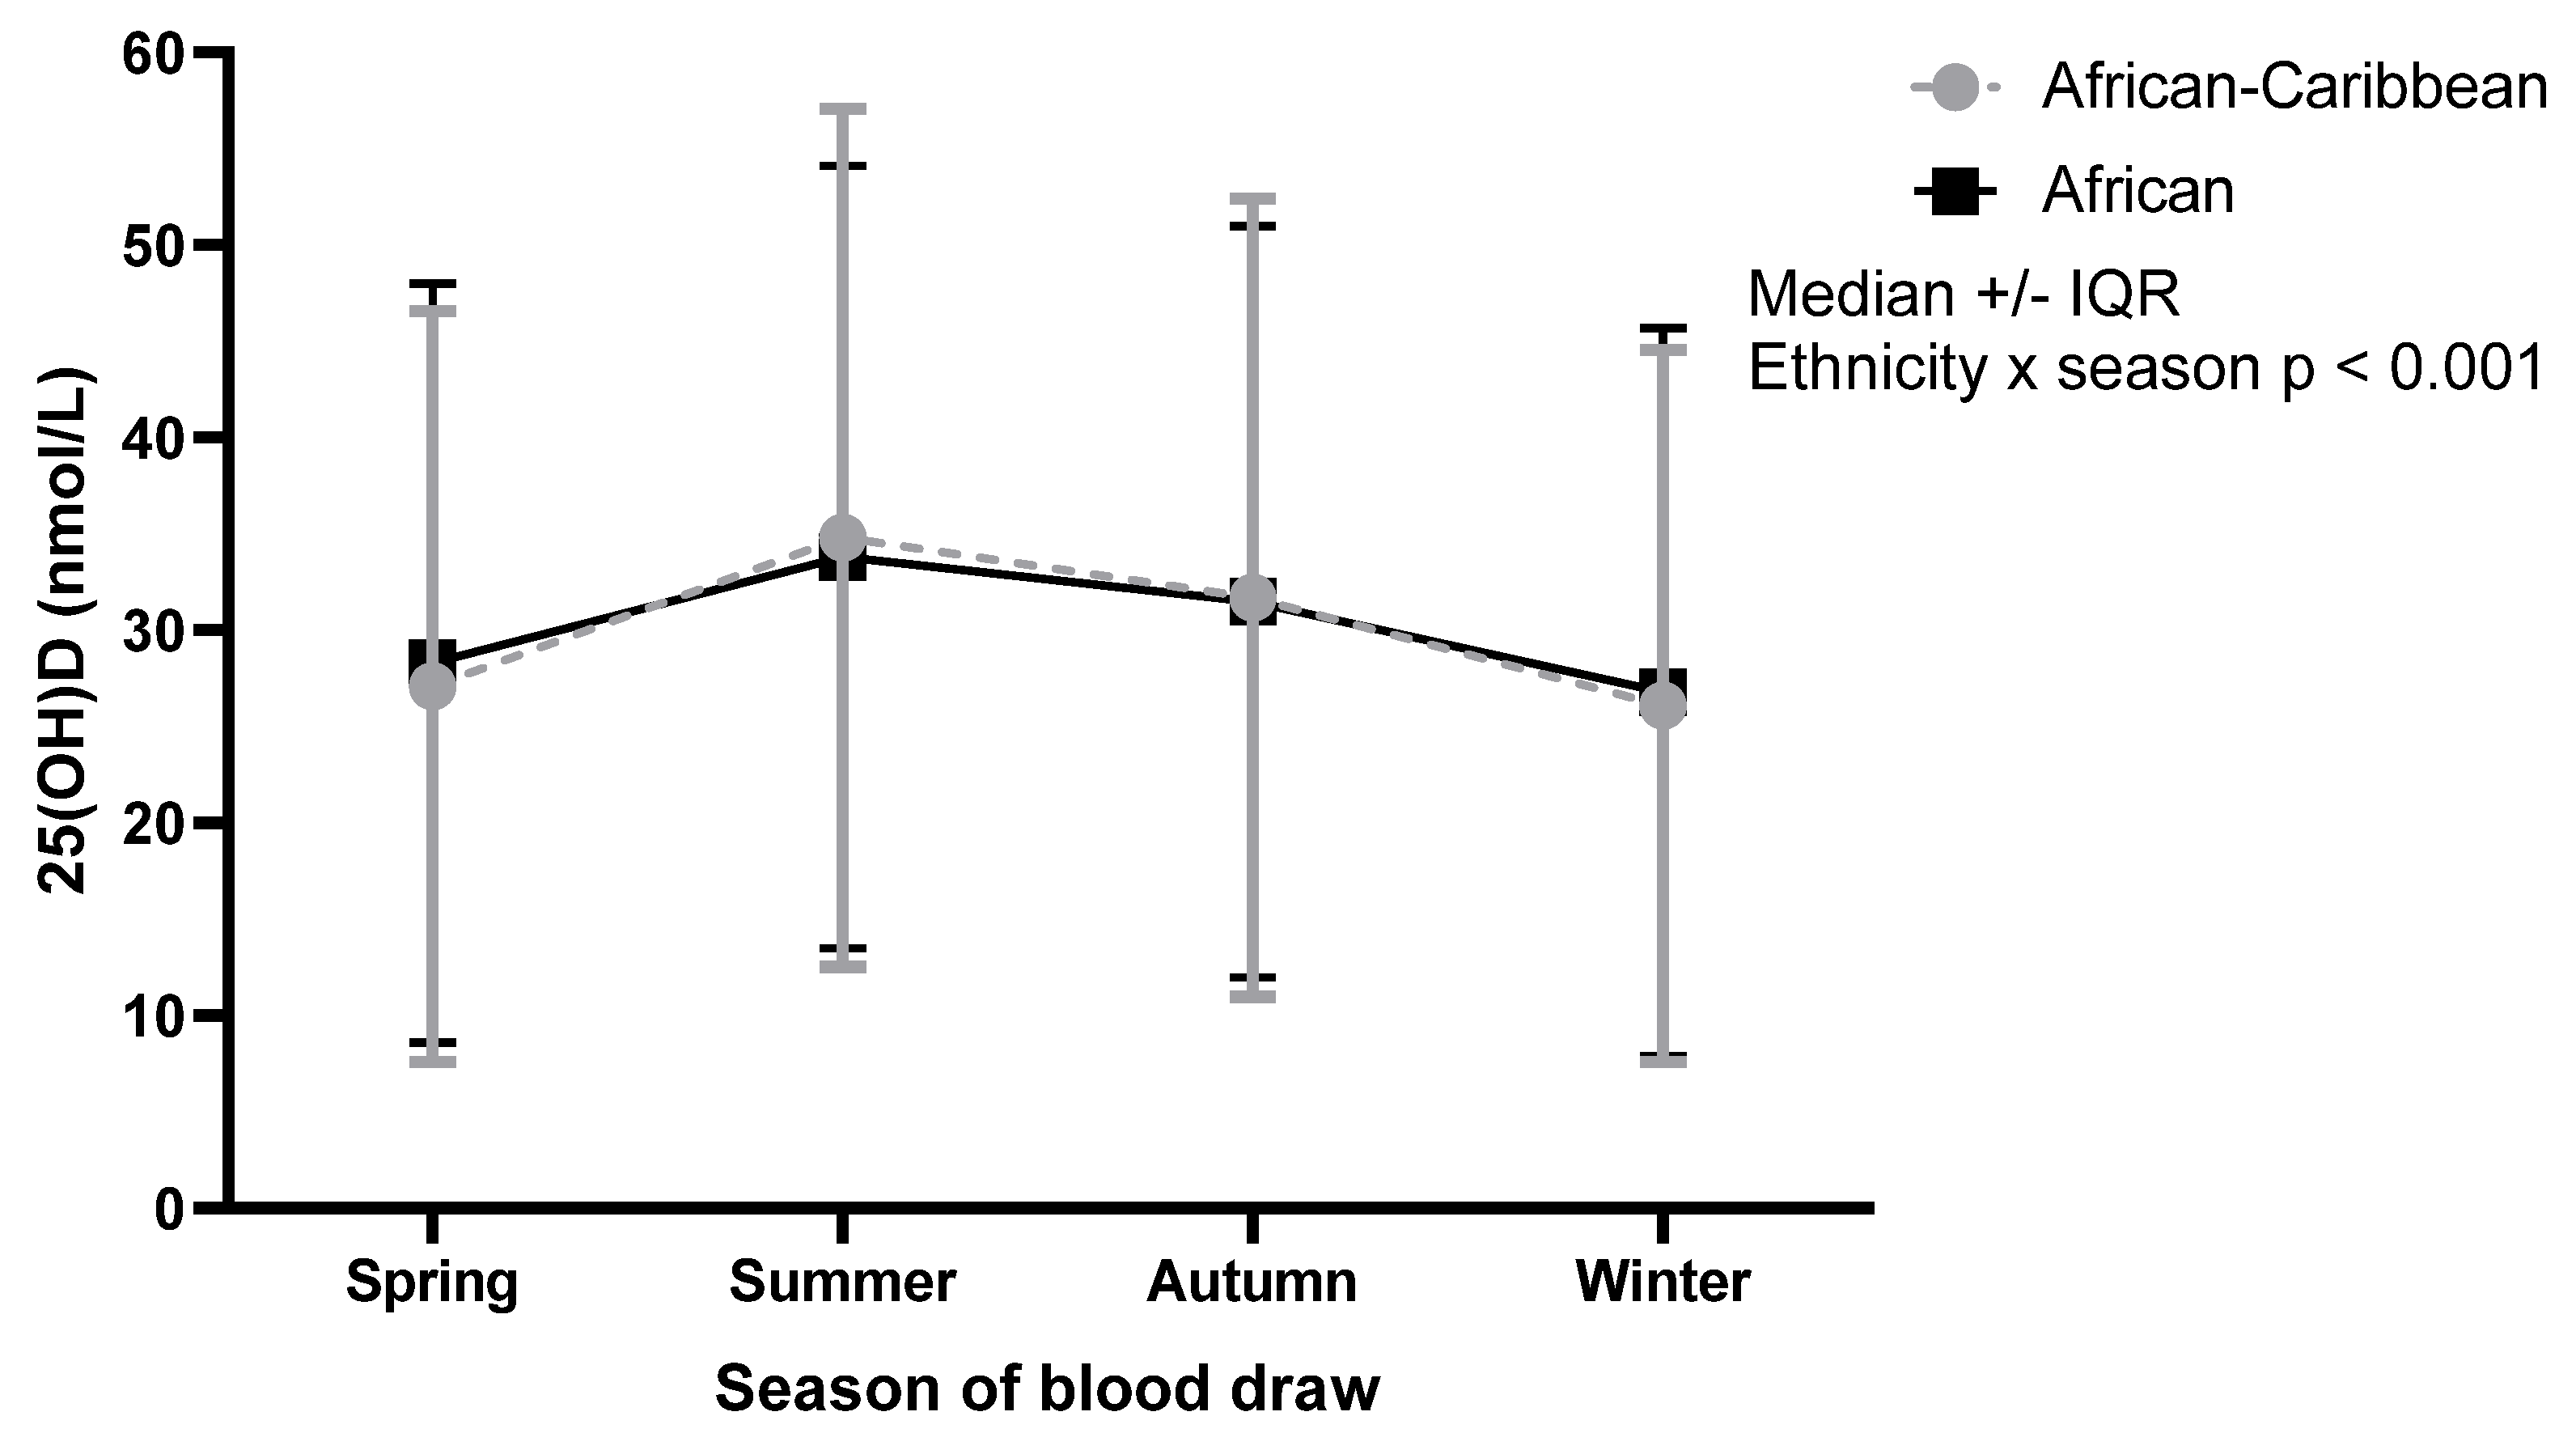
| African-Caribbean (n = 4046) | 1222 (30.2%) | 27.1 | 19.5 | 1022 (25.3%) | 34.8 | 22.3 | 948 (23.4%) | 31.7 | 20.7 | 854 (21.1%) | 26.1 | 18.5 | Ethnicity × season p < 0.001 |
| African-Caribbean male (n = 1496) | 458 (30.6%) | 25.3 | 17.7 | 373 (24.9%) | 35.2 | 23.9 | 344 (23.0%) | 30.9 | 19.2 | 322 (21.5%) | 24.2 | 17.7 | Gender × season p = 0.11 Season main effects: p < 0.001 Gender main effects: p = 0.02 |
| African-Caribbean female (n = 2549) | 764 (30.0%) | 27.7 | 21.2 | 649 (25.5%) | 34.5 | 21.7 | 604 (23.7%) | 31.8 | 22.1 | 532 (20.9%) | 26.7 | 19.0 | |
| African (n = 2993) | 890 (29.7%) | 28.3 | 19.7 | 889 (29.7%) | 33.8 | 20.3 | 671 (22.4%) | 31.5 | 19.5 | 543 (18.1%) | 26.8 | 18.9 | |
| African male (n = 1536) | 465 (30.3%) | 27.4 | 18.8 | 458 (29.8%) | 31.6 | 19.6 | 334 (21.7%) | 31.2 | 18.6 | 279 (18.2%) | 24.7 | 16.0 | Gender × season p = 0.51 Season main effects: p < 0.001 Gender main effects: p < 0.001 |
| African female (1457) | 425 (29.2%) | 30.3 | 21.0 | 431 (29.6%) | 36.3 | 21.8 | 337 (23.1%) | 31.8 | 21.25 | 264 (18.1%) | 29.5 | 20.5 | |
| London/South England Latitude: London: Bart’s Croydon and Hounslow 51.4° N to 51.5° N South England: Bristol, Oxford and Reading 51.5° N to 51.8° N | Midlands/Wales Latitude: Midlands: Birmingham, Nottingham, Stoke on Trent 52.5° N to 53° N Wales: Cardiff, Swansea, Wrexham 51.5° N to 53.0° N | Scotland/North England Latitude: Scotland: Glasgow and Edinburgh 55.9° N to 56.0° N North England: Manchester, Stockport, Bury, Leeds, Liverpool, Middlesbrough, Newcastle, Sheffield, Cheadle 53.4° N to 55° N | p-Values for Medians * | |||||||
|---|---|---|---|---|---|---|---|---|---|---|
| n | Median | IQR | n | Median | IQR | n | Median | IQR | ||
| All African-Caribbean (n = 4046) | 2168 | 31.0 | 22.0 | 1159 | 27.5 | 19.3 | 719 | 30.1 | 19.0 | Ethnicity × geographical location p < 0.001 |
| African-Caribbean male (n = 1496) | 756 | 30.9 | 20.8 | 456 | 26.4 | 18.3 | 285 | 29.6 | 18.1 | p = 0.725 gender × geographical location Geographical main effects: p < 0.001 Gender main effects: p = 0.049 |
| African-Caribbean female (n = 2549) | 1412 | 31.3 | 21.9 | 703 | 28.2 | 20.4 | 434 | 30.6 | 20.5 | |
| All African (n = 2993) | 2022 | 32.3 | 21.4 | 289 | 25.9 | 16.4 | 682 | 27.4 | 16.55 | |
| African male (n = 1536) | 992 | 30.9 | 20.2 | 161 | 24.7 | 16.6 | 383 | 26.3 | 14.6 | p = 0.624 gender × geographical location Geographical main effects: p < 0.001 Gender main effects: p = 0.002 |
| African female (n = 1457) | 1030 | 33.8 | 21.5 | 128 | 26.9 | 18.1 | 299 | 28.3 | 17.5 | |
| Model | n | B | SE | p | Odds Ratio | 95% CI for Odds Ratio | ||
|---|---|---|---|---|---|---|---|---|
| Lower | Upper | |||||||
| Model 1 N = 3892 p < 0.001 Nagelkerke R2 = 0.041 HL test, p = 0.496 | Gender | |||||||
| Female (reference) | 2442 | |||||||
| Male | 1450 | 0.27 | 0.07 | <0.001 | 1.31 | 1.14 | 1.50 | |
| Age | ||||||||
| 40–60 (reference) | 3090 | |||||||
| >60 | 802 | −0.82 | 0.09 | <0.001 | 0.44 | 0.37 | 0.53 | |
| BMI | ||||||||
| ≤25.4 (normal/underweight) (reference) | 926 | 0.01 | ||||||
| 25–29.4 (overweight) | 1307 | −0.12 | 0.09 | 0.16 | 0.88 | 0.74 | 1.05 | |
| >30 (obese) | 1659 | 0.12 | 0.09 | 0.16 | 1.13 | 0.95 | 1.33 | |
| Skin colour | ||||||||
| Other (reference) | 225 | |||||||
| Brown or black | 3667 | 0.47 | 0.16 | <0.001 | 1.60 | 1.18 | 2.18 | |
| Model 2 n = 3764 p <0.001 Nagelkerke R2 = 0.12 HL test, p = 0.828 | Gender | |||||||
| Female (reference) | 2381 | |||||||
| Male | 1383 | 0.15 | 0.07 | 0.04 | 1.16 | 1.00 | 1.34 | |
| Age | ||||||||
| 40–60 (reference) | 3001 | |||||||
| >60 | 763 | −0.89 | 0.10 | <0.001 | 0.41 | 0.34 | 0.50 | |
| BMI | ||||||||
| ≤25.4 (normal/underweight) (reference) | 899 | 0.01 | ||||||
| 25–29.4 (overweight) | 1262 | −0.14 | 0.10 | 0.15 | 0.87 | 0.72 | 1.05 | |
| >30 (obese) | 1603 | 0.12 | 0.09 | 0.20 | 1.12 | 0.94 | 1.34 | |
| Skin colour | ||||||||
| Other (reference) | 217 | |||||||
| Brown or black | 3547 | 0.53 | 0.17 | <0.001 | 1.70 | 1.23 | 2.36 | |
| Oily fish intake | ||||||||
| Yes (reference) | 3597 | |||||||
| No | 167 | 0.52 | 0.17 | <0.001 | 1.69 | 1.22 | 2.34 | |
| Vitamin D supplementation | ||||||||
| User (reference) | 1441 | |||||||
| Non- user | 2323 | 1.09 | 0.08 | <0.001 | 2.98 | 2.56 | 3.47 | |
| Model 3 n = 2955 p < 0.001 Nagelkerke R2 = 0.16 HL test, p = 0.804 | Gender | |||||||
| Female (reference) | 1879 | |||||||
| Male | 1077 | 0.11 | 0.09 | 0.22 | 1.11 | 0.94 | 1.31 | |
| Age | ||||||||
| 40–60 (reference) | 2498 | |||||||
| >60 | 458 | −0.75 | 0.13 | <0.001 | 0.47 | 0.37 | 0.61 | |
| BMI | ||||||||
| ≤25.4 (normal/underweight) (reference) | 683 | 0.02 | ||||||
| 25–29.4 (overweight) | 1020 | −0.08 | 0.11 | 0.45 | 0.92 | 0.74 | 1.14 | |
| >30 (obese) | 1252 | 0.17 | 0.11 | 0.11 | 1.18 | 0.96 | 1.45 | |
| Skin Colour | ||||||||
| Other (reference) | 146 | |||||||
| Brown or black | 2809 | 0.57 | 0.20 | 0.01 | 1.77 | 1.19 | 2.63 | |
| Oily fish intake | ||||||||
| Yes (reference) | 2828 | |||||||
| No | 127 | 0.55 | 0.19 | <0.001 | 1.74 | 1.19 | 2.54 | |
| Vitamin D supplementation | ||||||||
| User (reference) | 1147 | |||||||
| Non-user | 1808 | 1.09 | 0.09 | <0.001 | 2.97 | 2.50 | 3.53 | |
| Region | ||||||||
| London/South England (reference) | 1603 | 0.10 | ||||||
| Midlands/Wales | 828 | 0.19 | 0.09 | 0.04 | 1.22 | 1.01 | 1.46 | |
| Scotland/North England | 524 | 0.14 | 0.11 | 0.22 | 1.15 | 0.92 | 1.43 | |
| Season of blood draw | ||||||||
| Spring (reference) | 897 | <0.001 | ||||||
| Summer | 744 | -1.03 | 0.12 | <0.001 | 0.36 | 0.28 | 0.45 | |
| Autumn | 673 | −0.46 | 0.11 | <0.001 | 0.63 | 0.51 | 0.79 | |
| Winter | 641 | 0.20 | 0.11 | 0.07 | 1.22 | 0.98 | 1.51 | |
| Income | ||||||||
| £18,000 | 956 | 0.97 | ||||||
| £18,000–30,999 | 857 | −0.04 | 0.11 | 0.71 | 0.96 | 0.78 | 1.18 | |
| £31,000–51,999 | 714 | 0.01 | 0.11 | 0.94 | 1.01 | 0.81 | 1.26 | |
| ≥£52,000 | 428 | −0.02 | 0.13 | 0.91 | 0.99 | 0.76 | 1.27 | |
| Vitamin D Intake | Calcium Intake | |||||||||||||
|---|---|---|---|---|---|---|---|---|---|---|---|---|---|---|
| Group | n | Missing | Median (µg/day) | IQR (µg/day) | Suboptimal Intake (<10 µg/day) | Optimal Intake (>10 µg/day) | p-Value for Medians * | n | Missing | Median (mg/day) | IQR (mg/day) | Suboptimal Intake (<700 mg/day) | Optimal Intake (>700 mg/day) | p-Value for Medians * |
| All African-Caribbean | 1344 (33.2%) | 2703 (66.8%) | 1.6 | 2.6 | 1280 (95.2%) | 64 (4.8%) | <0.001 ethnicities | 1343 (33.2%) | 2703 (66.8%) | 726.8 | 536.2 | 641 (47.7%) | 702 (52.3%) | <0.001 ethnicities |
| African-Caribbean Male | 454 | - | 1.8 | 2.8 | 429 (94.5%) | 25 (5.5%) | 0.13 gender | 454 | - | 741.6 | 516.4 | 209 (46.0%) | 245 (54.0%) | 0.05 gender |
| African-Caribbean Female | 890 | - | 1.5 | 2.5 | 851 (95.6%) | 39 (4.4%) | 889 | - | 721.9 | 543.6 | 432 (48.6%) | 457 (51.4%) | ||
| All African | 850 (28.4%) | 2143 (71.6%) | 2.1 | 4.2 | 773 (90.9%) | 77 (9.1%) | 850 (28.4%) | 2143 (71.6%) | 730.7 | 579.1 | 404 (47.5%) | 446 (52.5%) | ||
| African Male | 461 | - | 2.2 | 4.6 | 412 (89.4%) | 49 (10.6%) | 0.02 gender | 461 | - | 741.9 | 613.0 | 220 (47.7%) | 241 (52.3%) | 0.87 gender |
| African Female | 389 | - | 1.9 | 3.8 | 361 (92.8%) | 28 (7.2%) | 389 | - | 729.6 | 552.5 | 184 (47.3%) | 205 (52.7%) | ||
| All White (random sample) | 1578 (39.6%) | 2409 (60.4%) | 1.9 | 2.3 | 1514 (95.9%) | 64 (4.1%) | 1577 (39.6%) | 2409 (60.4%) | 943.9 | 429.8 | 337 (21.4%) | 1240 (78.6%) | ||
| White Male | 746 | - | 2.0 | 2.3 | 714 (95.7%) | 32 (4.3%) | 0.01 gender | 746 | - | 992.9 | 473.7 | 135 (18.1%) | 611 (81.9%) | <0.001 gender |
| White Female | 832 | - | 1.77 | 2.1 | 800 (96.2%) | 32 (3.8%) | 831 | - | 902.4 | 388.0 | 202 (24.3%) | 629 (75.7%) | ||
| All South Asian | 2033 (28.0%) | 5224 (72.0%) | 1.1 | 1.8 | 1973 (97.0%) | 60 (3.0%) | 2033 (28.0%) | 5223 (72.0%) | 826.3 | 543.7 | 747 (36.7%) | 1286 (63.3%) | ||
| South Asian Male | 1099 | - | 1.2 | 1.9 | 1061 (96.5%) | 38 (3.5%) | <0.001 gender | 1099 | - | 863.6 | 569.2 | 364 (33.1%) | 735 (66.9%) | <0.001 gender |
| South Asian Female | 934 | - | 1.1 | 1.7 | 912 (97.6%) | 22 (2.4%) | 934 | - | 782.9 | 514.0 | 383 (41.0%) | 551 (59.0%) | ||
Publisher’s Note: MDPI stays neutral with regard to jurisdictional claims in published maps and institutional affiliations. |
© 2021 by the authors. Licensee MDPI, Basel, Switzerland. This article is an open access article distributed under the terms and conditions of the Creative Commons Attribution (CC BY) license (https://creativecommons.org/licenses/by/4.0/).
Share and Cite
Vearing, R.M.; Hart, K.H.; Charlton, K.; Probst, Y.; Blackbourn, D.J.; Ahmadi, K.R.; Lanham-New, S.A.; Darling, A.L. Vitamin D Status of the British African-Caribbean Residents: Analysis of the UK Biobank Cohort. Nutrients 2021, 13, 4104. https://doi.org/10.3390/nu13114104
Vearing RM, Hart KH, Charlton K, Probst Y, Blackbourn DJ, Ahmadi KR, Lanham-New SA, Darling AL. Vitamin D Status of the British African-Caribbean Residents: Analysis of the UK Biobank Cohort. Nutrients. 2021; 13(11):4104. https://doi.org/10.3390/nu13114104
Chicago/Turabian StyleVearing, Rebecca M., Kathryn H. Hart, Karen Charlton, Yasmine Probst, David J. Blackbourn, Kourosh R. Ahmadi, Susan A. Lanham-New, and Andrea L. Darling. 2021. "Vitamin D Status of the British African-Caribbean Residents: Analysis of the UK Biobank Cohort" Nutrients 13, no. 11: 4104. https://doi.org/10.3390/nu13114104
APA StyleVearing, R. M., Hart, K. H., Charlton, K., Probst, Y., Blackbourn, D. J., Ahmadi, K. R., Lanham-New, S. A., & Darling, A. L. (2021). Vitamin D Status of the British African-Caribbean Residents: Analysis of the UK Biobank Cohort. Nutrients, 13(11), 4104. https://doi.org/10.3390/nu13114104