
A Healthy Diet Is Not More Expensive than Less Healthy Options: Cost-Analysis of Different Dietary Patterns in Mexican Children and Adolescents

 , , ,
, , ,
Abstract
1. Introduction
2. Materials and Methods
2.1. Measurement Instruments
- Food frequency questionnaire (FFQ): The FFQ used for this study was previously validated in the Mexican population [45]. It consists of 116 items, divided in subgroups according to the type of food they belong to: vegetables, fruits, cereals, tubercles, legumes, products of animal origin, oils and fats, sugary drinks, candies, and snacks. An average was taken for each food, specifying the portion’s size, slice, measuring glass/cup, or natural unit. The frequency of consumption used in the FFQ consists of the following answers: never, less than once per month, 1–3 per month, once a week, 2–4 times a week, 5–6 per week, 1 per day, 2–3 per day, 4–5 per day, 6 or more per day. The FFQ is based on a reminder of average food consumption 12 months prior to the day of its application [45]. For this study’s purposes, 30 foods targeted toward the children/adolescent population and easily available to them for quotidian consumption (candies and snacks) were added to the instrument, leaving a total of 146 items.
- Questionnaires dealing with socio-economic aspects, eating habits, and food stores/markets: a 20-item questionnaire was developed specifically for this study to get information regarding the social and economic aspects of the surveyed families. The questionnaire included information about the profession and occupation of the family parents or tutors, monthly monetary income, household characteristics, mode of transport taken, and amount of time dedicated to buying and preparing the foods. A second questionnaire asked about the different stores/markets where the families habitually get their food supply.
2.2. Dietary Patterns
2.3. Cost Analysis
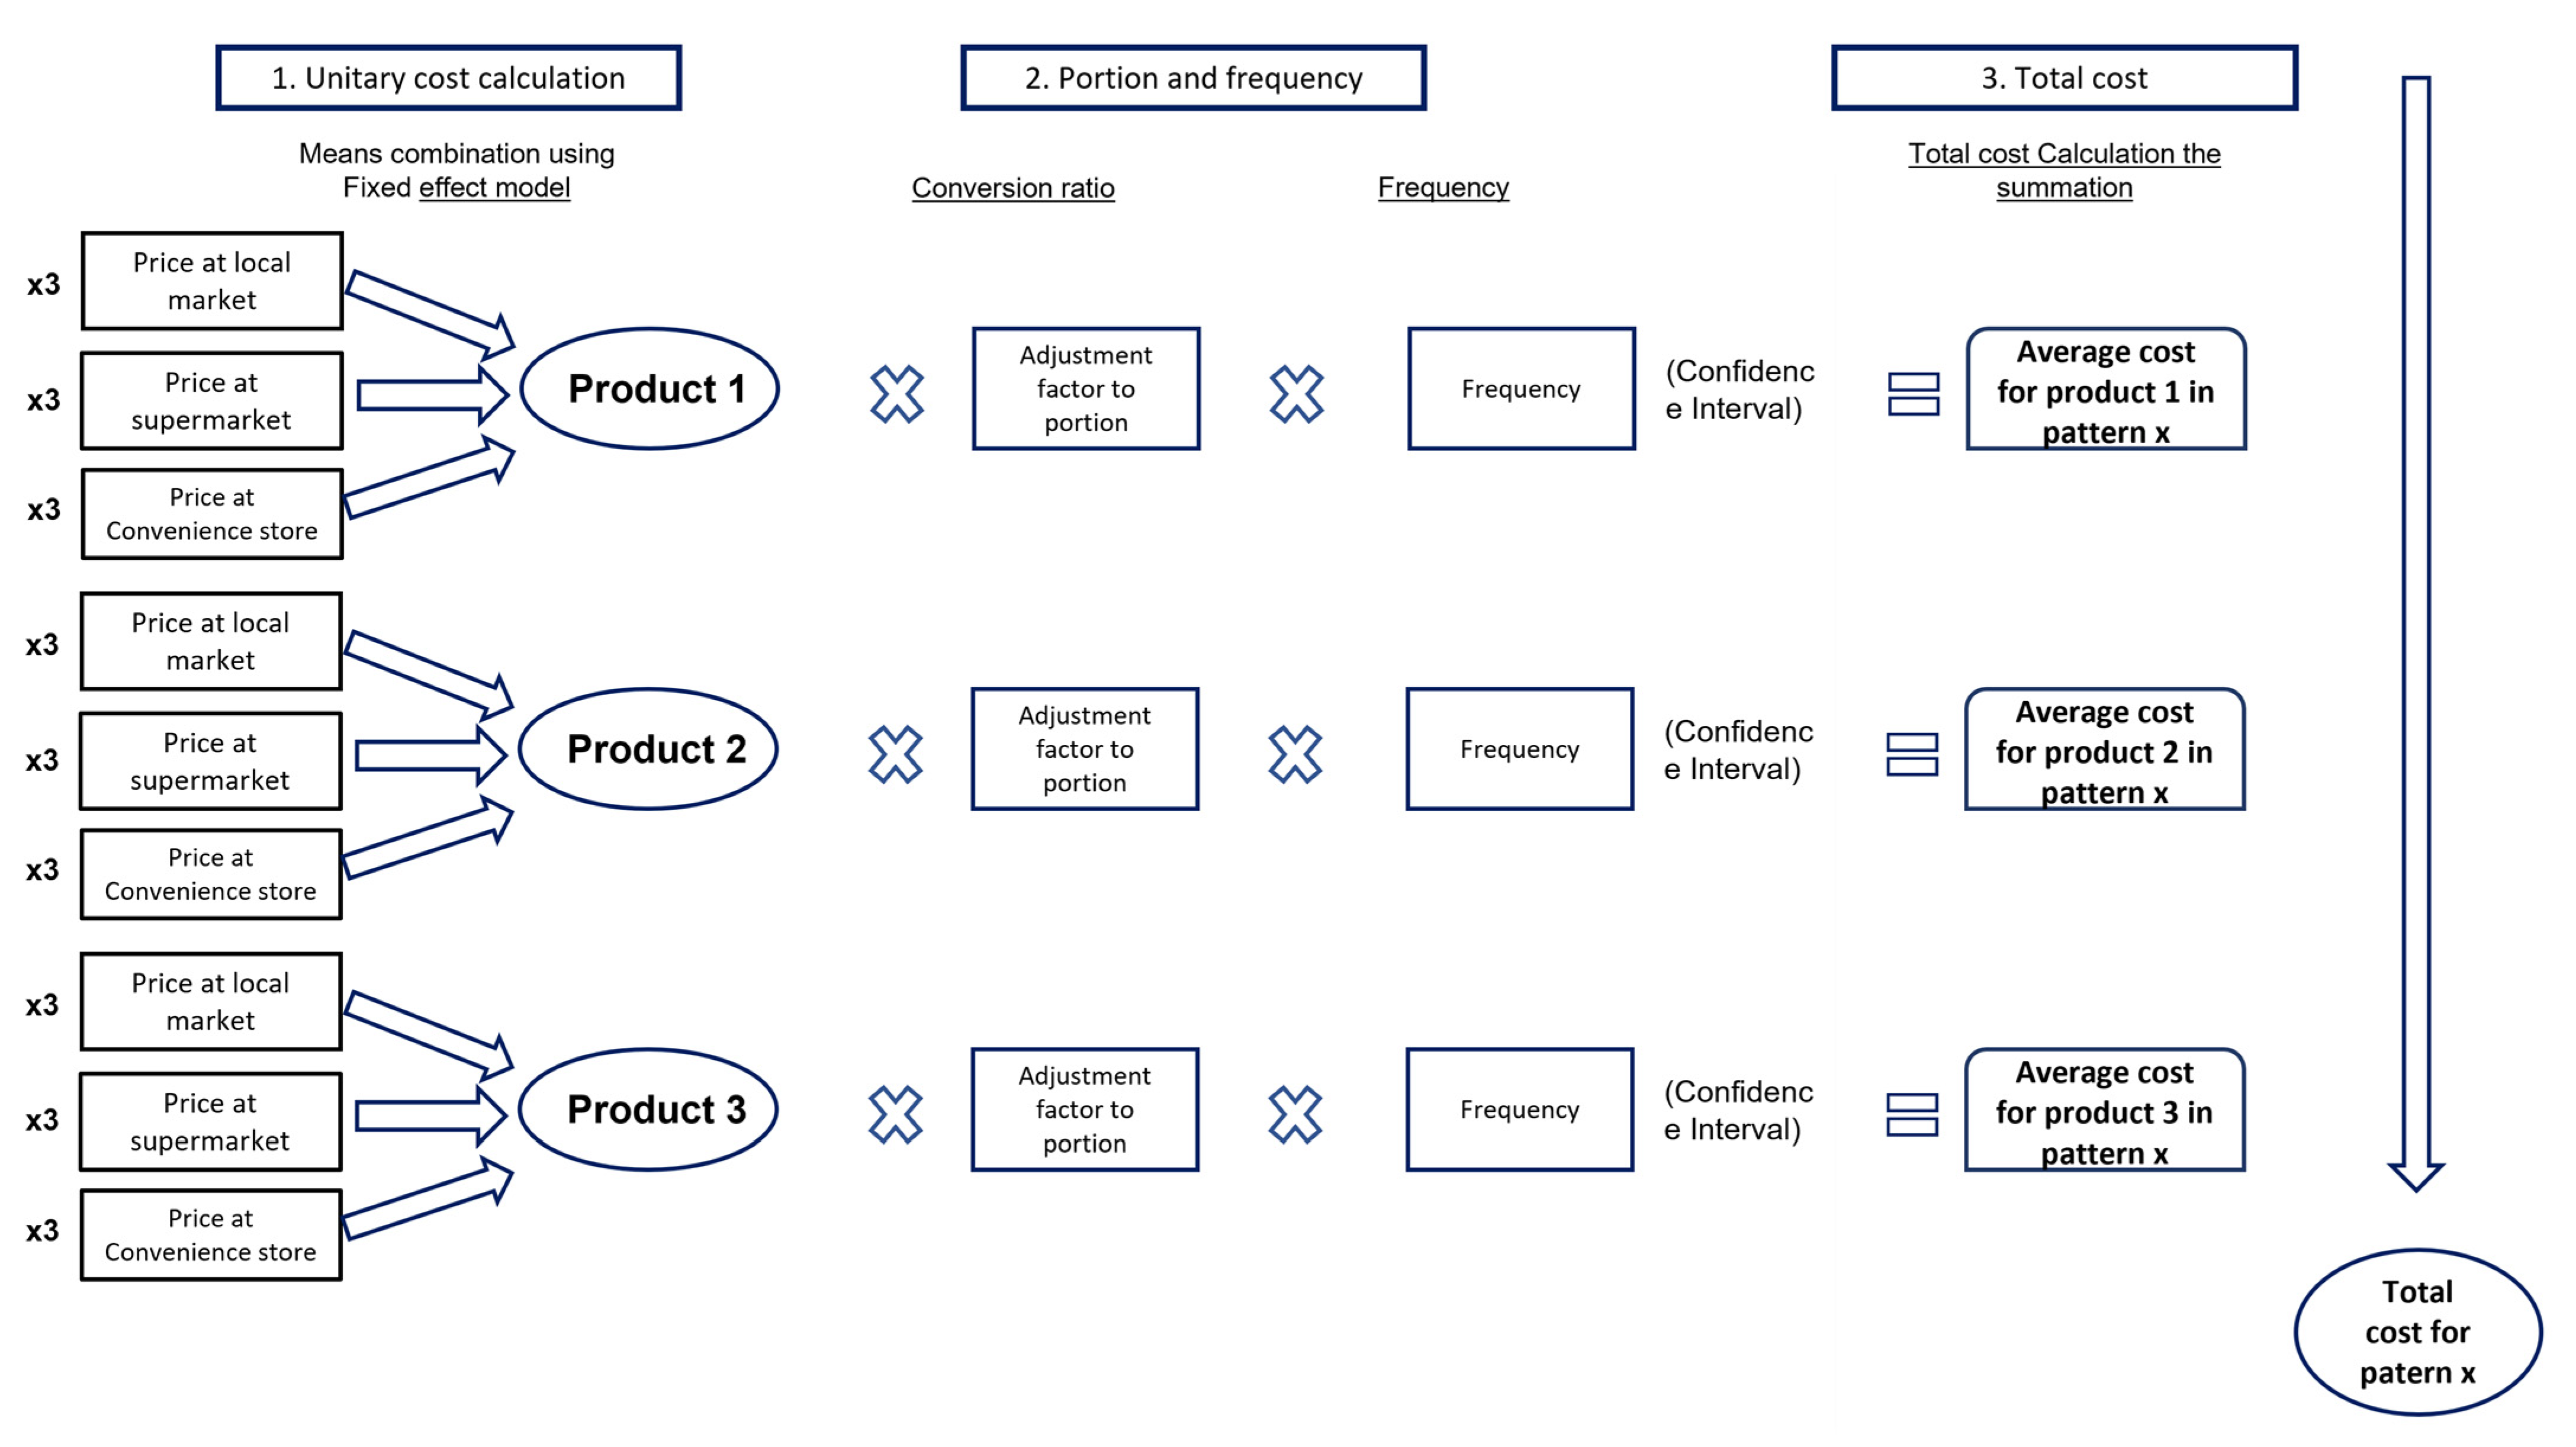
- Determination of unitary costs: The costs were obtained in triplicate (acquisition costs) of the 146 foods collected in the FFQ in 3 different food stores/markets (supermarket, market, and convenience store) to know the variability that can be attributed to different brands and presentations (leading brand and/or private or distributor brands), using a fixed effects model to estimate the residual error. It should be noted that for this economic analysis, all the prices were obtained using a standard unit of 1 Liter or 1 Kilogram (depending on the product); additionally, it was assumed that the foods’ preparation is an established capacity.
- 2.
- Cost of consumed portion: In accordance with the proposed methodology, the unitary costs per each food presentation were transformed into portions using the Mexican Equivalents System [48] using the conversion factors technique, as shown below:
- 3.
- Determination of the dietary patterns’ total cost: In this third phase, an arithmetic summation of the costs that can be attributed to each food was carried out to conform to the dietary pattern, as is mentioned in Figure 1. In addition, the confidence intervals with distribution Z are presented as shown in the following equation:
2.4. Statistical Analysis
3. Results
Costs of Diet
4. Discussion
5. Conclusions
Supplementary Materials
Author Contributions
Funding
Institutional Review Board Statement
Informed Consent Statement
Acknowledgments
Conflicts of Interest
References
- Lewis, M.; Lee, A. Costing ‘healthy’ food baskets in Australia—A systematic review of food price and affordability monitoring tools, protocols and methods. Public Health Nutr. 2016, 19, 2872–2886. [Google Scholar] [CrossRef] [PubMed]
- Cena, H.; Calder, P.C. Defining a Healthy Diet: Evidence for The Role of Contemporary Dietary Patterns in Health and Disease. Nutrients 2020, 12, 334. [Google Scholar] [CrossRef]
- Encuesta Nacional de Salud y Nutrición 2018. Available online: https://ensanut.insp.mx/encuestas/ensanut2018/index.php (accessed on 20 October 2021).
- Turnbull, B.; Gordon, S.F.; Martinez-Andrade, G.O.; Gonzalez-Unzaga, M. Childhood obesity in Mexico: A critical analysis of the environmental factors, behaviours and discourses contributing to the epidemic. Health Psychol. Open 2019, 6, 2055102919849406. [Google Scholar] [CrossRef] [PubMed]
- Cespedes, E.M.; Hu, F.B. Dietary patterns: From nutritional epidemiologic analysis to national guidelines. Am. J. Clin. Nutr. 2015, 101, 899–900. [Google Scholar] [CrossRef]
- Denova-Gutiérrez, E.; Clark, P.; Tucker, K.; Muñoz-Aguirre, P.; Salmerón, J. Dietary patterns are associated with bone mineral density in an urban Mexican adult population. Osteoporos. Int. 2016, 27, 3033–3040. [Google Scholar] [CrossRef] [PubMed]
- Afeiche, M.C.; Taillie, L.S.; Hopkins, S.; Eldridge, A.L.; Popkin, B.M. Breakfast dietary patterns among Mexican children are related to total-day diet quality. J. Nutr. 2017, 147, 404–412. [Google Scholar] [CrossRef]
- Moreno-Altamirano, L.; Capraro, S.; Panico, C.; Silberman, M.; Soto-Estrada, G. Estructura económica, distribución del ingreso, patrones de alimentación y las condiciones nutricionales en México. Econ. UNAM 2018, 15, 29–49. [Google Scholar] [CrossRef]
- Rao, M.; Afshin, A.; Singh, G.; Mozaffarian, D. Do healthier foods and diet patterns cost more than less healthy options? A systematic review and meta-analysis. BMJ Open 2013, 3, e004277. [Google Scholar] [CrossRef]
- Waterlander, W.E.; Mackay, S. Costing a healthy diet: Measurement and policy implications. Public Health Nutr. 2016, 19, 2867–2871. [Google Scholar] [CrossRef]
- Drewnowski, A. The Nutrient Rich Foods Index helps to identify healthy, affordable foods. Am. J. Clin. Nutr. 2010, 91, 1095S–1101S. [Google Scholar] [CrossRef] [PubMed]
- Maillot, M.; Darmon, N.; Darmon, M.; Lafay, L.; Drewnowski, A. Nutrient-dense food groups have high energy costs: An econometric approach to nutrient profiling. J. Nutr. 2007, 137, 1815–1820. [Google Scholar] [CrossRef] [PubMed]
- Drewnowski, A.; Darmon, N.; Briend, A. Replacing Fats and Sweets with Vegetables and Fruits—A Question of Cost. Am. J. Public Health 2004, 94, 1555–1559. [Google Scholar] [CrossRef]
- Darmon, N.; Briend, A.; Drewnowski, A. Energy-dense diets are associated with lower diet costs: A community study of French adults. Public Health Nutr. 2004, 7, 21–27. [Google Scholar] [CrossRef]
- Shamah-Levy, T.; Cuevas-Nasu, L.; Gaona-Pineda, E.B.; Gómez-Acosta, L.M.; del Carmen Morales-Ruán, M.; Hernández-Ávila, M.; Rivera-Dommarco, J.Á. Sobrepeso y obesidad en niños y adolescentes en México, actualización de la Encuesta Nacional de Salud y Nutrición de Medio Camino 2016. Salud Pública México 2018, 60, 244–253. [Google Scholar] [CrossRef] [PubMed]
- Garza-Montoya, B.G.; Ramos-Tovar, M.E. Cambios en los patrones de gasto en alimentos y bebidas de hogares mexicanos (1984–2014). Salud Pública México 2017, 59, 612–620. [Google Scholar] [CrossRef]
- Lozada, A.L.; Flores, M.; Rodríguez, S.; Barquera, S. Patrones dietarios en adolescentes mexicanas. Una comparación de dos métodos. Encuesta Nacional de Nutrición, 1999. Salud Pública México 2007, 49, 263–273. [Google Scholar] [CrossRef] [PubMed][Green Version]
- Schroder, H.; Serra-Majem, L.; Subirana, I.; Izquierdo-Pulido, M.; Fito, M.; Elosua, R. Association of increased monetary cost of dietary intake, diet quality and weight management in Spanish adults. Br. J Nutr. 2016, 115, 817–822. [Google Scholar] [CrossRef] [PubMed]
- Rehm, C.D.; Monsivais, P.; Drewnowski, A. The quality and monetary value of diets consumed by adults in the United States. Am. J. Clin. Nutr. 2011, 94, 1333–1339. [Google Scholar] [CrossRef]
- Jones, N.R.; Conklin, A.I.; Suhrcke, M.; Monsivais, P. The growing price gap between more and less healthy foods: Analysis of a novel longitudinal UK dataset. PLoS ONE 2014, 9, e109343. [Google Scholar] [CrossRef]
- Andrieu, E.; Darmon, N.; Drewnowski, A. Low-cost diets: More energy, fewer nutrients. Eur. J. Clin. Nutr. 2006, 60, 434–436. [Google Scholar] [CrossRef]
- Aggarwal, A.; Monsivais, P.; Drewnowski, A. Nutrient intakes linked to better health outcomes are associated with higher diet costs in the US. PLoS ONE 2012, 7, e37533. [Google Scholar] [CrossRef] [PubMed]
- Sluik, D.; Streppel, M.T.; van Lee, L.; Geelen, A.; Feskens, E.J. Evaluation of a nutrient-rich food index score in the Netherlands. J. Nutr. Sci. 2015, 4, e14. [Google Scholar] [CrossRef] [PubMed]
- Fulgoni, I.I.I.V.L.; Keast, D.R.; Drewnowski, A. Development and validation of the nutrient-rich foods index: A tool to measure nutritional quality of foods. J. Nutr. 2009, 139, 1549–1554. [Google Scholar] [CrossRef]
- Marty, L.; Dubois, C.; Gaubard, M.S.; Maidon, A.; Lesturgeon, A.; Gaigi, H.; Darmon, N. Higher nutritional quality at no additional cost among low-income households: Insights from food purchases of “positive deviants”. Am. J. Clin. Nutr. 2015, 102, 190–198. [Google Scholar] [CrossRef] [PubMed]
- Peltner, J.; Thiele, S. Association between the Healthy Eating Index-2010 and nutrient and energy densities of German households’ food purchases. Eur. J. Public Health 2017, 27, 547–552. [Google Scholar] [CrossRef]
- McAllister, M.; Baghurst, K.; Record, S. Financial costs of healthful eating: A comparison of three different approaches. J. Nutr. Educ. 1994, 26, 131–139. [Google Scholar] [CrossRef]
- Vega-Macedo, M.; Shamah-Levy, T.; Peinador-Roldán, R.; Méndez-Gómez Humarán, I.; Melgar-Quiñónez, H. Inseguridad alimentaria y variedad de la alimentación en hogares mexicanos con niños menores de cinco años. Salud Pública México 2014, 56, s21–s30. [Google Scholar] [CrossRef][Green Version]
- Arredondo, A.; Torres, C.; Orozco, E.; Pacheco, S.; Huang, F.; Zambrano, E.; Bolaños-Jiménez, F. Socio-economic indicators, dietary patterns, and physical activity as determinants of maternal obesity in middle-income countries: Evidences from a cohort study in Mexico. Int. J. Health Plan. Manag. 2019, 34, e713–e725. [Google Scholar] [CrossRef]
- Martinez, M.F.; Philippi, S.T.; Estima, C.; Leal, G. Validity and reproducibility of a food frequency questionnaire to assess food group intake in adolescents. Cadernos Saude Publica 2013, 29, 1795–1804. [Google Scholar] [CrossRef]
- Perez-Tepayo, S.; Rodriguez-Ramirez, S.; Unar-Munguia, M.; Shamah-Levy, T. Trends in the dietary patterns of Mexican adults by sociodemographic characteristics. Nutr. J. 2020, 19, 51. [Google Scholar] [CrossRef]
- Neri-Sanchez, M.; Martinez-Carrillo, B.E.; Valdes-Ramos, R.; Soto-Pina, A.E.; Vargas-Hernandez, J.A.; Benitez-Arciniega, A.D. Dietary patterns, central obesity and serum lipids concentration in Mexican adults. Nutr. Hosp. 2019, 36, 109–117. [Google Scholar] [CrossRef] [PubMed]
- Denova-Gutierrez, E.; Tucker, K.L.; Flores, M.; Barquera, S.; Salmeron, J. Dietary Patterns Are Associated with Predicted Cardiovascular Disease Risk in an Urban Mexican Adult Population. J. Nutr. 2016, 146, 90–97. [Google Scholar] [CrossRef] [PubMed]
- Denova-Gutierrez, E.; Hernandez-Ramirez, R.U.; Lopez-Carrillo, L. Dietary patterns and gastric cancer risk in Mexico. Nutr. Cancer 2014, 66, 369–376. [Google Scholar] [CrossRef]
- Denova-Gutiérrez, E.; Clark, P.; Muñoz-Aguirre, P.; Flores, M.; Talavera, J.O.; Chico-Barba, L.G.; Rivas, R.; Ramírez, P.; Salmerón, J. Dietary patterns are associated with calcium and vitamin D intake in an adult Mexican population. Nutr. Hosp. 2016, 33, 663–670. [Google Scholar] [CrossRef]
- Betancourt-Nunez, A.; Marquez-Sandoval, F.; Gonzalez-Zapata, L.I.; Babio, N.; Vizmanos, B. Unhealthy dietary patterns among healthcare professionals and students in Mexico. BMC Public Health 2018, 18, 1246. [Google Scholar] [CrossRef]
- Garcia-Chavez, C.G.; Rivera, J.A.; Monterrubio-Flores, E.; Rodriguez-Ramirez, S. Dietary patterns are associated with obesity in Mexican schoolchildren. Eur. J. Clin. Nutr. 2020, 74, 1201–1209. [Google Scholar] [CrossRef] [PubMed]
- Flores, M.E.; Rivera-Pasquel, M.; Macías, N.; Sánchez-Zamorano, L.M.; Rodríguez-Ramírez, S.; Contreras-Manzano, A.; Denova-Gutiérrez, E. Dietary patterns in Mexican preschool children are associated with stunting and overweight. Revista Saúde Pública 2021, 55, 53. [Google Scholar] [CrossRef]
- Encuesta Nacional de Salud y Nutrición 2012. Available online: https://ensanut.insp.mx/encuestas/ensanut2012/index.php (accessed on 20 October 2021).
- Mendoza, A.; Pérez, A.E.; Aggarwal, A.; Drewnowski, A. Energy density of foods and diets in Mexico and their monetary cost by socioeconomic strata: Analyses of ENSANUT data 2012. J. Epidemiol. Community Health 2017, 71, 713–721. [Google Scholar] [CrossRef]
- Batis, C.; Gatica-Domínguez, G.; Marrón-Ponce, J.A.; Colchero, M.A.; Rivera, J.A.; Barquera, S.; Stern, D. Price Trends of Healthy and Less Healthy Foods and Beverages in Mexico from 2011–2018. J Acad. Nutr. Diet. 2021, in press. [Google Scholar] [CrossRef]
- Dietary Guidelines for Americans, 2020–2025. 2020. Available online: https://dietaryguidelines.gov (accessed on 20 October 2021).
- Corrêa, R.D.S.; Vencato, P.H.; Rockett, F.C.; Bosa, V.L. Padrões alimentares de escolares: Existem diferenças entre crianças e adolescentes? Ciência Saúde Coletiva 2017, 22, 553–562. [Google Scholar] [CrossRef]
- Lopez-Gonzalez, D.; Partida-Gaytán, A.; Wells, J.C.; Reyes-Delpech, P.; Avila-Rosano, F.; Ortiz-Obregon, M.; Gomez-Mendoza, F.; Diaz-Escobar, L.; Clark, P. Obesogenic Lifestyle and Its Influence on Adiposity in Children and Adolescents, Evidence from Mexico. Nutrients 2020, 12, 819. [Google Scholar] [CrossRef] [PubMed]
- Hernández-Avila, M.; Romieu, I.; Parra, S.; Hernández-Avila, J.; Madrigal, H.; Willett, W. Validity and reproducibility of a food frequency questionnaire to assess dietary intake of women living in Mexico City. Salud Publica Mexico 1998, 40, 133–140. [Google Scholar] [CrossRef] [PubMed]
- Association, W.M. World Medical Association Declaration of Helsinki: Ethical principles for medical research involving human subjects. JAMA 2013, 310, 2191–2194. [Google Scholar]
- Denova-Gutierrez, E.; Tucker, K.L.; Salmeron, J.; Flores, M.; Barquera, S. Relative validity of a food frequency questionnaire to identify dietary patterns in an adult Mexican population. Salud Pública México 2016, 58, 608–616. [Google Scholar] [CrossRef] [PubMed]
- Pérez-Lizaur, A.B.; Palacios González, B.; Castro Becerra, A.L.; Flores Galicia, I. Sistema Mexicano de Alimentos Equivalentes; Fomento de Nutricion y Salud AC, Ogali: Mexico City, Mexico, 2014. [Google Scholar]
- CONASAMI. Comisión Nacional de Los Salarios Mínimos; Gobierno de Mexico: Mexico City. Available online: https://www.gob.mx/conasami (accessed on 6 July 2021).
- Drewnowski, A.; Maillot, M.; Darmon, N. Should nutrient profiles be based on 100 g, 100 kcal or serving size? Eur. J. Clin. Nutr. 2009, 63, 898–904. [Google Scholar] [CrossRef]
- Darmon, N.; Drewnowski, A. Contribution of food prices and diet cost to socioeconomic disparities in diet quality and health: A systematic review and analysis. Nutr. Rev. 2015, 73, 643–660. [Google Scholar] [CrossRef]
- Drewnowski, A. Nutrition economics: How to eat better for less. J. Nutr. Sci. Vitaminol. 2015, 61, S69–S71. [Google Scholar] [CrossRef] [PubMed]
- Colchero, M.A.; Guerrero-López, C.M.; Molina, M.; Unar-Munguía, M. Affordability of Food and Beverages in Mexico between 1994 and 2016. Nutrients 2019, 11, 78. [Google Scholar] [CrossRef]
- Morris, M.A.; Hulme, C.; Clarke, G.P.; Edwards, K.L.; Cade, J.E. What is the cost of a healthy diet? Using diet data from the UK Women’s Cohort Study. J. Epidemiol. Community Health 2014, 68, 1043–1049. [Google Scholar] [CrossRef]
- Bukambu, E.; Lieffers, J.R.; Ekwaru, J.P.; Veugelers, P.J.; Ohinmaa, A. The association between the cost and quality of diets of children in Canada. Can. J. Public Health 2020, 111, 269–277. [Google Scholar] [CrossRef]
- Nutritools Website. 2018. Available online: https://www.nutritools.org/ (accessed on 19 October 2021).
- Norma Oficial Mexicana NOM-043-SSA2-2012, Servicios Básicos de Salud. Promoción y Educación para la Salud en Materia Alimentaria. Criterios para Brindar Orientación 2013. Available online: https://www.cndh.org.mx/DocTR/2016/JUR/A70/01/JUR-20170331-NOR37.pdf (accessed on 19 October 2021).
- Rockett, H.R.; Wolf, A.M.; Colditz, G.A. Development and reproducibility of a food frequency questionnaire to assess diets of older children and adolescents. J. Am. Diet. Assoc. 1995, 95, 336–340. [Google Scholar] [CrossRef]
- Davis, G.C.; Carlson, A. The inverse relationship between food price and energy density: Is it spurious? Public Health Nutr. 2015, 18, 1091–1097. [Google Scholar] [CrossRef]
- Rivera, J.A.; Pedraza, L.S.; Aburto, T.C.; Batis, C.; Sánchez-Pimienta, T.G.; González de Cosío, T.; López-Olmedo, N.; Pedroza-Tobías, A. Overview of the Dietary Intakes of the Mexican Population: Results from the National Health and Nutrition Survey 2012. J. Nutr. 2016, 146, 1851S–1855S. [Google Scholar] [CrossRef] [PubMed]
- Ortiz-Hernandez, L. Price evolution of foods and nutriments in Mexico from 1973 to 2004. Arch. Latinoam. Nutr. 2006, 56, 201–215. [Google Scholar] [PubMed]
- Batis, C.; Marrón-Ponce, J.A.; Stern, D.; Vandevijvere, S.; Barquera, S.; Rivera, J.A. Adoption of healthy and sustainable diets in Mexico does not imply higher expenditure on food. Nat. Food 2021, 2, 792–801. [Google Scholar] [CrossRef]
- McKeown, A.; Nelson, R. Independent decision making of adolescents regarding food choice. Int. J. Consum. Stud. 2018, 42, 469–477. [Google Scholar] [CrossRef]
- Batis, C.; Rivera, J.A.; Popkin, B.M.; Taillie, L.S. First-Year Evaluation of Mexico’s Tax on Nonessential Energy-Dense Foods: An Observational Study. PLoS Med. 2016, 13, e1002057. [Google Scholar] [CrossRef]
- Agnoli, C.; Pounis, G.; Krogh, V. Dietary Pattern Analysis. Analysis in Nutrition Research; Elsevier: Amsterdam, The Netherlands, 2019; pp. 75–101. [Google Scholar]
- Jansen, P.W.; Roza, S.J.; Jaddoe, V.W.; Mackenbach, J.D.; Raat, H.; Hofman, A.; Verhulst, F.C.; Tiemeier, H. Children’s eating behavior, feeding practices of parents and weight problems in early childhood: Results from the population-based Generation R Study. Int. J. Behav. Nutr. Phys. Act. 2012, 9, 130. [Google Scholar] [CrossRef]


| Boys n = 635 | Girls n = 600 | Total n = 1235 | |
|---|---|---|---|
| Age (years) | 13.3 (1.4) | 12.7 (1.3) | 13.0 (1.3) |
| Anthropometry | |||
| Weight (Kg) | 56.8 (17.6) | 53.5 (13.1) | 55.0 (14.6) |
| Size (cm) | 161.5 (12.9) | 155.7 (7.8) | 158.4 (10.9) |
| BMI 1 (kg/m2) | 21.4 (4.3) | 21.9 (4.3) | 21.7 (4.3) |
| BMI > p 85 (%) | 31.6 | 31.9 | 31.8 |
| Waist circumference 2 (cm) | 75.2 (13.3) | 76.8 (12.2) | 76.0 (12.7) |
| CC > p 75 (%) | 13.1 | 44.3 | 30.1 |
| Body fat percentage | 24.7 (10.9) | 36.4 (8.8) | 31.1 (11.4) |
| Sexual maturity (%) | |||
| Tanner 1 and 2 | 34.7 | 16.1 | 24.5 |
| Tanner 3 and 4 | 58.7 | 70.2 | 64.9 |
| Tanner 5 | 6.6 | 13.7 | 10.5 |
| Diet | |||
| Total calories (kcal/day) † | 2770 (1254) | 2318 (1086) | 2525 (1186) |
| Product | Measurement Unit 2 | Unit Cost (MXN 1) | Conversion of Purchase Unit to Ration | Conversion to the Mexican Equivalents System |
|---|---|---|---|---|
| Whole milk | 1 L | $20.05 | 240 ml | 0.24 |
| Banana | 1 Kg | $20.00 | 80 gr | 0.08 |
| Pastries | 1 Kg | $55.00 | 17 gr | 0.017 |
| Corn tortilla | 1 Kg | $15.00 | 30gr | 0.30 |
| Soft Drinks | 1 L | $13.00 | 89ml | 0.089 |
| Plain water | 1L | $12.00 | 240ml | 0.24 |
| Egg | 1 Kg | $36.70 | 50 gr | 0.05 |
| Pork meat | 1 Kg | $80.00 | 40 gr | 0.04 |
| Fritters | 1 Kg | $115.00 | 19 gr | 0.019 |
| Lettuce | 1 Kg | $42.50 | 141 gr | 0.141 |
| Healthy Pattern | Transition Pattern | Non-Healthy Pattern | ||||
|---|---|---|---|---|---|---|
| Food | Mean | DE | Mean | DE | Mean | DE |
| Corn and derivatives | 3.2 | 2.5 | 4.8 | 2.9 | 2.9 | 2.5 |
| Mexican fried food | 3.0 | 2.0 | 4.6 | 4.1 | 4.4 | 4.0 |
| Wheat and derivatives | 4.0 | 2.8 | 5.0 | 3.9 | 4.5 | 3.1 |
| Pastries | 4.2 | 3.1 | 5.9 | 4.9 | 3.9 | 2.9 |
| High fiber cereals | 1.1 | 1.1 | 0.9 | 1.2 | 1.2 | 1.3 |
| Low fiber cereals | 1.1 | 1.4 | 1.5 | 1.6 | 1.2 | 1.3 |
| Tuberous root | 1.1 | 0.9 | 1.2 | 1.1 | 1.0 | 1.0 |
| Rice and pasta | 6.1 | 4.1 | 7.5 | 4.8 | 5.9 | 3.7 |
| Alcohol | 0.2 | 0.6 | 0.3 | 0.8 | 0.3 | 0.8 |
| Legumes | 3.7 | 2.7 | 2.8 | 2.0 | 2.9 | 2.7 |
| Fresh fruits | 14.4 | 6.4 | 9.0 | 4.9 | 9.4 | 4.8 |
| Fresh vegetables | 3.0 | 1.9 | 2.3 | 1.8 | 2.0 | 1.6 |
| Industrialized juice | 1.3 | 1.1 | 1.4 | 1.0 | 0.9 | 0.8 |
| Chicken | 3.6 | 2.4 | 3.3 | 1.9 | 4.4 | 3.0 |
| Red meat | 5.4 | 2.8 | 5.2 | 2.5 | 7.2 | 3.8 |
| Processed meat | 3.3 | 1.6 | 3.9 | 2.5 | 5.2 | 2.8 |
| Fish and seafood | 2.6 | 1.7 | 1.8 | 1.3 | 2.8 | 1.9 |
| Milk | 8.0 | 5.2 | 5.9 | 4.7 | 7.0 | 4.9 |
| Dairy products | 10.0 | 5.3 | 7.6 | 3.6 | 11.4 | 6.1 |
| Egg | 0.9 | 0.6 | 0.8 | 0.8 | 1.3 | 1.2 |
| Oil seeds and oleaginous fruits | 1.9 | 2.1 | 1.1 | 1.4 | 1.2 | 1.4 |
| Fats | 2.9 | 1.7 | 3.4 | 2.2 | 4.1 | 2.5 |
| Candy | 5.1 | 3.2 | 5.4 | 3.7 | 4.2 | 2.4 |
| Sugar sweetened beverages | 4.7 | 4.0 | 5.1 | 4.2 | 4.2 | 3.7 |
| Soft Drinks | 1.0 | 1.4 | 3.3 | 4.5 | 2.1 | 3.6 |
| Fried foods | 0.9 | 0.8 | 1.6 | 1.5 | 1.0 | 0.9 |
| Other beverages | 3.3 | 2.7 | 4.3 | 3.5 | 3.1 | 2.3 |
| Purified water | 0.1 | 0.1 | 0.1 | 0.1 | 0.1 | 0.1 |
| Energy drinks | 0.2 | 0.1 | 0.3 | 0.3 | 0.3 | 0.3 |
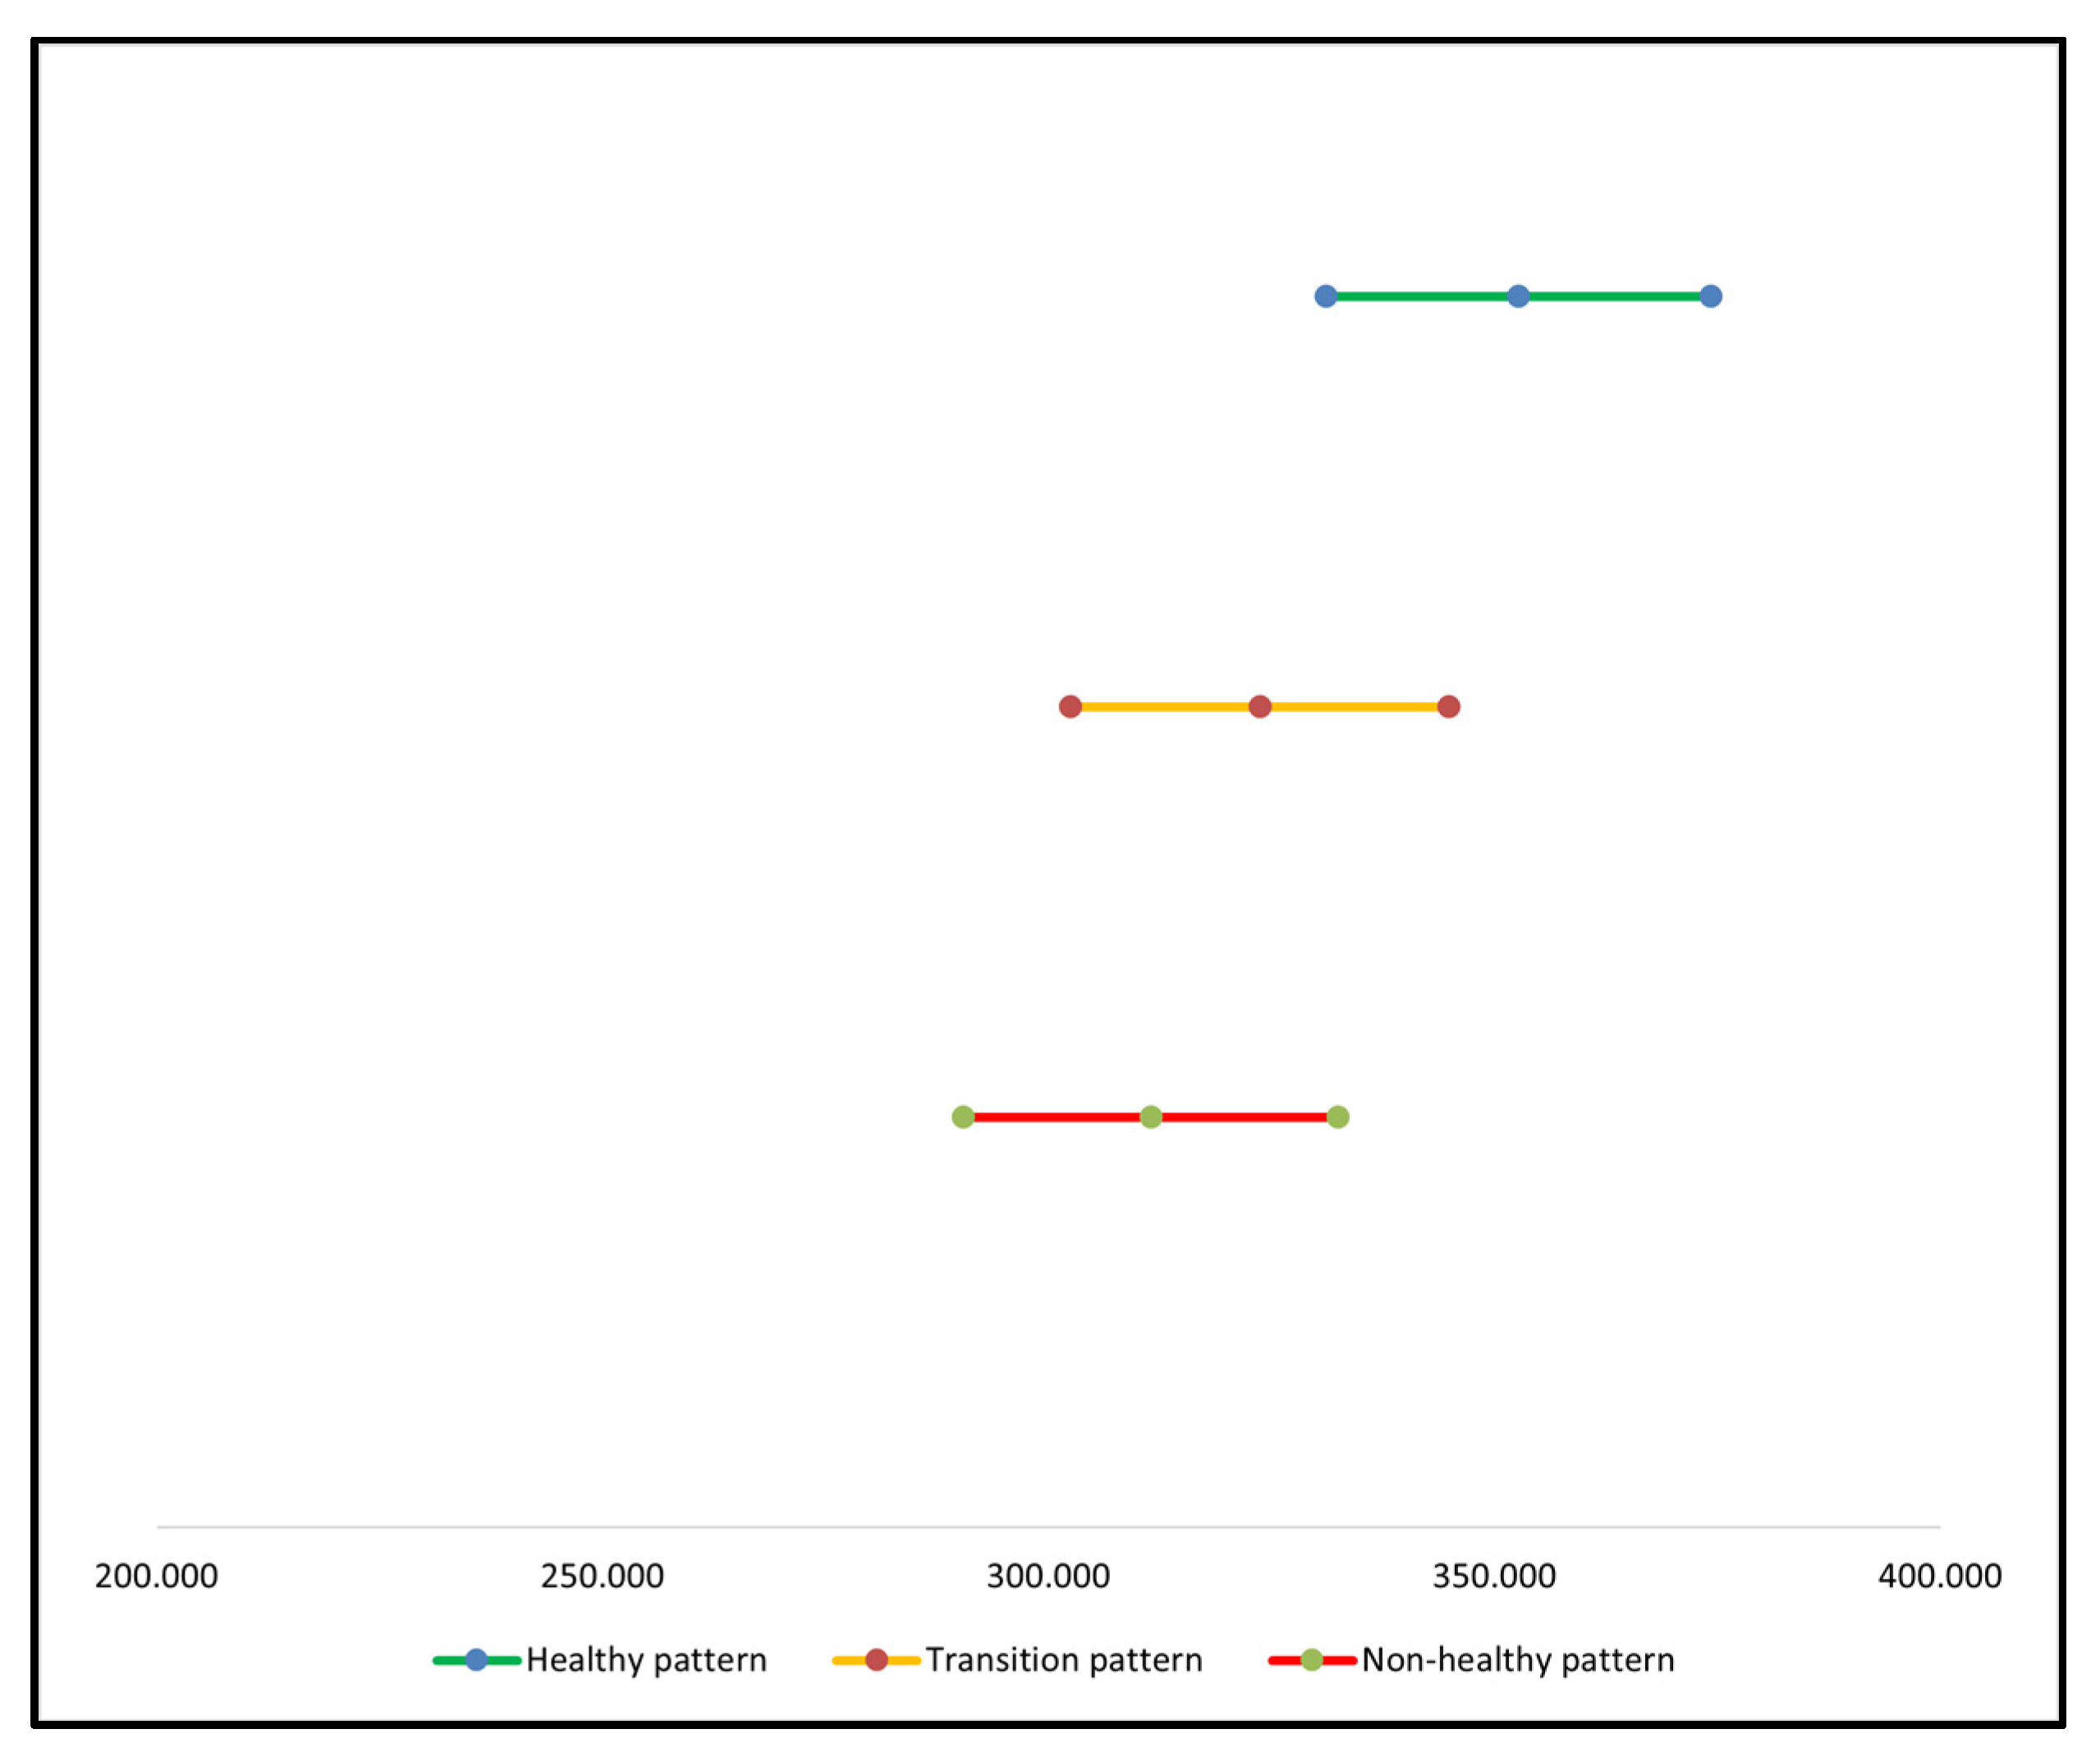
| Pattern | Average Cost (MXN 1) | Lower Limit (MXN 1) | Higher Limit (MXN 1) | Average Cost (USD 2) | Kcal Energy |
|---|---|---|---|---|---|
| Healthy pattern | 352.69 | 331.10 | 374.27 | 16.41 | 2755.8 |
| Transition pattern | 323.65 | 302.46 | 344.85 | 15.06 | 2804.6 |
| Non-healthy pattern | 311.43 | 290.45 | 332.42 | 14.49 | 2813.7 |
Publisher’s Note: MDPI stays neutral with regard to jurisdictional claims in published maps and institutional affiliations. |
© 2021 by the authors. Licensee MDPI, Basel, Switzerland. This article is an open access article distributed under the terms and conditions of the Creative Commons Attribution (CC BY) license (https://creativecommons.org/licenses/by/4.0/).
Share and Cite
Clark, P.; Mendoza-Gutiérrez, C.F.; Montiel-Ojeda, D.; Denova-Gutiérrez, E.; López-González, D.; Moreno-Altamirano, L.; Reyes, A. A Healthy Diet Is Not More Expensive than Less Healthy Options: Cost-Analysis of Different Dietary Patterns in Mexican Children and Adolescents. Nutrients 2021, 13, 3871. https://doi.org/10.3390/nu13113871
Clark P, Mendoza-Gutiérrez CF, Montiel-Ojeda D, Denova-Gutiérrez E, López-González D, Moreno-Altamirano L, Reyes A. A Healthy Diet Is Not More Expensive than Less Healthy Options: Cost-Analysis of Different Dietary Patterns in Mexican Children and Adolescents. Nutrients. 2021; 13(11):3871. https://doi.org/10.3390/nu13113871
Chicago/Turabian StyleClark, Patricia, Carlos F. Mendoza-Gutiérrez, Diana Montiel-Ojeda, Edgar Denova-Gutiérrez, Desirée López-González, Laura Moreno-Altamirano, and Alfonso Reyes. 2021. "A Healthy Diet Is Not More Expensive than Less Healthy Options: Cost-Analysis of Different Dietary Patterns in Mexican Children and Adolescents" Nutrients 13, no. 11: 3871. https://doi.org/10.3390/nu13113871
APA StyleClark, P., Mendoza-Gutiérrez, C. F., Montiel-Ojeda, D., Denova-Gutiérrez, E., López-González, D., Moreno-Altamirano, L., & Reyes, A. (2021). A Healthy Diet Is Not More Expensive than Less Healthy Options: Cost-Analysis of Different Dietary Patterns in Mexican Children and Adolescents. Nutrients, 13(11), 3871. https://doi.org/10.3390/nu13113871