
Dietary Diversity and Undernutrition in Children Aged 6–23 Months in Sub-Saharan Africa

 , , , , , ,
  , and
, and 
Abstract
:1. Introduction
2. Materials and Methods
2.1. Data Source and Study Design
2.2. Study Variables
2.2.1. Outcome Variables
2.2.2. Explanatory Variables
2.3. Data Preparation and Statistical Analyses
3. Results
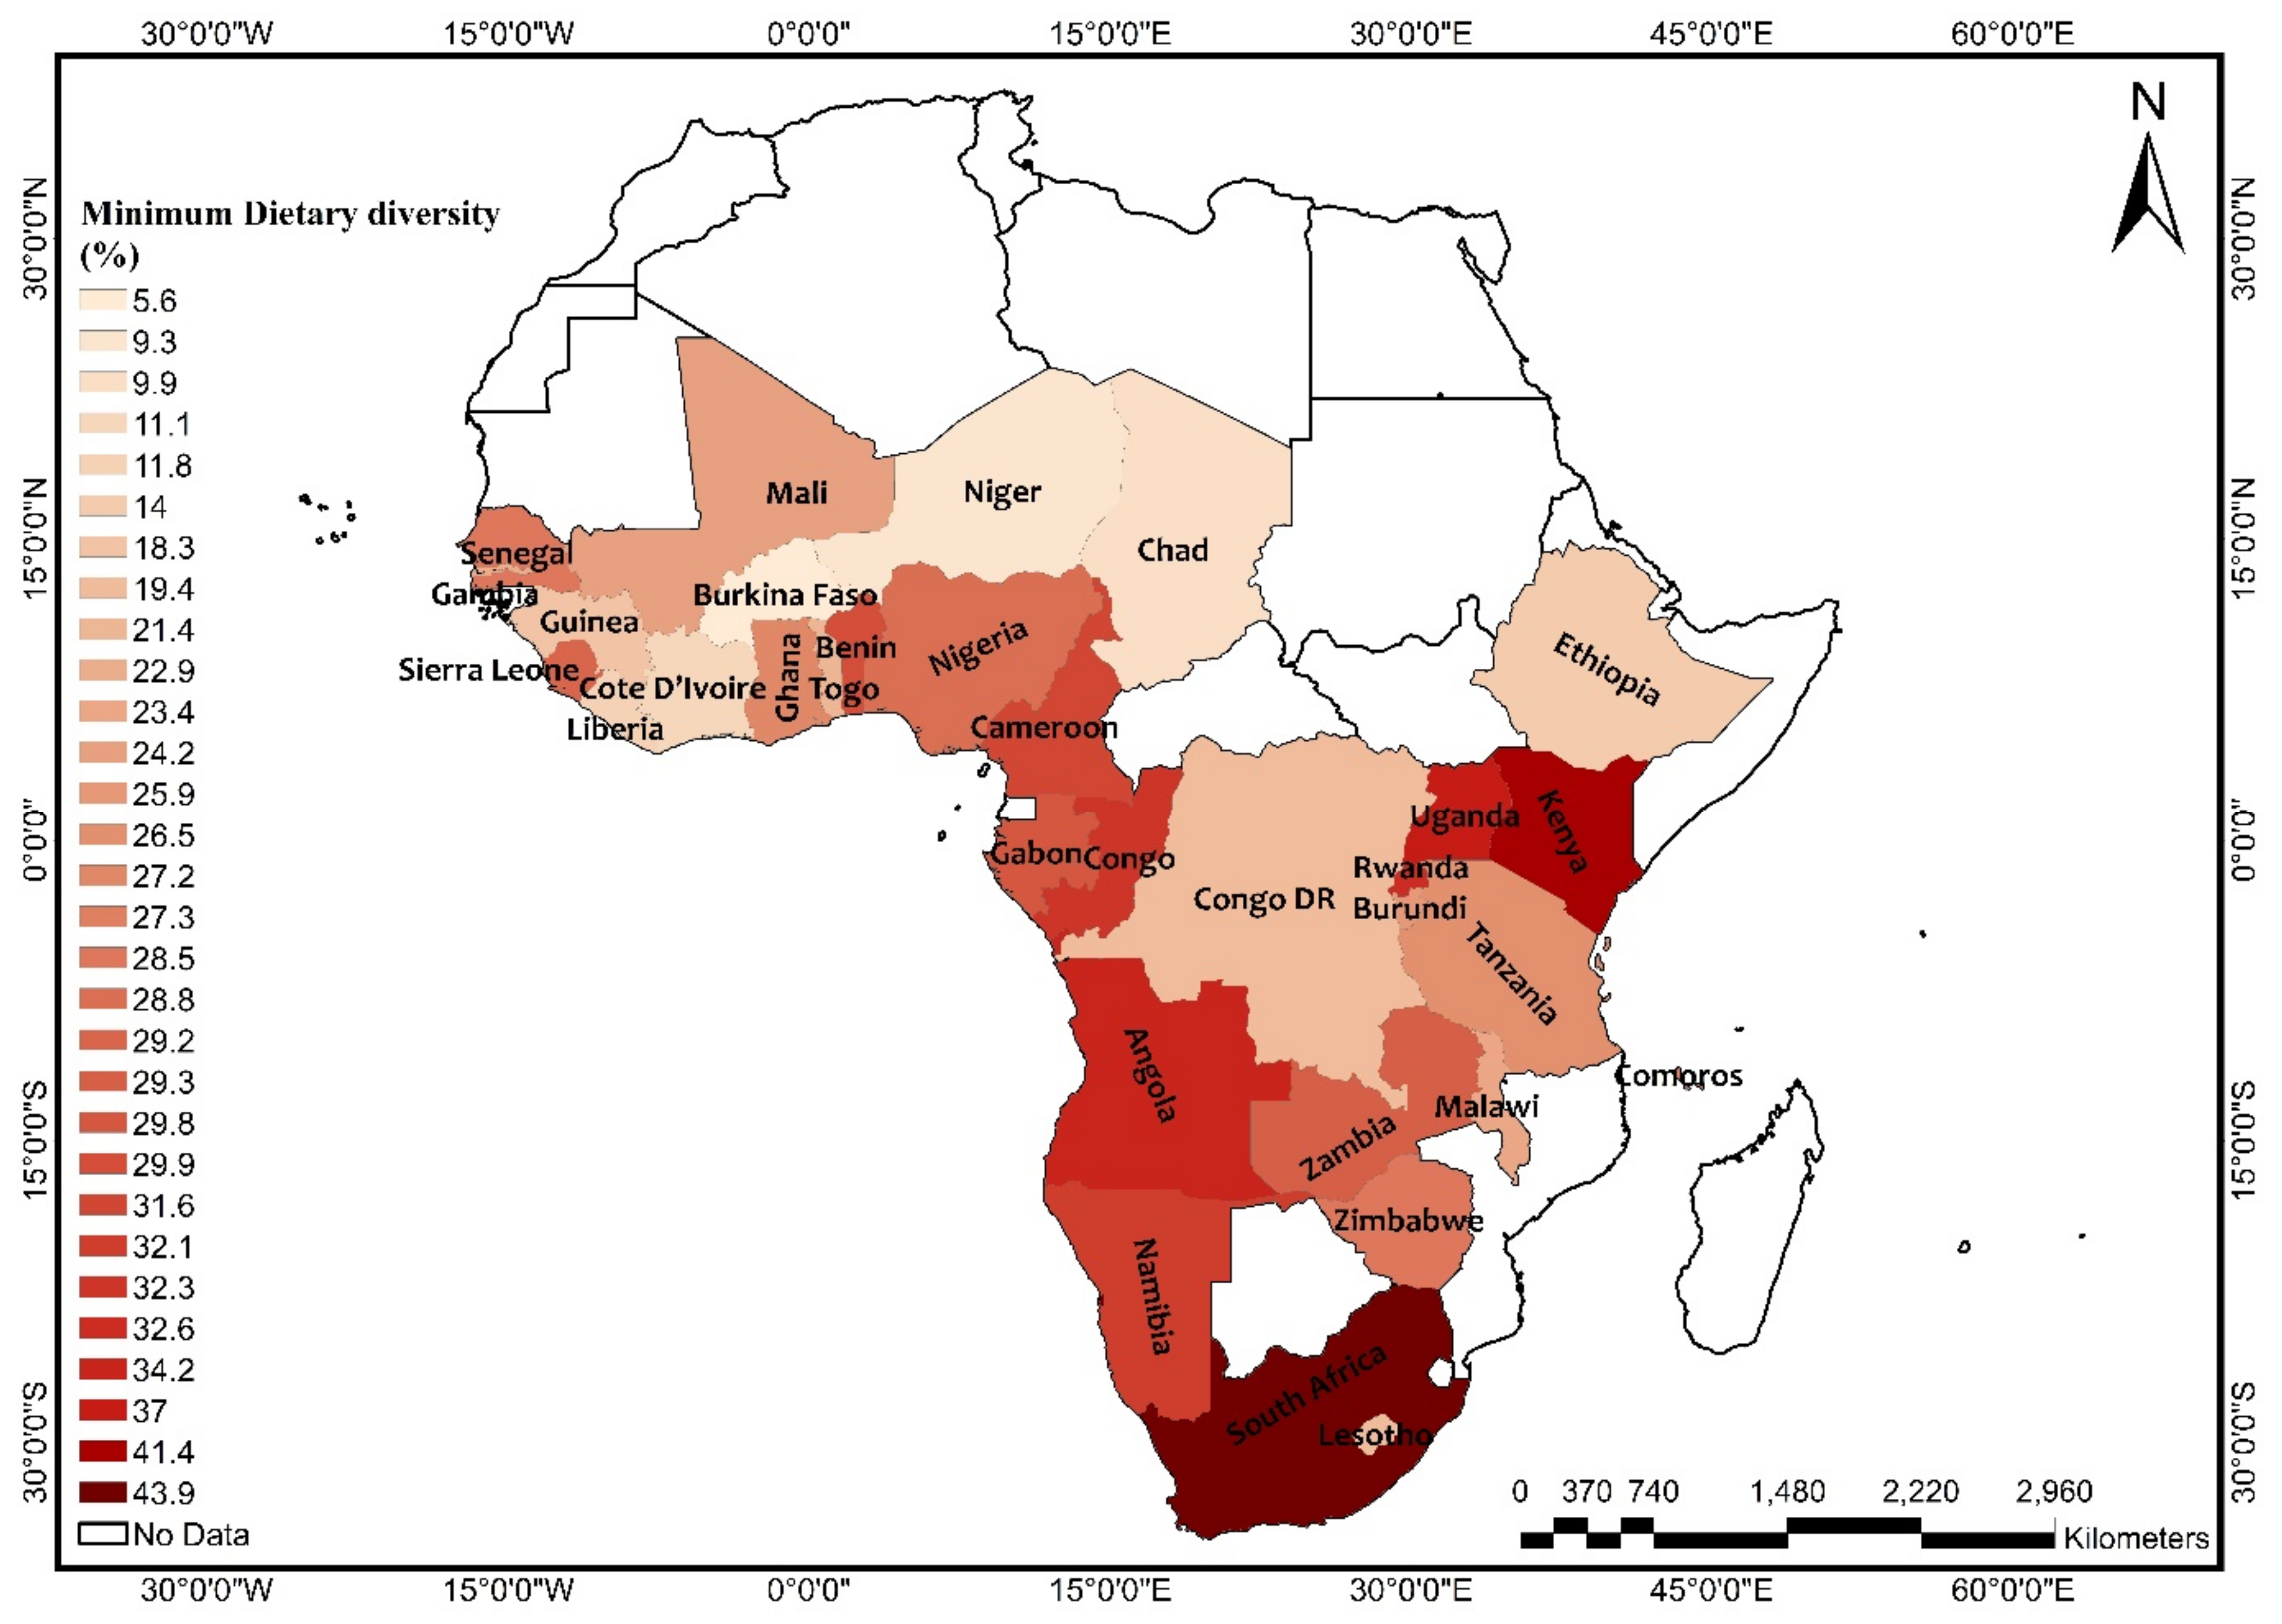
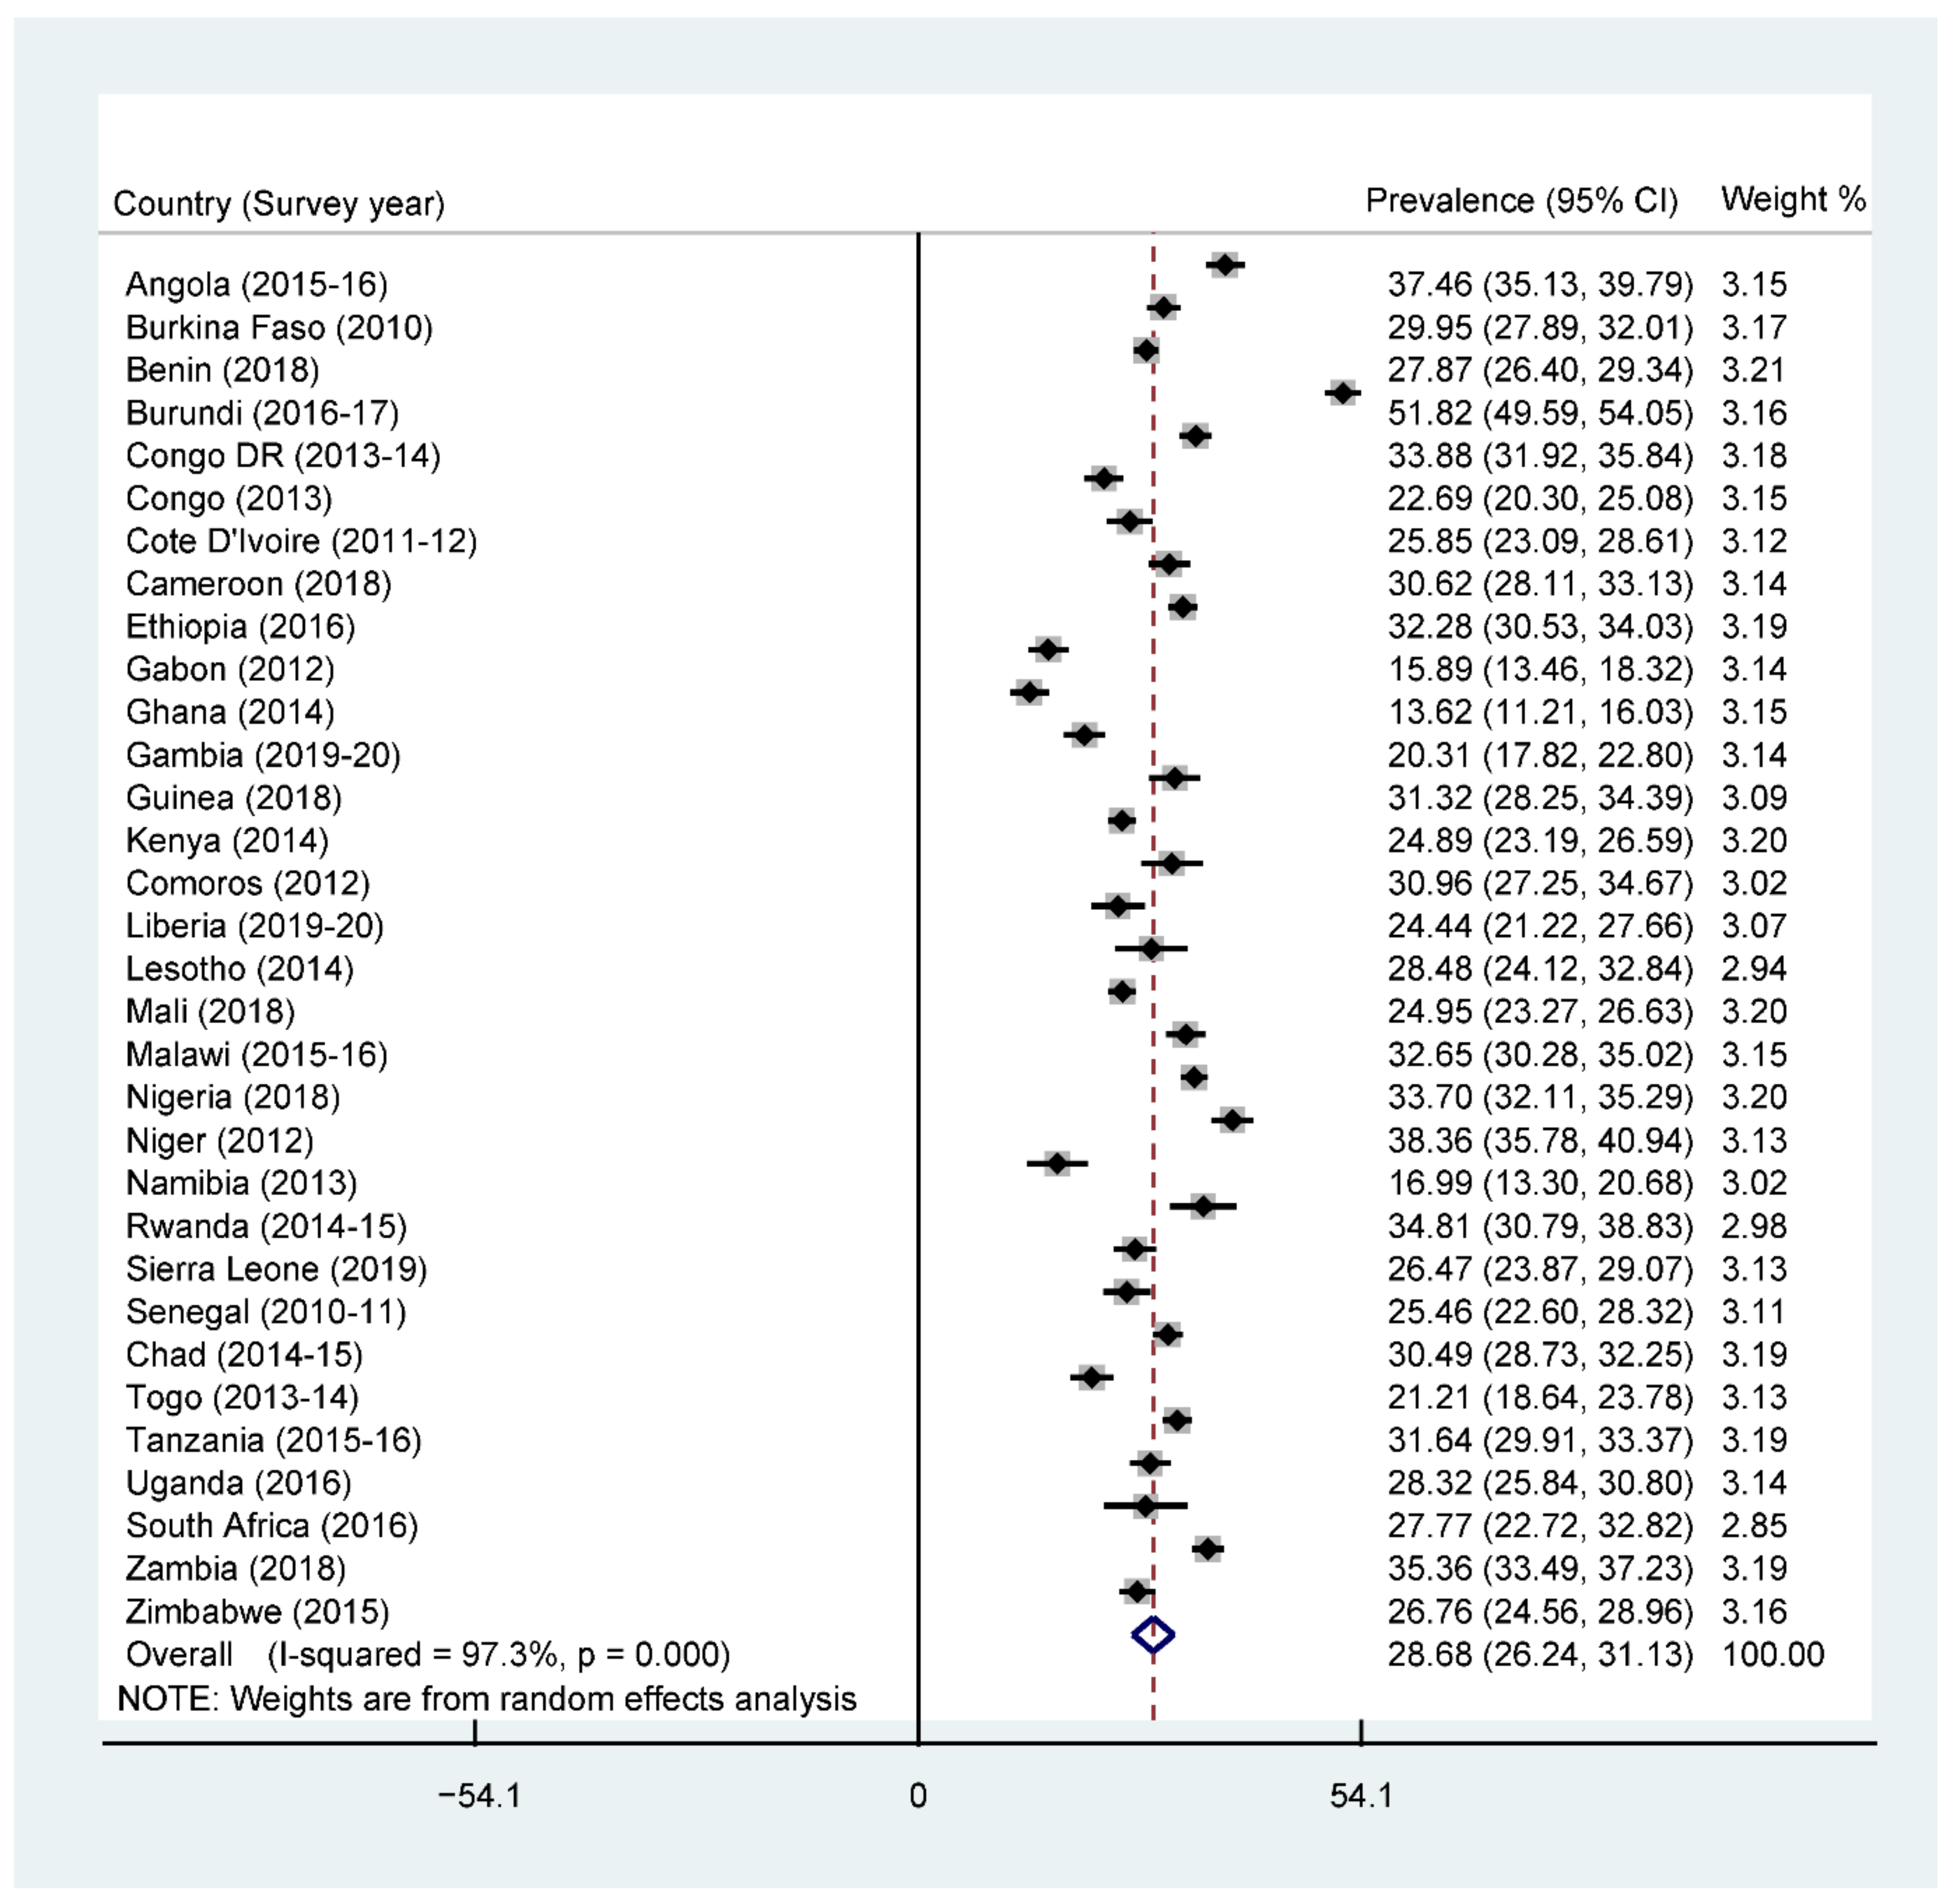
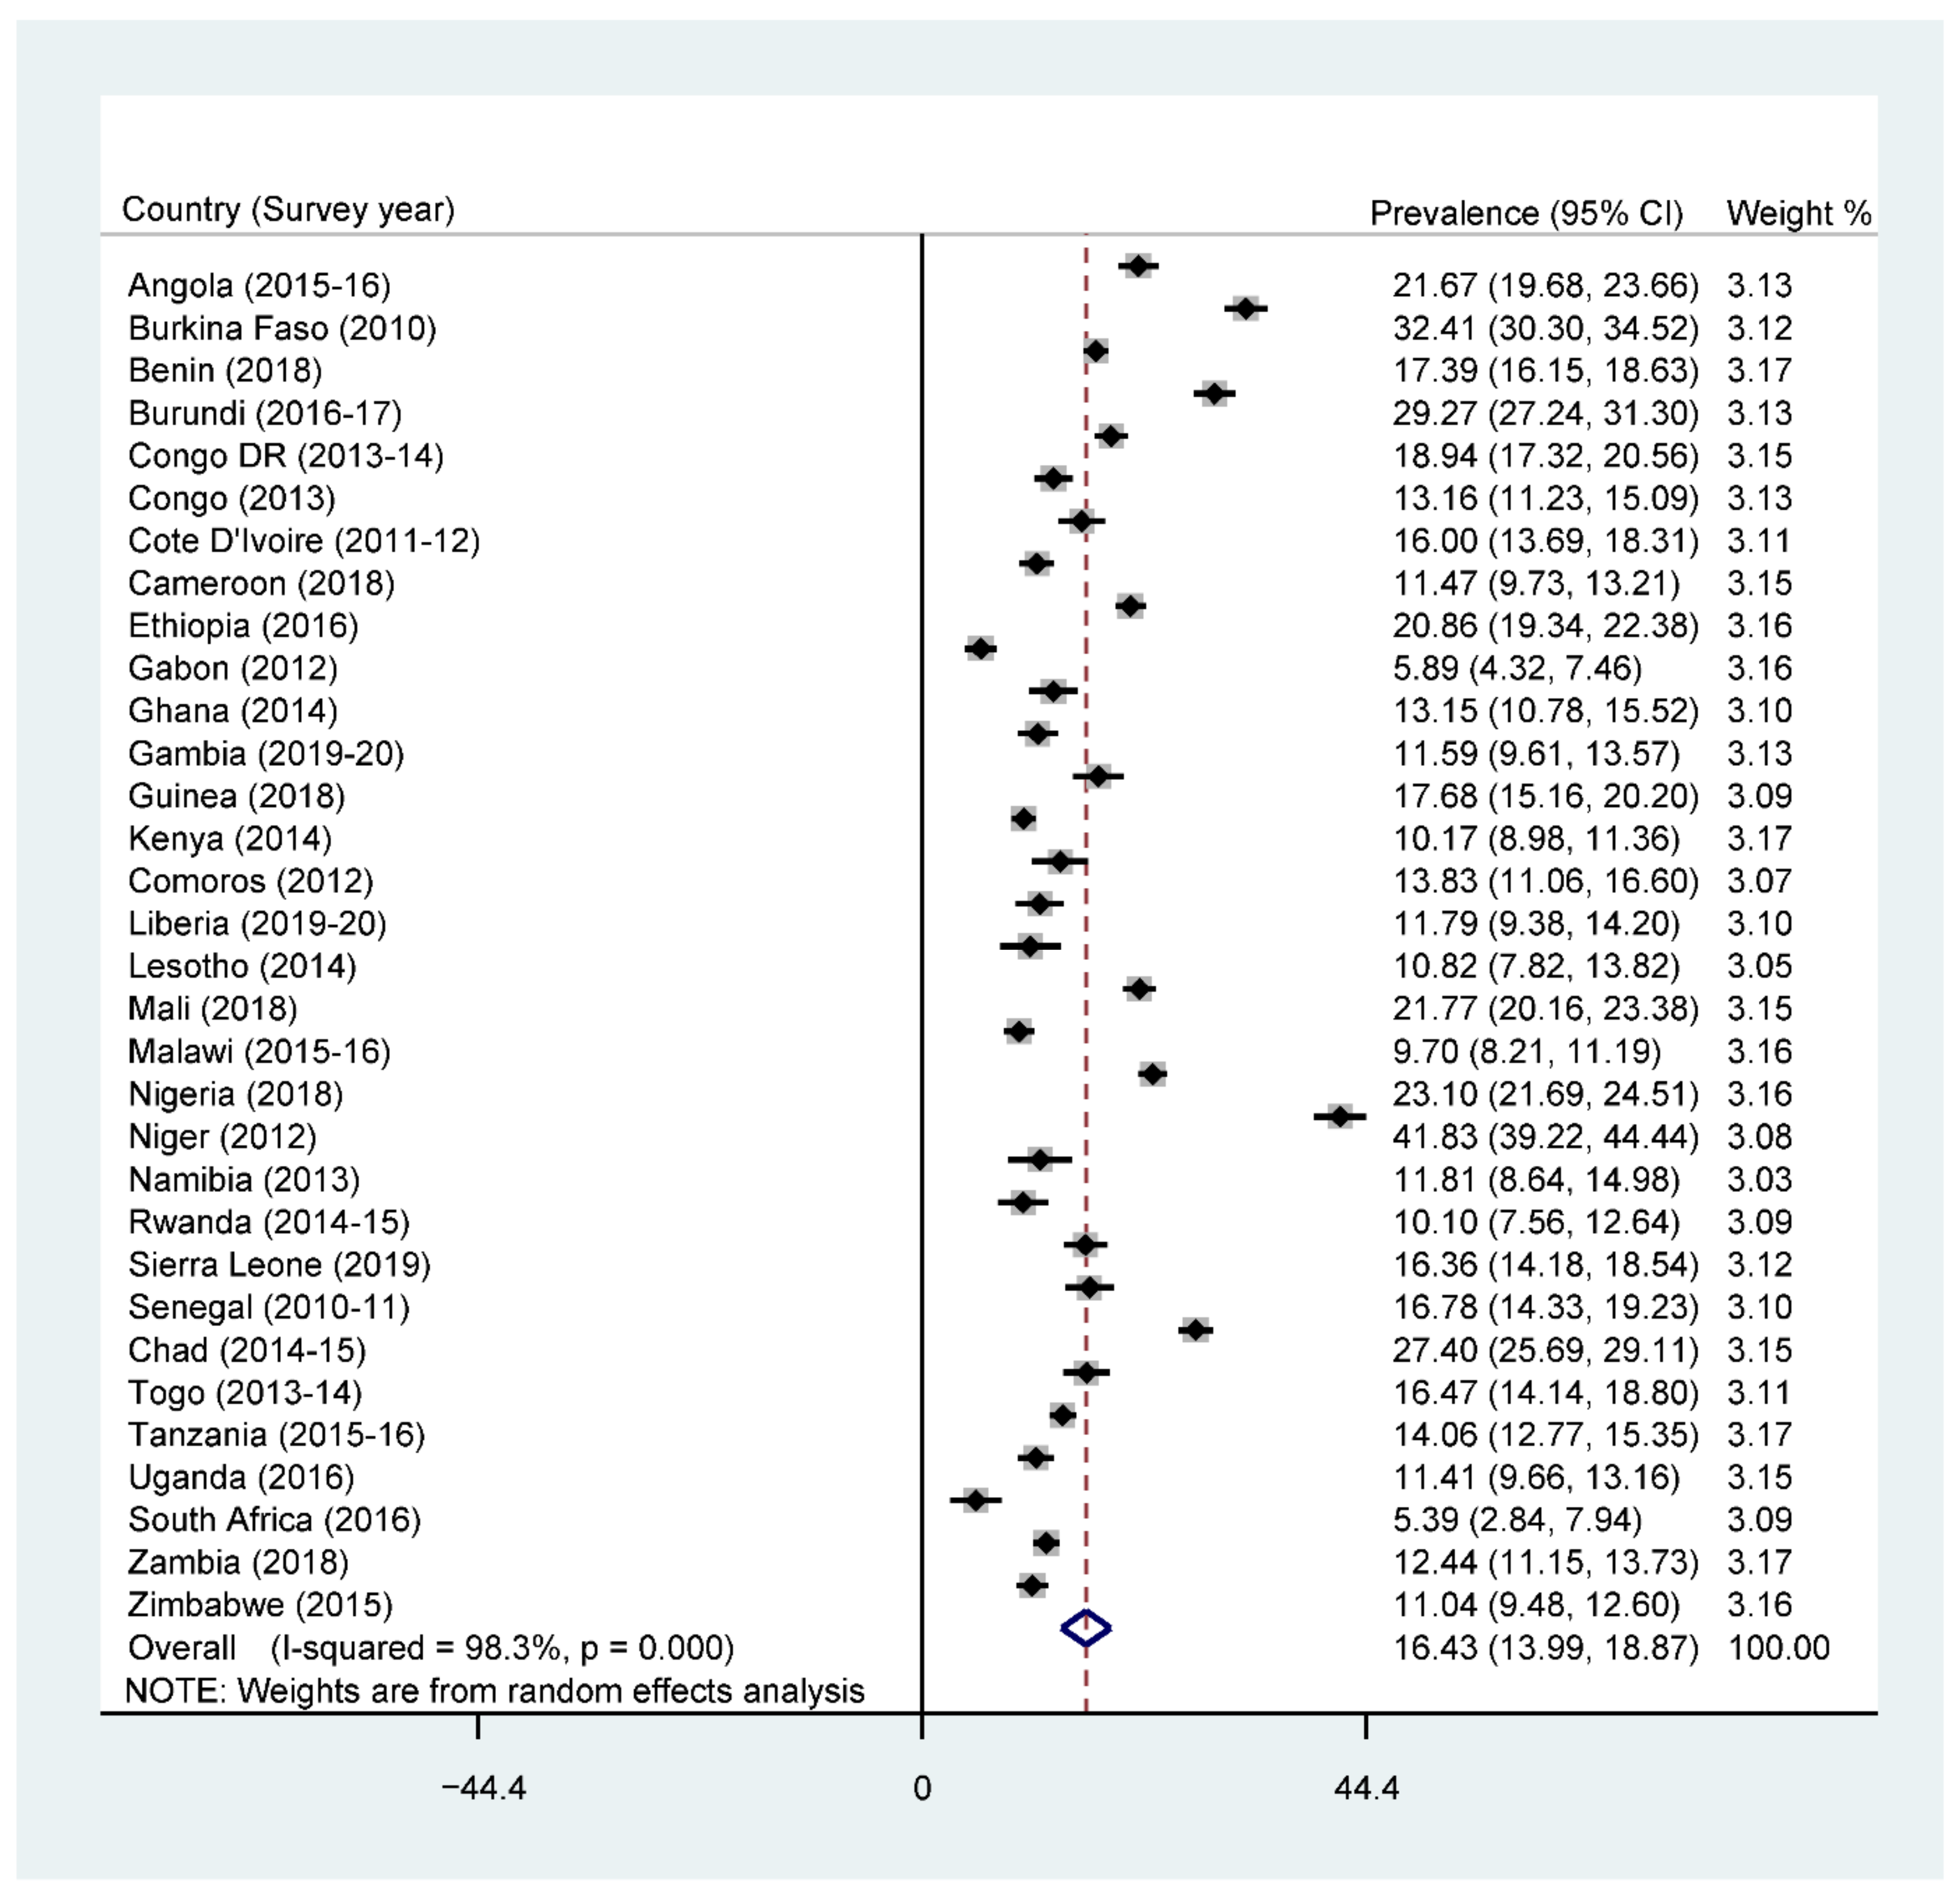
3.1. Prevalence of Minimum Dietary Diversity, Stunting, Wasting, and Underweight
3.2. Bivariate Analysis of Minimum Dietary Diversity and Undernutrition among Children in SSA
3.3. Association between Minimum Dietary Diversity and Stunting
3.4. Association between Minimum Dietary Diversity and Underweight
3.5. Association between Minimum Dietary Diversity and Wasting
4. Discussion
Strengths and Limitations
5. Conclusions
Supplementary Materials
Author Contributions
Funding
Institutional Review Board Statement
Data Availability Statement
Acknowledgments
Conflicts of Interest
References
- United Nations. Sustainable Development Goals; United Nations: New York, NY, USA, 2015. [Google Scholar]
- Gatica-Domínguez, G.; Neves, P.A.R.; Barros, A.J.D.; Victora, C.G. Complementary Feeding Practices in 80 Low- and Middle-Income Countries: Prevalence of and Socioeconomic Inequalities in Dietary Diversity, Meal Frequency, and Dietary Adequacy. J. Nutr. 2021, 151, 1956–1964. [Google Scholar] [CrossRef]
- Darapheak, C.; Takano, T.; Kizuki, M.; Nakamura, K.; Seino, K. Consumption of animal source foods and dietary diversity reduce stunting in children in Cambodia. Int. Arch. Med. 2013, 6, 29. [Google Scholar] [CrossRef] [PubMed]
- Arimond, M.; Ruel, M. Dietary Diversity Is Associated with Child Nutritional Status: Evidence from 11 Demographic and Health Surveys. J. Nutr. 2004, 134, 2579–2585. [Google Scholar] [CrossRef] [PubMed] [Green Version]
- Solomon, D.; Aderaw, Z.; Tegegne, T.K. Minimum dietary diversity and associated factors among children aged 6–23 months in Addis Ababa, Ethiopia. Int. J. Equity Health 2017, 16, 181. [Google Scholar] [CrossRef] [Green Version]
- Dangura, D.; Gebremedhin, S. Dietary diversity and associated factors among children 6–23 months of age in Gorche district, Southern Ethiopia: Cross-sectional study. BMC Pediatr. 2017, 17, 6. [Google Scholar] [CrossRef] [Green Version]
- Ruel, M.T. Is Dietary Diversity an Indicator of Food Security or Dietary Quality? International Food Policy Research Institute (IFPRI): Washington, DC, USA, 2002. [Google Scholar]
- Anin, S.K.; Saaka, M.; Fischer, F.; Kraemer, A. Association between Infant and Young Child Feeding (IYCF) Indicators and the Nutritional Status of Children (6–23 Months) in Northern Ghana. Nutrients 2020, 12, 2565. [Google Scholar] [CrossRef]
- Saaka, M.; Wemakor, A.; Abizari, A.-R.; Aryee, P.A. How well do WHO complementary feeding indicators relate to nutritional status of children aged 6–23 months in rural Northern Ghana? BMC Public Health 2015, 15, 1157. [Google Scholar] [CrossRef] [Green Version]
- World Health Organization. Levels and Trends in Child Malnutrition: UNICEF/WHO/The World Bank Group Joint Child Malnutrition Estimates: Key Findings of the 2019 Edition; WHO: Geneva, Switzerland, 2019. [Google Scholar]
- World Health Organization. WHO’s Africa Nutrition Report Highlights an Increase in Malnutrition in Africa. |WHO| Regional Office for Africa [Internet]. 2017. Available online: https://www.afro.who.int/news/whos-africa-nutrition-report-highlights-increase-malnutrition-africa (accessed on 11 March 2021).
- Khamis, A.G.; Mwanri, A.W.; Ntwenya, J.E.; Kreppel, K. The influence of dietary diversity on the nutritional status of children between 6 and 23 months of age in Tanzania. BMC Pediatr. 2019, 19, 518. [Google Scholar] [CrossRef] [PubMed] [Green Version]
- Frempong, R.B.; Annim, S.K. Dietary diversity and child malnutrition in Ghana. Heliyon 2017, 3, e00298. [Google Scholar] [CrossRef] [Green Version]
- World Health Organization. Indicators for Assessing Infant and Young Child Feeding Practices: Part 2: Measurement; World Health Organization: Geneva, Switzerland, 2010. [Google Scholar]
- World Health Organization. Indicators for Assessing Infant and Young Child Feeding Practices: Part 1: Definitions: Conclusions of a Consensus Meeting Held 6–8 November 2007 in Washington DC, USA; World Health Organization: Geneva, Switzerland, 2008. [Google Scholar]
- World Health Organization. Infant and Young Child Feeding; World Health Organization: Geneva, Switzerland, 2018. [Google Scholar]
- World Health Organization. Malnutrition. 2021. Available online: https://www.who.int/news-room/fact-sheets/detail/malnutrition (accessed on 18 August 2021).
- World Health Organization. UNICEF/WHO/The World Bank Group Joint Child Malnutrition Estimates: Levels and Trends in Child Malnutrition: Key Findings of the 2020 Edition; WHO: Geneva, Switzerland, 2020. [Google Scholar]
- Dewey, K.G.; Adu-Afarwuah, S. Systematic review of the efficacy and effectiveness of complementary feeding interventions in developing countries. Matern. Child Nutr. 2008, 4, 24–85. [Google Scholar] [CrossRef]
- Aemro, M.; Mesele, M.; Birhanu, Z.; Atenafu, A. Dietary Diversity and Meal Frequency Practices among Infant and Young Children Aged 6–23 Months in Ethiopia: A Secondary Analysis of Ethiopian Demographic and Health Survey 2011. J. Nutr. Metab. 2013, 2013, 782931. [Google Scholar] [CrossRef] [Green Version]
- Dafursa, K.; Gebremedhin, S. Dietary Diversity among Children Aged 6–23 Months in Aleta Wondo District, Southern Ethiopia. J. Nutr. Metab. 2019, 2019, 2869424. [Google Scholar] [CrossRef] [PubMed]
- Mekonnen, T.C.; Workie, S.B.; Yimer, T.M.; Mersha, W.F. Meal frequency and dietary diversity feeding practices among children 6–23 months of age in Wolaita Sodo town, Southern Ethiopia. J. Health Popul. Nutr. 2017, 36, 18. [Google Scholar] [CrossRef] [PubMed]
- Shariff, Z.M.; Lin, K.G.; Sariman, S.; Lee, H.S.; Siew, C.Y.; Yusof, B.N.M.; Mun, C.Y.; Mohamad, M. The relationship between household income and dietary intakes of 1–10 year old urban Malaysian. Nutr. Res. Pract. 2015, 9, 278–287. [Google Scholar] [CrossRef] [PubMed] [Green Version]
- Eshete, T.; Kumera, G.; Bazezew, Y.; Mihretie, A.; Marie, T. Determinants of inadequate minimum dietary diversity among children aged 6–23 months in Ethiopia: Secondary data analysis from Ethiopian Demographic and Health Survey 2016. Agric. Food Secur. 2018, 7, 66. [Google Scholar] [CrossRef] [Green Version]
- Paramashanti, B.A.; Paratmanitya, Y.; Marsiswati, M. Individual dietary diversity is strongly associated with stunting in infants and young children. J. Gizi Klin. Indones. 2017, 14, 19–26. [Google Scholar] [CrossRef] [Green Version]
- Borkotoky, K.; Unisa, S.; Gupta, A.K. State-level dietary diversity as a contextual determinant of nutritional status of children in India: A multilevel approach. J. Biosoc. Sci. 2018, 50, 26–52. [Google Scholar] [CrossRef]
- Udoh, E.E.; Amodu, O.K. Complementary feeding practices among mothers and nutritional status of infants in Akpabuyo Area, Cross River State Nigeria. SpringerPlus 2016, 5, 2073. [Google Scholar] [CrossRef] [Green Version]
- Corsi, D.J.; Neuman, M.; Finlay, J.E.; Subramanian, S.V. Demographic and health surveys: A profile. Int. J. Epidemiol. 2012, 41, 1602–1613. [Google Scholar] [CrossRef]
- World Health Organization. WHO Child Growth Standards: Length/Height-for-Age, Weight-for-Age, Weight-for-Length, Weight-for-Height and Body Mass Index-for-Age: Methods and Development; World Health Organization: Geneva, Switzerland, 2006. [Google Scholar]
- Woldegebriel, A.G.; Desta, A.A.; Gebreegziabiher, G.; Berhe, A.A.; Ajemu, K.F.; Woldearegay, T.W. Dietary Diversity and Associated Factors among Children Aged 6–59 Months in Ethiopia: Analysis of Ethiopian Demographic and Health Survey 2016 (EDHS 2016). Int. J. Pediatr. 2020, 2020, 3040845. [Google Scholar] [CrossRef]
- Nshimyiryo, A.; Hedt-Gauthier, B.; Mutaganzwa, C.; Kirk, C.M.; Beck, K.; Ndayisaba, A.; Mubiligi, J.; Kateera, F.; El-Khatib, Z. Risk factors for stunting among children under five years: A cross-sectional population-based study in Rwanda using the 2015 Demographic and Health Survey. BMC Public Health 2019, 19, 175. [Google Scholar] [CrossRef] [PubMed] [Green Version]
- Akombi, B.J.; Agho, K.E.; Hall, J.J.; Wali, N.; Renzaho, A.M.N.; Merom, D. Stunting, Wasting and Underweight in Sub-Saharan Africa: A Systematic Review. Int. J. Environ. Res. Public Health 2017, 14, 863. [Google Scholar] [CrossRef] [PubMed] [Green Version]
- Poda, G.G.; Hsu, C.Y.; Chao, J.C. Factors associated with malnutrition among children <5 years old in Burkina Faso: Evidence from the Demographic and Health Surveys IV 2010. Int. J. Qual. Health Care 2017, 29, 901–908. [Google Scholar]
- Talukder, A. Factors Associated with Malnutrition among Under-Five Children: Illustration using Bangladesh Demographic and Health Survey, 2014 Data. Children 2017, 4, 88. [Google Scholar] [CrossRef] [PubMed] [Green Version]
- Lawless, J.F.; Singhal, K. Efficient Screening of Nonnormal Regression Models. Biometrics 1978, 34, 318–327. [Google Scholar] [CrossRef]
- Lindsey, C.; Sheather, S. Best Subsets Variable Selection in Nonnormal Regression Models. Stata J. 2015, 15, 1046–1059. [Google Scholar] [CrossRef] [Green Version]
- Von Elm, E.; Altman, D.G.; Egger, M.; Pocock, S.J.; Gøtzsche, P.C.; Vandenbroucke, J.P. The Strobe Initiative. The Strengthening the Reporting of Observational Studies in Epidemiology (STROBE) Statement: Guidelines for reporting observational studies. Int. J. Surg. 2014, 12, 1495–1499. [Google Scholar] [CrossRef] [PubMed] [Green Version]
- Madzorera, I.; Ghosh, S.; Wang, M.; Fawzi, W.; Isanaka, S.; Hertzmark, E.; Namirembe, G.; Bashaasha, B.; Agaba, E.; Turyashemererwa, F.; et al. Prenatal dietary diversity may influence underweight in infants in a Ugandan birth-cohort. Matern. Child Nutr. 2021, 17, e13127. [Google Scholar] [CrossRef]
- Modjadji, P.; Molokwane, D.; Ukegbu, P.O. Dietary Diversity and Nutritional Status of Preschool Children in North West Province, South Africa: A Cross Sectional Study. Children 2020, 7, 174. [Google Scholar] [CrossRef]
- Olumakaiye, M. Dietary diversity as a correlate of undernutrition among school-age children in southwestern Nigeria. Ann. Nutr. Metab. 2013, 63, 569. [Google Scholar]
- Bukania, Z.N.; Mwangi, M.; Karanja, R.M.; Mutisya, R.; Kombe, Y.; Kaduka, L.U.; Johns, T. Food Insecurity and Not Dietary Diversity Is a Predictor of Nutrition Status in Children within Semiarid Agro-Ecological Zones in Eastern Kenya. J. Nutr. Metab. 2014, 2014, 907153. [Google Scholar] [CrossRef] [PubMed]
- Walingo, M.; Ekesa, B. Nutrient Intake, Morbidity and Nutritional Status of Preschool Children are Influenced by Agricultural and Dietary Diversity in Western Kenya. Pak. J. Nutr. 2013, 12, 854–859. [Google Scholar] [CrossRef] [Green Version]
- Hooshmand, S.; Udipi, S.A. Dietary Diversity and Nutritional Status of Urban Primary School Children from Iran and India. J. Nutr. Disord. Ther. 2013, 12. [Google Scholar] [CrossRef]
- Baye, K.; Laillou, A.; Chitweke, S. Socio-Economic Inequalities in Child Stunting Reduction in Sub-Saharan Africa. Nutrients 2020, 12, 253. [Google Scholar] [CrossRef] [Green Version]
- Ogechi, U.P.; Chilezie, O.V. Assessment of Dietary Diversity Score, Nutritional Status and Socio-demographic Characteristics of Under-5 Children in Some Rural Areas of Imo State, Nigeria. Malays. J. Nutr. 2017, 23, 425–435. [Google Scholar]
- Sie, A.; Tapsoba, C.; Dah, C.; Ouermi, L.; Zabré, P.; Bärnighausen, T.; Arzika, A.M.; LeBas, E.; Snyder, B.M.; Moe, C.; et al. Dietary diversity and nutritional status among children in rural Burkina Faso. Int. Health 2018, 10, 157–162. [Google Scholar] [CrossRef] [PubMed]
- Masuke, R.; Msuya, S.E.; Mahande, J.M.; Diarz, E.J.; Stray-Pedersen, B.; Jahanpour, O.; Mgongo, M. Effect of inappropriate complementary feeding practices on the nutritional status of children aged 6–24 months in urban Moshi, Northern Tanzania: Cohort study. PLoS ONE 2021, 16, e0250562. [Google Scholar] [CrossRef]
- Belayneh, M.; Loha, E.; Lindtjørn, B. Seasonal Variation of Household Food Insecurity and Household Dietary Diversity on Wasting and Stunting among Young Children in A Drought Prone Area in South Ethiopia: A Cohort Study. Ecol. Food Nutr. 2021, 60, 44–69. [Google Scholar] [CrossRef] [PubMed]
- Ekesa, B.N.; Blomme, G.; Garming, H. Dietary diversity and nutritional status of pre-school children from Musa-dependent households in Gitega (Burundi) And Butembo (Democratic Republic Of Congo). Afr. J. Food Agric. Nutr. Dev. 2011, 11. [Google Scholar] [CrossRef] [Green Version]
- Aheto, J.M.; Keegan, T.J.; Taylor, B.M.; Diggle, P.J. Childhood Malnutrition and Its Determinants among Under-Five Children in Ghana. Paediatr. Perinat. Epidemiol. 2015, 29, 552–561. [Google Scholar] [CrossRef]
- Ma’Alin, A.; Birhanu, D.; Melaku, S.; Tolossa, D.; Mohammed, Y.; Gebremicheal, K. Magnitude and factors associated with malnutrition in children 6–59 months of age in Shinille Woreda, Ethiopian Somali regional state: A cross-sectional study. BMC Nutr. 2016, 2, 44. [Google Scholar] [CrossRef] [Green Version]
- Kumar, R.; Abbas, F.; Mahmood, T.; Somrongthong, R. Prevalence and factors associated with underweight children: A population-based subnational analysis from Pakistan. BMJ Open 2019, 9, e028972. [Google Scholar] [CrossRef] [PubMed] [Green Version]


| Countries | Year of Survey | Weighted N | Weighted % |
|---|---|---|---|
| Angola | 2015–16 | 1652 | 3.4 |
| Burkina Faso | 2010 | 1894 | 3.9 |
| Benin | 2018 | 3576 | 7.3 |
| Burundi | 2016–17 | 1925 | 3.9 |
| Congo DR | 2013–14 | 2251 | 4.6 |
| Congo | 2013 | 1182 | 2.4 |
| Cote d’Ivoire | 2011–12 | 970 | 2.0 |
| Cameroon | 2018 | 1292 | 2.6 |
| Ethiopia | 2016 | 2754 | 5.6 |
| Gabon | 2012 | 867 | 1.8 |
| Ghana | 2014 | 781 | 1.6 |
| Gambia | 2019–20 | 1005 | 2.0 |
| Guinea | 2018 | 878 | 1.8 |
| Kenya | 2014 | 2474 | 5.0 |
| Comoros | 2012 | 595 | 1.2 |
| Liberia | 2019–20 | 686 | 1.4 |
| Lesotho | 2014 | 411 | 0.8 |
| Mali | 2018 | 2537 | 5.2 |
| Malawi | 2015–16 | 1,507 | 3.1 |
| Nigeria | 2018 | 3,411 | 7.0 |
| Niger | 2012 | 1,369 | 2.8 |
| Namibia | 2013 | 398 | 0.8 |
| Rwanda | 2014–15 | 539 | 1.1 |
| Sierra Leone | 2019 | 1110 | 2.3 |
| Senegal | 2010–11 | 892 | 1.8 |
| Chad | 2014–15 | 2627 | 5.4 |
| Togo | 2013–14 | 974 | 2.0 |
| Tanzania | 2015–16 | 2778 | 5.7 |
| Uganda | 2016 | 1269 | 2.6 |
| South Africa | 2016 | 302 | 0.6 |
| Zambia | 2018 | 2513 | 5.1 |
| Zimbabwe | 2015 | 1549 | 3.2 |
| All countries | 48,968 | 100.0 |
| Variables | Weighted N | Weighted % | Stunted | p-Value | Underweight | p-Value | Wasted | p-Value |
|---|---|---|---|---|---|---|---|---|
| Minimum dietary diversity | <0.001 | <0.001 | <0.001 | |||||
| Inadequate | 36,930 | 75.4 | 30.9 | 19.6 | 11.0 | |||
| Adequate | 12,038 | 24.6 | 27.7 | 13.9 | 7.5 | |||
| Child characteristics | ||||||||
| Sex of child | <0.001 | <0.001 | <0.001 | |||||
| Male | 24,663 | 50.4 | 34.0 | 20.7 | 11.6 | |||
| Female | 24,305 | 49.6 | 26.2 | 15.6 | 8.6 | |||
| Age of child | <0.001 | <0.001 | <0.001 | |||||
| 6–8 | 8953 | 18.3 | 16.7 | 14.3 | 11.2 | |||
| 9–11 | 8328 | 17.0 | 21.9 | 17.6 | 12.0 | |||
| 12–17 | 17,471 | 35.7 | 31.5 | 18.9 | 10.4 | |||
| 18–23 | 14,216 | 29.0 | 41.8 | 20.1 | 8.1 | |||
| Birth order | <0.001 | <0.001 | <0.001 | |||||
| 1 | 10,423 | 21.3 | 29.4 | 15.7 | 8.5 | |||
| 2–4 | 23,569 | 48.1 | 28.9 | 16.9 | 9.5 | |||
| 5 and above | 14,976 | 30.6 | 32.6 | 22.0 | 12.3 | |||
| Size of child at birth | <0.001 | <0.001 | <0.001 | |||||
| Large | 16,972 | 34.7 | 24.7 | 13.5 | 8.1 | |||
| Average | 24,209 | 49.4 | 30.9 | 17.9 | 9.9 | |||
| Smaller | 7787 | 15.9 | 39.8 | 29.4 | 15.2 | |||
| Maternal characteristics | ||||||||
| Mother’s age | <0.001 | <0.001 | <0.001 | |||||
| 15–19 | 4428 | 9.0 | 32.1 | 17.6 | 10.1 | |||
| 20–24 | 12,087 | 24.7 | 31.2 | 17.3 | 9.1 | |||
| 25–29 | 13,302 | 27.2 | 29.0 | 17.6 | 9.8 | |||
| 30–34 | 9684 | 19.8 | 28.5 | 18.7 | 10.6 | |||
| 35–39 | 6417 | 13.1 | 30.1 | 19.0 | 11.4 | |||
| 40–44 | 2491 | 5.1 | 33.4 | 22.0 | 11.9 | |||
| 45–49 | 560 | 1.1 | 34.8 | 19.5 | 11.6 | |||
| Maternal educational level | <0.001 | <0.001 | <0.001 | |||||
| No education | 18,997 | 38.8 | 34.9 | 25.7 | 14.5 | |||
| Primary | 16,054 | 32.8 | 31.8 | 16.0 | 8.0 | |||
| Secondary | 12,387 | 25.3 | 23.0 | 10.9 | 6.7 | |||
| Higher | 1530 | 3.1 | 11.7 | 6.2 | 5.3 | |||
| Current working status | 0.033 | 0.141 | <0.001 | |||||
| No | 18,720 | 38.2 | 29.4 | 18.6 | 11.3 | |||
| Yes | 30,248 | 61.8 | 30.6 | 17.9 | 9.4 | |||
| ANC | <0.001 | <0.001 | <0.001 | |||||
| None | 5046 | 10.3 | 38.1 | 28.6 | 16.4 | |||
| 1–3 | 16,750 | 34.2 | 33.7 | 20.5 | 11.2 | |||
| 4 or more | 27,172 | 55.5 | 26.5 | 14.9 | 8.3 | |||
| Place of delivery | <0.001 | <0.001 | <0.001 | |||||
| Home | 14,923 | 30.5 | 36.1 | 25.9 | 14.4 | |||
| Health facility | 33,472 | 68.4 | 27.4 | 14.7 | 8.3 | |||
| Other | 567 | 1.1 | 36.4 | 20.6 | 7.3 | |||
| PNC | <0.001 | <0.001 | 0.003 | |||||
| No | 28,940 | 59.1 | 31.9 | 19.5 | 10.6 | |||
| Yes | 20,028 | 40.9 | 27.6 | 16.3 | 9.5 | |||
| Marital status | 0.004 | <0.001 | <0.001 | |||||
| Never in union | 3411 | 7.0 | 27.7 | 13.3 | 6.6 | |||
| Married | 35,467 | 72.4 | 30.3 | 19.2 | 11.1 | |||
| Cohabiting | 7473 | 15.3 | 29.3 | 15.2 | 7.4 | |||
| Widowed | 410 | 0.8 | 33.4 | 24.4 | 14.9 | |||
| Divorced | 658 | 1.3 | 33.8 | 17.1 | 10.5 | |||
| Separated | 1548 | 3.2 | 33.3 | 18.5 | 8.2 | |||
| Household characteristics | ||||||||
| Drinking water source | <0.001 | <0.001 | 0.002 | |||||
| Improved | 31,445 | 64.2 | 29.4 | 17.4 | 9.7 | |||
| Unimproved | 17,523 | 35.8 | 31.4 | 19.5 | 10.9 | |||
| Toilet facility | <0.001 | <0.001 | <0.001 | |||||
| Improved | 20,924 | 42.7 | 26.7 | 13.8 | 7.9 | |||
| Unimproved | 28,044 | 57.3 | 32.7 | 21.5 | 11.8 | |||
| Household size | 0.152 | <0.001 | <0.001 | |||||
| Small | 21,256 | 43.4 | 29.7 | 16.6 | 9.1 | |||
| Medium | 21,301 | 43.5 | 30.2 | 19.1 | 10.6 | |||
| Large | 6411 | 13.1 | 31.3 | 20.5 | 12.0 | |||
| Frequency of watching television | <0.001 | <0.001 | <0.001 | |||||
| Not at all | 30,471 | 62.2 | 34.4 | 21.5 | 11.5 | |||
| Less than once a week | 6112 | 12.5 | 27.0 | 16.2 | 9.4 | |||
| At least once a week | 12,385 | 25.3 | 21.2 | 11.1 | 7.2 | |||
| Frequency of listening radio | <0.001 | <0.001 | <0.001 | |||||
| Not at all | 22,380 | 45.7 | 33.0 | 21.0 | 11.6 | |||
| Less than once a week | 9596 | 19.6 | 29.6 | 17.9 | 9.9 | |||
| At least once a week | 16,992 | 34.7 | 26.7 | 14.7 | 8.3 | |||
| Frequency of readingnewspaper or magazine | <0.001 | <0.001 | <0.001 | |||||
| Not at all | 41,619 | 85.0 | 31.6 | 19.8 | 10.9 | |||
| Less than once a week | 4364 | 8.9 | 23.5 | 9.8 | 5.6 | |||
| At least once a week | 2985 | 6.1 | 18.9 | 7.8 | 5.9 | |||
| Cooking fuel | <0.001 | <0.001 | <0.001 | |||||
| Unclean | 44,547 | 91.0 | 31.3 | 19.2 | 10.6 | |||
| Clean | 4421 | 9.0 | 18.7 | 8.1 | 5.5 | |||
| Wealth index | <0.001 | <0.001 | <0.001 | |||||
| Poorest | 10,900 | 22.3 | 36.7 | 23.7 | 12.4 | |||
| Poorer | 10,547 | 21.5 | 33.9 | 20.6 | 10.4 | |||
| Middle | 10,023 | 20.4 | 30.9 | 18.6 | 10.1 | |||
| Richer | 9362 | 19.1 | 27.8 | 15.3 | 9.2 | |||
| Richest | 8136 | 16.6 | 18.3 | 10.5 | 7.8 | |||
| Contextual-level factors | ||||||||
| Place of residence | <0.001 | <0.001 | <0.001 | |||||
| Urban | 15,775 | 32.2 | 22.9 | 12.4 | 7.8 | |||
| Rural | 33,193 | 67.8 | 33.6 | 20.9 | 11.2 | |||
| Geographical subregions | <0.001 | <0.001 | <0.001 | |||||
| Southern | 1112 | 2.3 | 24.2 | 9.7 | 7.4 | |||
| Central | 9871 | 20.1 | 30.2 | 18.8 | 10.4 | |||
| Eastern | 17,903 | 36.6 | 33.0 | 15.0 | 7.1 | |||
| Western | 20,083 | 41.0 | 27.9 | 51.2 | 12.8 | |||
| Variable | Model O | Model I cOR (95% CI) | Model II aOR (95% CI) |
|---|---|---|---|
| Fixed effect model | |||
| Minimum dietary diversity | |||
| Inadequate | 1 (1.00,1.00) | 1 (1.00, 1.00) | |
| Adequate | 0.86 *** (0.81, 0.91) | 0.88 *** (0.83, 0.94) | |
| Child characteristics | |||
| Sex of child | |||
| Male | 1 (1.00, 1.00) | ||
| Female | 0.63 *** (0.60, 0.66) | ||
| Age of child (months) | |||
| 6–8 | 1 [1.00, 1.00] | ||
| 9–11 | 1.45 *** (1.32, 1.59) | ||
| 12–17 | 2.46 *** (2.26, 2.68) | ||
| 18–23 | 4.10 *** (3.77, 4.46) | ||
| Size of child at birth | |||
| Large | 1 [1.00, 1.00] | ||
| Average | 1.37 *** (1.29, 1.45) | ||
| Smaller | 2.08 *** (1.93, 2.25) | ||
| Maternal characteristics | |||
| Maternal educational level | |||
| No education | 1 (1.00, 1.00) | ||
| Primary | 0.84 *** (0.79, 0.90) | ||
| Secondary | 0.71 *** (0.66, 0.77) | ||
| Higher | 0.46 *** (0.36, 0.57) | ||
| Mother’s age (years) | |||
| 15–19 | 1 (1.00, 1.00) | ||
| 20–24 | 0.89 * (0.81, 0.98) | ||
| 25–29 | 0.81 *** (0.73, 0.89) | ||
| 30–34 | 0.77 *** (0.69, 0.85) | ||
| 35–39 | 0.78 *** (0.70, 0.88) | ||
| 40–44 | 0.86 * (0.74, 0.99) | ||
| 45–49 | 0.78 * (0.62, 0.99) | ||
| Current working status | |||
| No | 1 (1.00, 1.00) | ||
| Yes | 1.07 ** (1.02, 1.14) | ||
| Marital status | |||
| Never in union | 1 (1.00, 1.00) | ||
| Married | 0.99 (0.89, 1.10) | ||
| Cohabiting | 1.02 (0.90, 1.15) | ||
| Widowed | 0.93 (0.71, 1.22) | ||
| Divorced | 0.99 (0.78, 1.26) | ||
| Separated | 1.11 (0.94, 1.31) | ||
| ANC | |||
| None | 1 (1.00, 1.00) | ||
| 1–3 | 0.95 (0.87, 1.05) | ||
| 4 or more | 0.80 *** (0.73, 0.88) | ||
| PNC | |||
| No | 1 (1.00, 1.00) | ||
| Yes | 0.91 *** (0.87, 0.96) | ||
| Frequency of watching television | |||
| Not at all | 1 (1.00, 1.00) | ||
| Less than once a week | 0.87 ** (0.80, 0.95) | ||
| At least once a week | 0.82 *** (0.75, 0.90) | ||
| Frequency of reading newspaper/magazine | |||
| Not at all | 1 (1.00, 1.00) | ||
| Less than once a week | 0.92 (0.83, 1.02) | ||
| At least once a week | 0.83 * (0.71, 0.97) | ||
| Household factors | |||
| Toilet facility | |||
| Improved | 1 (1.00, 1.00) | ||
| Unimproved | 0.94 (0.88, 1.00) | ||
| Drinking water source | |||
| Improved | 1 (1.00, 1.00) | ||
| Unimproved | 0.97 (0.92, 1.03) | ||
| Household size | |||
| Small | 1 (1.00, 1.00) | ||
| Medium | 1.02 (0.96, 1.08) | ||
| Large | 1.14 ** (1.05, 1.25) | ||
| Cooking fuel | |||
| Unclean | 1 (1.00, 1.00) | ||
| Clean | 0.92 (0.80, 1.07) | ||
| Wealth index | |||
| Poorest | 1 (1.00, 1.00) | ||
| Poorer | 0.91 * (0.85, 0.98) | ||
| Middle | 0.84 *** (0.78, 0.91) | ||
| Richer | 0.80 *** (0.72, 0.90) | ||
| Richest | 0.60 *** (0.53, 0.68) | ||
| Contextual-level factors | |||
| Place of residence | |||
| Urban | 1 (1.00, 1.00) | ||
| Rural | 1.05 (0.97, 1.14) | ||
| Geographical subregions | |||
| Southern | 1 (1.00, 1.00) | ||
| Central | 1.13 (0.93, 1.36) | ||
| Eastern | 1.20 * (1.00, 1.43) | ||
| Western | 0.90 (0.75, 1.09) | ||
| Random effect model | |||
| PSU variance (95% CI) | 0.06 (0.05, 0.08) | 0.06 (0.05, 0.08) | 0.06 (0.04, 0.08) |
| ICC | 0.02 | 0.02 | 0.02 |
| Wald chi–square | Reference | 26.85 *** | 2945.96 *** |
| Model fitness | |||
| Log-likelihood | −29,676.65 | −29,655.21 | −27,301.93 |
| AIC | 59,357.31 | 59,316.43 | 54,691.87 |
| N | 48,968 | 48,968 | 48,968 |
| Number of clusters | 1563 | 1563 | 1563 |
| Variable | Model O | Model I aOR (95% CI) | Model II aOR (95% CI) |
|---|---|---|---|
| Fixed effects model | |||
| Minimum dietary diversity | |||
| Inadequate | 1 (1.00, 1.00) | 1 (1.00, 1.00) | |
| Adequate | 0.66 *** (0.61, 0.71) | 0.83 *** (0.77, 0.91) | |
| Child characteristics | |||
| Sex of child | |||
| Male | 1 (1.00, 1.00) | ||
| Female | 0.65 *** (0.61, 0.69) | ||
| Age of child | |||
| 6–8 | 1 (1.00, 1.00) | ||
| 9–11 | 1.36 *** (1.23, 1.51) | ||
| 12–17 | 1.46 *** (1.34, 1.60) | ||
| 18–23 | 1.66 *** (1.52, 1.81) | ||
| Birth order | |||
| 1 | 1 (1.00, 1.00) | ||
| 2–4 | 0.97 (0.87, 1.07) | ||
| 5 and above | 1.05 (0.91, 1.20) | ||
| Size of child at birth | |||
| Large | 1 (1.00, 1.00) | ||
| Average | 1.46 *** (1.36, 1.57) | ||
| Smaller | 2.72 *** (2.48, 2.98) | ||
| Maternal characteristics | |||
| Maternal educational level | |||
| No education | 1 (1.00, 1.00) | ||
| Primary | 0.75 *** (0.69, 0.81) | ||
| Secondary | 0.61 *** (0.56, 0.67) | ||
| Higher | 0.49 *** (0.37, 0.66) | ||
| Mother’s age | |||
| 15–19 | 1 (1.00, 1.00) | ||
| 20–24 | 1.00 (0.89, 1.13) | ||
| 25–29 | 0.99 (0.87, 1.14) | ||
| 30–34 | 1.00 (0.86, 1.17) | ||
| 35–39 | 0.96 (0.81, 1.13) | ||
| 40–44 | 1.08 (0.89, 1.30) | ||
| 45–49 | 0.76 (0.57, 1.02) | ||
| Marital status | |||
| Never in union | 1 (1.00, 1.00) | ||
| Married | 1.04 (0.91, 1.18) | ||
| Cohabiting | 0.98 (0.83, 1.15) | ||
| Widowed | 1.32 (0.97, 1.79) | ||
| Divorced | 1.02 (0.76, 1.36) | ||
| Separated | 1.27 * (1.00, 1.60) | ||
| ANC | |||
| None | 1 (1.00, 1.00) | ||
| 1–3 | 0.92 (0.84, 1.02) | ||
| 4 or more | 0.81 *** (0.73, 0.89) | ||
| Place of delivery | |||
| Home | 1 (1.00, 1.00) | ||
| Health facility | 0.77 *** (0.71, 0.83) | ||
| Other | 1.04 (0.81, 1.33) | ||
| Frequency of watching television | |||
| Not at all | 1 (1.00, 1.00) | ||
| Less than once a week | 0.87 ** (0.78, 0.96) | ||
| At least once a week | 0.77 *** (0.70, 0.85) | ||
| Frequency of listening radio | |||
| Not at all | 1 (1.00, 1.00) | ||
| Less than once a week | 1.00 (0.93, 1.08) | ||
| At least once a week | 0.94 (0.87, 1.01) | ||
| Frequency of reading newspaper/magazine | |||
| Not at all | 1 (1.00, 1.00) | ||
| Less than once a week | 0.82 ** (0.72, 0.94) | ||
| At least once a week | 0.80 * (0.66, 0.98) | ||
| Toilet facility | |||
| Improved | 1 (1.00, 1.00) | ||
| Unimproved | 1.10 ** (1.03, 1.18) | ||
| Household size | |||
| Small | 1 (1.00, 1.00) | ||
| Medium | 1.02 (0.95, 1.10) | ||
| Large | 1.01 (0.91, 1.11) | ||
| Cooking fuel | |||
| Unclean | 1 (1.00, 1.00) | ||
| Clean | 0.76 ** (0.63, 0.92) | ||
| Contextual-level factors | |||
| Place of residence | |||
| Urban | 1 (1.00, 1.00) | ||
| Rural | 1.15 ** (1.05, 1.25) | ||
| Geographical subregions | |||
| Southern | 1 (1.00, 1.00) | ||
| Central | 1.46 ** (1.12, 1.91) | ||
| Eastern | 1.03 (0.79, 1.34) | ||
| Western | 1.50 ** (1.15, 1.95) | ||
| Random effect model | |||
| PSU variance (95% CI) | 0.74 (0.05, 0.10) | 0.07 (0.05, 0.10) | 0.07 (0.05, 0.09) |
| ICC | 0.02 | 0.02 | 0.02 |
| Wald chi–square | Reference | 117.00 *** | 2377.44 *** |
| Model fitness | |||
| Log-likelihood | −22,996.44 | −22,892.21 | −21,316.71 |
| AIC | 45,996.88 | 45,790.42 | 42,719.42 |
| N | 48,968 | 48,968 | 48,968 |
| Number of clusters | 1563 | 1563 | 1563 |
| Variable | Model O | Model I aOR (95% CI) | Model II aOR (95% CI) |
|---|---|---|---|
| Fixed effect model | |||
| Minimum dietary diversity | |||
| Inadequate | 1 (1.00, 1.00) | 1 (1.00, 1.00) | |
| Adequate | 0.65 *** (0.59, 0.72) | 0.87 * (0.78, 0.97) | |
| Child characteristics | |||
| Sex of child | |||
| Male | 1 (1.00, 1.00) | ||
| Female | 0.68 *** (0.63, 0.73) | ||
| Age of child | |||
| 6–8 | 1 (1.00, 1.00) | ||
| 9–11 | 1.14 * (1.01, 1.28) | ||
| 12–17 | 0.93 (0.84, 1.03) | ||
| 18–23 | 0.73 *** (0.65, 0.82) | ||
| Birth order | |||
| 1 | 1 (1.00, 1.00) | ||
| 2–4 | 1.05 (0.95, 1.16) | ||
| 5 and above | 1.15 * (1.02, 1.30) | ||
| Size of child at birth | |||
| Large | 1 (1.00, 1.00) | ||
| Average | 1.32 *** (1.21, 1.45) | ||
| Smaller | 2.03 *** (1.83, 2.25) | ||
| Maternal characteristics | |||
| Maternal educational level | |||
| No education | 1 (1.00, 1.00) | ||
| Primary | 0.75 *** (0.68, 0.82) | ||
| Secondary | 0.67 *** (0.60, 0.76) | ||
| Higher | 0.66 * (0.47, 0.92) | ||
| ANC | |||
| None | 1 (1.00, 1.00) | ||
| 1–3 | 0.90 (0.80, 1.02) | ||
| 4 or more | 0.78 *** (0.70, 0.88) | ||
| Place of delivery | |||
| Home | 1 (1.00, 1.00) | ||
| Health facility | 0.77 *** (0.70, 0.85) | ||
| Other | 0.65 * (0.44, 0.96) | ||
| PNC | |||
| No | 1 (1.00, 1.00) | ||
| Yes | 1.05 (0.97, 1.14) | ||
| Current working status | |||
| No | 1 (1.00, 1.00) | ||
| Yes | 0.84 *** (0.77, 0.91) | ||
| Frequency of watching television | |||
| Not at all | 1 (1.00, 1.00) | ||
| Less than once a week | 0.91 (0.80, 1.04) | ||
| At least once a week | 0.82 ** (0.72, 0.93) | ||
| Frequency of listening radio | |||
| Not at all | 1 (1.00, 1.00) | ||
| Less than once a week | 0.95 (0.86, 1.06) | ||
| At least once a week | 0.90 * (0.82, 1.00) | ||
| Frequency of reading newspaper/magazine | |||
| Not at all | 1 (1.00, 1.00) | ||
| Less than once a week | 0.85 (0.70, 1.03) | ||
| At least once a week | 1.02 (0.80, 1.29) | ||
| Toilet facility | |||
| Improved | 1 (1.00, 1.00) | ||
| Unimproved | 1.14 ** (1.04, 1.25) | ||
| Household size | |||
| Small | 1 (1.00, 1.00) | ||
| Medium | 1.00 (0.91, 1.09) | ||
| Large | 1.00 (0.89, 1.12) | ||
| Cooking fuel | |||
| Unclean | 1 (1.00, 1.00) | ||
| Clean | 0.72 ** (0.59, 0.89) | ||
| Wealth index | |||
| Poorest | 1 (1.00, 1.00) | ||
| Poorer | 0.90 (0.81, 1.00) | ||
| Middle | 0.98 (0.87, 1.10) | ||
| Richer | 1.05 (0.92, 1.19) | ||
| Richest | 1.21 * (1.04, 1.41) | ||
| Contextual-level factors | |||
| Geographical subregions | |||
| Southern | 1 (1.00, 1.00) | ||
| Central | 1.02 (0.77, 1.36) | ||
| Eastern | 0.67 ** (0.51, 0.89) | ||
| Western | 1.20 (0.91, 1.58) | ||
| Random effect model | |||
| PSU variance (95% CI) | 0.11 (0.08, 0.15) | 0.11 (0.08, 0.15) | 0.11 (0.08, 0.15) |
| ICC | 0.03 | 0.03 | 0.03 |
| Wald chi-square | Reference | 63.06 *** | 1044.79 *** |
| Model fitness | |||
| Log-likelihood | −15,873.50 | −15,808.28 | −15,043.51 |
| AIC | 31,750.99 | 31,622.56 | 30,161.01 |
| N | 48,968 | 48,968 | 48,968 |
| Number of clusters | 1563 | 1563 | 1563 |
Publisher’s Note: MDPI stays neutral with regard to jurisdictional claims in published maps and institutional affiliations. |
© 2021 by the authors. Licensee MDPI, Basel, Switzerland. This article is an open access article distributed under the terms and conditions of the Creative Commons Attribution (CC BY) license (https://creativecommons.org/licenses/by/4.0/).
Share and Cite
Aboagye, R.G.; Seidu, A.-A.; Ahinkorah, B.O.; Arthur-Holmes, F.; Cadri, A.; Dadzie, L.K.; Hagan, J.E., Jr.; Eyawo, O.; Yaya, S. Dietary Diversity and Undernutrition in Children Aged 6–23 Months in Sub-Saharan Africa. Nutrients 2021, 13, 3431. https://doi.org/10.3390/nu13103431
Aboagye RG, Seidu A-A, Ahinkorah BO, Arthur-Holmes F, Cadri A, Dadzie LK, Hagan JE Jr., Eyawo O, Yaya S. Dietary Diversity and Undernutrition in Children Aged 6–23 Months in Sub-Saharan Africa. Nutrients. 2021; 13(10):3431. https://doi.org/10.3390/nu13103431
Chicago/Turabian StyleAboagye, Richard Gyan, Abdul-Aziz Seidu, Bright Opoku Ahinkorah, Francis Arthur-Holmes, Abdul Cadri, Louis Kobina Dadzie, John Elvis Hagan, Jr., Oghenowede Eyawo, and Sanni Yaya. 2021. "Dietary Diversity and Undernutrition in Children Aged 6–23 Months in Sub-Saharan Africa" Nutrients 13, no. 10: 3431. https://doi.org/10.3390/nu13103431
APA StyleAboagye, R. G., Seidu, A.-A., Ahinkorah, B. O., Arthur-Holmes, F., Cadri, A., Dadzie, L. K., Hagan, J. E., Jr., Eyawo, O., & Yaya, S. (2021). Dietary Diversity and Undernutrition in Children Aged 6–23 Months in Sub-Saharan Africa. Nutrients, 13(10), 3431. https://doi.org/10.3390/nu13103431