Article

Vitamin D Receptor (VDR) Gene Polymorphism in Patients Diagnosed with Colorectal Cancer

1
Faculty of Biology and Biotechnology, University of Warmia and Mazury, 10-719 Olsztyn, Poland
2
Faculty of Medicine, Collegium Medicum, University of Warmia and Mazury, 10-082 Olsztyn, Poland
3
Department of General Surgery, Faculty of Medical Sciences, Collegium Medicum, University of Warmia and Mazury, 10-082 Olsztyn, Poland
4
Cell Biology and Immunology Group, Department of Animal Sciences, Wageningen University and Research, 6700 AH Wageningen, The Netherlands
*
Author to whom correspondence should be addressed.
Nutrients 2021, 13(1), 200; https://doi.org/10.3390/nu13010200
Submission received: 9 November 2020 / Revised: 2 January 2021 / Accepted: 7 January 2021 / Published: 11 January 2021

Abstract

:
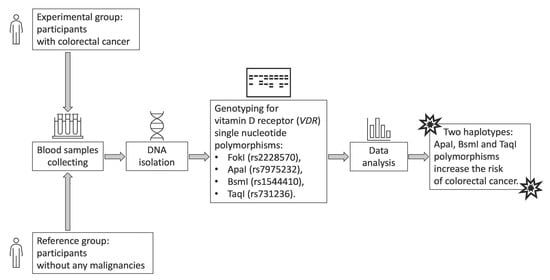
Colorectal cancer (CRC) is one of the most commonly occurring neoplasias in humans. The prevalence of CRC rates is still rising. Although the exact background of the disease still remains unknown, it is believed that CRC may not only be a result of environmental factors, but also genetic ones. One of the mechanisms underlying CRC might be the vitamin D pathway, as CRC is the most closely linked neoplasia to vitamin D deficiency. This study shows a possible association of the vitamin D receptor (VDR) polymorphisms FokI, BsmI, ApaI, and TaqI with CRC susceptibility. A total of 103 patients diagnosed with CRC (61 men and 42 women, aged 57–82 years) and 109 healthy people (50 men and 59 women, aged 47–68 years) were genotyped using PCR-RFLP for FokI, BsmI, ApaI, and TaqI. None of the single nucleotide polymorphisms (SNPs) individually increased or decreased the risk of CRC. The evaluation of haplotypes revealed two that might enhance the likelihood of CRC development: taB (OR = 30.22; 95% CI 2.81–325.31; p = 0.01) and tAb (OR = 3.84; 95% CI 1.29–11.38; p = 0.01). In conclusion, genotyping is an easy and robust procedure that needs to be performed only once in a lifetime. A creation of a relevant SNP’s panel might contribute to the identification of the groups that are at the greatest risk of CRC.

Graphical Abstract

1. Introduction

According to WHO (World Health Organization) predictions, in 2040 the number of new colorectal cancer (CRC) cases will exceed 3 million and over 1.5 million deaths will be recorded worldwide [1]. Currently, CRC is one of the most commonly occurring neoplasias in humans, as well as one of the most lethal [2]. This is not expected to change in the future, for the Polish population, as well [1].
Less than 5% of CRC cases are cancers in people with genetic predisposition (e.g., familial adenomatous polyposis). Factors increasing the risk of CRC with adequate evidence from scientific reports includes the following: excessive alcohol use, cigarette smoking, obesity, and lack of physical activity [3]. For vitamin D, the data is contradictory, so it is not included on the factor list. However, basic science and preclinical studies strongly suggest that vitamin D is crucial to the appropriate regulation of cancer-relevant pathways: promotion of differentiation and apoptosis with inhibition of proliferation, inflammation, invasion, and metastasis angiogenesis at the same time [4]. Because of its wide availability, low price, and relative safety of supplementation, it is worth avoiding vitamin D deficiency [4].
Moreover, the active form of vitamin D (calcitriol or 1,25(OH)2D) has been demonstrated as inhibiting protumoral action of fibroblasts in CRC stroma via vitamin D receptor (VDR) [5]. Its suppressing function of the Wnt/ß-catenin signaling pathway limits proliferation (this pathway is presumably vital to colorectal carcinogenesis) [6,7]. Procancer effect of SNAIL (zinc finger protein SNAI1) might be associated with a reduction of VDR expression [8].
A steroid intracellular hormone receptor, VDR can be liganded only after the addition of two hydroxyl groups (Figure 1). The intestine is recognized as the organ with the highest expression of VDR [9]. In one study, VDR-null mice were more likely to develop carcinogen-induced cancer [10].
In the case of high VDR expression in tumor stromal fibroblasts, overall survival (OS) was better [8]. Apart from VDR expression, enzyme CYP27B1 is also produced, so the cancer cell is capable of generating ligands for VDR [11].
The location of the VDR gene is the long arm of chromosome 12 (12q13.11), and it consists of 12 exons [12]. Among numerous single nucleotide polymorphisms (SNPs), a few are most commonly studied: FokI (rs2228570), ApaI (rs7975232), BsmI (rs1544410), and TaqI (rs731236) (Figure 2).
Despite the large amount of research and data collected on polymorphisms in VDR, it has not yet been clearly established if any of them may affect the risk of CRC [15]. Therefore, further work is essential. Here, the genetic association of four different VDR polymorphisms (ApaI, BsmI, TaqI, and FokI) with susceptibility to colorectal neoplasm was investigated.

2. Materials and Methods

2.1. Control and Patient Characteristics

Table 1 provides detailed information (sex, age) about our study groups, all of whom were Caucasian. A total of 103 patients diagnosed with CRC (61 men and 42 women, aged 57–82 years, with mean age 71.4 ± 1.8 years) and 109 healthy people (50 men and 59 women, aged 47–68 years, with mean age 58.6 ± 1.3 years) were recruited between 2011 and 2016 at the Independent Public Health Care Institution of the Ministry of the Interior and Administration with the Warmian-Masurian Oncology Center in Olsztyn.
Adenocarcinoma was the diagnosis for all 103 cancer patients, and CRC advancement stages were defined by post-surgical histopathology and clinical evaluation in accordance with TNM Classification of Malignant Tumors. For 23 patients, their tumor stage was I; for 30 patients, their tumor stage was II; for 27 patients, their tumor stage was III; and for 23 patients, their tumor stage was IV. In both cohorts, inflammatory diseases, urogenital tract or other infections, and kidney failures were not observed. This was confirmed by laboratory tests. All required data was collected from patient medical records and/or a filled-in questionnaire. All participants gave informed consent to the study, which was in accordance to ethical standards of the Declaration of Helsinki. It was certified by the Local Bioethics Commission (OIL.492/12/Bioet; 48/2019).

2.2. Material Analysis

Approximately 2.0 mL of peripheral blood was collected from 212 participants (103 patients with colorectal cancer and 109 participants in the control group) into a tube containing EDTA (ethylenediaminetetraacetic acid).
GeneJET™ Whole Blood Genomic DNA Purification Mini Kit (Thermo Scientific, Waltham, MA, USA) was used to isolate genomic DNA from peripheral blood nuclear cells; the procedure was performed according to the manufacturer’s protocol.
The chosen method for genotyping all four of the VDR polymorphisms (FokI, BsmI, ApaI, and TaqI) was polymerase chain reaction-restriction fragment length polymorphism (PCR-RFLP). The sequences of the primers used for amplification are presented in Table 2 (F—forward primer, R—reverse primer).
PCR amplification was conducted in a thermal cycler according to the following program: initial denaturation: 95 °C for 5 min; proper denaturation: 95 °C for 30 s; attaching the starters at 61 °C for 30 s; synthesis: 72 °C for 60 s; final synthesis: 72 °C for 10 min; number of cycles: 35; cooling: 4 °C.
The mixture for amplification in the volume of 17.5 μL consisted of DreamTaq™ Green Master Mix (Thermo Scientific, Waltham, MA, USA), specific primers, the DNA matrix, and nuclease-free water (Thermo Scientific, Waltham, MA, USA). The yield and specificity of PCR products were evaluated by electrophoresis in 2.5% agarose gel (Promega, Fitchburg, WI, USA) and staining with GelGreen Nucleic Acid Gel Stain (Biotium, Fremont, CA, USA). Amplified fragments were digested with corresponding restriction enzymes shown in Table 2 (Thermo Scientific, Waltham, MA, USA) according to the manufacturer’s instruction and visualized on a 2.5% agarose gel (Table 3). DNA sequencing of random chosen samples after amplification was performed to confirm proper genotyping.

2.3. Statistical Analysis

Using chi-square test, the genotype distribution among subjects in the control group was analyzed for Hardy–Weinberg equilibrium (HWE) for each SNP; with the same test, the p-value for age and gender was established; standard errors of the mean (SEMs) were counted for age. With SHEsis software, the analysis of linkage disequilibrium (LD), haplotype construction, and general genetic association were performed [19,20]. Odds ratios (ORs) and 95% confidence intervals (CIs) were calculated to set the association between alleles and genotypes. Statistical analysis was conducted on IBM SPSS Statistics 26 (IBM, Armonk, NY, USA) and GenAlEx 6.502 [21] software, with ≤0.05 p-value considered statistically significant, excluding logistic regression: ≤0.0125 adjusted p-value (according to Bonferroni correction).

3. Results

The distribution of all four SNPs genotypes were in Hardy–Weinberg equilibrium in the control group (Table 4).
Table 1 presents the clinical characteristics of the study participants. A discrepancy can be noted between the percentage of men and women in the study and control cohorts When it comes to tumor staging, stage II was the most frequently encountered in histopathology examination. Stage II is localized or node-negative disease, while stage III is regional or node-positive disease [22]. The tumor itself was classified as T3, meaning that the tumor grew through muscularis propria and into subserosa (it is not a total occupation of colorectal wall) or the cancerous cells appeared in the surrounding tissue [22]. The majority of CRC patients had metastasis to lymph nodes but not to distant organs.
Table 5 presents the distribution of alleles and genotypes at the polymorphic sites as well as associations between the genotype and CRC incidence. For TaqI polymorphism, allele t was far more common in the CRC group (43%) than in the control group (29%). At first, a comparison of genotypes TT vs. Tt, then TT vs. tt showed that TT decreased the risk of CRC by over two times (OR = 0.39; 95% CI 0.22–0.72; p = 0.002 and OR = 0.37; 95% CI 0.15–0.89; p = 0.027, respectively). Possessing at least one allele t at the polymorphic site seemed to be a CRC risk factor (Tt + tt vs. TT: OR = 2.60; 95% CI 1.66–4.07; p < 0.0001, T vs. t: OR = 0.55; 95% CI 0.37–0.82; p = 0.003). However, after performing logistic regression, neither TaqI genotypes nor alleles showed a statistically significant association with CRC susceptibility (for p ≤ 0.0125; TT vs. Tt: adjusted OR = 0.36; 95% CI 0.15–0.83; p = 0.016, TT vs. tt: adjusted OR = 0.31; 95% CI 0.09–1.09; p = 0.68, T vs. t: adjusted OR = 0.50; 95% CI 0.29–0.88; p = 0.017).
No correlation between ApaI genotypes or alleles and susceptibility of CRC was observed. The same was observed for FokI.
In the case of the BsmI polymorphism, allele b looked to be protective against CRC (bb vs. BB + Bb: OR = 1.64; 95% CI 1.05–2.54; p = 0.0287). However, logistic regression did not confirm those results (bb vs. Bb: OR = 1.05; 95% CI 0.30–3.71; p = 0.19; bb vs. BB: adjusted OR = 1.73; 95% CI 0.77–3.91; p = 0.93; b vs. B: adjusted OR = 1.20; 95% CI 0.69–2.11; p = 0.52).
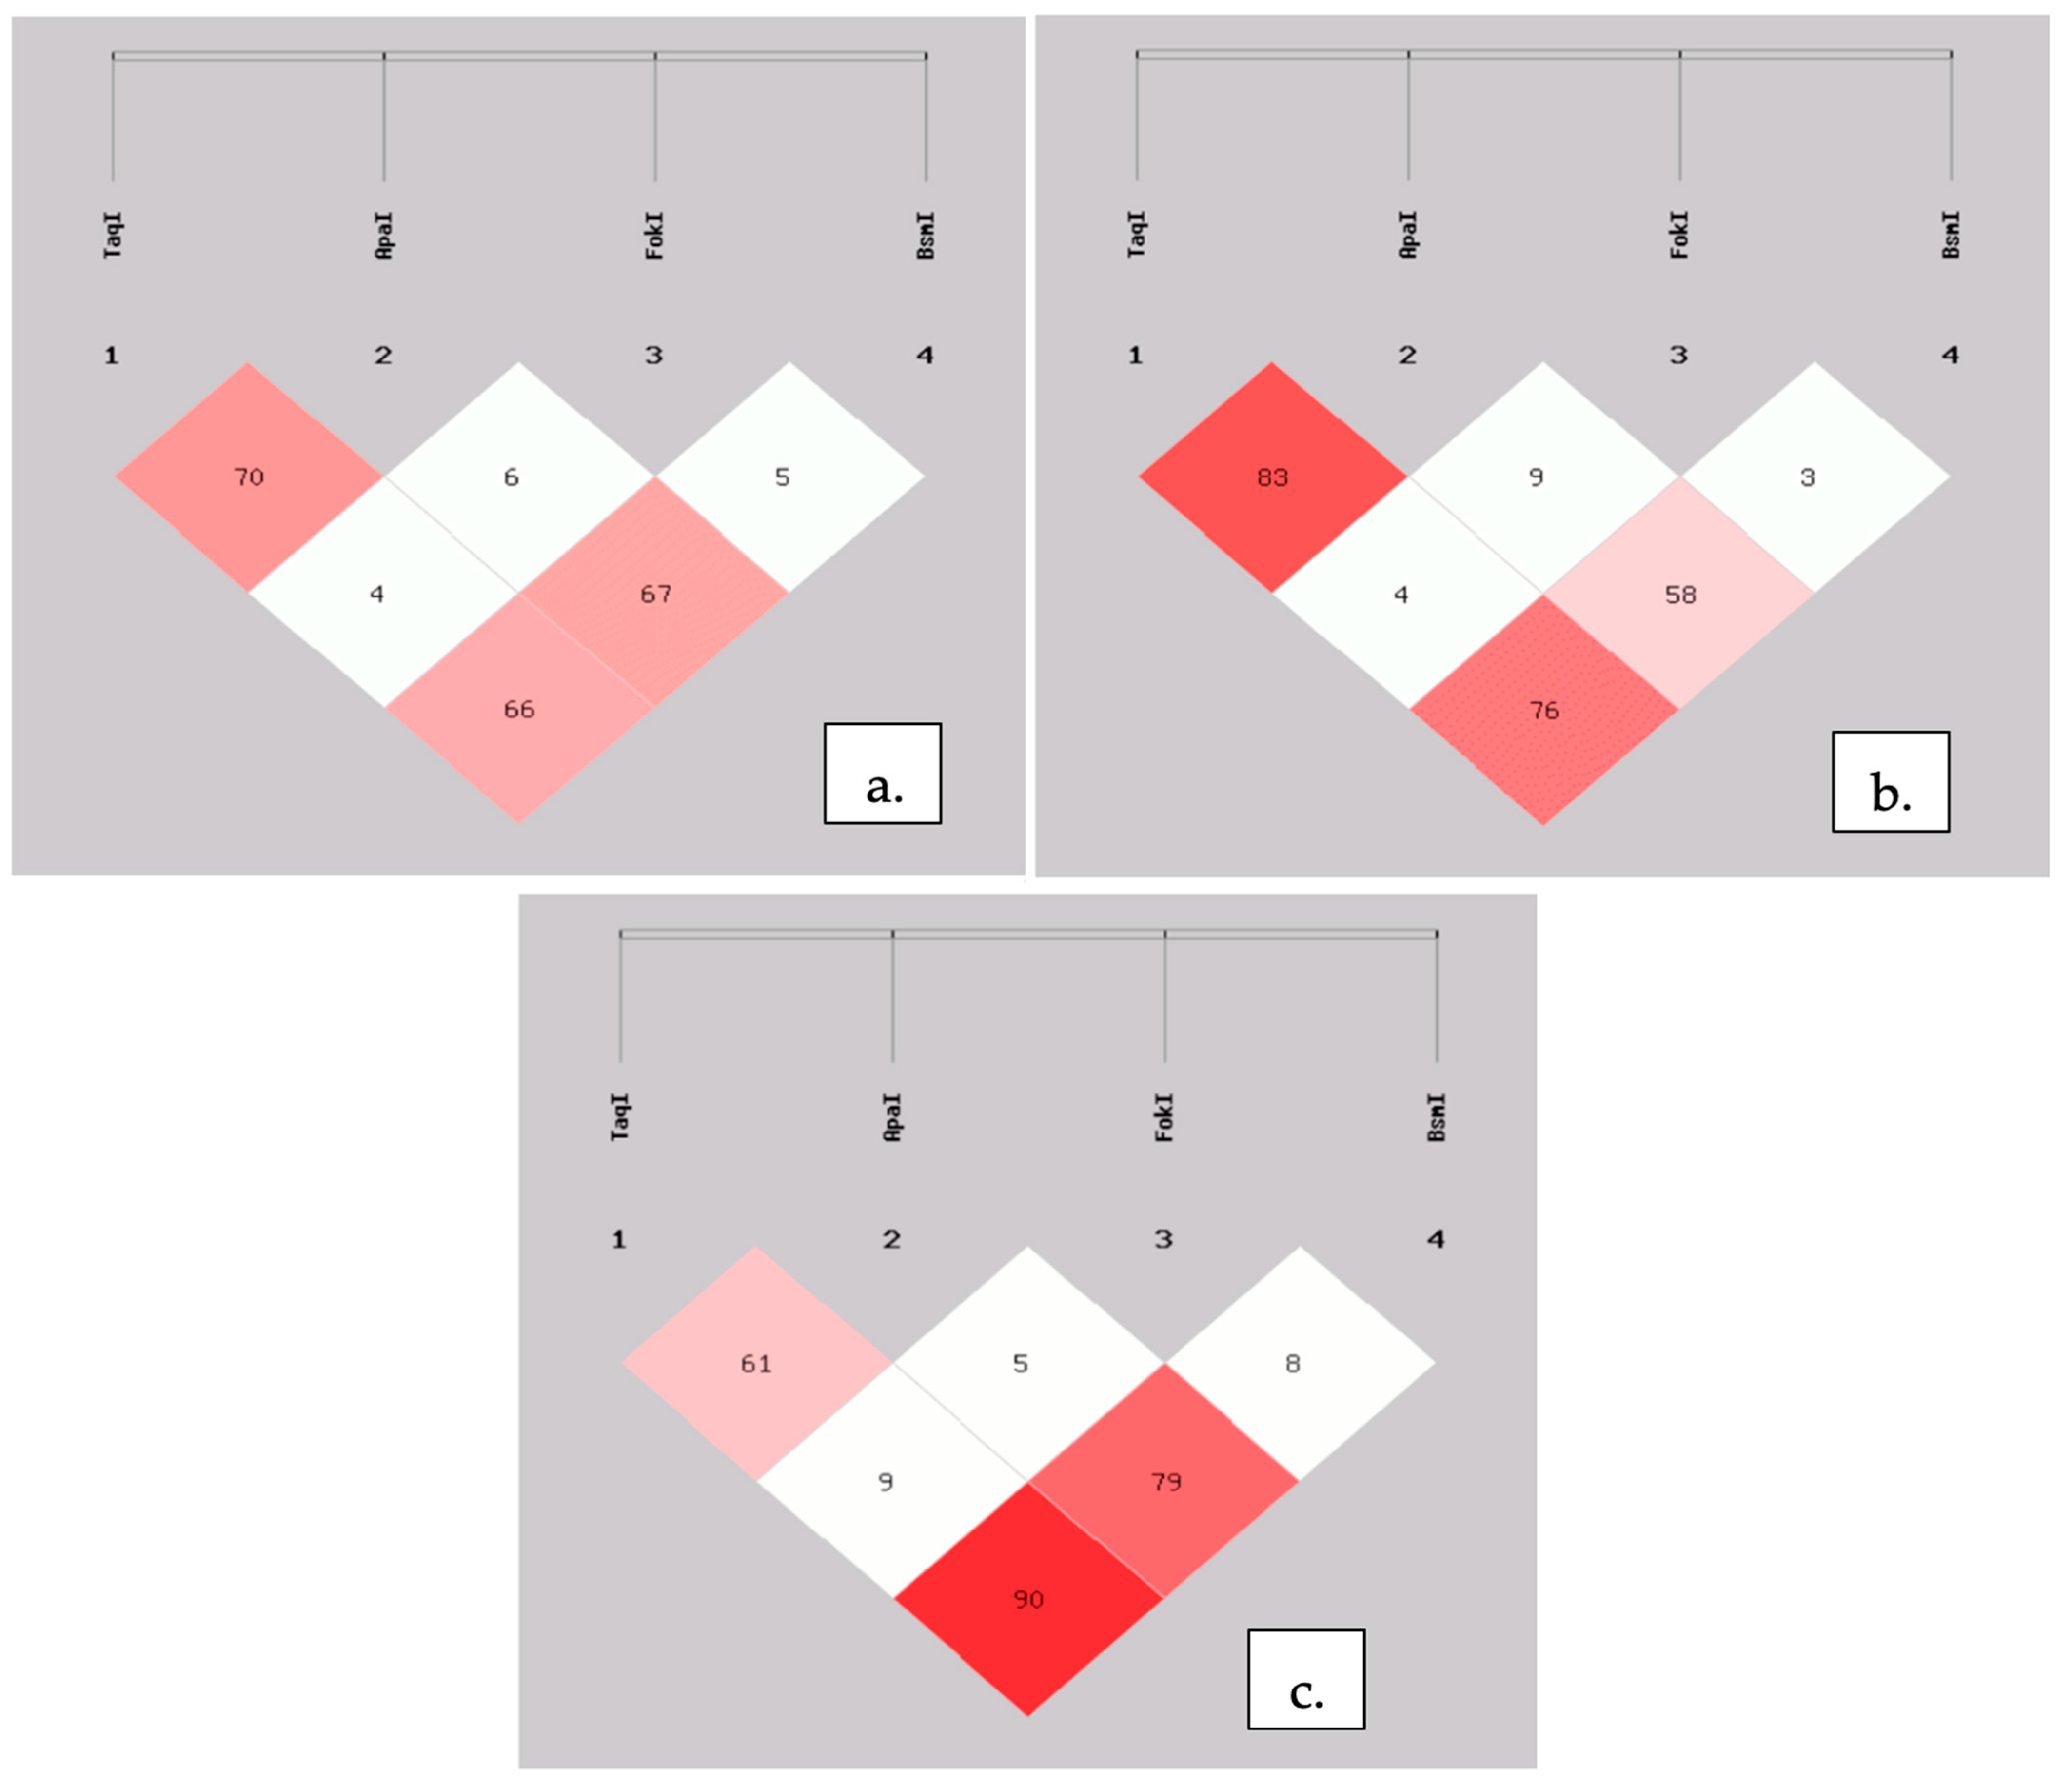
With SHEsis software, we created haplotypes plots (Figure 3). Obtained results were quite similar to those presented in LDlink tool for the European population [23]. For further analysis of haplotypes, FokI polymorphism was excluded, on account of its very low LD between other SNPs (Figure 3).
We identified two haplotypes that significantly increase the risk of CRC. For tAb nearly a fourfold increase in risk was observed (OR = 3.84; 95% CI 1.29–11.38; p = 0.01), while for taB the likelihood of malignancy in colon or rectum was noted to be thirty times greater (OR = 30.22; 95% CI 2.81–325.31; p = 0.01) (Table 6).
Table 7 presents the frequencies of BsmI, ApaI, and TaqI combined genotypes in the CRC group and in the control group. Comparing the genotypes with ttAaBb, ttaaBB, or ttAAbb as the reference genotype (possession of two “risky” haplotypes) could be highly questionable, since their prevalence is very low. Instead, TtAaBb was chosen because it possessed one risk-increasing haplotype and was relatively frequent in the study groups. It was found more often in the control group (30.28%). Our further analysis included only combined genotypes with a frequency of at least 3% in one of the groups. The results were as follows: TtAaBb vs. TTaaBb: OR = 19.78; 95% CI 1.12–349.60; p = 0.04; TtAaBb vs. TtAabb: OR = 0.07; 95% CI 0.01–0.59; p = 0.01 and, interestingly, TtAaBb vs. Ttaabb: OR = 0.10; 95% CI 0.01–0.84; p = 0.03.

4. Discussion

Due to the current and projected increasing number of CRC cases and associated mortality, this neoplasm is expected be one of the greatest burdens in oncology. Determining further factors influencing the etiopathogenesis or the course of the illness should be a priority.
It was previously mentioned that less than 5% of CRC cases are cancers in people with genetic predisposition [3], but heritable factors explain about 35% of the risk of CRC [24] and may influence the variability of vitamin D status [25]. The location of three out of four polymorphisms (ApaI, TaqI, and BsmI) is 3′UTR, and this region is mainly responsible for expression regulation (mRNA stability) [26]. Therefore, it is possible for these polymorphisms to disturb vitamin D pathway.
The obtained results (Table 5) first suggested a significant impact of TaqI and BsmI polymorphisms on the occurrence of CRC. Collected data indicated a potential unprotective role of the t allele (Tt + tt vs. TT: OR = 2.60; 95% CI 1.66–4.07; p < 0.0001; T vs. t: OR = 0.55; 95% CI 0.37–0.82; p = 0.003), but after performing logistic regression the genotypes did not show any correlations (TT vs. Tt: adjusted OR = 0.36; 95% CI 0.15–0.83; p = 0.016; TT vs. tt: adjusted OR = 0.31; 95% CI 0.09–1.09; p = 0.068). The p-value for TT vs. Tt was nearly statistically significant, but it slightly exceeded 0.0125. There was a similar situation for BsmI: initially, it was flagged as potentially being a CRC prognostic factor, but not after adjustment (bb vs. Bb: adjusted OR = 1.05; 95% CI 0.30–3.71; p = 0.19, bb vs. BB: adjusted OR = 1.73; 95% CI 0.77–3.91; p = 0.93).
A Polish population-based study with a similar number of participants demonstrated TT genotype as a risk factor and also a statistically significant association for ApaI [27]. Touvier et al. created a meta-analysis that included 23 articles reflecting on VDR polymorphisms in colorectal cancer. They found only the BsmI polymorphism to be statistically significant in lowering neoplasm risk (RR = 0.57, 95% CI: 0.36–0.89 for BB vs. bb) [28]. Another meta-analysis included 10 articles, and the authors established [29] an association between CRC risk and TaqI polymorphism (OR = 1.43, 95% CI: 1.30–1.58 for tt vs. TT).
A meta-analysis based on 39 case-control studies showed not only polymorphisms Fok I, Bsm I, Apa I, and Taq I but also Cdx2 as being possible risk factors for CRC. However, the study did not show a significant correlation between Apa I, Taq I, Bsm I, Fok I, Cdx2, and higher CRC risk [30]. On the other hand, a study confirmed the existing association of vitamin D deficiency with increased risk of CRC and mortality. All of the four VDR polymorphisms were revealed as significant among cancer individuals with the following homozygous mutant genotypes: aa, bb, ff, and tt. Patients with stage IV CRC had all of those mutant genotypes. The result suggests there may be higher mortality among patients with homozygous mutant genotypes compared with heterozygous ones [31].
Investigations of haplotypes and combined genotypes is not present in as many papers as sole polymorphism impacts on CRC risk. Furthermore, it can be difficult to compare the results between works establishing associations for different polymorphisms at the same time because of different blocks of SNPs.
For our study, two haplotypes that put the carrier at greater risk were identified: tAb (OR = 3.84; 95% CI 1.29–11.38; p = 0.01) and especially taB (OR = 30.22; 95% CI 2.81–325.31; p = 0.01).
For example, in a previous study on the Thai population, none of the polymorphisms modulated the risk of CRC singly. However, AGGT was found to be protective [32]. Translating this into our manner of showing haplotypes, this would T, a, b at the polymorphic sites, with an allele at Tru9I that was not taken into account in our study. These findings are similar to ours; for single polymorphisms, the results are mixed or not statistically significant, but there are valuable findings after the haplotypes analysis presents the most important haplotypes. A study based on the Newfoundland population investigated TaqI and BsmI polymorphism in one block for CRC survival and found no relevant association [33]. Ashmore et al. determined null results with CRC for both sole SNPs in VDR gene and haplotypes [34].
Apart from considering the direct correlation between CRC occurrence and SNPs, there are studies that reflect on the association in an indirect way. Al-Ghafari et al. investigated a possible relationship between serum 25(OH)D and polymorphism. Their findings indicated that ApaI is an important factor affecting the level of vitamin D and that TaqI is a modificatory of serum calcium level [35].
Higher intakes of vitamin D and calcium have been associated with almost a 50% reduction in colorectal cancer risk among the Chinese population [36].
We are fully aware of the limitations in our study in that our study groups were limited in size and our study participants represented only one race and one nationality. That could be the reason for contradictory results for haplotypes and combined genotypes—a genotype with an earlier identified risky haplotype decreased the risk of CRC compared to a genotype without such an allele (TtAaBb vs. Ttaabb: OR = 0.10; 95% CI 0.01–0.84; p = 0.03). Nevertheless, in two other cases, the calculated value of OR was the same as expected due to the presence of a risky haplotype (TtAaBb vs. TTaaBb: OR = 19.78; 95% CI 1.12–349.60; p = 0.04; TtAaBb vs. TtAabb: OR = 0.07; 95% CI 0.01–0.59; p = 0.01).
Our conclusion is that genotyping is an easy and robust procedure that needs to be performed only once in a lifetime. The creation of a relevant SNPs panel/haplotypes might contribute to the identification of people at the greatest risk of CRC and help direct them toward receiving dedicated oncologic surveillance. The investigation of haplotypes in CRC is not as well represented in science as separate investigations of SNPs. Our study contributed to the identification of VDR haplotypes in representatives of a European population with one of the highest mortalities (current: 59% and expected in 20 years: 64%) [1].

Author Contributions

Conceptualization: A.C. and M.L.; methodology: A.C.; investigation: M.L. and D.R.; writing—original draft preparation: M.L., D.R. and A.C.; writing—review and editing: E.F., J.S., B.J., N.K., H.S. and A.C.; visualization: M.L. and D.R.; resources: J.S.; supervision: A.C. All authors have read and agreed to the published version of the manuscript.

Funding

This research received no external funding.

Institutional Review Board Statement

The study was conducted according to the guidelines of the Declaration of Helsinki, and approved by the Ethics Committee of Faculty of Medicine, University of Warmia and Mazury in Olsztyn, Poland (ref. no. 48/2019, 25 April 2019).

Informed Consent Statement

Informed consent was obtained from all subjects involved in the study.

Data Availability Statement

Detailed information is available upon request.

Conflicts of Interest

The authors declare no conflict of interest.

References

  1. WHO: Cancer Tomorrow. Available online: http://gco.iarc.fr/tomorrow/home (accessed on 8 November 2020).
  2. Bray, F.; Ferlay, J.; Soerjomataram, I.; Siegel, R.L.; Torre, L.A.; Jemal, A. Global cancer statistics 2018: GLOBOCAN estimates of incidence and mortality worldwide for 36 cancers in 185 countries. CA Cancer J. Clin. 2018, 68, 394–424. [Google Scholar] [CrossRef] [PubMed] [Green Version]
  3. Colorectal Cancer Prevention (PDQ®)–Health Professional Version—National Cancer Institute. Available online: https://www.cancer.gov/types/colorectal/hp/colorectal-prevention-pdq (accessed on 8 November 2020).
  4. Feldman, D.; Krishnan, A.V.; Swami, S.; Giovannucci, E.; Feldman, B.J. The role of vitamin D in reducing cancer risk and progression. Nat. Rev. Cancer 2014, 14, 342–357. [Google Scholar] [CrossRef] [PubMed]
  5. Ferrer-Mayorga, G.; Gómez-López, G.; Barbáchano, A.; Fernández-Barral, A.; Peña, C.; Pisano, D.G.; Cantero, R.; Rojo, F.; Muñoz, A.; Larriba, M.J. Vitamin D receptor expression and associated gene signature in tumour stromal fibroblasts predict clinical outcome in colorectal cancer. Gut 2017, 1449–1462. [Google Scholar] [CrossRef] [PubMed]
  6. Munemitsu, S.; Albert, I.; Souza, B.; Rubinfeld, B.; Polakis, P. Regulation of intracellular beta-catenin levels by the adenomatous polyposis coli (APC) tumor-suppressor protein. Proc. Natl. Acad. Sci. USA 1995, 92, 3046–3050. [Google Scholar] [CrossRef] [Green Version]
  7. Pereira, F.; Larriba, M.J.; Muñoz, A. Vitamin D and colon cancer. Endocr. Relat. Cancer 2012, 19, R51–R71. [Google Scholar] [CrossRef] [Green Version]
  8. Larriba, M.J.; Muñoz, A. SNAIL vs. vitamin D receptor expression in colon cancer: Therapeutics implications. Br. J. Cancer 2005, 92, 985–989. [Google Scholar] [CrossRef] [Green Version]
  9. Veldman, C.M.; Cantorna, M.T.; DeLuca, H.F. Expression of 1,25-dihydroxyvitamin D(3) receptor in the immune system. Arch. Biochem. Biophys. 2000, 374, 334–338. [Google Scholar] [CrossRef]
  10. Zinser, G.M.; Sundberg, J.P.; Welsh, J. Vitamin D(3) receptor ablation sensitizes skin to chemically induced tumorigenesis. Carcinogenesis 2002, 23, 2103–2109. [Google Scholar] [CrossRef]
  11. Bises, G.; Kállay, E.; Weiland, T.; Wrba, F.; Wenzl, E.; Bonner, E.; Kriwanek, S.; Obrist, P.; Cross, H.S. 25-Hydroxyvitamin D3-1α-hydroxylase Expression in Normal and Malignant Human Colon. J. Histochem. Cytochem. 2004, 52, 985–989. [Google Scholar] [CrossRef] [Green Version]
  12. VDR vitamin D Receptor [Homo Sapiens (Human)]—Gene—NCBI. Available online: https://www.ncbi.nlm.nih.gov/gene?Db=gene&Cmd=DetailsSearch&Term=7421 (accessed on 8 November 2020).
  13. Jenkinson, C. The vitamin D metabolome: An update on analysis and function. Cell Biochem. Funct. 2019, 37, 408–423. [Google Scholar] [CrossRef]
  14. Dou, R.; Ng, K.; Giovannucci, E.L.; Manson, J.E.; Qian, Z.R.; Ogino, S. Vitamin D and colorectal cancer: Molecular, epidemiological and clinical evidence. Br. J. Nutr. 2016, 115, 1643–1660. [Google Scholar] [CrossRef] [PubMed] [Green Version]
  15. Gandini, S.; Gnagnarella, P.; Serrano, D.; Pasquali, E.; Raimondi, S. Vitamin D Receptor Polymorphisms and Cancer. In Sunlight, Vitamin D and Skin Cancer; Reichrath, J., Ed.; Springer: New York, NY, USA, 2014; Chapter 5; pp. 69–105. [Google Scholar]
  16. Maalmi, H.; Sassi, F.H.; Berraies, A.; Ammar, J.; Hamzaoui, K.; Hamzaoui, A. Association of vitamin D receptor gene polymorphisms with susceptibility to asthma in Tunisian children: A case control study. Hum. Immunol. 2013, 74, 234–240. [Google Scholar] [CrossRef] [PubMed]
  17. Mansour, L.; Sedky, M.; AbdelKhader, M.; Sabry, R.; Kamal, M.; El-Sawah, H. The role of vitamin D receptor genes (FOKI and BSMI) polymorphism in osteoporosis. Middle East Fertil. Soc. J. 2010, 15, 79–83. [Google Scholar] [CrossRef]
  18. Koressaar, T.; Remm, M. Enhancements and modifications of primer design program Primer3. Bioinformatics 2007, 23, 1289–1291. [Google Scholar] [CrossRef] [Green Version]
  19. Shi, Y.Y.; He, L. SHEsis, a powerful software platform for analyses of linkage disequilibrium, haplotype construction, and genetic association at polymorphism loci. Cell Res. 2005, 15, 97–98. [Google Scholar] [CrossRef]
  20. Li, Z.; Zhang, Z.; He, Z.; Tang, W.; Li, T.; Zeng, Z.; He, L.; Shi, Y. A partition-ligation-combination-subdivision EM algorithm for haplotype inference with multiallelic markers: Update of the SHEsis (http://analysis.bio-x.cn). Cell Res. 2009, 19, 519–523. [Google Scholar] [CrossRef]
  21. Smouse, P.E.; Whitehead, M.R.; Peakall, R. An informational diversity framework, illustrated with sexually deceptive orchids in early stages of speciation. Mol. Ecol. Resour. 2015, 15, 1375–1384. [Google Scholar] [CrossRef]
  22. Colorectal Cancer—Stages. Available online: https://www.cancer.net/cancer-types/colorectal-cancer/stages (accessed on 8 November 2020).
  23. LDlink. Available online: https://ldlink.nci.nih.gov/?tab=home (accessed on 8 November 2020).
  24. Lichtenstein, P.; Holm, N.V.; Verkasalo, P.K.; Iliadou, A.; Kaprio, J.; Koskenvuo, M.; Pukkala, E.; Skytthe, A.; Hemminki, K. Environmental and heritable factors in the causation of cancer--analyses of cohorts of twins from Sweden, Denmark, and Finland. N. Engl. J. Med. 2000, 343, 78–85. [Google Scholar] [CrossRef]
  25. Shea, M.K.; Benjamin, E.J.; Dupuis, J.; Massaro, J.M.; Jacques, P.F.; D’Agostino, R.B., Sr.; Ordovas, J.M.; O’Donnell, C.J.; Dawson-Hughes, B.; Vasan, R.S.; et al. Genetic and non-genetic correlates of vitamins K and D. Eur. J. Clin. Nutr. 2009, 63, 458–464. [Google Scholar] [CrossRef] [Green Version]
  26. Uitterlinden, A.G.; Fang, Y.; Van Meurs, J.B.; Pols, H.A.; Van Leeuwen, J.P. Genetics and biology of vitamin D receptor polymorphisms. Gene 2004, 338, 143–156. [Google Scholar] [CrossRef] [Green Version]
  27. Laczmanska, I.; Laczmanski, L.; Bebenek, M.; Karpinski, P.; Czemarmazowicz, H.; Ramsey, D.; Milewicz, A.; Sasiadek, M.M. Vitamin D receptor gene polymorphisms in relation to the risk of colorectal cancer in the Polish population. Tumour Biol. 2004, 35, 12397–12401. [Google Scholar] [CrossRef] [PubMed] [Green Version]
  28. Touvier, M.; Chan, D.S.; Lau, R.; Aune, D.; Vieira, R.; Greenwood, D.C.; Kampman, E.; Riboli, E.; Hercberg, S.; Norat, T. Meta-analyses of vitamin D intake, 25-hydroxyvitamin D status, vitamin D receptor polymorphisms, and colorectal cancer risk. Cancer Epidemiol. Biomark. Prev. 2011, 20, 1003–1016. [Google Scholar] [CrossRef] [PubMed] [Green Version]
  29. Serrano, D.; Gnagnarella, P.; Raimondi, S.; Gandini, S. Meta-analysis on vitamin D receptor and cancer risk: Focus on the role of TaqI, ApaI, and Cdx2 polymorphisms. Eur. J. Cancer Prev. 2016, 25, 85–96. [Google Scholar] [CrossRef] [PubMed]
  30. Pan, Z.; Chen, M.; Hu, X.; Wang, H.; Yang, J.; Zhang, C.; Pan, F.; Sun, G. Associations between VDR gene polymorphisms and colorectal cancer susceptibility: An updated meta-analysis based on 39 case-control studies. Oncotarget 2018, 9, 13068–13076. [Google Scholar] [CrossRef] [PubMed] [Green Version]
  31. Messaritakis, I.; Koulouridi, A.; Sfakianaki, M.; Vogiatzoglou, K.; Gouvas, N.; Athanasakis, E.; Tsiaoussis, J.; Xynos, E.; Mavroudis, D.; Tzardi, M.; et al. The Role of Vitamin D Receptor Gene Polymorphisms in Colorectal Cancer Risk. Cancers 2020, 12, 1379. [Google Scholar] [CrossRef] [PubMed]
  32. Suksawatamnuay, S.; Sriphoosanaphan, S.; Aumpansub, P.; Aniwan, S.; Thanapirom, K.; Tanasanvimon, S.; Thaimai, P.; Wiangngoen, S.; Ponauthai, Y.; Sumdin, S.; et al. Association between Vitamin D Receptor Single-Nucleotide Polymorphisms and Colorectal Cancer in the Thai Population: A Case-Control Study. BioMed Res. Int. 2020, 2020, 7562958. [Google Scholar] [CrossRef]
  33. Zhu, Y.; Wang, P.P.; Zhai, G.; Bapat, B.; Savas, S.; Woodrow, J.R.; Sharma, I.; Li, Y.; Zhou, X.; Yang, N.; et al. Vitamin D receptor and calcium-sensing receptor polymorphisms and colorectal cancer survival in the Newfoundland population. Br. J. Cancer 2017, 117, 898–906. [Google Scholar] [CrossRef]
  34. Ashmore, J.H.; Gallagher, C.J.; Lesko, S.M.; Muscat, J.E.; Hartman, T.J.; Lazarus, P. No Association Between Vitamin D Intake, VDR Polymorphisms, and Colorectal Cancer in a Population-Based Case-Control Study. Cancer Epidemiol Biomark. Prev. 2015, 24, 1635–1637. [Google Scholar] [CrossRef] [Green Version]
  35. Al-Ghafari, A.B.; Balamash, K.S.; Al Doghaither, H.A. Relationship between Serum Vitamin D and Calcium Levels and Vitamin D Receptor Gene Polymorphisms in Colorectal Cancer. BioMed Res. Int. 2019, 2019, 8571541. [Google Scholar] [CrossRef] [Green Version]
  36. Zhang, X.; Fang, Y.J.; Feng, X.L.; Abulimiti, A.; Huang, C.Y.; Luo, H.; Zhang, C.X. Interactions Between Vitamin D and Calcium Intake, Vitamin D Receptor Genetic Polymorphisms, and Colorectal Cancer Risk. Dig. Dis. Sci. 2020. (online ahead of print). [Google Scholar]
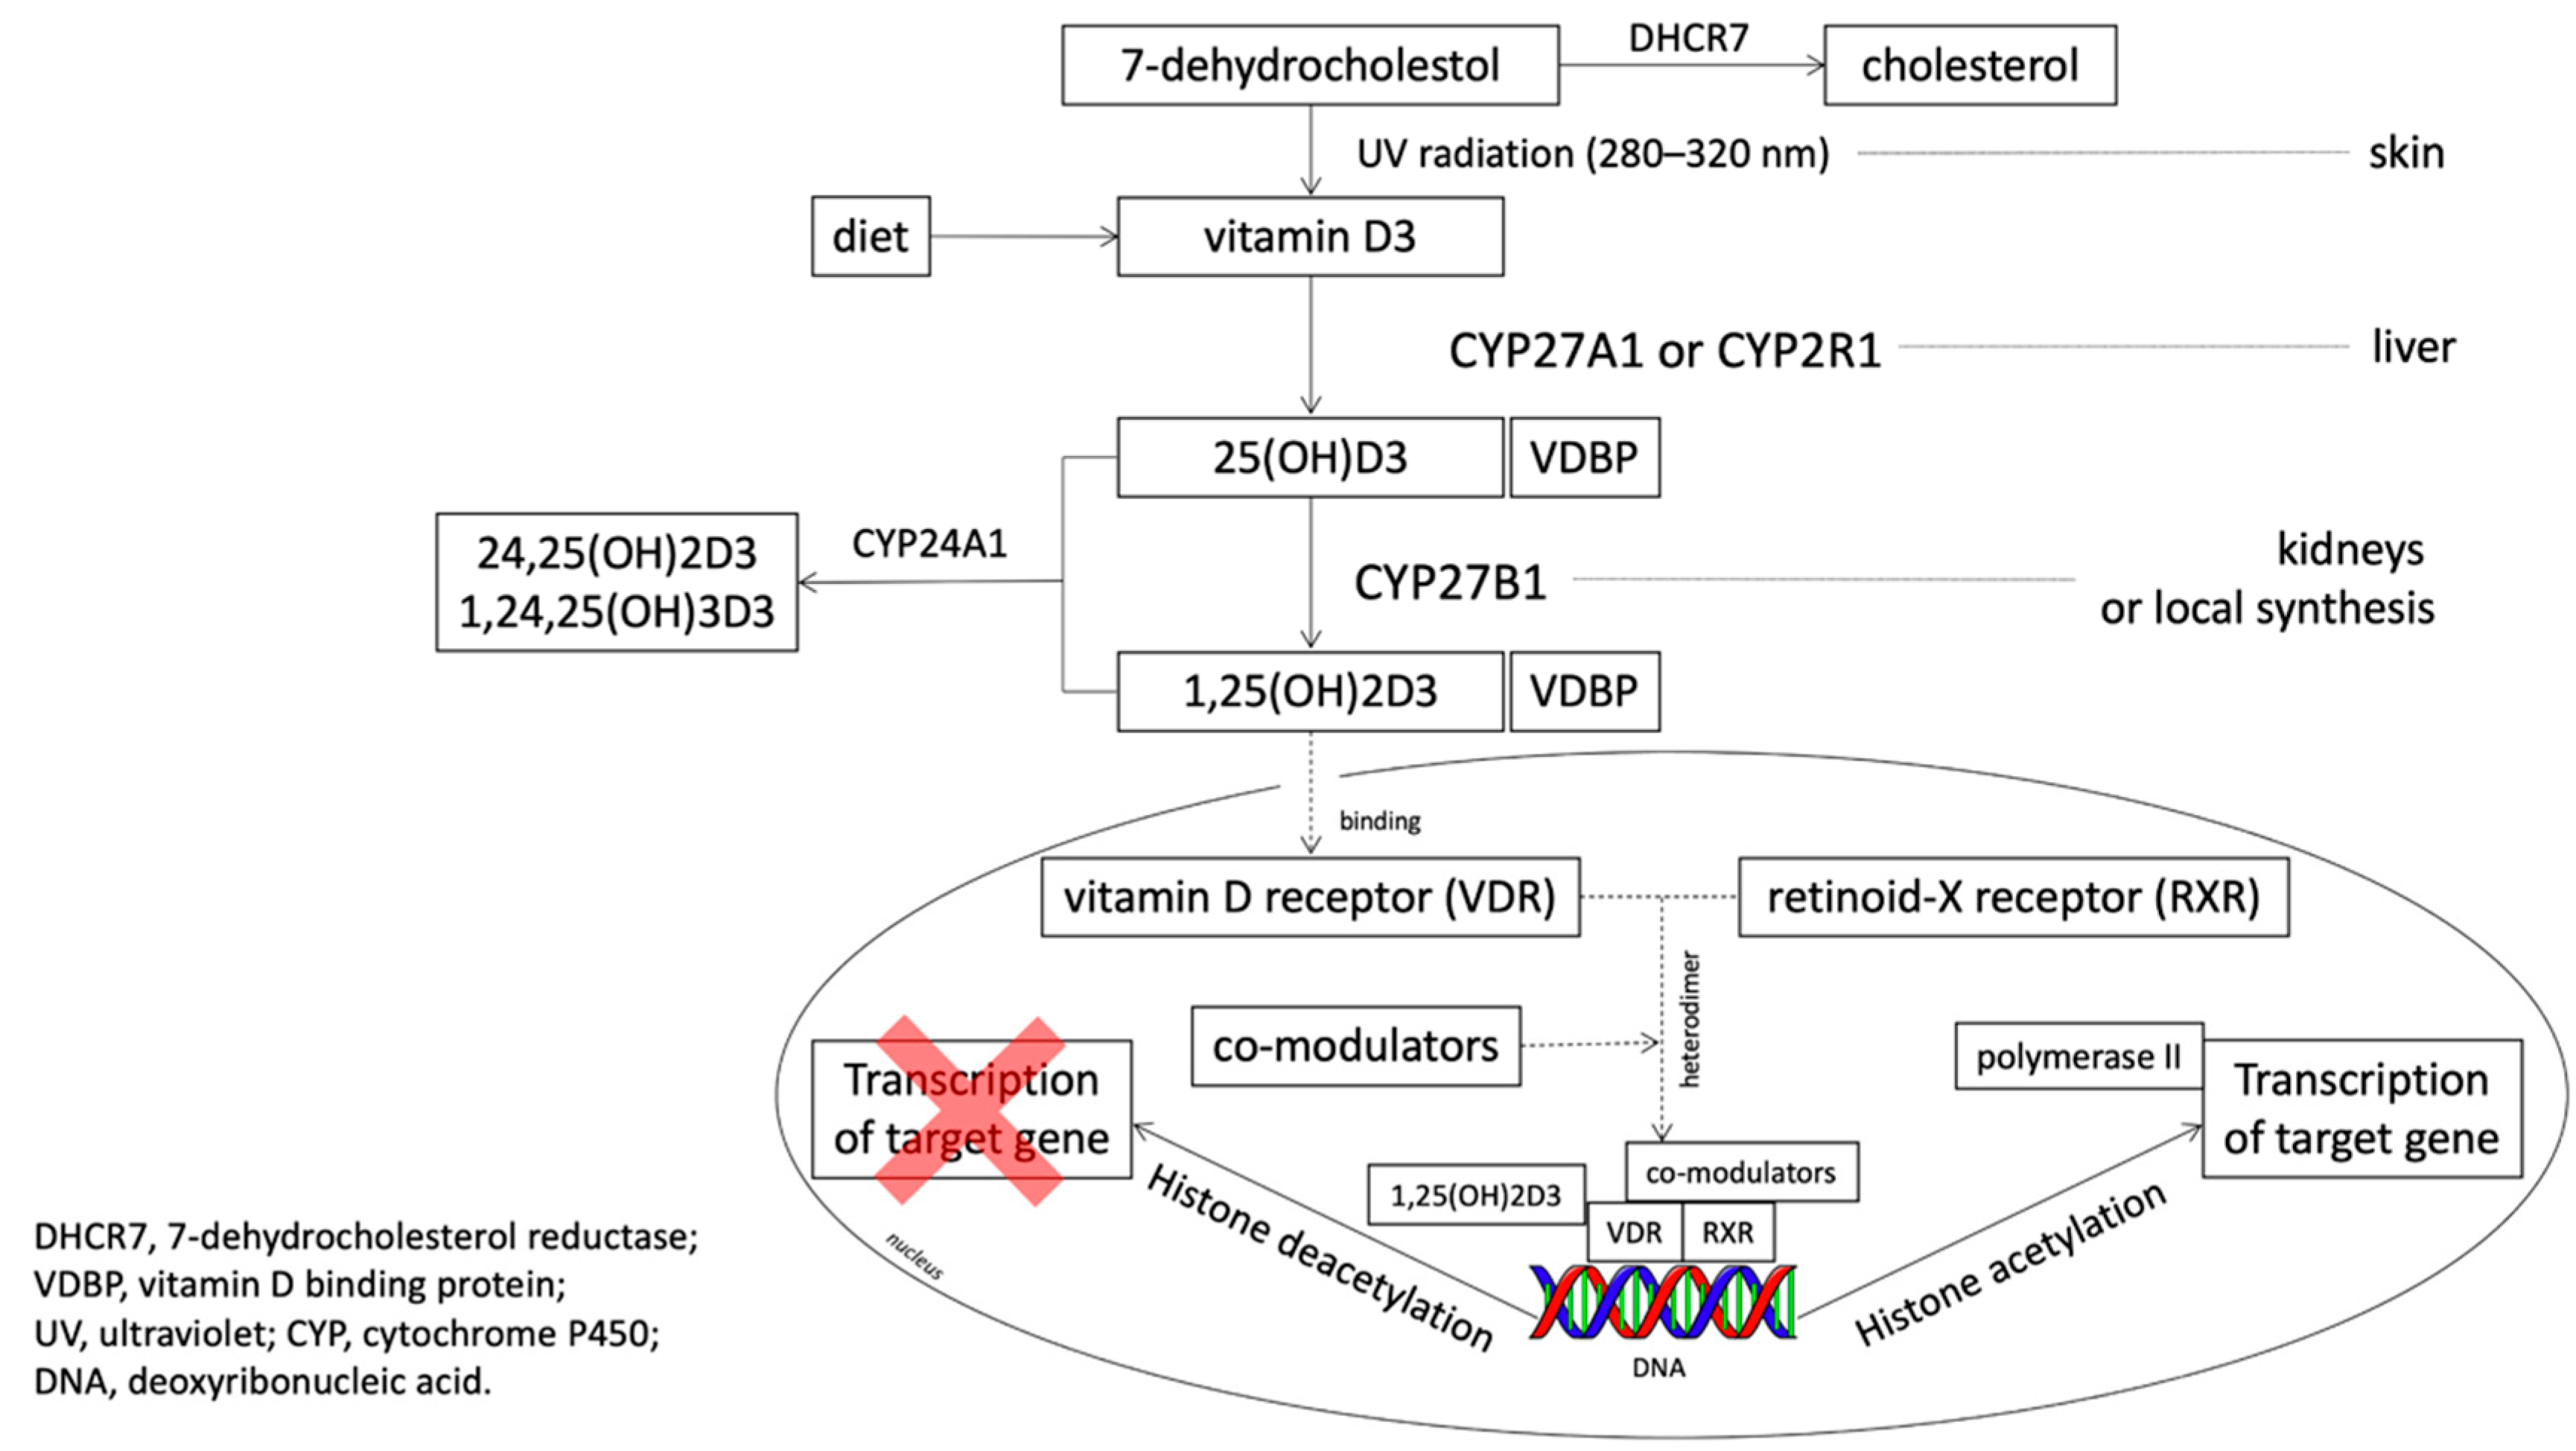
Figure 1. The metabolic pathway of vitamin D (based on Feldman et al., 2014 [4], Jekinson 2019 [13] and Dou et al., 2016 [14] with own modifications).
Nutrients 13 00200 g001
Figure 2. The location and characteristic of VDR polymorphism (based on Single Nucleotide Polymorphism Database—dbSNP).
Nutrients 13 00200 g002
Figure 3. Linkage disequilibrium plots for four investigated SNPs for both groups (a), controls (b), and CRC patients (c). The number represents the percentage value of ‘D, which is also indicated by color intensity.
Nutrients 13 00200 g003
Table 1. Clinical characteristics of patients and participants in the control group. Numbers in brackets indicate the percentage of patients relative to the total group.
CRC Group
(n = 103)
Control Group
(n = 109)
p-Value
Age: years (mean ± SEM)71.4 ± 0.858.6 ± 0.6<0.01
Gender, n (%)
Female42 (41)59 (54)0.052
Male61 (59)50 (46)
Tumor stage, n (%)
I23 (22.3)
II30 (29.1)
III27 (26.3)
IV23 (22.3)
Pathological tumor stage (pT), n (%)
T10 (0)
T221 (20.4)
T363 (61.2)
T419 (18.4)
Pathological nodal status (pN), n (%)
no lymph node metastasis 49 (47.6)
lymph node metastasis54 (52.4)
Pathological metastasis status (pM), n (%)
no distant metastasis64 (62.1)
metastasis to distant organs39 (37.9)
Table 2. Primers for single nucleotide polymorphisms (SNPs) in the VDR gene and restriction enzymes.
SNPPrimer SequenceRestriction EnzymeSource
FokIFok1R: 5-ATGGAAACACCTTGCTTCTTCTCCCTC-3
Fok11F: 5-AGCTGGCCCTGGCACTGACTCtGGCTCT-3
FastDigest Fok-IMaalmi et al., 2013, Mansour et al., 2010 [16,17] with own modifications
ApaIATaq1F: 5-GGATCCTAAATGCACGGAGA-3
ATaq1R: 5-AGGAAAGGGGTTAGGTTGGA-3
FastDigest Apa-IDesigned with Primer 3 application [18]
BsmIABsm1F: 5-CGGGGAGTATGAAGGACAAA-3
ABsm1R: 5-CCATCTCTCAGGCTCCAAAG-3
FastDigest Hha-IDesigned with Primer 3 application [18]
TaqIATaq1F: 5-GGATCCTAAATGCACGGAGA-3
ATaq1R: 5-AGGAAAGGGGTTAGGTTGGA-3
FastDigest Taq-IDesigned with Primer 3 application [18]
Table 3. Pattern for genotyping.
SNPPattern for Genotyping
FokIFF homozygote: 267 bp
Ff heterozygote: 267, 198, 69 bp
ff homozygote: 198, 69 bp
PCR product: 267 bp
ApaIAA homozygote: 630 bp
Aa heterozygote: 630, 484, 146 bp
aa homozygote: 484, 146 bp
PCR product: 630 bp
BsmIBB homozygote: 348 bp
Bb heterozygote: 348, 243, 105 bp
bb homozygote: 243, 105 bp
PCR product: 348 bp
TaqITT homozygote: 425, 205 bp
Tt heterozygote: 425, 225, 205, 200 bp
tt homozygote: 225, 205, 200 bp
PCR product: 630 bp
Table 4. Hardy–Weinberg equilibrium for the control group.
SNPx2p-Value
FokI0.5630.755
ApaI0.1200.942
BsmI3.2180.200
TaqI0.5800.748
Table 5. Genotype and allele frequencies of VDR polymorphisms in CRC and control groups.
PolymorphismGenotype/
Allele
CRC
n (%)
Control
n (%)
Crude OR (95% CI)p-ValueAdjusted
OR (95% CI)
p-Value
TT30 (29)56 (51)----
TaqITt57 (55)42 (39)0.39
(0.22–0.72)
0.0020.36
(0.15–0.83)
0.016
rs731236tt16 (16)11 (10)0.37
(0.15–0.89)
0.0270.31
(0.09–1.09)
0.068
T117 (57)154 (71)----
t89 (43)64 (29)0.55
(0.37–0.82)
0.0030.50
(0.29–0.88)
0.017
Tt + tt89 (60)64 (36)----
vs. TT60 (40)112 (64)2.60
(1.66–4.07)
<0.0001--
AA23 (22)19 (17)----
ApaIAa49 (48)55 (50)1.36
(0.63–2.79)
0.400.81
(0.29–2.25)
0.68
rs7975232aa31 (30)35 (32)1.37
(0.63–2.97)
0.430.81
(0.40–3.72)
0.72
A95 (46)93 (43)----
a111 (54)125 (57)1.13
(0.78–1.67)
0.511.15
(0.67–1.98)
0.60
Aa + aa111 (71)125 (77)----
vs. AA46 (29)38 (23)1.36
(0.83–2.25)
0.22--
FF32 (31)43 (39)----
FokIFf50 (49)48 (44)0.71
(0.39–1.31)
0.280.70
(0.29–1.65)
0.41
rs2228570ff21 (20)18 (17)0.64
(0.29–1.39)
0.260.58
(0.19–1.72)
0.32
F114 (55)134 (61)----
f92 (45)84 (39)0.78
(0.53–1.14)
0.200.74
(0.43–1.28)
0.28
Ff + ff92 (59)84 (48)----
vs. FF64 (41)86 (52)1.47
(0.95–2.28)
0.08--
bb50 (49)38 (35)----
BsmIBb40 (39)60 (55)1.97
(1.10–3.53)
0.021.05
(0.30–3.71)
0.19
rs1544410BB13 (13)11 (10)1.11
(0.45–2.76)
0.821.73
(0.77–3.91)
0.93
b140 (68)136 (62)----
B66 (32)82 (38)0.78
(0.52–1.17)
0.231.20
(0.69–2.11)
0.52
bb vs.66 (40)82 (52)----
BB + Bb100 (60)76 (48)1.64
(1.05–2.54)
0.03--
Table 6. Haplotypes with alleles in linkage disequilibrium (LD): ApaI, TaqI, and BsmI.
HaplotypeCRC
Frequency (%)
Control
Frequency (%)
OR
(95% CI)
p-Value
TAB1.73.80.43 (0.12–1.53)0.18
TAb10.212.12.84 (0.46–1.53)0.56
TaB0.08.9--
Tab44.945.90.96 (0.65–1.40)0.82
tAB27.024.81.12 (0.72–1.73)0.61
tAb7.22.03.84 (1.29–11.38)0.01
taB3.40.130.22 (2.81–325.31) 0.01
tab5.62.42.39 (0.84–6.82)0.09
Table 7. Combined genotypes and their percentage among investigated populations.
GenotypeCRC
n (%)
Control
n (%)
p-Value
TtAaBb26 (25.24)33 (30.28)-
TtAabb11 (10.68)1 (0.92)0.01
TTAaBb1 (0.97)8 (7.34)0.92
TTAabb8 (7.77)11 (10.09)0.88
ttAABB10 (9.71)8 (7.34)0.39
TTaaBb012 (11.01)0.04
TTaabb19 (18.45)19 (17.43)0.56
TtAABb6 (5.83)3 (2.75)0.22
Ttaabb8 (7.77)1 (0.92)0.03
TtAAbb2 (1.94)1 (0.92)-
TTAABb1 (0.97)2 (1.83)-
TTAAbb1 (0.97)3 (2.75)-
TTaaBB01 (0.92)-
TtAaBB01 (0.92)-
TtaaBb3 (2.91)1 (0.92)-
TtAABB1 (0.97)1 (0.92)-
ttAAbb1 (0.97)1 (0.92)-
ttAABb1 (0.97)0-
ttAaBb2 (1.94)1 (0.92)-
ttAaBB1 (0.97)0-
ttaaBB1 (0.97)0-
ttaabb01 (0.92)-
Publisher’s Note: MDPI stays neutral with regard to jurisdictional claims in published maps and institutional affiliations.