Skipping Breakfast for 6 Days Delayed the Circadian Rhythm of the Body Temperature without Altering Clock Gene Expression in Human Leukocytes

 ,
, 
Abstract
1. Introduction
2. Materials and Methods
2.1. Subjects
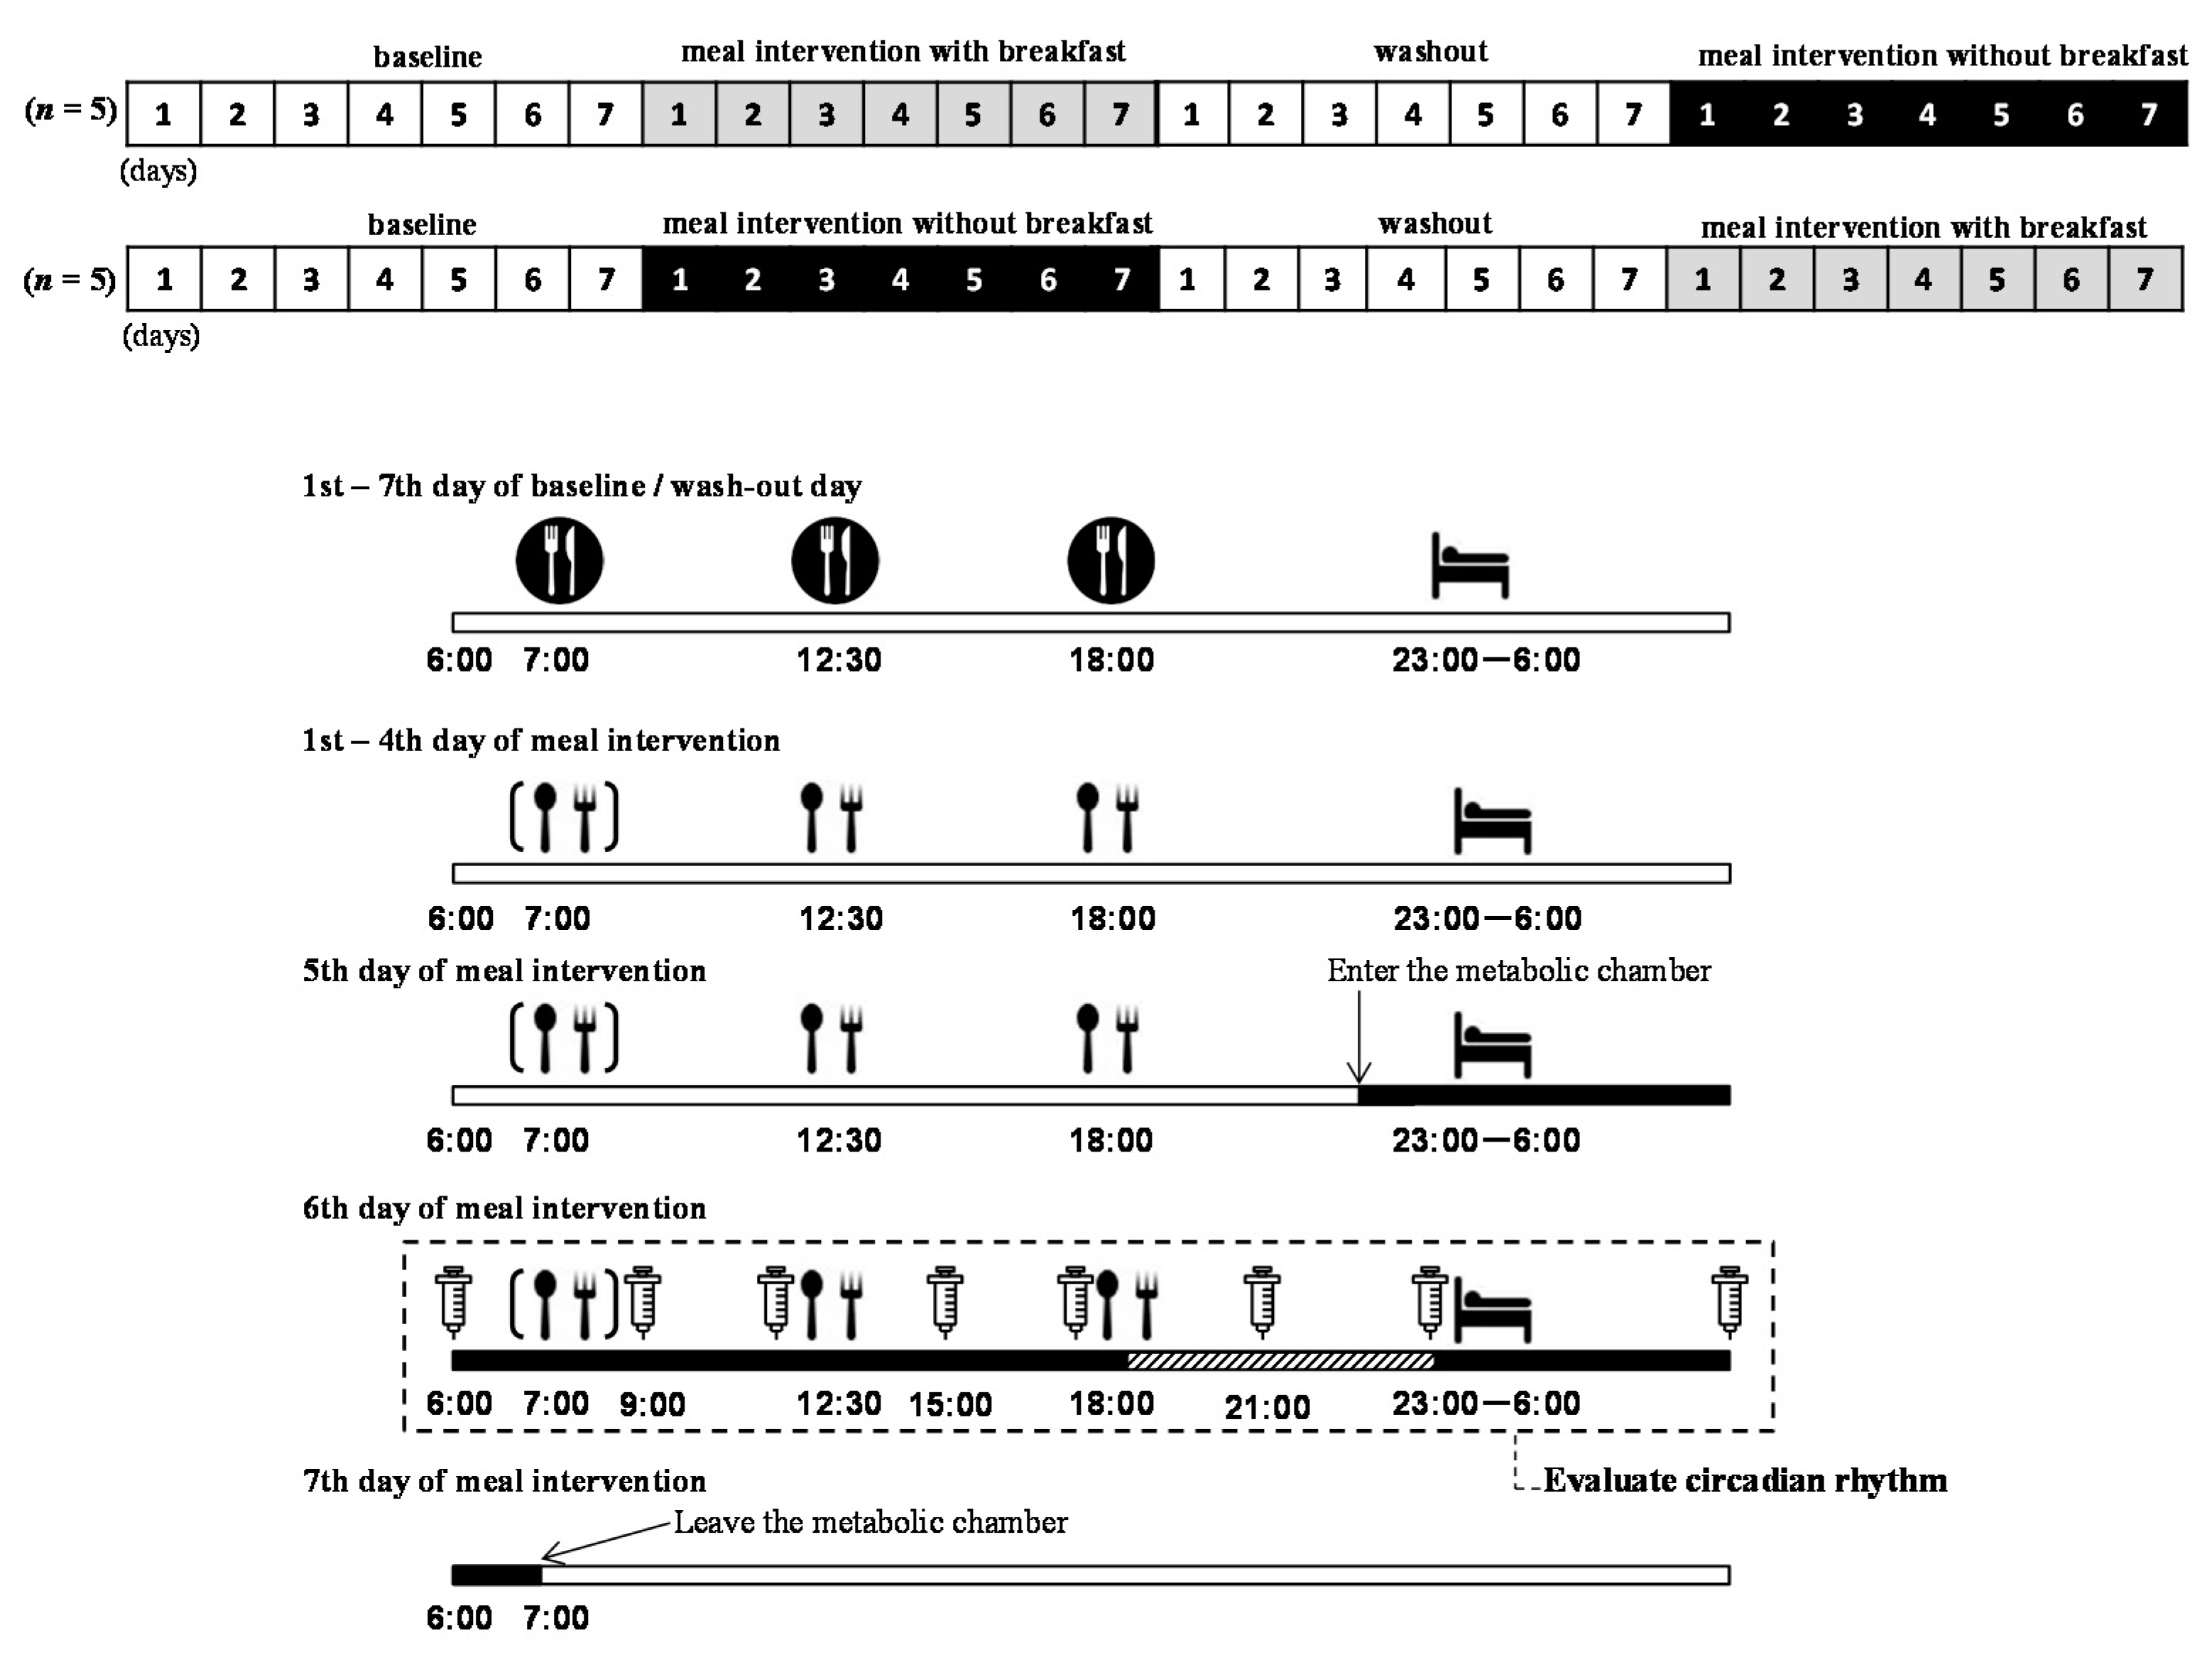
2.2. Study Protocol
 ), and they ate 3 meals/day. During the meal intervention days, the subjects ate meals provided by the study (
 ). On the fifth day of the meal intervention, the subjects arrived at the laboratory, entered the metabolic chamber at 22:00, and stayed until the morning of the seventh day (
 ). Before entering the metabolic chamber, each subject ingested a pill-sized CorTemp sensor, had a catheter placed in a forearm vein, and wore a telemetric heart rate monitor. From the sixth to seventh day of meal intervention, blood samples were collected at 06:00, 9:00, 12:00, 15:00, 18:00, 21:00, 23:00, and the next morning 06:00 (
 ). From 19:00 to 23:00 on the sixth day of the meal intervention, each subject was seated in the dim light (<10 lux) and saliva was collected every 30 min (
 ). Note that the timings of meals and sleep were predetermined by the experimental protocol
2.3. Measurements
2.3.1. Core Body Temperature
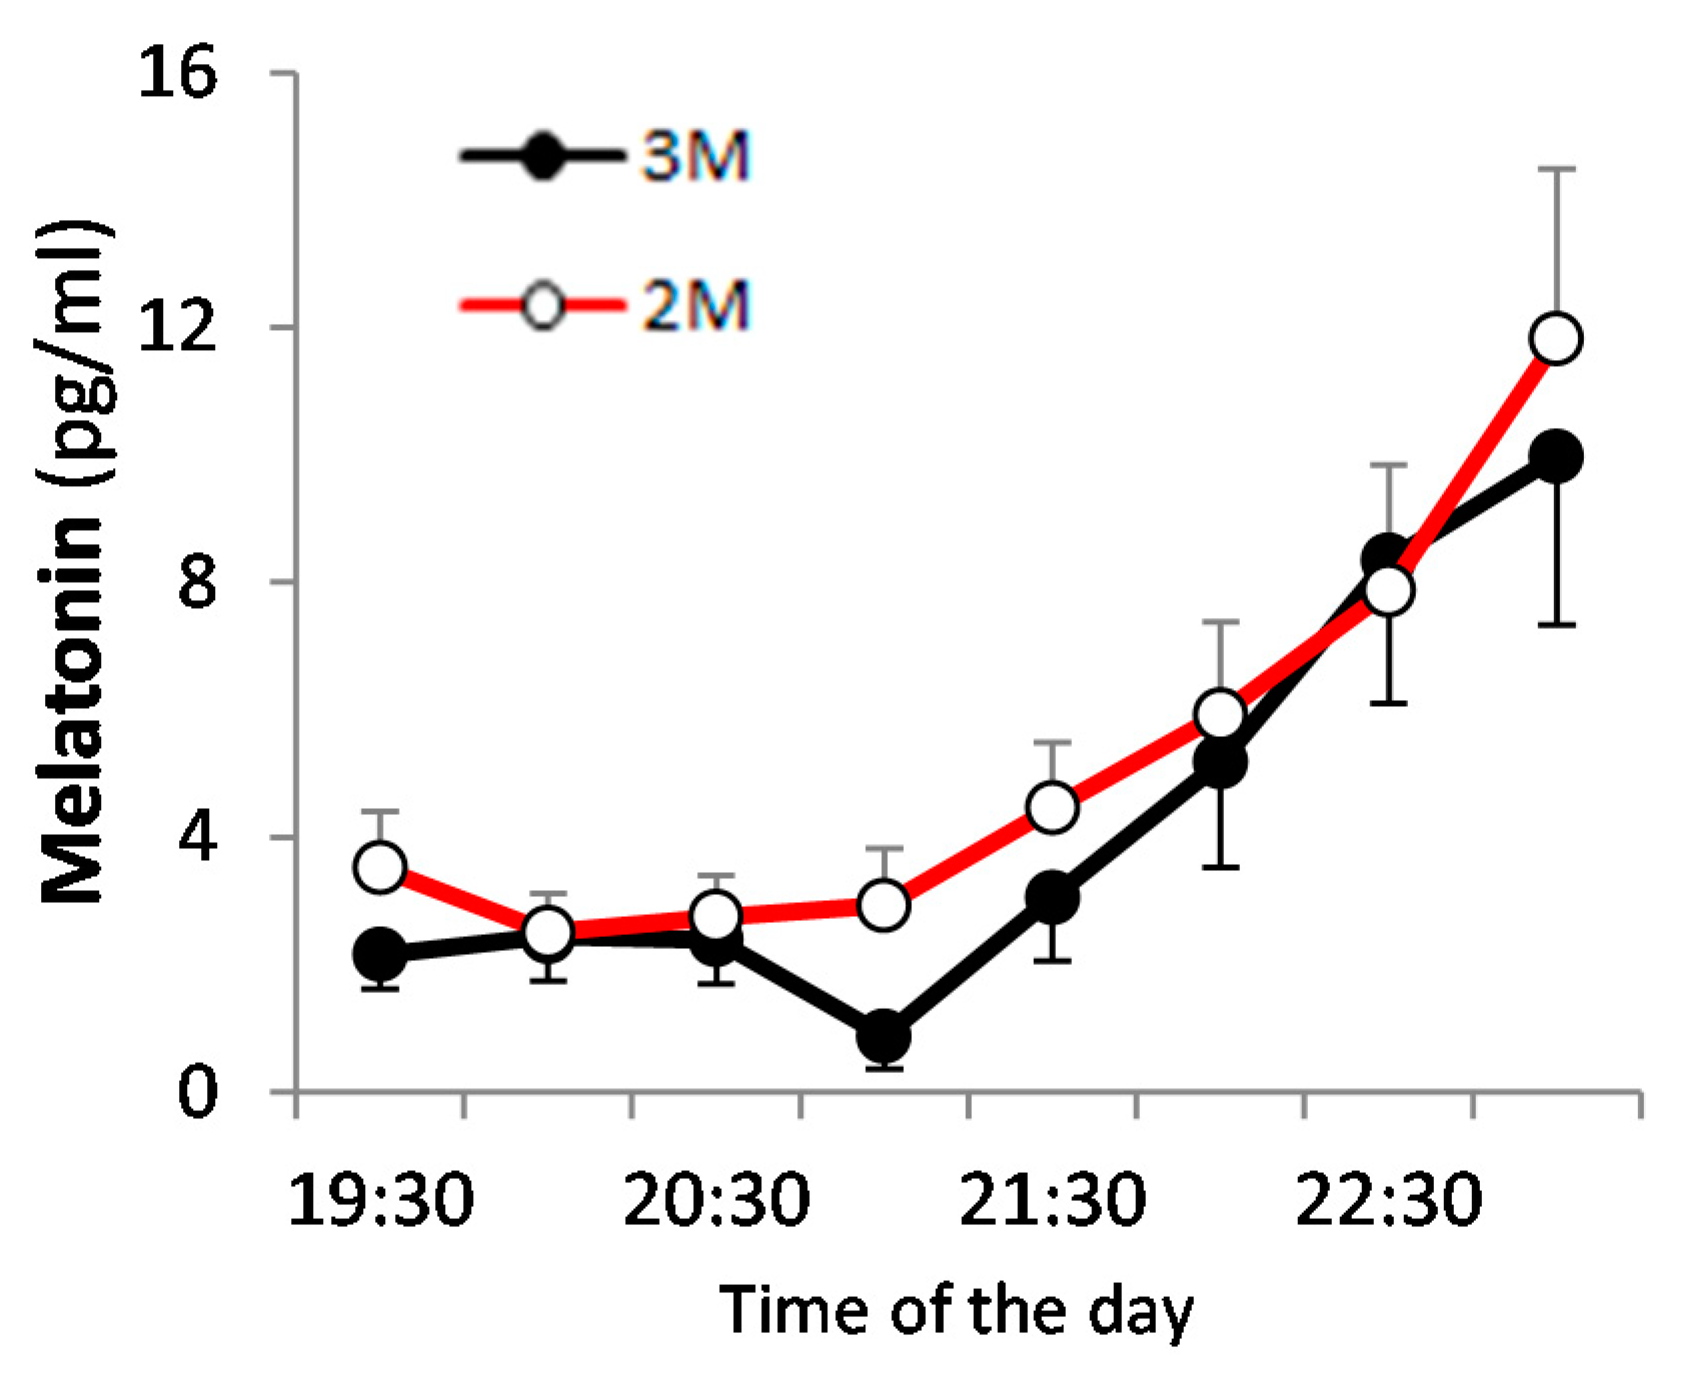
2.3.2. Dim Light Melatonin Onset
2.3.3. Heart Rate and Heart Rate Variability
2.3.4. Clock Genes
2.4. Analysis
2.4.1. Analysis of Circadian Rhythm
2.4.2. Statistical Analysis
3. Results
3.1. Core Body Temperature
3.2. Dim Light Melatonin Onset (DLMO)
3.3. Heart Rate Variability
3.4. Clock Genes
4. Discussion
Limitations
5. Conclusions
Supplementary Materials
Author Contributions
Funding
Acknowledgments
Conflicts of Interest
References
- Brown, A.W.; Bohan Brown, M.M.; Allison, D.B. Belief beyond the evidence: Using the proposed effect of breakfast on obesity to show 2 practices that distort scientific evidence. Am. J. Clin. Nutr. 2013, 98, 1298–1308. [Google Scholar] [CrossRef]
- Rampersaud, G.C.; Pereira, M.A.; Girard, B.L.; Adams, J.; Metzl, J.D. Breakfast habits, nutritional status, body weight, and academic performance in children and adolescents. J. Am. Diet. Assoc. 2005, 105, 743–760. [Google Scholar] [CrossRef]
- Adolphus, K.; Lawton, C.L.; Champ, C.L.; Dye, L. The effects of breakfast and breakfast composition on cognition in children and adolescents: A systematic review. Adv. Nutr. 2016, 7, 590S–612S. [Google Scholar] [CrossRef]
- Stockman, N.K.; Schenkel, T.C.; Brown, J.N.; Duncan, A.M. Comparison of energy and nutrient intakes among meals and snacks of adolescent males. Prev. Med. 2005, 41, 203–210. [Google Scholar] [CrossRef]
- Affenito, S.G. Breakfast: A missed opportunity. J. Am. Diet. Assoc. 2007, 107, 565–569. [Google Scholar] [CrossRef]
- St-Onge, M.-P.; Ard, J.; Baskin, M.L.; Chiuve, S.E.; Johnson, H.M.; Kris-Etherton, P.; Varady, K.; American Heart Association Obesity Committee of the Council on Lifestyle and Cardiometabolic Health; Council on Cardiovascular Disease in the Young; Council on Clinical Cardiology; et al. Meal timing and frequency: Implications for cardiovascular disease prevention: A scientific statement from the American heart association. Circulation 2017, 135, e96–e121. [Google Scholar] [CrossRef]
- Mattson, M.P.; Allison, D.B.; Fontana, L.; Harvie, M.; Longo, V.D.; Malaisse, W.J.; Mosley, M.; Notterpek, L.; Ravussin, E.; Scheer, F.A.J.L.; et al. Meal frequency and timing in health and disease. Proc. Natl. Acad. Sci. USA 2014, 111, 16647–16653. [Google Scholar] [CrossRef]
- Takahashi, M.; Ozaki, M.; Kang, M.I.; Sasaki, H.; Fukazawa, M.; Iwakami, T.; Lim, P.J.; Kim, H.K.; Aoyama, S.; Shibata, S. Effects of meal timing on postprandial glucose metabolism and blood metabolites in healthy adults. Nutrients 2018, 10, 1763. [Google Scholar] [CrossRef] [PubMed]
- Pittendrigh, C.S. Temporal organization: Reflections of a Darwinian clock-watcher. Annu. Rev. Physiol. 1993, 55, 16–54. [Google Scholar] [CrossRef] [PubMed]
- Lowrey, P.L.; Takahashi, J.S. Genetics of circadian rhythms in mammalian model organisms. Adv. Genet. 2011, 74, 175–230. [Google Scholar] [PubMed]
- Baker, F.C.; Waner, J.I.; Vieira, E.F.; Taylor, S.R.; Driver, H.S.; Mitchell, D. Sleep and 24 hour body temperatures: A comparison in young men, naturally cycling women and women taking hormonal contraceptives. J. Physiol. 2001, 530, 565–574. [Google Scholar] [CrossRef] [PubMed]
- Arendt, J. Melatonin: Characteristics, Concerns, and Prospects. J. Biol. Rhythms 2005, 20, 291–303. [Google Scholar] [CrossRef] [PubMed]
- Higuchi, T.; Hamada, K.; Imazuya, S.; Irie, S. The effect of breakfast omission and breakfast type on body temperature, mood and intellectual performance. J. Jpn. Soc. Clin. Nutr. 2007, 29, 35–43. (In Japanese) [Google Scholar]
- Bougard, C.; Moussay, S.; Gauthier, A.; Espié, S.; Davenne, D. Effects of waking time and breakfast intake prior to evaluation of psychomotor performance in the early morning. Chronobiol. Int. 2009, 26, 324–336. [Google Scholar] [CrossRef] [PubMed]
- Yamazaki, S.; Numano, R.; Abe, M.; Hida, A.; Takahashi, R.; Ueda, M.; Block, G.D.; Sakaki, Y.; Menaker, M.; Tei, H. Resetting central and peripheral circadian oscillators in transgenic rats. Science 2000, 288, 682–685. [Google Scholar] [CrossRef]
- Yoo, S.H.; Yamazaki, S.; Lowrey, P.L.; Shimomura, K.; Ko, C.H.; Buhr, E.D.; Siepka, S.M.; Hong, H.K.; Oh, W.J.; Yoo, O.J.; et al. PERIOD2::LUCIFERASE real-time reporting of circadian dynamics reveals persistent circadian oscillations in mouse peripheral tissues. Proc. Natl. Acad. Sci. USA 2004, 101, 5339–5346. [Google Scholar] [CrossRef]
- Reppert, S.M.; Weaver, D.R. Coordination of circadian timing in mammals. Nature 2002, 418, 935–941. [Google Scholar] [CrossRef]
- Yoshida, C.; Shikata, N.; Seki, S.; Koyama, N.; Noguchi, Y. Early nocturnal meal skipping alters the peripheral clock and increases lipogenesis in mice. Nutr. Metab. 2012, 9, 78. [Google Scholar] [CrossRef]
- Shimizu, H.; Hanzawa, F.; Kim, D.; Sun, S.; Laurent, T.; Umeki, M.; Ikeda, S.; Mochizuki, S.; Oda, H. Delayed first active-phase meal, a breakfast-skipping model, led to increased body weight and shifted the circadian oscillation of the hepatic clock and lipid metabolism-related genes in rats fed a high-fat diet. PLoS ONE 2018, 13, e0206669. [Google Scholar] [CrossRef]
- Watanabe, M.; Hida, A.; Kitamura, S.; Enomoto, M.; Ohsawa, Y.; Katayose, Y.; Nozaki, K.; Moriguchi, Y.; Aritake, S.; Higuchi, S.; et al. Rhythmic expression of circadian clock genes in human leukocytes and beard hair follicle cells. Biochem. Biophys. Res. Commun. 2012, 425, 902–907. [Google Scholar] [CrossRef]
- Wehrens, S.M.T.; Christou, S.; Isherwood, C.; Middleton, B.; Gibbs, M.A.; Archer, S.N.; Skene, D.J.; Johnston, J.D. Meal timing regulates the human circadian system. Curr. Biol. 2017, 27, 1768–1775. [Google Scholar] [CrossRef] [PubMed]
- Arble, D.M.; Ramsey, K.M.; Bass, J.; Turek, F.W. Circadian disruption and metabolic disease: Findings from animal models. Best Pract. Res. Clin. Endocrinol. Metab. 2010, 24, 785–800. [Google Scholar] [CrossRef] [PubMed]
- Task Force of the European Society of Cardiology and the North American Society of Pacing and Electrophysiology. Heart rate variability: Standards of measurement, physiological interpretation and clinical use. Circulation 1996, 93, 1043–1065. [Google Scholar] [CrossRef]
- Wijngaarden, M.A.; Pijl, H.; van Dijk, K.W.; Klaassen, E.S.; Burggraaf, J. Obesity is associated with an altered autonomic nervous system response to nutrient restriction. Clin. Endocrinol. 2013, 79, 648–651. [Google Scholar] [CrossRef]
- Kobayashi, F.; Ogata, H.; Omi, N.; Nagasaka, S.; Yamaguchi, S.; Hibi, M.; Tokuyama, K. Effect of breakfast skipping on diurnal variation of energy metabolism and blood glucose. Obes. Res. Clin. Pract. 2014, 8, e249–e257. [Google Scholar] [CrossRef]
- Nas, A.; Mirza, N.; Hägele, F.; Kahlhöfer, J.; Keller, J.; Rising, R.; Kufer, T.A.; Bosy-Westphal, A. Impact of breakfast skipping compared with dinner skipping on regulation of energy balance and metabolic risk. Am. J. Clin. Nutr. 2017, 105, 1351–1361. [Google Scholar] [CrossRef]
- Johnston, J.D.; Ordovás, J.M.; Scheer, F.A.; Turek, F.W. Circadian rhythms, metabolism, and chrononutrition in rodents and humans. Adv. Nutr. 2016, 7, 399–406. [Google Scholar] [CrossRef]
- Bass, J. Circadian topology of metabolism. Nature 2012, 491, 348–356. [Google Scholar] [CrossRef]
- Ogata, H.; Kayaba, M.; Tanaka, Y.; Yajima, K.; Iwayama, K.; Ando, A.; Park, I.; Kiyono, K.; Omi, N.; Satoh, M.; et al. Effect of skipping breakfast for 6 d on energy metabolism and diurnal rhythm of blood glucose in young healthy Japanese males. Am. J. Clin. Nutr. 2019, 110, 41–52. [Google Scholar] [CrossRef]
- Ishihara, K.; Saitoh, T.; Inoue, Y.; Miyata, Y. Validity of the Japanese version of the Morningness-Eveningness Questionnaire. Percept. Mot. Skills 1984, 59, 863–866. [Google Scholar] [CrossRef]
- Ministry of Health, Labour and Welfare of Japan. The National Health and Nutrition Survey 2015. Available online: http://www.mhlw.go.jp/file/04-Houdouhappyou-10904750-Kenkoukyoku-Gantaisakukenkouzoushinka/0000041955.pdf (accessed on 7 September 2017). (In Japanese)
- Pandi-Perumal, S.R.; Smits, M.; Spence, W.; Srinivasan, V.; Cardinali, D.P.; Lowe, A.D.; Kayumov, L. Dim light melatonin onset (DLMO): A tool for the analysis of circadian phase in human sleep and chronobiological disorders. Prog. Neuropsychopharmacol. Biol. Psychiatry 2007, 31, 1–11. [Google Scholar] [CrossRef] [PubMed]
- Crowley, S.J.; Suh, C.; Molina, T.A.; Fogg, L.F.; Sharkey, K.M.; Carskadon, M.A. Estimating dim light melatonin onset (DLMO) phase in adolescents using summer or school-year sleep/wake schedules. Sleep 2006, 29, 1632–1641. [Google Scholar] [CrossRef] [PubMed]
- Stein, P.K.; Kleiger, R.E. Insights from the study of heart rate variability. Annu. Rev. Med. 1999, 50, 249–261. [Google Scholar] [CrossRef] [PubMed]
- Kawakami, Y.; Yamanaka-Okumura, H.; Sakuma, M.; Mori, Y.; Adachi, C.; Matsumoto, Y.; Sato, T.; Yamamoto, H.; Taketani, Y.; Katayama, T.; et al. Gene expression profiling in peripheral white blood cells in response to the intake of food with different glycemic index using a DNA microarray. J. Nutrigenet. Nutrigenomics 2013, 6, 154–168. [Google Scholar] [CrossRef]
- World Health Organization. Obesity and Overweight. Available online: https://www.who.int/news-room/fact-sheets/detail/obesity-and-overweight (accessed on 23 January 2020).
- Almoosawi, S.; Vingeliene, S.; Karagounis, L.G.; Pot, G.K. Chrono-nutrition: A review of current evidence from observational studies on global trends in time-of-day of energy intake and its association with obesity. Proc. Nutr. Soc. 2016, 75, 487–500. [Google Scholar] [CrossRef]
- Bedrosian, T.A.; Fonken, L.K.; Nelson, R.J. Endocrine effects of circadian disruption. Annu. Rev. Physiol. 2016, 78, 109–131. [Google Scholar] [CrossRef] [PubMed]
- Burke, V. Obesity in childhood and cardiovascular risk. Clin. Exp. Pharmacol. Physiol. 2006, 33, 831–837. [Google Scholar] [CrossRef]
- Chiarelli, F.; Marcovecchio, M.L. Insulin resistance and obesity in childhood. Eur. J. Endocrinol. 2008, 159 (Suppl. 1), S67–S74. [Google Scholar] [CrossRef]
- Kapantais, E.; Chala, E.; Kaklamanou, D.; Lanaras, L.; Kaklamanou, M.; Tzotzas, T. Breakfast skipping and its relation to BMI and health-compromising behaviours among Greek adolescents. Public Health Nutr. 2011, 14, 101–108. [Google Scholar] [CrossRef]
- Wennberg, M.; Gustafsson, P.E.; Wennberg, P.; Hammarström, A. Poor breakfast habits in adolescence predict the metabolic syndrome in adulthood. Public Health Nutr. 2015, 18, 122–129. [Google Scholar] [CrossRef]
- Bi, H.; Gan, Y.; Yang, C.; Chen, Y.; Tong, X.; Lu, Z. Breakfast skipping and the risk of type 2 diabetes: A meta-analysis of observational studies. Public Health Nutr. 2015, 18, 3013–3019. [Google Scholar] [CrossRef] [PubMed]
- Cahill, L.E.; Chiuve, S.E.; Mekary, R.A.; Jensen, M.K.; Flint, A.J.; Hu, F.B.; Rimm, E.B. Prospective study of breakfast eating and incident coronary heart disease in a cohort of male US health professionals. Circulation 2013, 128, 337–343. [Google Scholar] [CrossRef] [PubMed]
- Garaulet, M.; Gómez-Abellán, P. Timing of food intake and obesity: A novel association. Physiol. Behav. 2014, 134, 44–50. [Google Scholar] [CrossRef] [PubMed]
- Okauchi, H.; Higo-Yamamoto, S.; Sowa, T.; Oike, H.; Yamamoto, S.; Wada, N.; Sakamoto, K.; Oishi, K. Chronically skipping breakfast impairs hippocampal memory-related gene expression and memory function accompanied by reduced wakefulness and body temperature in mice. Biochem. Biophys. Res. Commun. 2020, 524, 129–134. [Google Scholar] [CrossRef] [PubMed]
- Lewy, A.J.; Cutler, N.L.; Sack, R.L. The endogenous melatonin profile as a marker of circadian phase position. J. Biol. Rhythms 1999, 14, 227–236. [Google Scholar] [CrossRef] [PubMed]
- Klerman, E.B.; Gershengorn, H.B.; Duffy, J.F.; Kronauer, R.E. Comparisons of the variability of three markers of the human circadian pacemaker. J. Biol. Rhythms 2002, 17, 181–193. [Google Scholar] [CrossRef]
- Yoshizaki, T.; Tada, Y.; Hida, A.; Sunami, A.; Yokoyama, Y.; Yasuda, J.; Nakai, A.; Togo, F.; Kawano, Y. Effects of feeding schedule changes on the circadian phase of the cardiac autonomic nervous system and serum lipid levels. Eur. J. Appl. Physiol. 2013, 113, 2603–2611. [Google Scholar] [CrossRef]
- Archer, S.N.; Viola, A.U.; Kyriakopoulou, V.; von Schantz, M.; Dijk, D.J. Inter-individual differences in habitual sleep timing and entrained phase of endogenous circadian rhythms of BMAL1, PER2 and PER3 mRNA in human leukocytes. Sleep 2008, 31, 608–617. [Google Scholar] [CrossRef]
- Fukuya, H.; Emoto, N.; Nonaka, H.; Yagita, K.; Okamura, H.; Yokoyama, M. Circadian expression of clock genes in human peripheral leukocytes. Biochem. Biophys. Res. Commun. 2007, 354, 924–928. [Google Scholar] [CrossRef]
- Kavčič, P.; Rojc, B.; Dolenc-Grošelj, L.; Claustrat, B.; Fujs, K.; Poljak, M. The impact of sleep deprivation and nighttime light exposure on clock gene expression in humans. Croat. Med. J. 2011, 52, 594–603. [Google Scholar] [CrossRef]
- Kohane, I.S.; Valtchinov, V.I. Quantifying the white blood cell transcriptome as an accessible window to the multiorgan transcriptome. Bioinformatics 2012, 28, 538–545. [Google Scholar] [CrossRef] [PubMed]
- Liew, C.C.; Ma, J.; Tang, H.C.; Zheng, R.; Dempsey, A.A. The peripheral blood transcriptome dynamically reflects system wide biology: A potential diagnostic tool. J. Lab. Clin. Med. 2006, 147, 126–132. [Google Scholar] [CrossRef] [PubMed]
- Jakubowicz, D.; Wainstein, J.; Landau, Z.; Raz, I.; Ahren, B.; Chapnik, N.; Ganz, T.; Menaged, M.; Barnea, M.; Bar-Dayan, Y.; et al. Influences of breakfast on clock gene expression and postprandial glycemia in healthy individuals and individuals with diabetes: A randomized clinical trial. Diabetes Care 2017, 40, 1573–1579. [Google Scholar] [CrossRef] [PubMed]
- Wu, T.; Sun, L.; ZhuGe, F.; Guo, X.; Zhao, Z.; Tang, R.; Chen, Q.; Chen, L.; Kato, H.; Fu, Z. Differential roles of breakfast and supper in rats of a daily three-meal schedule upon circadian regulation and physiology. Chronobiol. Int. 2011, 28, 890–903. [Google Scholar] [CrossRef] [PubMed]
- Kajimoto, J.; Matsumura, R.; Node, K.; Akashi, M. Potential role of the pancreatic hormone insulin in resetting human peripheral clocks. Genes Cells 2018, 23, 393–399. [Google Scholar] [CrossRef]

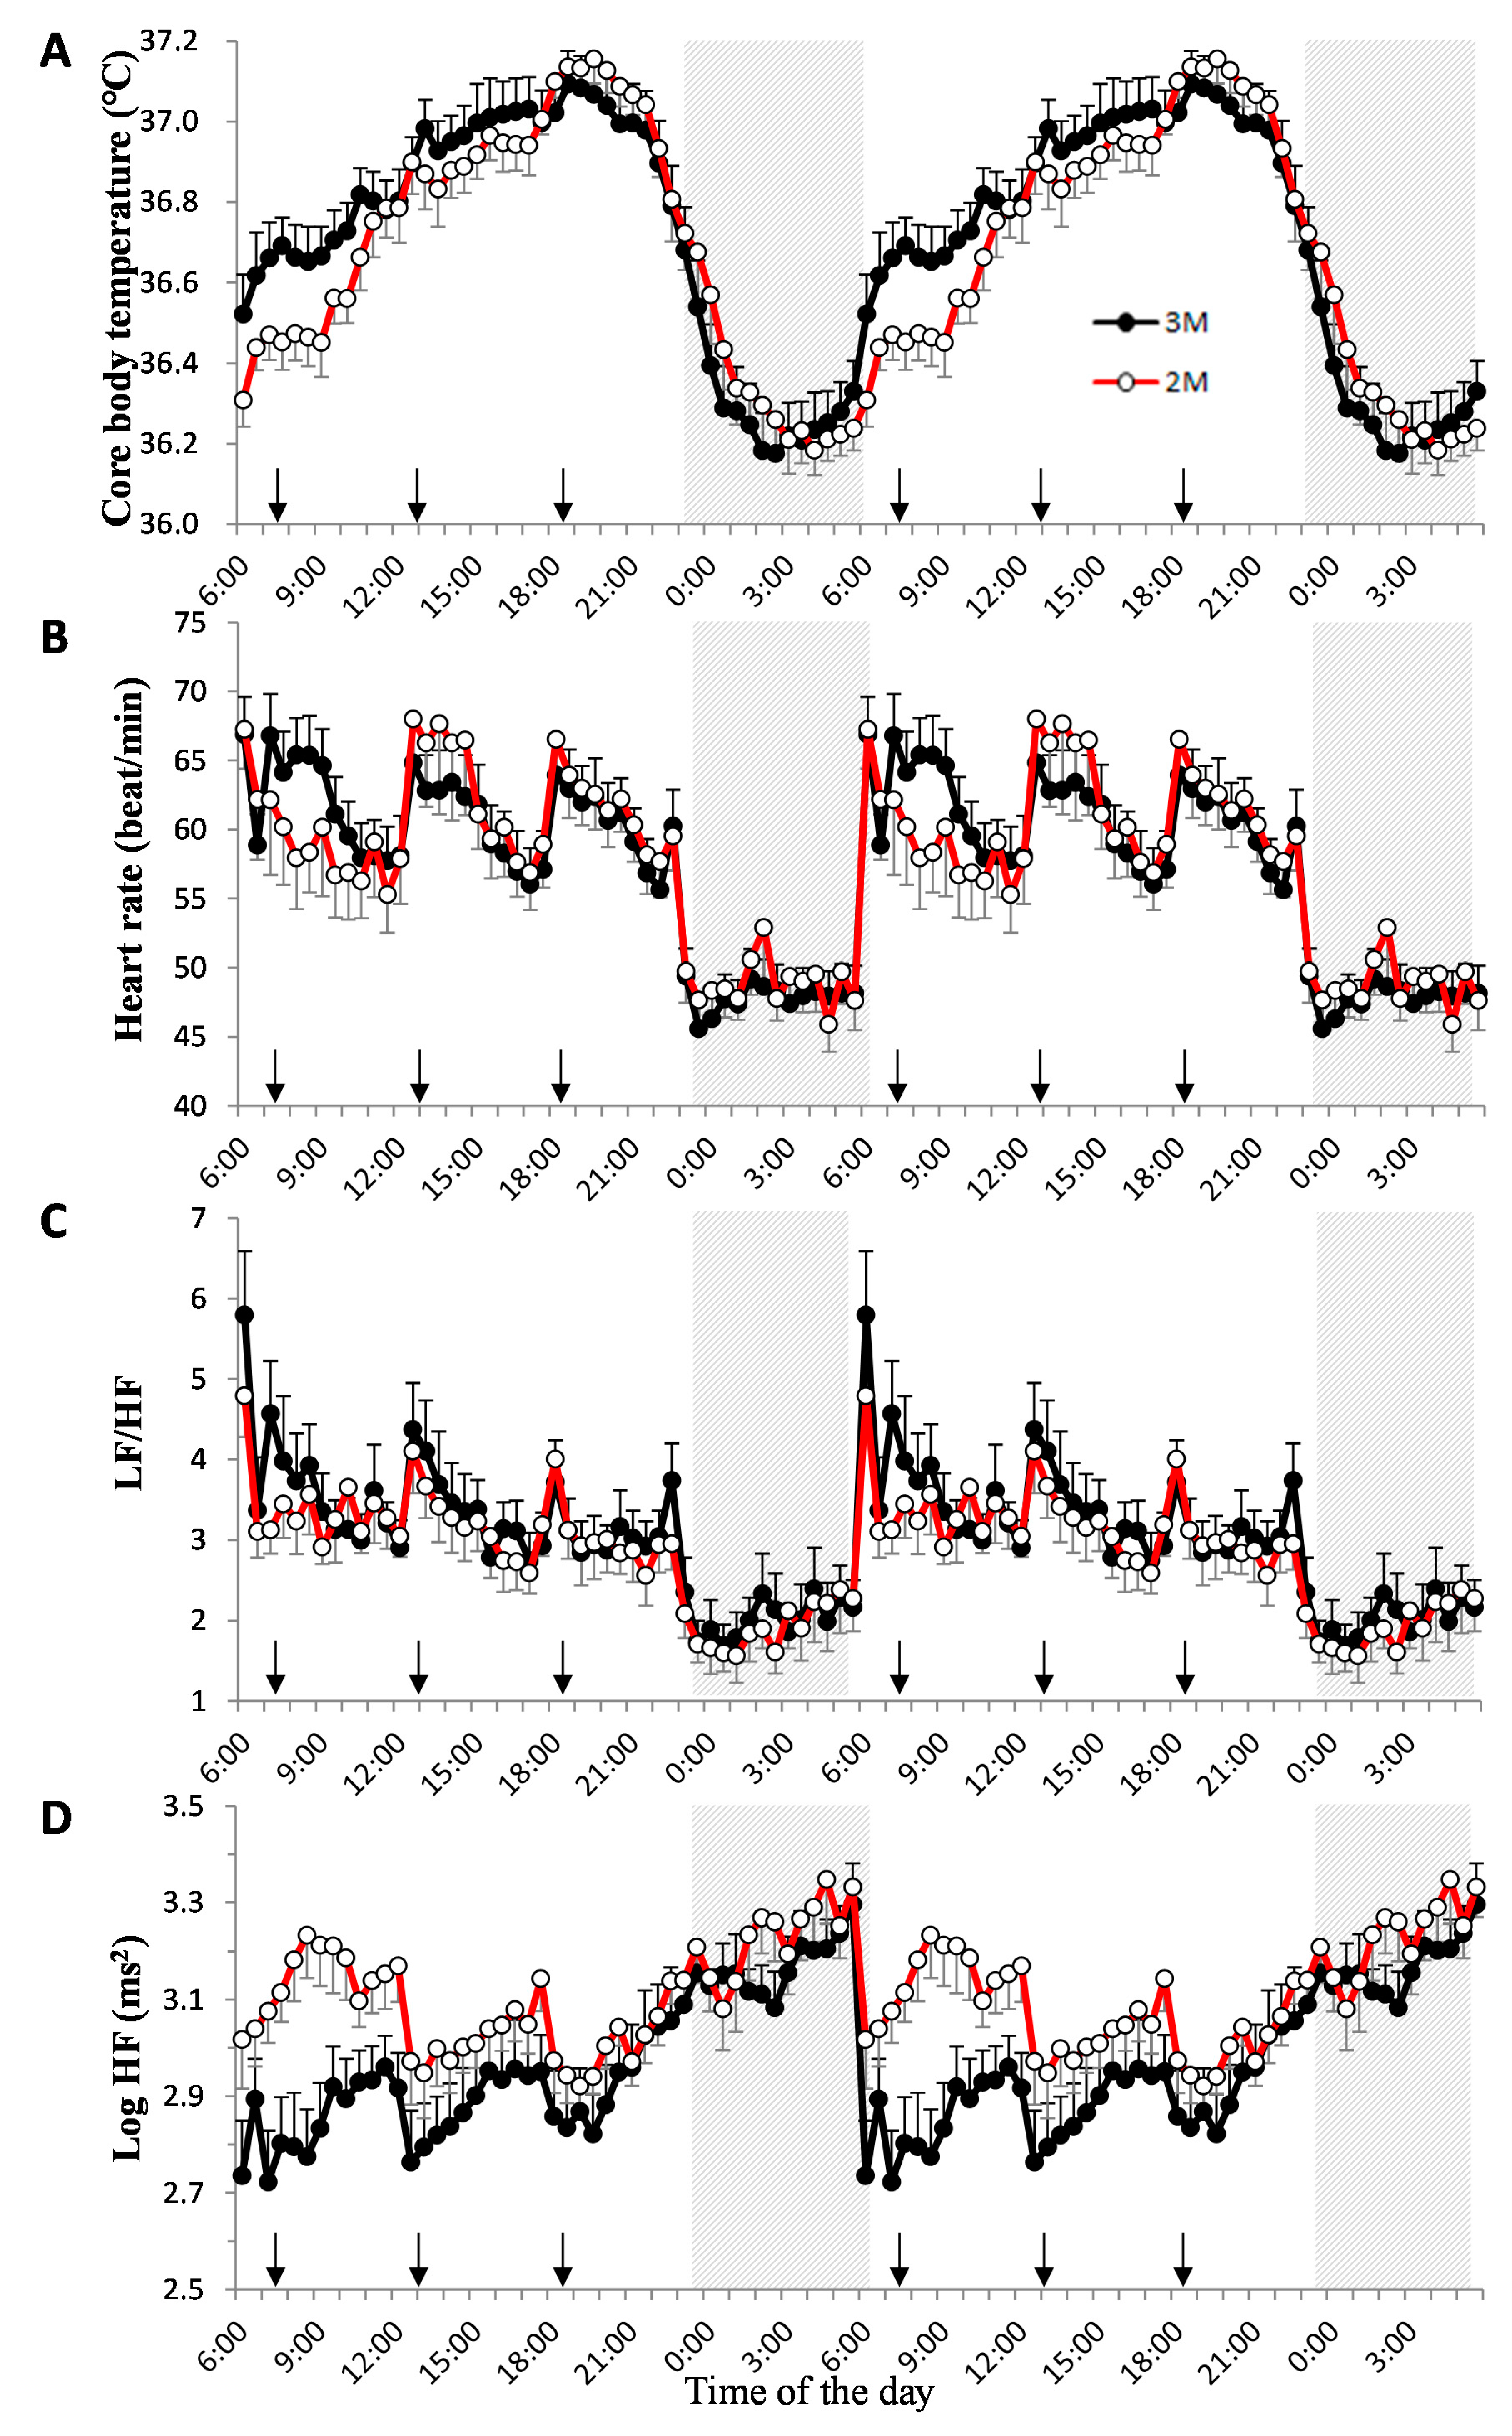
 ) and the open circles indicate the 2-meal per day diet (2M) condition (
 ). Arrows indicate the meal timing. LF/HF, the power ratio of low frequency to high frequency; HF: high frequency.
) and the open circles indicate the 2-meal per day diet (2M) condition (). Arrows indicate the meal timing. LF/HF, the power ratio of low frequency to high frequency; HF: high frequency.
). Arrows indicate the meal timing. LF/HF, the power ratio of low frequency to high frequency; HF: high frequency.
) and the open circles indicate the 2-meal per day diet (2M) condition (). Arrows indicate the meal timing. LF/HF, the power ratio of low frequency to high frequency; HF: high frequency.
 ) and the open circles indicate the 2M condition ().
) and the open circles indicate the 2M condition ().
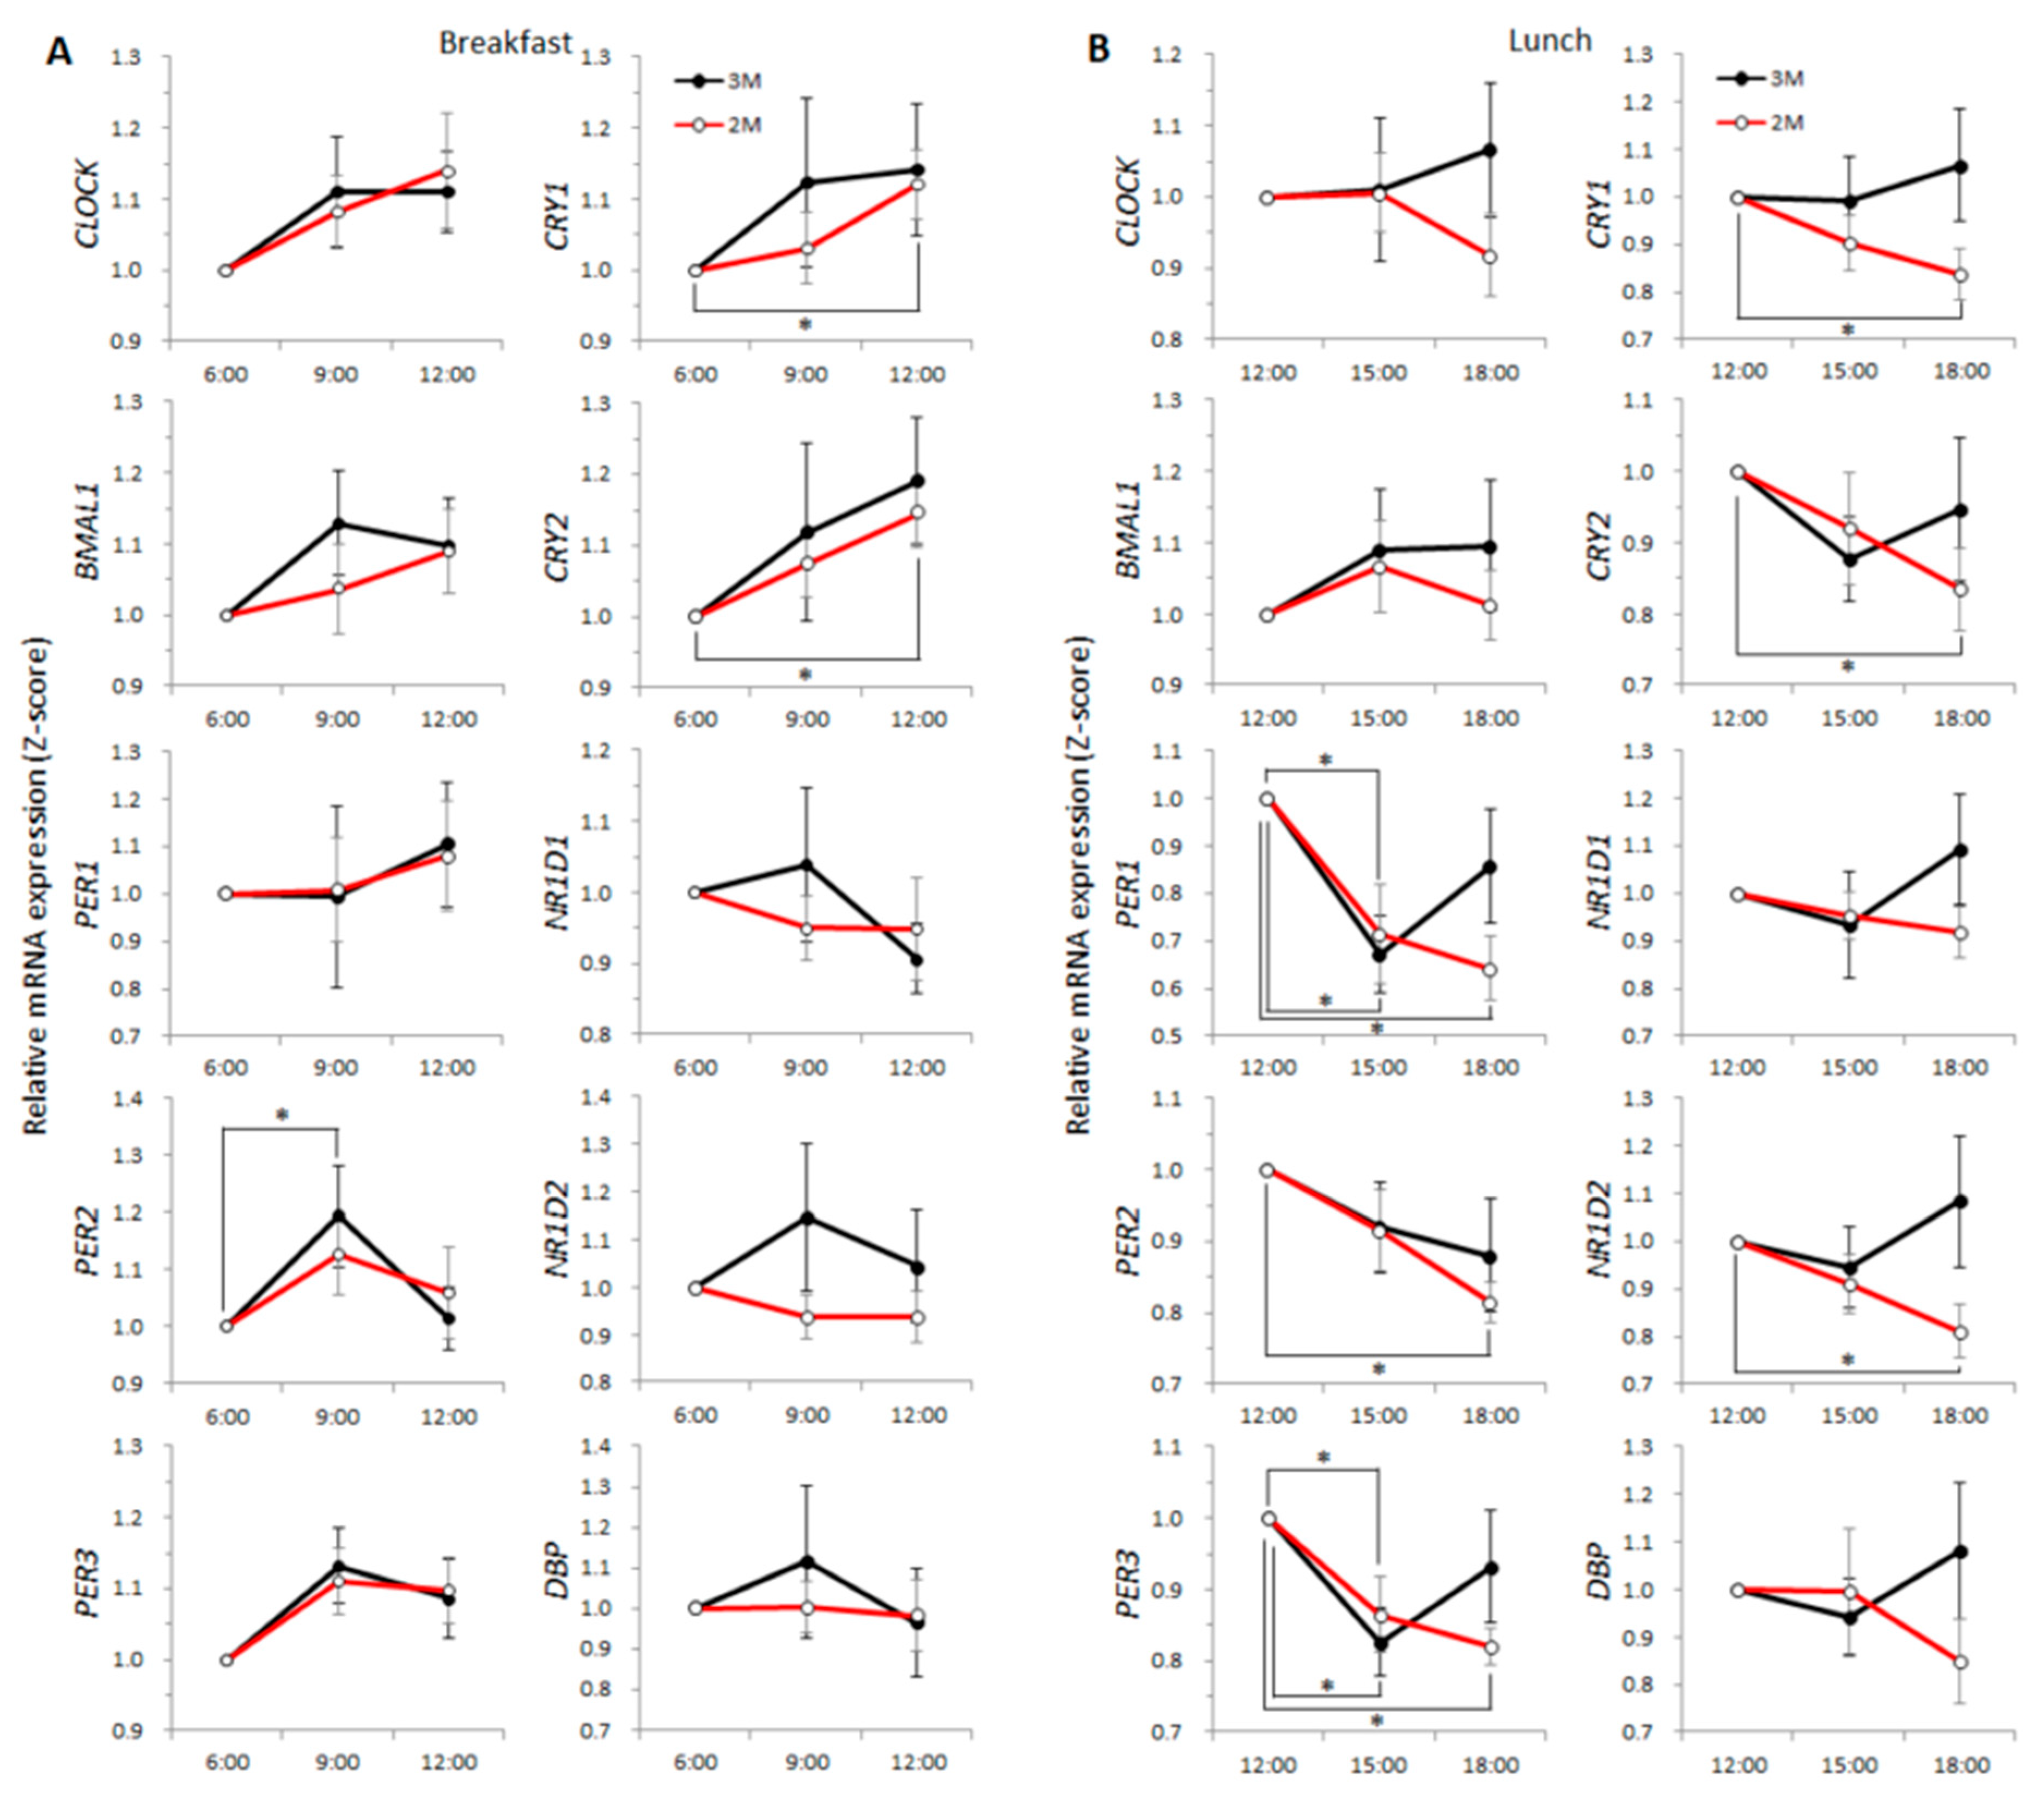
) and the open circles indicate the 2M condition (). ) and the open circles indicate the 2M condition (). One-way ANOVA was used to evaluate the effect of a meal on the expression of each clock gene. As a post-hoc test, multiple comparisons using Dunnett’s test were conducted.
) and the open circles indicate the 2M condition (). One-way ANOVA was used to evaluate the effect of a meal on the expression of each clock gene. As a post-hoc test, multiple comparisons using Dunnett’s test were conducted.
) and the open circles indicate the 2M condition (). One-way ANOVA was used to evaluate the effect of a meal on the expression of each clock gene. As a post-hoc test, multiple comparisons using Dunnett’s test were conducted. ) and the open circles indicate the 2M condition (). Arrows indicate the meal timing. Sleep hours (23:00–06:00) are indicated by the black zone.
) and the open circles indicate the 2M condition (). Arrows indicate the meal timing. Sleep hours (23:00–06:00) are indicated by the black zone.
) and the open circles indicate the 2M condition (). Arrows indicate the meal timing. Sleep hours (23:00–06:00) are indicated by the black zone. ) and the closed circles indicate the 2M condition (
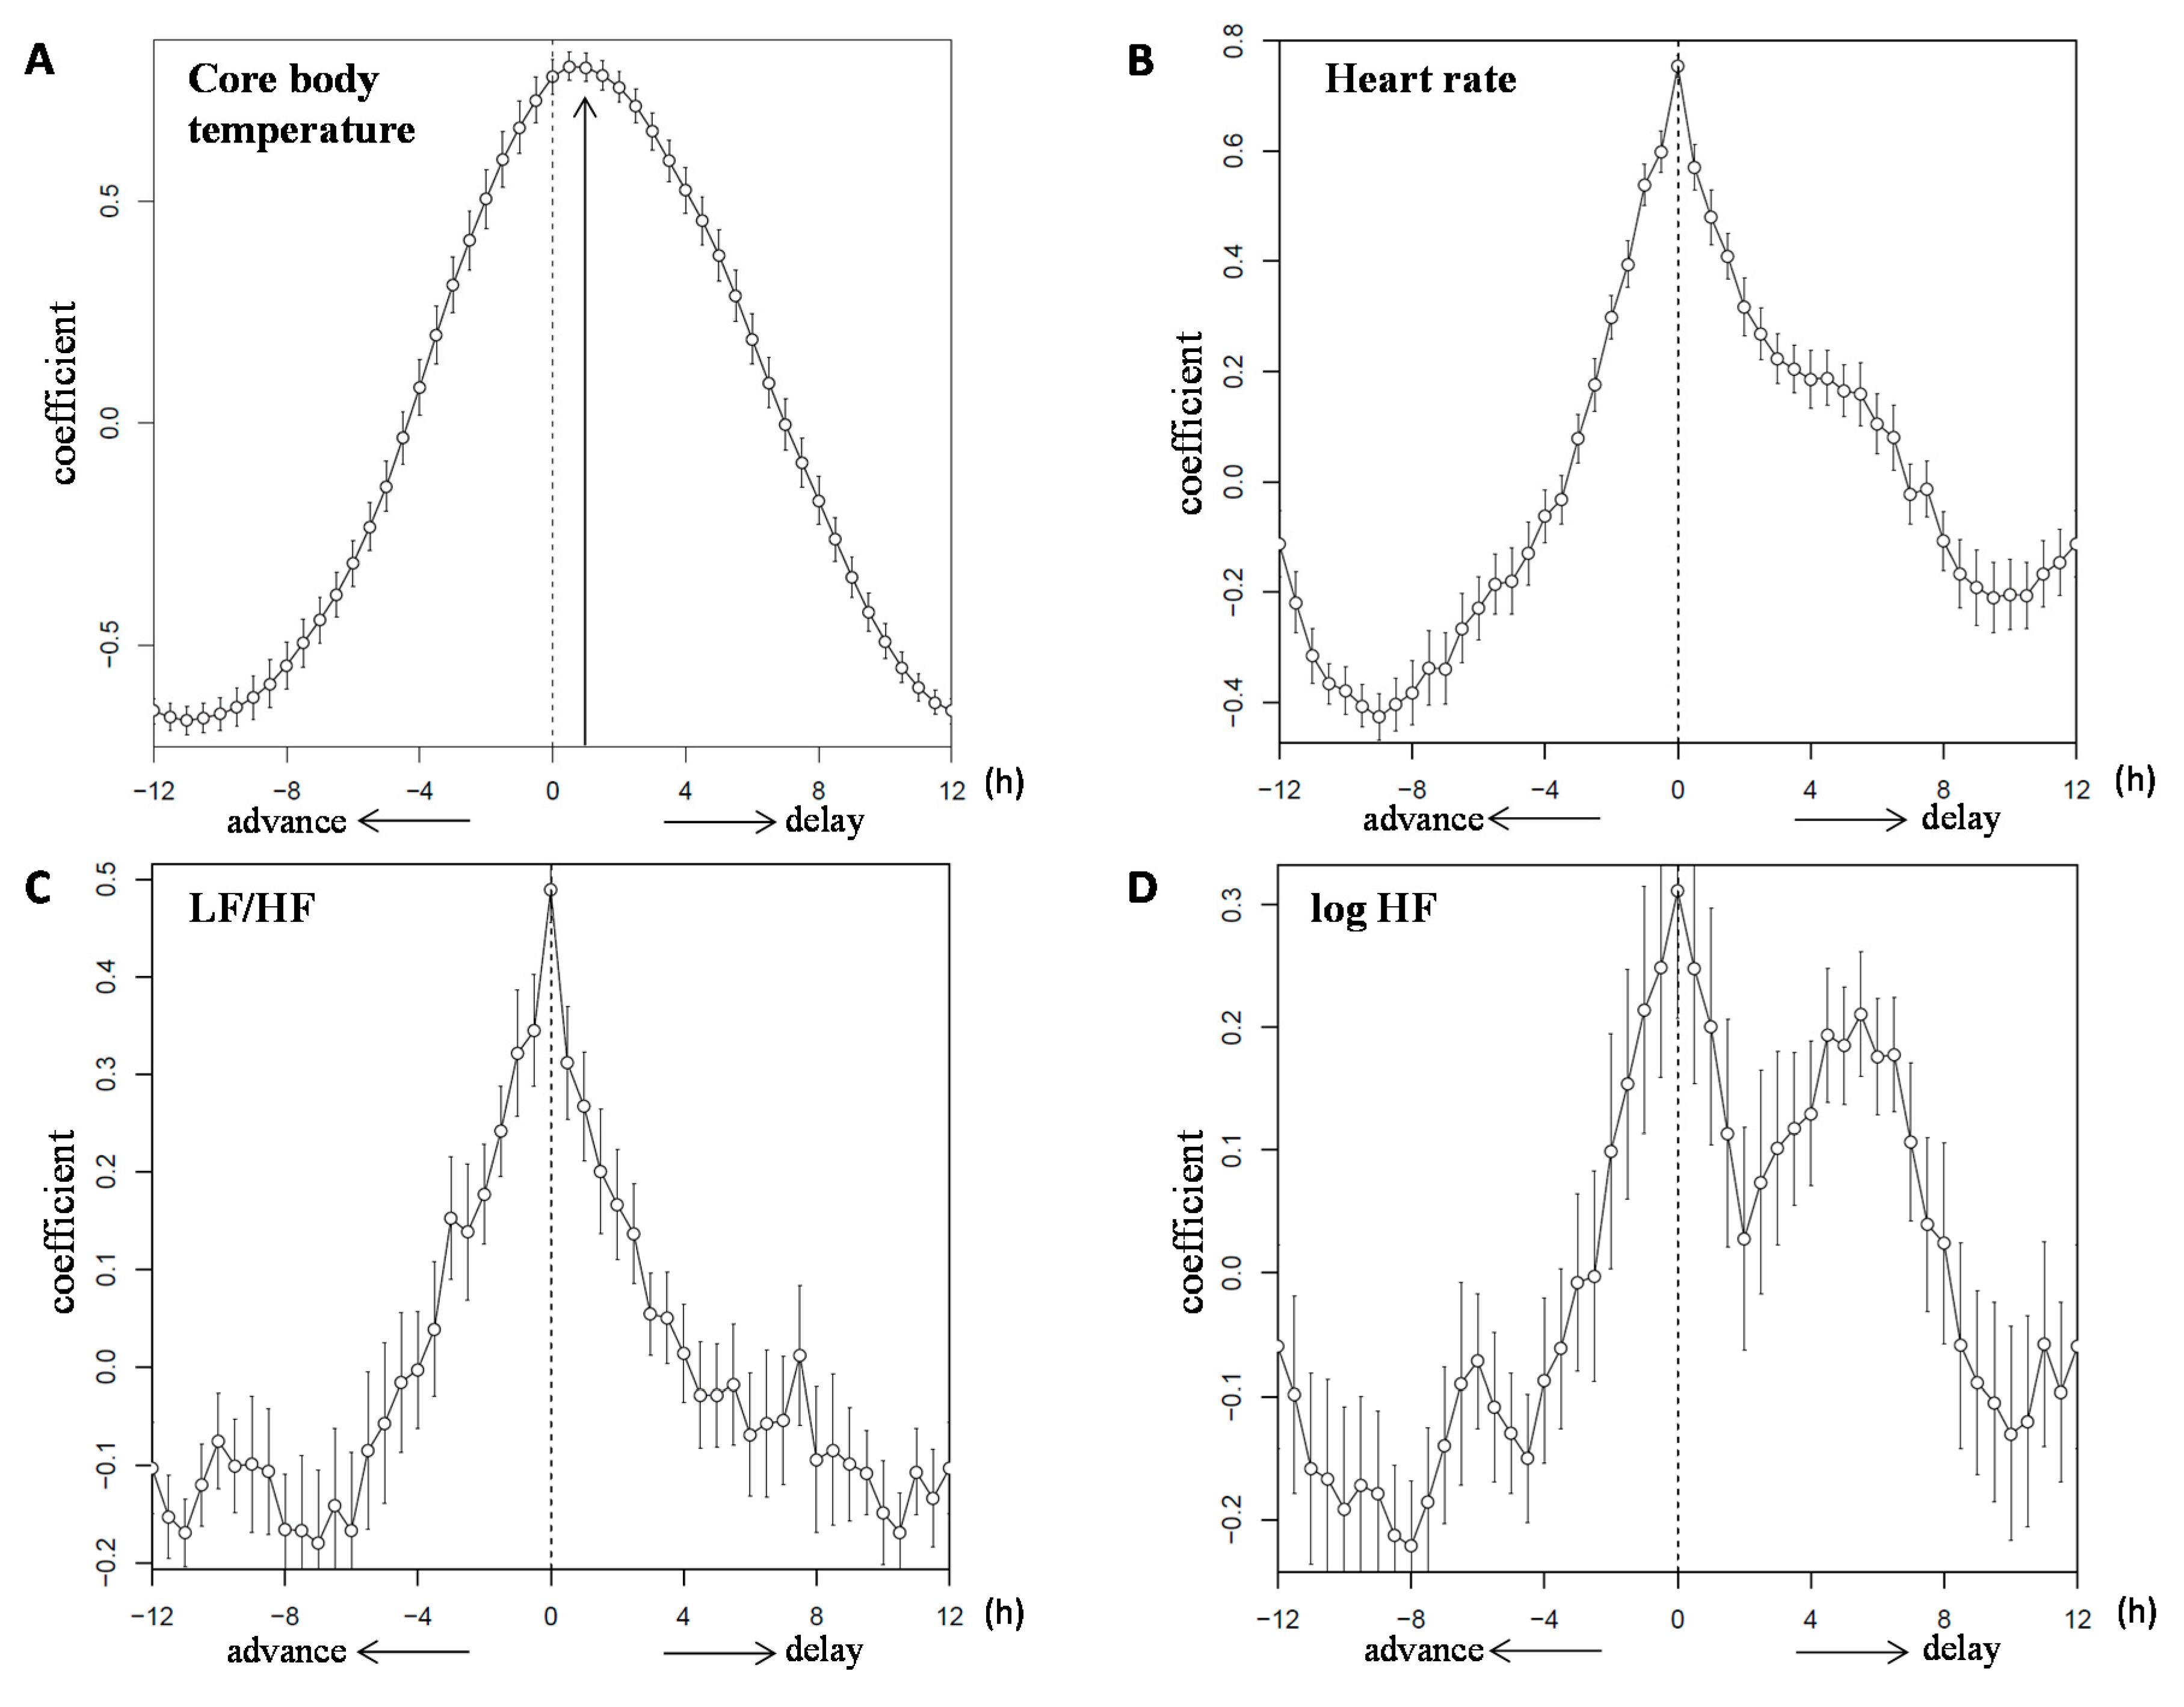
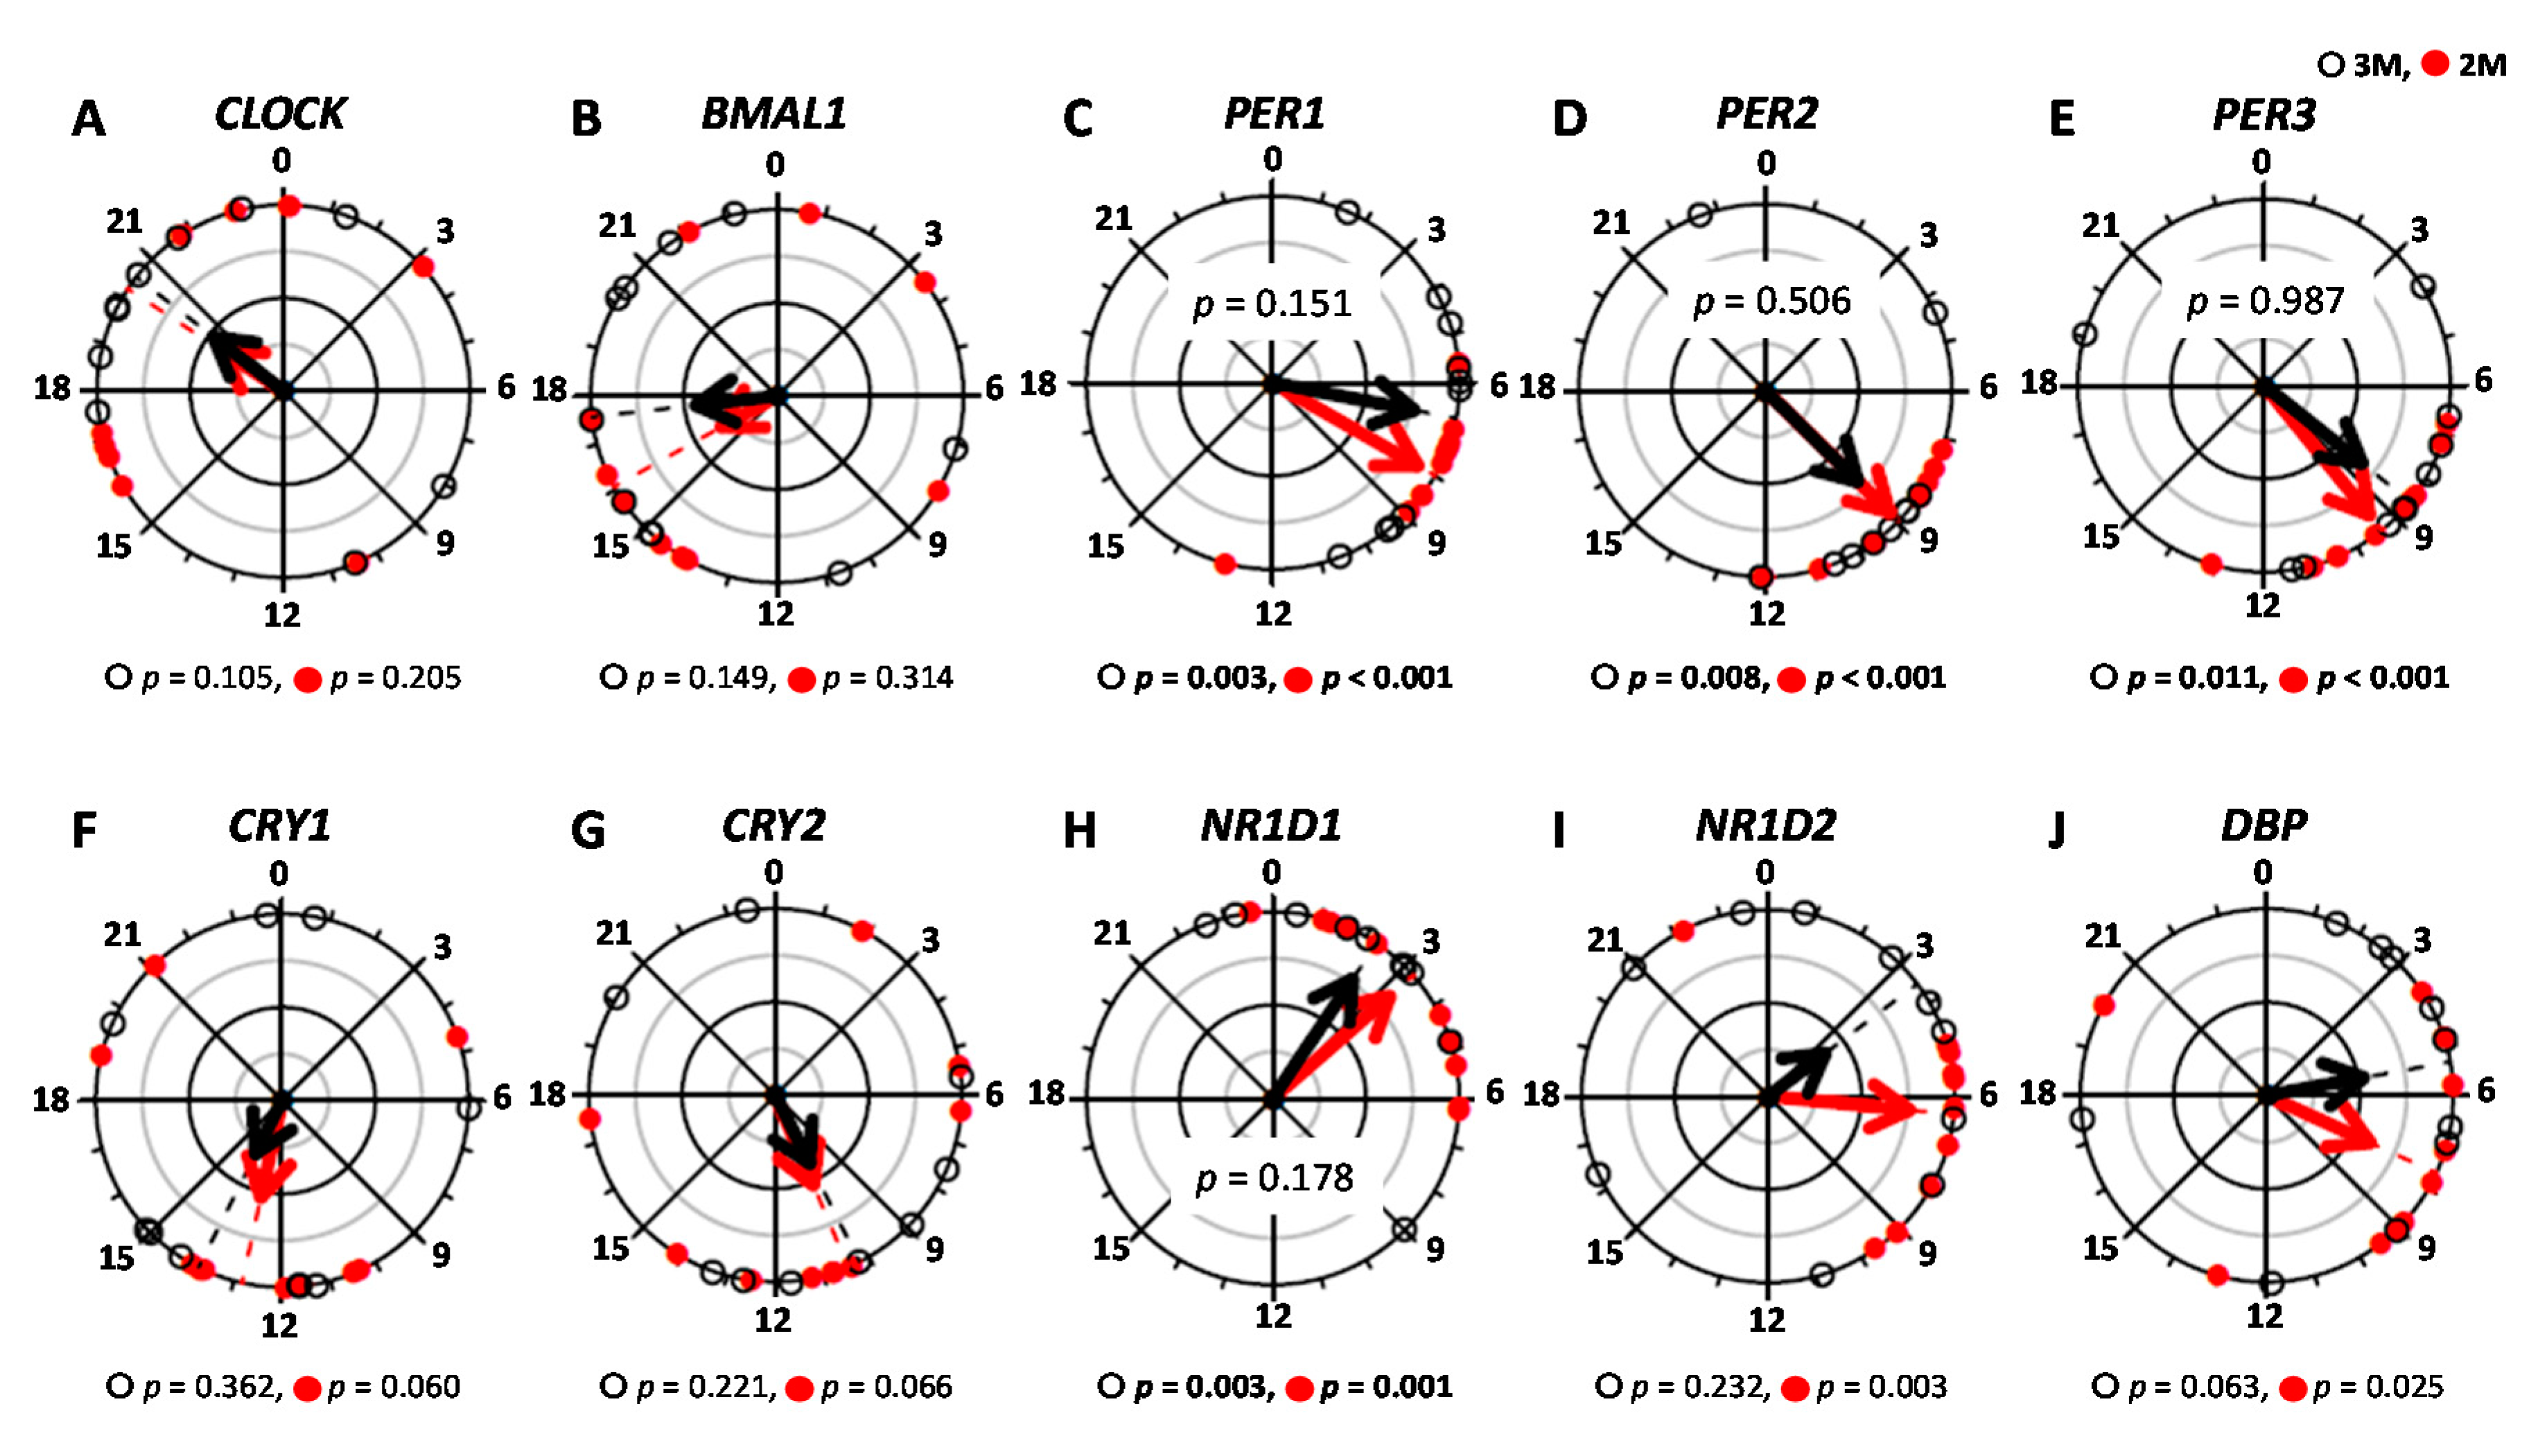
 ).The black arrow indicates the distribution width of the 3M condition (
 ) and the red arrow indicates the distribution width of the 2M condition (
 ). The p-value under the pie chart is the result of the Rayleigh test. The p-value in the pie chart was the result of the paired t-test. Radius of the pie chart = 1.
) and the closed circles indicate the 2M condition ().The black arrow indicates the distribution width of the 3M condition () and the red arrow indicates the distribution width of the 2M condition (). The p-value under the pie chart is the result of the Rayleigh test. The p-value in the pie chart was the result of the paired t-test. Radius of the pie chart = 1.
). The p-value under the pie chart is the result of the Rayleigh test. The p-value in the pie chart was the result of the paired t-test. Radius of the pie chart = 1.
) and the closed circles indicate the 2M condition ().The black arrow indicates the distribution width of the 3M condition () and the red arrow indicates the distribution width of the 2M condition (). The p-value under the pie chart is the result of the Rayleigh test. The p-value in the pie chart was the result of the paired t-test. Radius of the pie chart = 1.

| Parameter | Peak Time (h) | Amplitude | Mesor | |||||||||
|---|---|---|---|---|---|---|---|---|---|---|---|---|
| 3M | 2M | p-Value 2 | q-Value 3 | 3M | 2M | p-Value 2 | q-Value 3 | 3M | 2M | p-Value 2 | q-Value 3 | |
| CLOCK | 18.51 ± 1.70 | 19.73 ± 1.62 | − | 0.11 ± 0.02 | 0.11 ± 0.02 | 0.820 | 0.417 | 0.90 ± 0.10 | 0.98 ± 0.03 | 0.400 | 0.259 | |
| BMAL1 | 16.60 ± 1.59 | 17.44 ± 1.83 | − | 0.11 ± 0.02 | 0.10 ± 0.02 | 0.360 | 0.248 | 0.99 ± 0.09 | 0.98 ± 0.08 | 0.975 | 0.467 | |
| PER1 | 6.68 ± 0.90 | 8.10 ± 0.62 | 0.151 | 0.144 | 0.31 ± 0.11 | 0.23 ± 0.05 | 0.433 | 0.273 | 1.01 ± 0.25 | 0.81 ± 0.15 | 0.187 | 0.169 |
| PER2 | 10.44 ± 1.49 | 8.99 ± 0.48 | 0.506 | 0.297 | 0.19 ± 0.03 | 0.15 ± 0.02 | 0.238 | 0.193 | 1.10 ± 0.13 | 1.08 ± 0.10 | 0.418 | 0.268 |
| PER3 | 9.40 ± 1.28 | 9.42 ± 0.60 | 0.987 | 0.456 | 0.15 ± 0.03 | 0.14 ± 0.02 | 0.737 | 0.386 | 1.17 ± 0.19 | 1.23 ± 0.19 | 0.456 | 0.284 |
| CRY1 | 12.90 ± 2.04 | 13.05 ± 1.45 | − | 0.20 ± 0.03 | 0.13 ± 0.02 | 0.081 | 0.093 | 1.22 ± 0.14 | 1.25 ± 0.09 | 0.725 | 0.385 | |
| CRY2 | 12.61 ± 1.83 | 10.09 ± 1.43 | − | 0.13 ± 0.03 | 0.11 ± 0.01 | 0.617 | 0.353 | 1.12 ± 0.10 | 1.19 ± 0.10 | 0.350 | 0.245 | |
| NR1D1 | 7.29 ± 2.70 | 5.65 ± 2.09 | 0.178 | 0.163 | 0.21 ± 0.03 | 0.18 ± 0.03 | 0.518 | 0.308 | 0.14 ± 0.07 | 0.08 ± 0.04 | 0.857 | 0.430 |
| NR1D2 | 9.81 ± 2.50 | 8.34 ± 1.63 | − | 0.16 ± 0.02 | 0.15 ± 0.01 | 0.713 | 0.383 | 1.13 ± 0.07 | 1.20 ± 0.09 | 0.515 | 0.308 | |
| DBP | 6.79 ± 1.56 | 8.98 ± 1.48 | − | 0.23 ± 0.03 | 0.21 ± 0.03 | 0.647 | 0.364 | 1.21 ± 0.14 | 1.28 ± 0.15 | 0.548 | 0.322 | |
© 2020 by the authors. Licensee MDPI, Basel, Switzerland. This article is an open access article distributed under the terms and conditions of the Creative Commons Attribution (CC BY) license (http://creativecommons.org/licenses/by/4.0/).
Share and Cite
Ogata, H.; Horie, M.; Kayaba, M.; Tanaka, Y.; Ando, A.; Park, I.; Zhang, S.; Yajima, K.; Shoda, J.-i.; Omi, N.; et al. Skipping Breakfast for 6 Days Delayed the Circadian Rhythm of the Body Temperature without Altering Clock Gene Expression in Human Leukocytes. Nutrients 2020, 12, 2797. https://doi.org/10.3390/nu12092797
Ogata H, Horie M, Kayaba M, Tanaka Y, Ando A, Park I, Zhang S, Yajima K, Shoda J-i, Omi N, et al. Skipping Breakfast for 6 Days Delayed the Circadian Rhythm of the Body Temperature without Altering Clock Gene Expression in Human Leukocytes. Nutrients. 2020; 12(9):2797. https://doi.org/10.3390/nu12092797
Chicago/Turabian StyleOgata, Hitomi, Masaki Horie, Momoko Kayaba, Yoshiaki Tanaka, Akira Ando, Insung Park, Simeng Zhang, Katsuhiko Yajima, Jun-ichi Shoda, Naomi Omi, and et al. 2020. "Skipping Breakfast for 6 Days Delayed the Circadian Rhythm of the Body Temperature without Altering Clock Gene Expression in Human Leukocytes" Nutrients 12, no. 9: 2797. https://doi.org/10.3390/nu12092797
APA StyleOgata, H., Horie, M., Kayaba, M., Tanaka, Y., Ando, A., Park, I., Zhang, S., Yajima, K., Shoda, J.-i., Omi, N., Kaneko, M., Kiyono, K., Satoh, M., & Tokuyama, K. (2020). Skipping Breakfast for 6 Days Delayed the Circadian Rhythm of the Body Temperature without Altering Clock Gene Expression in Human Leukocytes. Nutrients, 12(9), 2797. https://doi.org/10.3390/nu12092797