Effect of White Potatoes on Subjective Appetite, Food Intake, and Glycemic Response in Healthy Older Adults


 ,
,  ,
,
Abstract
:1. Introduction
2. Materials and Methods
2.1. Participants
2.2. Experimental Design
Test Treatments
2.3. Experimental Procedures
2.3.1. Subjective Appetite and Emotions
2.3.2. Food and Water Intake
2.3.3. Blood Glucose
2.4. Statistical Analyses
3. Results
3.1. Subjective Appetite and Emotions
3.2. Food and Water Intake
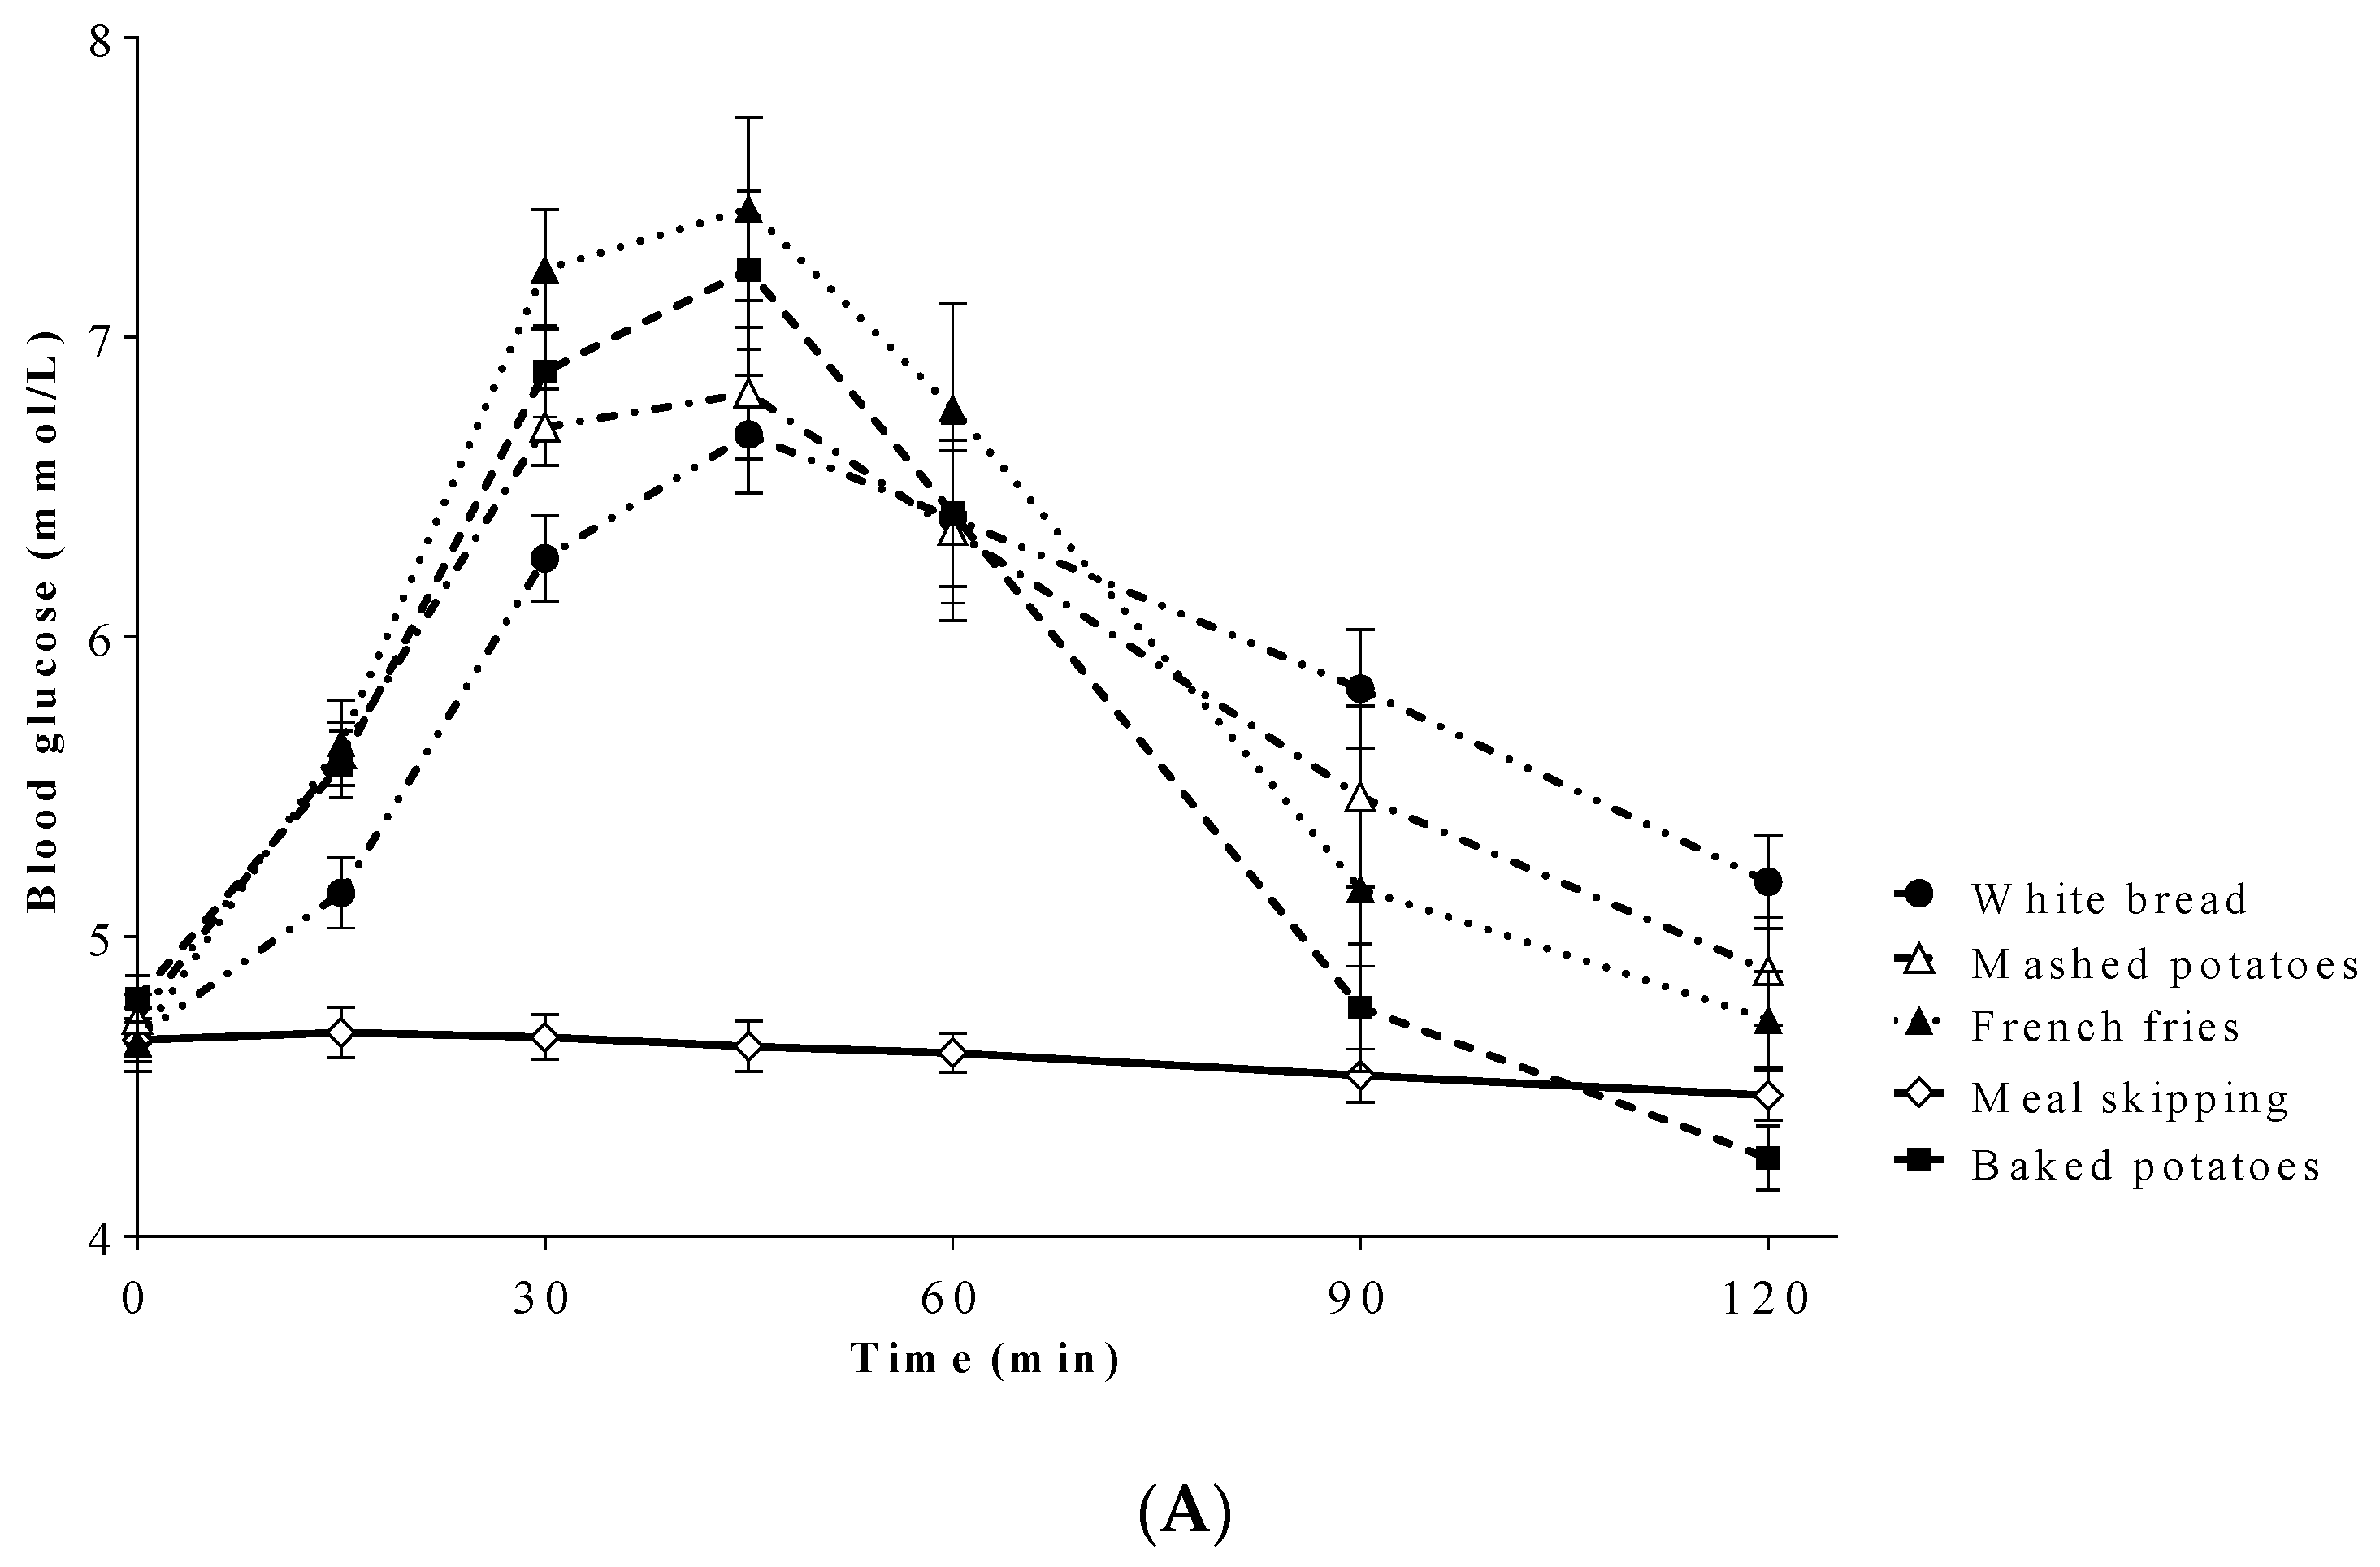
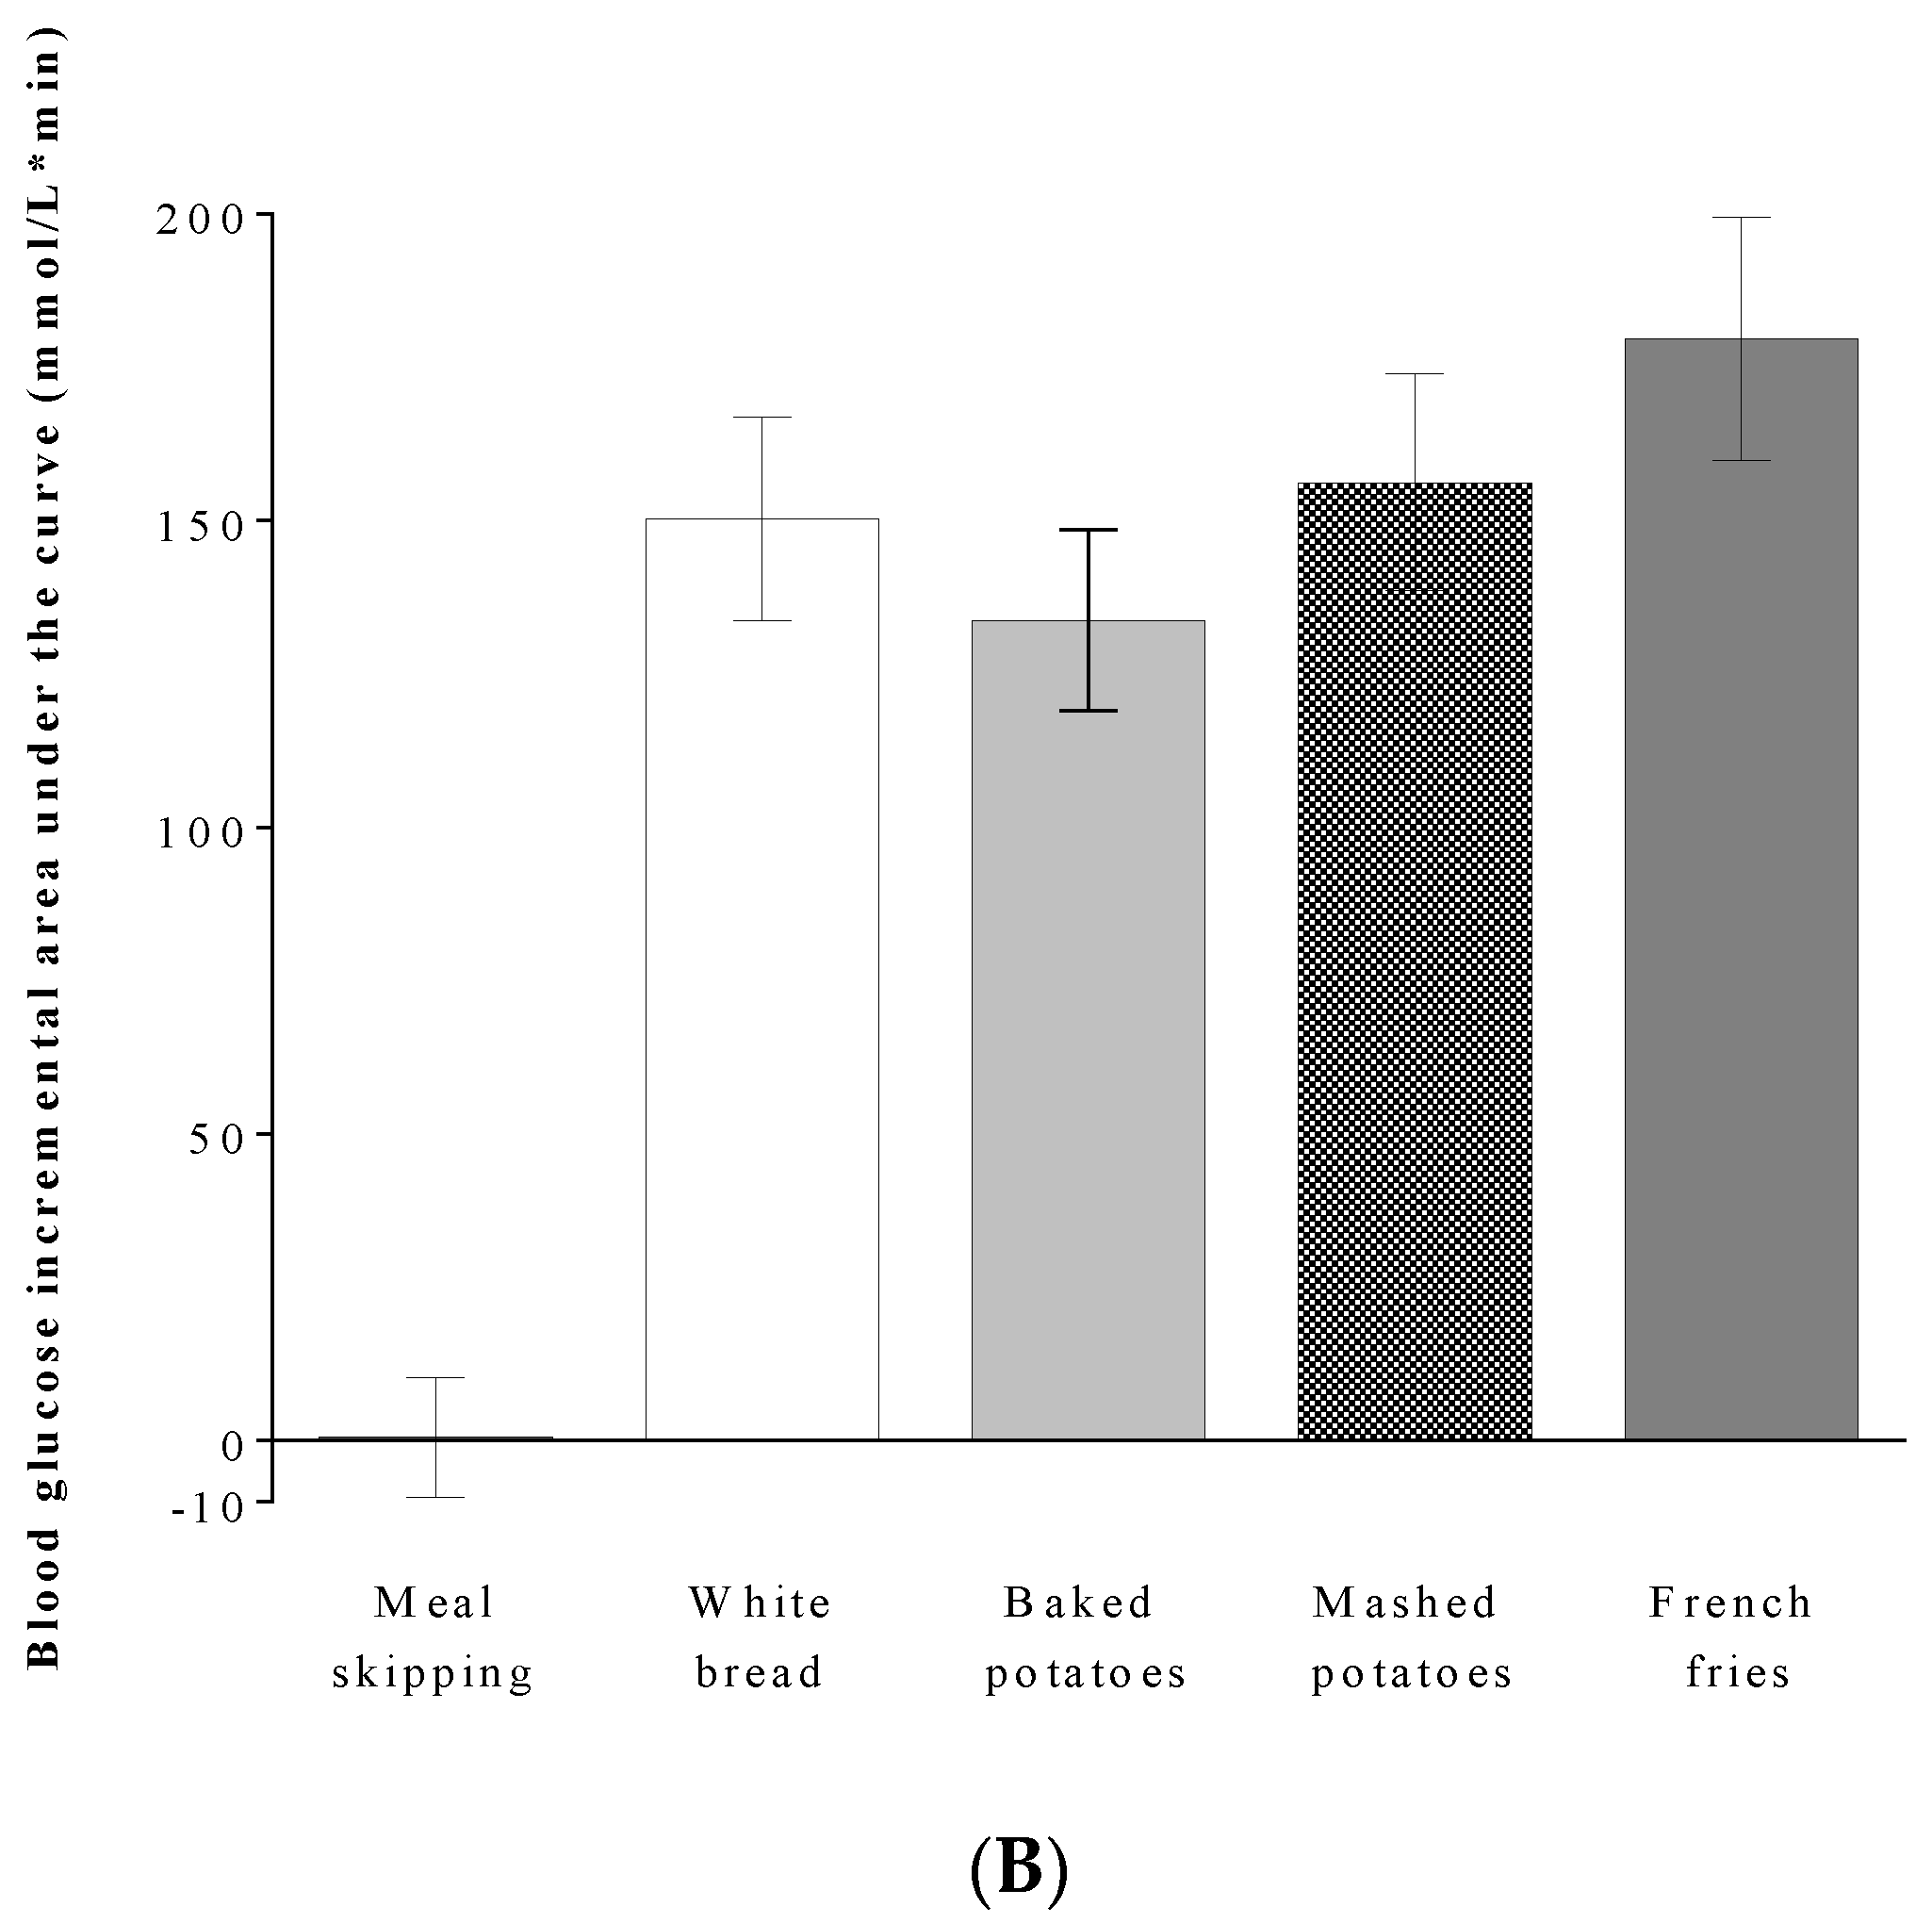
3.3. Blood Glucose
3.4. Correlations
4. Discussion
5. Conclusions
Author Contributions
Funding
Acknowledgments
Conflicts of Interest
References
- Vincent, G.K.; Velkoff, V.A.; U.S. Census Bureau. The Next Four Decades: The Older Population in the United States: 2010 to 2050; U.S. Department of Commerce, Economics and Statistics Administration, U.S. Census Bureau: Washington, DC, USA, 2010.
- Statistics Canada. Canada’s Population Estimates: Age and Sex. 1 July 2018. Available online: https://www150.statcan.gc.ca/n1/en/daily-quotidien/190125/dq190125a-eng.pdf?st=cq5Y3Q5o (accessed on 20 August 2019).
- Donini, L.M.; Savina, C.; Cannella, C. Eating habits and appetite control in the elderly: The anorexia of aging. Int. Psychogeriatr. 2003, 15, 73–87. [Google Scholar] [CrossRef]
- Rolls, B.J. Aging and appetite. Nutr. Rev. 1992, 50, 422–426. [Google Scholar] [CrossRef]
- Rolls, B.J. Appetite, hunger, and satiety in the elderly. Crit. Rev. Food Sci. 1993, 33, 39–44. [Google Scholar] [CrossRef]
- Rolls, B.J.; Dimeo, K.A.; Shide, D.J. Age-related impairments in the regulation of food intake. Am. J. Clin. Nutr. 1995, 62, 923–931. [Google Scholar] [CrossRef]
- Zandstra, E.H.; Mathey, M.A.; de Graaf, C.; van Staveren, W.A. Short-term regulation of food intake in children, young adults and the elderly. Eur. J. Clin. Nutr. 2000, 54, 239–246. [Google Scholar] [CrossRef]
- Arterburn, D.E.; Crane, P.K.; Sullivan, S.D. The coming epidemic of obesity in elderly Americans. J. Am. Geriatr. Soc. 2004, 52, 1907–1912. [Google Scholar] [CrossRef]
- Kirkman, M.S.; Briscoe, V.J.; Clark, N.; Florez, H.; Haas, L.B.; Halter, J.B.; Huang, E.S.; Korytkowski, M.T.; Munshi, M.N.; Odegard, P.S.; et al. Diabetes in Older Adults. Diabetes Care 2012, 35, 2650–2664. [Google Scholar] [CrossRef] [Green Version]
- Leslie, W.; Hankey, C. Aging, Nutritional Status and Health. Healthcare 2015, 3, 648–658. [Google Scholar] [CrossRef] [Green Version]
- Tian, J.; Chen, S.; Chen, J.; Ye, X. Health benefits of the potato affected by domestic cooking: A review. Food Chem. 2016, 202, 165–175. [Google Scholar] [CrossRef]
- Mozaffarian, D.; Hao, T.; Rimm, E.B.; Willett, W.C.; Hu, F.B. Changes in Diet and Lifestyle and Long-Term Weight Gain in Women and Men. N. Engl. J. 2011, 364, 2392–2404. [Google Scholar] [CrossRef] [Green Version]
- Muraki, I.; Rimm, E.B.; Willett, W.C.; Manson, J.E.; Hu, F.B.; Sun, Q. Potato Consumption and Risk of Type 2 Diabetes: Results from Three Prospective Cohort Studies. Diabetes Care 2016, 39, 376–384. [Google Scholar] [CrossRef] [PubMed] [Green Version]
- Veronese, N.; Stubbs, B.; Noale, M.; Solmi, M.; Vaona, A.; Demurtas, J.; Nicetto, D.; Crepaldi, G.; Schofield, P.; Koyanagi, A. Fried potato consumption is associated with elevated mortality: An 8-y longitudinal cohort study. Am. J. Clin. Nutr. 2017, 106, 162–167. [Google Scholar] [CrossRef] [PubMed]
- Johnston, E.A.; Petersen, K.S.; Kris-Etherton, P.M. Daily intake of non-fried potato does not affect markers of glycemia and is associated with better diet quality compared to refined grains: A randomized, crossover study in healthy adults. Br. J. Nutr. 2020, 123, 1032–1042. [Google Scholar] [CrossRef] [PubMed] [Green Version]
- Akilen, R.; Deljoomanesh, N.; Hunschede, S.; Smith, C.E.; Arshad, M.U.; Kubant, R.; Anderson, G.H. The effects of potatoes and other carbohydrate side dishes consumed with meat on food intake, glycemia and satiety response in children. Nutr. Diabetes 2016, 6, e195. [Google Scholar] [CrossRef] [PubMed] [Green Version]
- Lee, J.J.; Brett, N.R.; Chang, J.T.; Zepetnek, J.O.T.; Bellissimo, N. Effects of White Potatoes Consumed with Eggs on Satiety, Food Intake, and Glycemic Response in Children and Adolescents. J. Am. Coll. Nutr. 2019, 39, 147–154. [Google Scholar] [CrossRef] [PubMed]
- Holt, S.H.A. The effects of high-carbohydrate vs high-fat breakfasts on feelings of fullness and alertness, and subsequent food intake. Int. J. Food Sci. Nutr. 1999, 50, 13–28. [Google Scholar] [CrossRef]
- Leeman, M.; Östman, E.; Björck, I. Glycaemic and satiating properties of potato products. Eur. J. Clin. Nutr. 2008, 62, 87–95. [Google Scholar] [CrossRef] [Green Version]
- Kaplan, R.J.; Greenwood, C.E. Influence of dietary carbohydrates and glycaemic response on subjective appetite and food intake in healthy elderly persons. Int. J. Food Sci. Nutr. 2002, 53, 305–316. [Google Scholar] [CrossRef]
- Fakhouri, T.H.; Ogden, C.L.; Carroll, M.D.; Kit, B.K.; Flegal, K.M. Prevalence of Obesity Among Older Adults in the United States, 2007–2010; US Department of Health and Human Services, Centers for Disease Control and Prevention, National Center for Health Statistics: Hyattsville, MD, USA, 2012.
- Johnson, M.A.; Bales, C.W. Is there a best body mass index for older adults? Moving closer to evidence-based recommendations regarding "overweight," health, and mortality. J. Nutr. Gerontol. Geriatr. 2014, 33, 1–9. [Google Scholar] [CrossRef]
- Starr, K.N.P.; Bales, C.W. Excessive Body Weight in Older Adults. Clin. Geriatr. Med. 2015, 31, 311–326. [Google Scholar] [CrossRef] [Green Version]
- O’Neil, C.; Byrd-Bredbenner, C.; Hayes, D.; Jana, L.; Klinger, S.; Stephenson-Martin, S. The Role of Breakfast in Health: Definition and Criteria for a Quality Breakfast. J. Acad. Nutr. Diet. 2014, 114, S8–S26. [Google Scholar] [CrossRef]
- Goldenberg, R.; Punthakee, Z. Definition, classification and diagnosis of diabetes, prediabetes and metabolic syndrome. Can. J. Diabetes 2013, 37, S8–S11. [Google Scholar] [CrossRef] [Green Version]
- BOD POD. Operator’s Manual. Life Measurement, 1st ed.; Life Measurement, Inc.: Concord, CA, USA, 2000. [Google Scholar]
- Siri, W.E. Body composition from fluid spaces and density: Analysis of methods. 1961. Nutrition 1993, 9, 480–491. [Google Scholar]
- United States Department of Agriculture [USDA]. Food Data Central: Potatoes, Russet, Flesh and Skin, Baked. Available online: https://fdc.nal.usda.gov/fdc-app.html#/food-details/170030/nutrients (accessed on 17 March 2018).
- Health Canada. Draft Guidance Document—Satiety Health Claims on Food. Available online: https://www.canada.ca/en/health-canada/services/food-nutrition/public-involvement-partnerships/technical-consultation-health-canada-draft-guidance-document-satiety-health-claims-food/consultation.html (accessed on 20 June 2020).
- Association of Official Analytical Chemists [AOAC]. Official Methods of Analysis of AOAC International; AOAC International: Gaithersburg, MD, USA, 2016. [Google Scholar]
- Bennett, L.; de Zepetnek, J.O.T.; Brett, N.; Poirier, K.; Guo, Q.; Rousseau, D.; Bellissimo, N. Effect of Commercially Available Sugar-Sweetened Beverages on Subjective Appetite and Short-Term Food Intake in Girls. Nutrients 2018, 10, 394. [Google Scholar] [CrossRef] [Green Version]
- Poirier, K.L.; de Zepetnek, J.O.T.; Bennett, L.J.; Brett, N.R.; Boateng, T.; Schwartz, A.; Luhovyy, B.L.; Bellissimo, N. Effect of Commercially Available Sugar-Sweetened Beverages on Subjective Appetite and Short-Term Food Intake in Boys. Nutrients 2019, 11, 270. [Google Scholar] [CrossRef] [Green Version]
- Guo, Q.; de Zepetnek, J.O.T.; Chang, J.; Hayden, J.; Crozier, S.J.; Mongia, G.; Rousseau, D.; Bellissimo, N. Effect of Midmorning Puree Snacks on Subjective Appetite, Food Intake, and Glycemic and Insulin Responses in Healthy Adults. J. Am. Coll. Nutr. 2018, 37, 659–669. [Google Scholar] [CrossRef]
- Lee, J.J.; Brett, N.R.; Wong, V.C.; de Zepetnek, J.O.T.; Fiocco, A.J.; Bellissimo, N. Effects of Potatoes and Other Carbohydrate-Containing Foods on Cognitive Performance, Glycemic Response, and Satiety in Children. Appl. Physiol. Nutr. Metab. 2019, 44, 1012–1019. [Google Scholar] [CrossRef]
- Branton, A.; Akhavan, T.; Gladanac, B.; Pollard, D.; Welch, J.; Rossiter, M.; Bellissimo, N. Pre-meal video game playing and a glucose preload suppress food intake in normal weight boys. Appetite 2014, 83, 256–262. [Google Scholar] [CrossRef]
- Van Engelen, M.; Khodabandeh, S.; Akhavan, T.; Agarwal, J.; Gladanac, B.; Bellissimo, N. Effect of sugars in solutions on subjective appetite and short-term food intake in 9- to 14-year-old normal weight boys. Eur. J. Clin. Nutr. 2014, 68, 773–777. [Google Scholar] [CrossRef] [Green Version]
- Wolever, T.M.; Jenkins, D.J.; Jenkins, A.L.; Josse, R.G. The glycemic index: Methodology and clinical implications. Am. J. Clin. Nutr. 1991, 54, 846–854. [Google Scholar] [CrossRef]
- Holt, S.H.; Brand Miller, J.; Petocz, P.; Farmakalidis, E. A satiety index of common foods. Eur. J. Clin. Nutr. 1995, 49, 675–690. [Google Scholar]
- Hill, A.J.; Peikin, S.R.; Ryan, C.A.; Blundell, J.E. Oral administration of proteinase inhibitor II from potatoes reduces energy intake in man. Physiol. Behav. 1990, 48, 241–246. [Google Scholar] [CrossRef]
- Komarnytsky, S.; Cook, A.; Raskin, I. Potato protease inhibitors inhibit food intake and increase circulating cholecystokinin levels by a trypsin-dependent mechanism. Int. J. Obes. 2011, 35, 236–243. [Google Scholar] [CrossRef] [Green Version]
- Zhu, Y.; Lasrado, J.A.; Hu, J. Potato protease inhibitor II suppresses postprandial appetite in healthy women: A randomized double-blind placebo-controlled trial. Food Funct. 2017, 8, 1988–1993. [Google Scholar] [CrossRef]
- De Graaf, C.; Blom, W.A.M.; Smeets, P.A.M.; Stafleu, A.; Heniks, H.F.J. Biomarkers of satiation and satiety. Am. J. Clin. Nutr. 2004, 79, 946–961. [Google Scholar] [CrossRef] [Green Version]
- MacIntosh, C.G.; Morley, J.E.; Wishart, J.; Morris, H.; Jansen, J.B.M.J.; Horowitz, M.; Chapman, I.M. Effect of Exogenous Cholecystokinin (CCK)-8 on Food Intake and Plasma CCK, Leptin, and Insulin Concentrations in Older and Young Adults: Evidence for Increased CCK Activity as a Cause of the Anorexia of Aging. J. Clin. Endocrinol. Metab. 2001, 86, 5830–5837. [Google Scholar] [CrossRef]
- Clarkston, W.; Pantano, M.; Morley, J.; Horowitz, M.; Littlefield, J.; Burton, F. Evidence for the anorexia of aging: Gastrointestinal transit and hunger in healthy elderly vs. young adults. Am. J. Physiol. Regul. Integr. Comp. Physiol. 1997, 272, R243–R248. [Google Scholar] [CrossRef]
- Sturm, K.; MacIntosh, C.G.; Parker, B.A.; Wishart, J.; Horowitz, M.; Chapman, I.M. Appetite, food intake, and plasma concentrations of cholecystokinin, ghrelin, and other gastrointestinal hormones in undernourished older women and well-nourished young and older women. J. Clin. Endocrinol. Metab. 2003, 88, 3747–3755. [Google Scholar] [CrossRef] [Green Version]
- Atalayer, D.; Astbury, N.M. Anorexia of aging and gut hormones. Aging Dis. 2013, 4, 264–275. [Google Scholar] [CrossRef]
- Kalyani, R.R.; Egan, J.M. Diabetes and altered glucose metabolism with aging. Endocrin. Metab. Clin. 2013, 42, 333–347. [Google Scholar] [CrossRef] [Green Version]
- Chia, C.W.; Egan, J.M.; Ferrucci, L. Age-related changes in glucose metabolism, hyperglycemia, and cardiovascular risk. Circ. Res. 2018, 123, 886–904. [Google Scholar] [CrossRef] [PubMed]
- Roberts, S.B.; Rosenberg, I. Nutrition and aging: Changes in the regulation of energy metabolism with aging. Physiol. Rev. 2006, 86, 651–667. [Google Scholar] [CrossRef] [PubMed]
- Fernandes, G.; Velangi, A.; Wolever, T.M. Glycemic index of potatoes commonly consumed in North America. J. Am. Diet. Assoc. 2005, 105, 557–562. [Google Scholar] [CrossRef] [PubMed]
- Gentilcore, D.; Chaikomin, R.; Jones, K.L.; Russo, A.; Feinle-Bisset, C.; Wishart, J.M.; Rayner, C.K.; Horowitz, M. Effects of Fat on Gastric Emptying of and the Glycemic, Insulin, and Incretin Responses to a Carbohydrate Meal in Type 2 Diabetes. J. Clin. Endocrinol. Metab. 2006, 91, 2062–2067. [Google Scholar] [CrossRef]
- Cecil, J.E.; Francis, J.; Read, N.W. Comparison of the Effects of a High-Fat and High-Carbohydrate Soup Delivered Orally and Intragastrically on Gastric Emptying, Appetite, and Eating Behaviour. Physiol. Behav. 1999, 67, 299–306. [Google Scholar] [CrossRef]
- Feinle, C.; O’Donovan, D.; Doran, S.; Andrews, J.M.; Wishart, J.; Chapman, I.; Horowitz, M. Effects of fat digestion on appetite, APD motility, and gut hormones in response to duodenal fat infusion in humans. Am. J. Physiol. Gastrointest. Liver Physiol. 2003, 284, G798–G807. [Google Scholar] [CrossRef] [Green Version]
- Di Francesco, V.; Zamboni, M.; Zoico, E.; Mazzali, G.; Dioli, A.; Omizzolo, F.; Bissoli, L.; Fantin, F.; Rizzotti, P.; Solerte, S.B. Unbalanced serum leptin and ghrelin dynamics prolong postprandial satiety and inhibit hunger in healthy elderly: Another reason for the “anorexia of aging”. Am. J. Clin. Nutr. 2006, 83, 1149–1152. [Google Scholar] [CrossRef] [Green Version]
- Holt, S.; Brand, J.; Soveny, C.; Hansky, J. Relationship of satiety to postprandial glycaemic, insulin and cholecystokinin responses. Appetite 1992, 18, 129–141. [Google Scholar] [CrossRef]
- Nair, N.S.; Brennan, I.M.; Little, T.J.; Gentilcore, D.; Hausken, T.; Jones, K.L.; Wishart, J.M.; Horowitz, M.; Feinle-Bisset, C. Reproducibility of energy intake, gastric emptying, blood glucose, plasma insulin and cholecystokinin responses in healthy young males. Br. J. Nutr. 2009, 101, 1094–1102. [Google Scholar] [CrossRef] [Green Version]
- Wilson, M.-M.G.; Morley, J.E. Invited review: Aging and energy balance. J. Appl. Physiol. 2003, 95, 1728–1736. [Google Scholar] [CrossRef]


| White Bread | Baked Potatoes | Mashed Potatoes | French Fries | |
|---|---|---|---|---|
| Total energy (kcal) | 280 | 288 | 283 | 280 |
| Total protein (g) † | 5.7 (8.1%) | 4.6 (6.4%) | 3.3 (4.7%) | 3.0 (4.3%) |
| Total carbohydrates (g) | 35.0 | 37.1 | 36.4 | 36.2 |
| Fiber (g) | 1.9 | 4.0 | 3.3 | 3.1 |
| Available carbohydrates (g) † | 33.1 (47.3%) | 33.1 (46.0%) | 33.1 (46.8%) | 33.1 (47.3%) |
| Total fat (g) † | 13.7 (44.0%) | 13.7 (42.8%) | 13.7 (43.6%) | 13.7 (44.0%) |
| Variable | Means ± SEM |
|---|---|
| Age (y) | 70.4 ± 0.6 |
| Body mass (kg) | 67.9 ± 2.8 |
| Height (cm) | 167.2 ± 2.4 |
| BMI (kg/m2) | 24.1 ± 0.6 |
| Fat mass 1 (%) | 33.0 ± 2.4 |
| Fat-free mass 1 (%) | 67.0 ± 2.4 |
| Fasting blood glucose (mmol/L) | 4.7 ± 0.1 |
| Test Treatment | ||||||
|---|---|---|---|---|---|---|
| Meal Skipping | White Bread | Baked Potatoes | Mashed Potatoes | French Fries | p-Value | |
| Lunch FI (kcal) | 951.2 ± 122.6 a | 776.9 ± 69.8 b | 736.1 ± 76.4 b | 771.6 ± 89.4 b | 755.8 ± 100 b | <0.001 |
| Cumulative FI 1 (kcal) | 951.2 ± 122.6 | 1057.4±69.8 | 1024.1±76.4 | 1035.8±89.4 | 1035.8±100 | 0.26 |
| Water intake with test treatment (g) | 319.2 ± 39.1 | 375.9 ± 28.2 | 350.3 ± 32.4 | 368.3 ± 41.5 | 340.2 ± 33.9 | 0.60 |
| Water intake at lunch (g) | 352 ± 31.4 | 382.7 ± 38.7 | 330.9 ± 27.3 | 390.9 ± 29.4 | 356.9 ± 37.0 | 0.27 |
| Pleasantness of test treatment (/100 units) | - | 42.2 ± 6.5 a | 60.1 ± 5.6 b | 49.1 ± 7.2 a,b | 61.5 ± 5.6 b | <0.001 |
© 2020 by the authors. Licensee MDPI, Basel, Switzerland. This article is an open access article distributed under the terms and conditions of the Creative Commons Attribution (CC BY) license (http://creativecommons.org/licenses/by/4.0/).
Share and Cite
Bellissimo, N.; Amalraj, R.; Lee, J.J.; Brett, N.R.; Totosy de Zepetnek, J.O.; Proteau, S.; Rousseau, D. Effect of White Potatoes on Subjective Appetite, Food Intake, and Glycemic Response in Healthy Older Adults. Nutrients 2020, 12, 2606. https://doi.org/10.3390/nu12092606
Bellissimo N, Amalraj R, Lee JJ, Brett NR, Totosy de Zepetnek JO, Proteau S, Rousseau D. Effect of White Potatoes on Subjective Appetite, Food Intake, and Glycemic Response in Healthy Older Adults. Nutrients. 2020; 12(9):2606. https://doi.org/10.3390/nu12092606
Chicago/Turabian StyleBellissimo, Nick, Robena Amalraj, Jennifer J. Lee, Neil R. Brett, Julia O. Totosy de Zepetnek, Sarah Proteau, and Dérick Rousseau. 2020. "Effect of White Potatoes on Subjective Appetite, Food Intake, and Glycemic Response in Healthy Older Adults" Nutrients 12, no. 9: 2606. https://doi.org/10.3390/nu12092606
APA StyleBellissimo, N., Amalraj, R., Lee, J. J., Brett, N. R., Totosy de Zepetnek, J. O., Proteau, S., & Rousseau, D. (2020). Effect of White Potatoes on Subjective Appetite, Food Intake, and Glycemic Response in Healthy Older Adults. Nutrients, 12(9), 2606. https://doi.org/10.3390/nu12092606