Aspects of Dietary Diversity Changes across Adulthood in Racially Diverse Adults

 , ,
, ,  ,
,
Abstract
1. Introduction
2. Methods
2.1. Background on Healthy Aging in Neighborhoods of Diversity across the Life Span (HANDLS) Study
2.2. Study Sample
2.3. Dietary Intake Assessment
2.4. Dietary Diversity Measurements
2.5. Demographic and Health-Related Measures
2.6. Statistical Analyses
3. Results
3.1. Population Characteristics
3.2. Dietary Diversity Scores and Energy Intakes
3.3. Correlation Between DD Scores
3.4. Longitudinal Change in DD Scores
3.4.1. Linear Mixed-Effects Model Estimates for Count
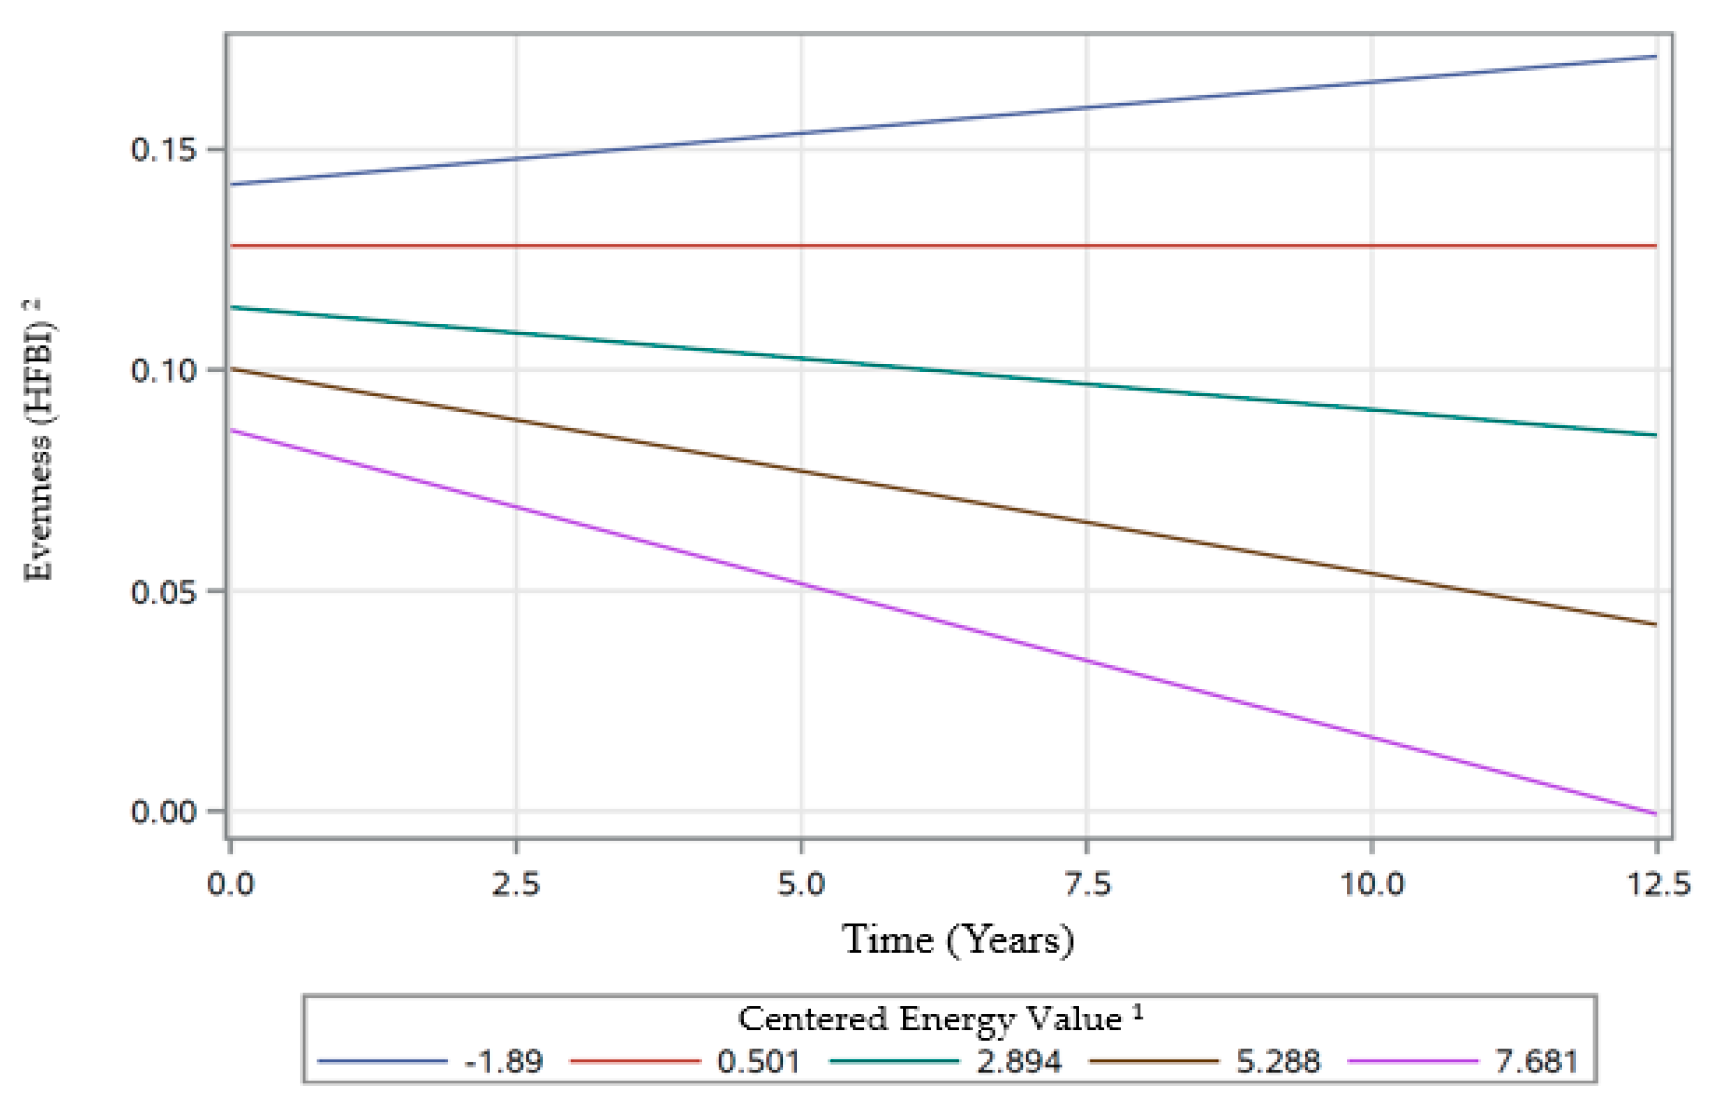
3.4.2. Linear Mixed-Effects Model Estimates for Evenness
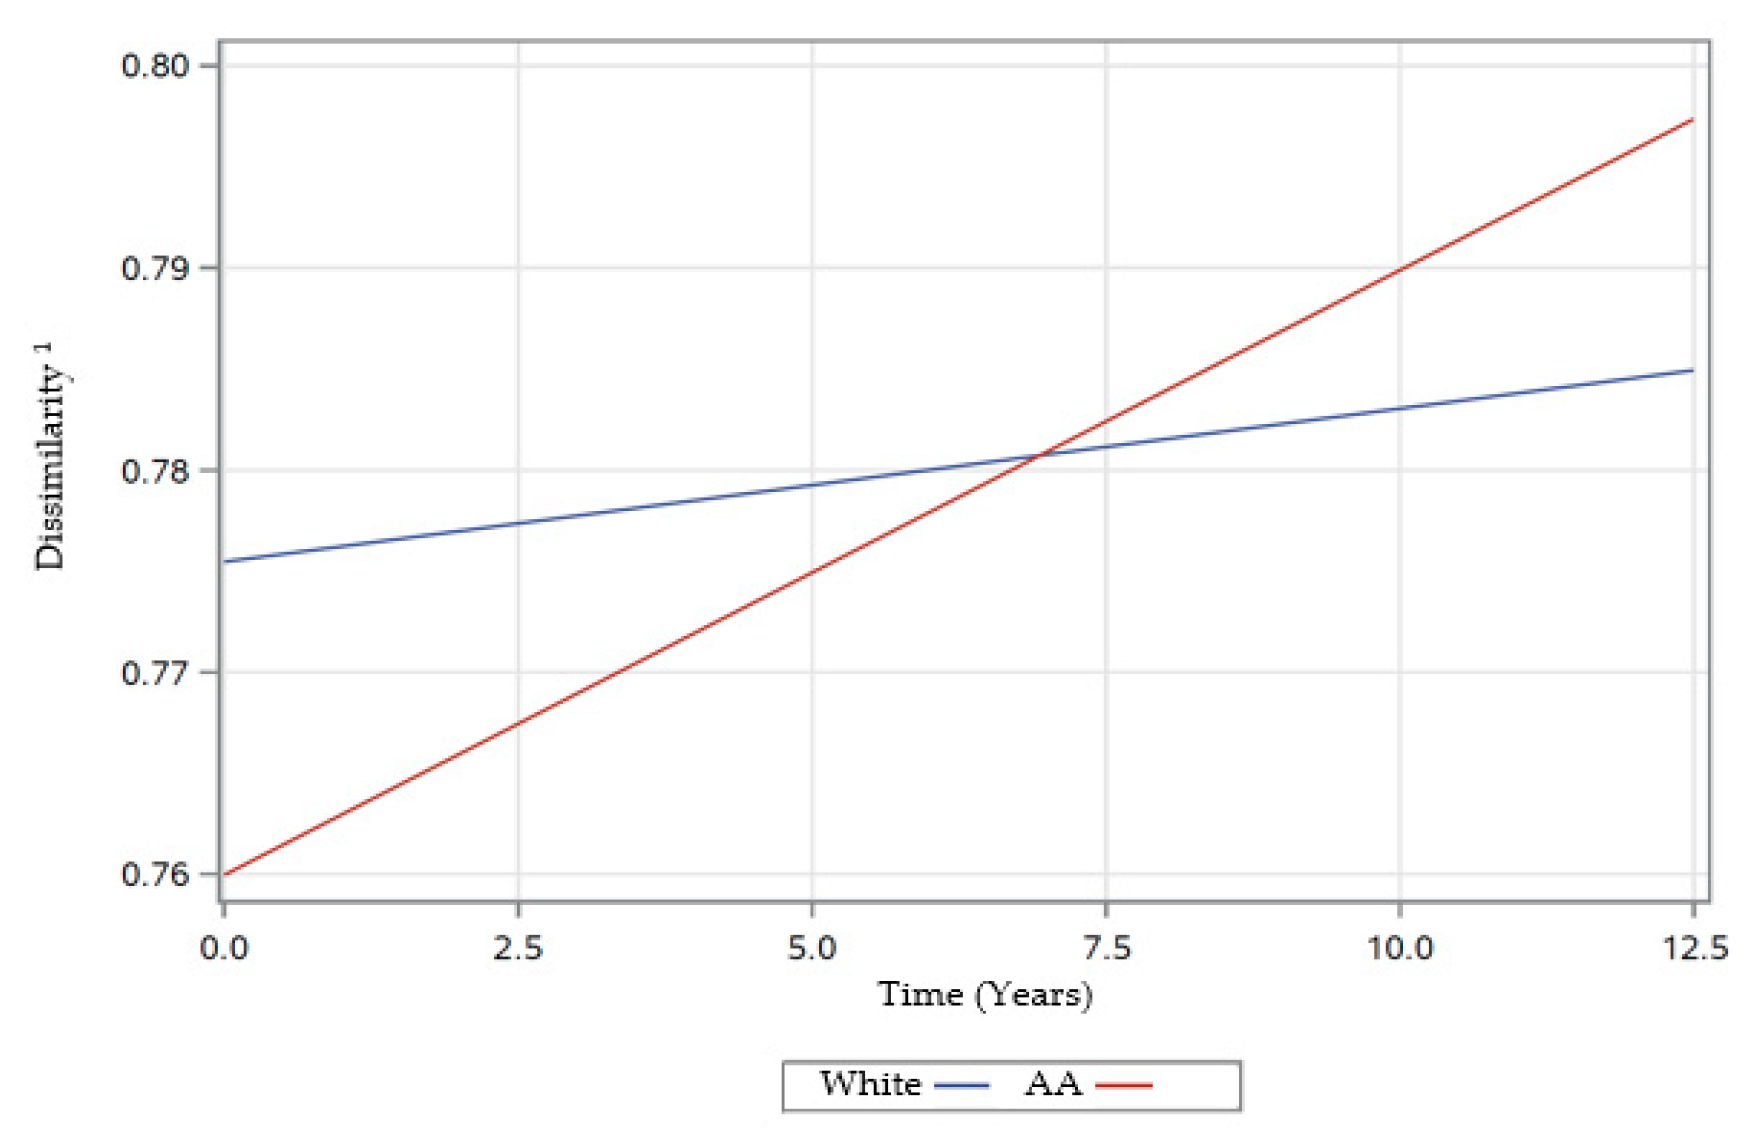
3.4.3. Linear Mixed-Effects Model Estimates for Dissimilarity
4. Discussion
5. Conclusions
Author Contributions
Funding
Conflicts of Interest
References
- Hatløy, A.; Torheim, L.; Oshaug, A. Food Variety—A Good Indicator of Nutritional Adequacy of the Diet? A Case Study from an Urban Area in Mali, West Africa. Eur. J. Clin. Nutr. 1998, 52, 891–898. [Google Scholar] [CrossRef] [PubMed]
- Mirmiran, P.; Azadbakht, L.; Esmaillzadeh, A.; Azizi, F. Dietary Diversity Score in Adolescents—A Good Indicator of the Nutritional Adequacy of Diets: Tehran Lipid and Glucose Study. Asia Pac. J. Clin. Nutr. 2004, 13, 56–60. [Google Scholar] [PubMed]
- Arimond, M.; Wiesmann, D.; Becquey, E.; Carriquiry, A.; Daniels, M.C.; Deitchler, M.; Fanou-Fogny, N.; Joseph, M.L.; Kennedy, G.; Martin-Prevel, Y.; et al. Simple Food Group Diversity Indicators Predict Micronutrient Adequacy of Women’s Diets in 5 Diverse, Resource-Poor Settings. J. Nutr. 2010, 140, 2059S–2069S. [Google Scholar] [CrossRef] [PubMed]
- Krebs-Smith, S.M.; Smiciklas-Wright, H.; Guthrie, H.A.; Krebs-Smith, J. The Effects of Variety in Food Choices on Dietary Quality. J. Am. Diet. Assoc. 1987, 87, 897–903. [Google Scholar] [PubMed]
- Drewnowski, A.; Henderson, S.A.; Driscoll, A.; Rolls, B.J. The Dietary Variety Score. J. Am. Diet. Assoc. 1997, 97, 266–271. [Google Scholar] [CrossRef]
- Ogle, B.M.; Hung, P.H.; Tuyet, H.T. Significance of Wild Vegetables in Micronutrient Intakes of Women in Vietnam: An Analysis of Food Variety. Asia Pac. J. Clin. Nutr. 2001, 10, 21–30. [Google Scholar] [CrossRef]
- Torheim, L.E.; Barikmo, I.; Parr, C.L.; Hatløy, A.; Ouattara, F.; Oshaug, A. Validation of Food Variety as an Indicator of Diet Quality Assessed with a Food Frequency Questionnaire for Western Mali. Eur. J. Clin. Nutr. 2003, 57, 1283–1291. [Google Scholar] [CrossRef]
- Kennedy, E. Dietary Diversity, Diet Quality, and Body Weight Regulation. Nutr. Rev. 2004, 62, S78–S81. [Google Scholar] [CrossRef]
- Vandevijvere, S.; De Vriese, S.; Huybrechts, I.; Moreau, M.; Van Oyen, H. Overall and Within-Food Group Diversity Are Associated with Dietary Quality in Belgium. Public Health Nutr. 2010, 13, 1965–1973. [Google Scholar] [CrossRef]
- Vakili, M.; Abedi, P.; Sharifi, M.; Hosseini, M. Dietary Diversity and Its Related Factors among Adolescents: A Survey in Ahvaz-Iran. Glob. J. Health Sci. 2013, 5, 181–186. [Google Scholar] [CrossRef]
- Montagnese, C.; Santarpia, L.; Buonifacio, M.; Nardelli, A.; Caldara, A.R.; Silvestri, E.; Contaldo, F.; Pasanisi, F. European Food-Based Dietary Guidelines: A Comparison and Update. Nutrition 2015, 31, 908–915. [Google Scholar] [CrossRef] [PubMed]
- Mozaffarian, D.; Ludwig, D.S. Dietary Guidelines in the 21st Century—A Time for Food. JAMA 2010, 304, 681–682. [Google Scholar] [CrossRef] [PubMed]
- U.S. Department of Health and Human Services and U.S. Department of Agriculture. 2015–2020 Dietary Guidelines for Americans, 8th ed. Available online: https://health.gov/dietaryguidelines/2015/guidelines/ (accessed on 12 January 2019).
- Lachat, C.; Raneri, J.E.; Smith, K.W.; Kolsteren, P.; Van Damme, P.; Verzelen, K.; Penafiel, D.; Vanhove, W.; Kennedy, G.; Hunter, D.; et al. Dietary Species Richness as a Measure of Food Biodiversity and Nutritional Quality of Diets. Proc. Natl. Acad. Sci. USA 2018, 115, 127–132. [Google Scholar] [CrossRef] [PubMed]
- Azadbakht, L.; Mirmiran, P.; Azizi, F. Dietary Diversity Score Is Favorably Associated with the Metabolic Syndrome in Tehranian Adults. Int. J. Obes. 2005, 29, 1361–1367. [Google Scholar] [CrossRef]
- Azadbakht, L.; Esmaillzadeh, A. Dietary Diversity Score Is Related to Obesity and Abdominal Adiposity among Iranian Female Youth. Public Health Nutr. 2011, 14, 62–69. [Google Scholar] [CrossRef] [PubMed]
- Farhangi, M.A.; Jahangiry, L. Dietary Diversity Score Is Associated with Cardiovascular Risk Factors and Serum Adiponectin Concentrations in Patients with Metabolic Syndrome. BMC Cardiovasc. Disord. 2018, 18, 68. [Google Scholar] [CrossRef]
- Azadbakht, L.; Mirmiran, P.; Esmaillzadeh, A.; Azizi, F. Dietary Diversity Score and Cardiovascular Risk Factors in Tehranian Adults. Public Health Nutr. 2006, 9, 728–736. [Google Scholar] [CrossRef]
- Ruel, M.T. Operationalizing Dietary Diversity: A Review of Measurement Issues and Research Priorities. J. Nutr. 2003, 133, 3911S–3926S. [Google Scholar] [CrossRef]
- De Oliveira Otto, M.C.; Padhye, N.S.; Bertoni, A.G.; Jacobs, D.R.; Mozaffarian, D. Everything in Moderation—Dietary Diversity and Quality, Central Obesity and Risk of Diabetes. PLoS ONE 2015, 10, e0141341. [Google Scholar] [CrossRef]
- Katanoda, K.; Kim, H.-S.; Matsumura, Y. New Quantitative Index for Dietary Diversity (QUANTIDD) and Its Annual Changes in the Japanese. Nutrition 2006, 22, 283–287. [Google Scholar] [CrossRef]
- Vadiveloo, M.; Dixon, L.B.; Mijanovich, T.; Elbel, B.; Parekh, N. Development and Evaluation of the US Healthy Food Diversity Index. Br. J. Nutr. 2014, 112, 1562–1574. [Google Scholar] [CrossRef] [PubMed]
- Drescher, L.S.; Thiele, S.; Mensink, G.B.M. A New Index to Measure Healthy Food Diversity Better Reflects a Healthy Diet Than Traditional Measures. J. Nutr. 2007, 137, 647–651. [Google Scholar] [CrossRef] [PubMed]
- Otsuka, R.; Nishita, Y.; Tange, C.; Tomida, M.; Kato, Y.; Imai, T.; Ando, F.; Shimokata, H. Age-Related 12-Year Changes in Dietary Diversity and Food Intakes Among Community-Dwelling Japanese Aged 40 to 79 Years. J. Nutr. Health Aging 2018, 22, 594–600. [Google Scholar] [CrossRef] [PubMed]
- Fanelli Kuczmarski, M.; Stave Shupe, E.; Pohlig, R.T.; Rawal, R.; Zonderman, A.B.; Evans, M.K. A Longitudinal Assessment of Diet Quality and Risks Associated with Malnutrition in Socioeconomic and Racially Diverse Adults. Nutrients 2019, 11, 2046. [Google Scholar] [CrossRef] [PubMed]
- U.S. Department of Health and Human Services. The Secretary’s Advisory Committee on National Health Promotion and Disease Prevention Objectives for 2020. Phase I Report: Recommendations for the Framework and Format of Healthy People. 2020. Available online: https://www.healthypeople.gov/sites/default/files/PhaseI_0.pdf (accessed on 8 August 2020).
- Fanelli Kuczmarski, M.; Brewer, B.C.; Rawal, R.; Pohlig, R.T.; Zonderman, A.B.; Evans, M.K. Aspects of Dietary Diversity Differ in Their Association with Atherosclerotic Cardiovascular Risk in a Racially Diverse US Adult Population. Nutrients 2019, 11, 1034. [Google Scholar] [CrossRef]
- The 2004 HHS Poverty Guidelines. Available online: https://aspe.hhs.gov/2004-hhs-poverty-guidelines (accessed on 27 February 2019).
- Evans, M.K.; Lepkowski, J.M.; Powe, N.R.; LaVeist, T.; Kuczmarski, M.F.; Zonderman, A.B. Healthy Aging in Neighborhoods of Diversity across the Life Span (HANDLS): Overcoming Barriers to Implementing a Longitudinal, Epidemiologic, Urban Study of Health, Race, and Socioeconomic Status. Ethn. Dis. 2010, 20, 267–275. [Google Scholar]
- HANDLS Research Protocol Version 3. Healthy Aging in Neighborhoods of Diversity across the Life Span. Available online: https://handls.nih.gov/pdf/HANDLS-2Protocol-2004-10-08-Protocol.pdf (accessed on 12 January 2019).
- Healthy Aging in Neighborhoods of Diversity across the Life Span. Available online: https://handls.nih.gov/06Coll-dataDoc.htm (accessed on 1 April 2019).
- ClinicalTrials.gov: Healthy Aging in Neighborhoods of Diversity across the Life Span. Available online: https://clinicaltrials.gov/ct2/show/NCT01323322?term=evans&cond=health+disparities&draw=2&rank=1 (accessed on 8 August 2020).
- Moshfegh, A.J.; Rhodes, D.G.; Baer, D.J.; Murayi, T.; Clemens, J.C.; Rumpler, W.V.; Paul, D.R.; Sebastian, R.S.; Kuczynski, K.J.; Ingwersen, L.A.; et al. The US Department of Agriculture Automated Multiple-Pass Method Reduces Bias in the Collection of Energy Intakes. Am. J. Clin. Nutr. 2008, 88, 324–332. [Google Scholar] [CrossRef]
- Raper, N.; Perloff, B.; Ingwersen, L.; Steinfeldt, L.; Anand, J. An Overview of USDA’s Dietary Intake Data System. J. Food Compos. Anal. 2004, 17, 545–555. [Google Scholar] [CrossRef]
- USDA Food and Nutrient Database for Dietary Studies, Beltsville, MD, USA: Agricultural Research Service, Food Surveys Research Group. Available online: https://www.ars.usda.gov/northeast-area/beltsville-md-bhnrc/beltsville-human-nutrition-research-center/food-surveys-research-group/docs/fndds-download-databases/ (accessed on 12 January 2019).
- Food Surveys Research Group: Beltsville, MD, USA: United States Department of Agriculture. Available online: https://www.ars.usda.gov/northeast-area/beltsville-md-bhnrc/beltsville-human-nutrition-research-center/food-surveys-research-group/ (accessed on 1 April 2019).
- Bowman, S.A.; Clemens, J.C.; Friday, J.E.; Thoerig, R.C.; Moshfegh, A. Food Patterns Equivalents Database 2005-2006: Methodology and User Guide. Available online: https://www.ars.usda.gov/ARSUserFiles/80400530/pdf/fped/FPED_0506.pdf (accessed on 1 October 2019).
- Bowman, S.A.; Clemens, J.C.; Thoerig, R.C.; Friday, J.E.; Shimizu, M.; Moshfegh, A. Food Patterns Equivalents Database 2009–10: Methodology and User Guide. Available online: https://www.ars.usda.gov/ARSUserFiles/80400530/pdf/fped/FPED_0910.pdf (accessed on 1 October 2019).
- Bowman, S.A.; Clemens, J.C.; Friday, J.E.; Lynch, K.L.; Moshfegh, A. Food Patterns Equivalents Database 2013–14: Methodology and User Guide. U.S. Department of Agriculture, Food Surveys Research Group: Beltsville, MD, USA. Available online: https://www.ars.usda.gov/ARSUserFiles/80400530/pdf/fped/FPED_1314.pdf (accessed on 14 February 2020).
- Berry, C. Corporate Growth and Diversification. J. Law Econ. 1971, 14, 371–383. [Google Scholar] [CrossRef]
- Zhu, R.; Zhang, Y.; Liu, B.; Liu, C. (Eds.) Information Computing and Applications; Communications in Computer and Information Science; Springer: Berlin/Heidelberg, Germany, 2010; Volume 105. [Google Scholar] [CrossRef]
- Schweizer, K. A Threshold-Free Approach to the Study of the Structure of Binary Data. Int. J. Stat. Probab. 2013, 2, 67–76. [Google Scholar] [CrossRef]
- Nakagawa, S.; Schielzeth, H. A General and Simple Method for Obtaining R 2 from Generalized Linear Mixed-Effects Models. Methods Ecol. Evol. 2013, 4, 133–142. [Google Scholar] [CrossRef]
- Kant, A.K.; Block, G.; Schatzkin, A.; Ziegler, R.G.; Nestle, M. Dietary Diversity in the US Population, NHANES II, 1976–1980. J. Am. Diet. Assoc. 1991, 91, 1526–1531. [Google Scholar] [PubMed]
- Kant, A.K.; Schatzkin, A.; Harris, T.B.; Ziegler, R.G.; Block, G. Dietary Diversity and Subsequent Mortality in the First National Health and Nutrition Examination Survey Epidemiologic Follow-up Study. Am. J. Clin. Nutr. 1993, 57, 434–440. [Google Scholar] [CrossRef] [PubMed]
- Zhang, Q.; Chen, X.; Liu, Z.; Varma, D.S.; Wan, R.; Zhao, S. Diet Diversity and Nutritional Status among Adults in Southwest China. PLoS ONE 2017, 12, e0172406. [Google Scholar] [CrossRef] [PubMed]
- Fanelli Kuczmarski, M.; Mason, M.A.; Beydoun, M.A.; Allegro, D.; Zonderman, A.B.; Evans, M.K. Dietary Patterns and Sarcopenia in an Urban African American and White Population in the United States. J. Nutr. Gerontol. Geriatr. 2013, 32, 291–316. [Google Scholar] [CrossRef] [PubMed]
- Rhodes, D.G.; Murayi, T.; Clemens, J.C.; Baer, D.J.; Sebastian, R.S.; Moshfegh, A.J. The USDA Automated Multiple-Pass Method Accurately Assesses Population Sodium Intakes. Am. J. Clin. Nutr. 2013, 97, 958–964. [Google Scholar] [CrossRef]
- Naska, A.; Lagiou, A.; Lagiou, P. Dietary Assessment Methods in Epidemiological Research: Current State of the Art and Future Prospects. F1000Research 2017, 6, 926. [Google Scholar] [CrossRef]


| Characteristics | Study Visits | ||
|---|---|---|---|
| Mean ± SE or % | Visit 1 N = 2177 | Visit 2 N = 2140 | Visit 3 N = 2066 |
| Demographics | |||
| Age, years | 48.33 ± 0.20 | 53.20 ± 0.19 | 56.63 ± 0.20 |
| Female, % | 56.5 | 58.8 | 59.0 |
| African–American, % | 57.9 | 61.4 | 60.9 |
| Poverty Status, <125% | 42.9 | 39.8 | 40.8 |
| Education, % < High School | 25.3 | 22.9 (n = 2133) | 23.4 (n = 2052) |
| Cigarette Smoker, % | 48.3 (n = 2004) | 41.8 (n = 1903) | 46.5 (n = 1808) |
| Health Conditions | |||
| BMI, kg/m2 | 29.81 ± 0.17 (n= 2174) | 30.71 ± 0.17 (n = 2136) | 30.94 ± 0.18 (n = 2048) |
| Characteristics | Study Visits | |||||
|---|---|---|---|---|---|---|
| Visit 1 (N = 2177) | Visit 2 (N = 2140) | Visit 3 (N = 2066) | ||||
| Diet-Related Measures | Median | (Mean ± SE) | Median | (Mean ± SE) | Median | (Mean ± SE) |
| Count Score 1 | 0.429 | 0.430 ± 0.002 | 0.452 | 0.449 ± 0.002 | 0.452 | 0.445 ± 0.002 |
| Evenness Score (HFBI) 2 | 0.120 | 0.129 ± 0.001 | 0.121 | 0.131 ± 0.001 | 0.120 | 0.128 ± 0.001 |
| Dissimilarity Score 3 | 0.788 | 0.785 ± 0.002 | 0.758 | 0.751 ± 0.002 | 0.809 | 0.802 ± 0.002 |
| Energy, kcal | 1829 | 2006 ± 21 | 1905 | 2025 ± 18 | 1841 | 1999 ± 11 |
| Count | Evenness (HFBI) | Dissimilarity | |
|---|---|---|---|
| Dietary Diversity Measures, visit 1 (N = 2177) | |||
| Count 1 | − | ||
| Evenness (HFBI) 2 | 0.169 ** | − | |
| Dissimilarity 3 | 0.200 ** | −0.020 | − |
| Dietary Diversity Measures, visit 2 (N = 2140) | |||
| Count 1 | − | ||
| Evenness (HFBI) 2 | 0.166 ** | − | |
| Dissimilarity 3 | 0.219 ** | −0.079 ** | − |
| Dietary Diversity Measures, visit 3 (N = 2066) | |||
| Count 1 | − | ||
| Evenness (HFBI) 2 | 0.167 ** | − | |
| Dissimilarity 3 | 0.209 ** | −0.043 * | − |
| Variables | Count 1 | Evenness (HFBI) 2 | Dissimilarity 3 | ||||||
|---|---|---|---|---|---|---|---|---|---|
| Estimate | SE | p | Estimate | SE | p | Estimate | SE | p | |
| Intercept | 0.3963 | 0.0047 | <0.0001 *** | 0.1386 | 0.0029 | <0.0001 *** | 0.7605 | 0.0048 | <0.0001 *** |
| Time (Years) | 0.0010 | 0.0007 | 0.1639 | 0.0002 | 0.0005 | 0.6345 | 0.0032 | 0.0008 | <0.0001 *** |
| BLAge 4 | 0.0052 | 0.0021 | 0.0131 * | 0.0055 | 0.0012 | <0.0001 *** | −0.0072 | 0.0020 | 0.0004 *** |
| Time*BLAge | 0.0005 | 0.0003 | 0.1688 | −0.0003 | 0.0002 | 0.1675 | 0.0004 | 0.0003 | 0.2895 |
| Sex (Female) | 0.0272 | 0.0041 | <0.0001 *** | −0.0009 | 0.0024 | 0.7174 | 0.0081 | 0.0039 | 0.0402 * |
| Time*Sex (Female) | 0.0005 | 0.0007 | 0.4295 | −0.0010 | 0.0004 | 0.0094 ** | −0.0006 | 0.0007 | 0.3932 |
| Race (White) | 0.0082 | 0.0039 | 0.0377 * | −0.0013 | 0.0023 | 0.5732 | 0.0155 | 0.0038 | <0.0001 *** |
| Time*Race (White) | −0.0010 | 0.0006 | 0.2532 | 0.0002 | 0.0004 | 0.6110 | −0.0022 | 0.0006 | 0.0005 *** |
| Poverty Status (> 125% Poverty)5 | 0.0163 | 0.0041 | <0.0001 *** | 0.0011 | 0.0024 | 0.6564 | 0.0067 | 0.0039 | 0.0914 |
| Time*Poverty Status (> 125% Poverty) | 0.0000 | 0.0006 | 0.9493 | −0.0004 | 0.0004 | 0.3568 | −0.0014 | 0.0006 | 0.0325 * |
| Education (< High school) | −0.0307 | 0.0041 | <0.0001 *** | −0.0041 | 0.0025 | 0.0958 | 0.0075 | 0.0041 | 0.0684 |
| Time*Education (< High school) | 0.0009 | 0.0007 | 0.2193 | 0.0004 | 0.0004 | 0.3867 | 0.0001 | 0.0007 | 0.8757 |
| Smoking (Not A Current Smoker) | 0.0326 | 0.0038 | <0.0001 *** | −0.0150 | 0.0023 | <0.0001 *** | −0.0044 | 0.0038 | 0.2463 |
| Time*Smoking (Not A Current Smoker) | −0.0001 | 0.0006 | 0.8721 | 0.0005 | 0.0004 | 0.2054 | −0.0003 | 0.0006 | 0.6402 |
| CenEng 6 | 0.0421 | 0.0021 | <0.0001 *** | −0.0058 | 0.0012 | <0.0001 *** | 0.0114 | 0.0021 | <0.0001 *** |
| Time*CenEng | 0.0005 | 0.0004 | 0.2027 | −0.0010 | 0.0002 | <0.0001 *** | 0.0016 | 0.0004 | <0.0001 *** |
© 2020 by the authors. Licensee MDPI, Basel, Switzerland. This article is an open access article distributed under the terms and conditions of the Creative Commons Attribution (CC BY) license (http://creativecommons.org/licenses/by/4.0/).
Share and Cite
Rawal, R.; Kuczmarski, M.F.; Cotugna, N.; Brewer, B.C.; Beydoun, M.A.; Hughes, V.C.; Zonderman, A.B.; Evans, M.K. Aspects of Dietary Diversity Changes across Adulthood in Racially Diverse Adults. Nutrients 2020, 12, 2455. https://doi.org/10.3390/nu12082455
Rawal R, Kuczmarski MF, Cotugna N, Brewer BC, Beydoun MA, Hughes VC, Zonderman AB, Evans MK. Aspects of Dietary Diversity Changes across Adulthood in Racially Diverse Adults. Nutrients. 2020; 12(8):2455. https://doi.org/10.3390/nu12082455
Chicago/Turabian StyleRawal, Rita, Marie Fanelli Kuczmarski, Nancy Cotugna, Benjamin C. Brewer, May A. Beydoun, Virginia C. Hughes, Alan B. Zonderman, and Michele K. Evans. 2020. "Aspects of Dietary Diversity Changes across Adulthood in Racially Diverse Adults" Nutrients 12, no. 8: 2455. https://doi.org/10.3390/nu12082455
APA StyleRawal, R., Kuczmarski, M. F., Cotugna, N., Brewer, B. C., Beydoun, M. A., Hughes, V. C., Zonderman, A. B., & Evans, M. K. (2020). Aspects of Dietary Diversity Changes across Adulthood in Racially Diverse Adults. Nutrients, 12(8), 2455. https://doi.org/10.3390/nu12082455