Validation of a Food Propensity Questionnaire for the Hellenic National Nutrition and Health Survey (HNNHS) and Results on This Population’s Adherence to Key Food-Group Nutritional Guidelines


Abstract
:1. Introduction
2. Methods
2.1. Study Population
2.2. Dietary Assessment
2.3. Anthropometry
2.4. Statistical Analysis
3. Results
4. Discussion
5. Conclusions
Supplementary Materials
Author Contributions
Funding
Acknowledgments
Conflicts of Interest
Data Availability Statement
References
- World Health Organization (WHO). Available online: https://www.who.int/news-room/fact-sheets/detail/malnutrition (accessed on 15 April 2020).
- World Health Organization. International Classification of Diseases-Version 10. 2016. Available online: http://apps.who.int/classifications/icd10/browse/2016/en (accessed on 15 April 2020).
- Thompson, F.E.; Byers, T. Dietary Assessment Resource Manual. J. Nutr. 1994, 124, 2245S–2317S. [Google Scholar]
- Naska, A.; Lagiou, A.; Lagiou, P. Dietary assessment methods in epidemiological research: Current state of the art and future prospects. F1000 Res. 2017, 6, 926. [Google Scholar] [CrossRef] [PubMed] [Green Version]
- Willett, W.C. Nutritional Epidemiology, 3rd ed.; Oxford University Press: Oxford, UK, 2013. [Google Scholar]
- Subar, A.F.; Dodd, K.W.; Guenther, P.M.; Kipnis, V.; Midthune, D.; McDowell, M.; Tooze, J.A.; Freedman, L.S.; Krebs-Smith, S.M. The Food Propensity Questionnaire: Concept, Development, and Validation for Use as a Covariate in a Model to Estimate Usual Food Intake. J. Am. Diet. Assoc. 2006, 106, 1556–1563. [Google Scholar] [CrossRef] [PubMed]
- Nutrition Coordinating Center, University of Minnesota. NDSR Software. Available online: http://www.ncc.umn.edu/?s=cite (accessed on 15 April 2020).
- Elmadfa, I.; Meyer, A.L. Developing Suitable Methods of Nutritional Status Assessment: A Continuous Challenge. Adv. Nutr. 2014, 5, 590S–598S. [Google Scholar] [CrossRef] [PubMed] [Green Version]
- Millen, A.E.; Midthune, D.; Thompson, F.E.; Kipnis, V.; Subar, A.F. The National Cancer Institute Diet History Questionnaire: Validation of Pyramid Food Servings. Am. J. Epidemiol. 2006, 163, 279–288. [Google Scholar] [CrossRef] [PubMed]
- Bland, J.M.; Altman, D.G. Measurement Method Comparison; The American Society of Anesthesiologists, Inc.; Lippincott Williams & Wilkins: Philadelphia, PA, USA, 2012; Volume 116, pp. 182–185. [Google Scholar]
- Cade, J.; Thompson, R.; Burley, V.; Warm, D. Development, validation and utilization of food-frequency questionnaires—A review. Public Health Nutr. 2002, 5, 567–587. [Google Scholar] [CrossRef] [PubMed] [Green Version]
- Kowalkowska, J.; Slowinska, M.A.; Slowinski, D.; Dlugosz, A.; Niedzwiedzka, E.; Wadolowska, L. Comparison of a Full Food-Frequency Questionnaire with the three-Day Unweighted Food Records in Young Polish Adult Women: Implications for Dietary Assessment. Nutrients 2013, 5, 2747–2776. [Google Scholar] [CrossRef] [Green Version]
- Black, A.E. Critical evaluation of energy intake using the Goldberg cut-off for energy intake:basal metabolic rate. A practical guide to its calculation, use and limitations. Int. J. Obes. Relat. Metab. Disord. 2000, 24, 1119–1130. [Google Scholar] [CrossRef] [Green Version]
- Black, A.E. The sensitivity and specificity of the Goldberg cut-off for EI: BMR for identifying diet reports of poor validity. Eur. J. Clin. Nutr. 2000, 54, 395–404. [Google Scholar] [CrossRef] [Green Version]
- European Food Safety Authority (EFSA). General principles for the collection of national food consumption data in the view of a pan-European dietary survey. EFSA J. 2009, 7, 1435. [Google Scholar] [CrossRef]
- Fallaize, R.; Forster, H.; Macready, A.L.; Walsh, M.C.; Mathers, J.C.; Brennan, L.; Gibney, E.R.; Gibney, M.J.; Lovegrove, J.A. Online Dietary Intake Estimation: Reproducibility and Validity of the Food4Me Food Frequency Questionnaire Against a 4-Day Weighed Food Record. J. Med. Internet Res. 2014, 16, e190. [Google Scholar] [CrossRef] [PubMed]
- Steinfeldt, L.; Anand, J.; Murayi, T. Food reporting patterns in the USDA—Automated Multiple-Pass Method. Procedia Food Sci. 2013, 2, 145–156. [Google Scholar] [CrossRef] [Green Version]
- National Health and Nutrition Examination Survey. 2005–2006 Data Documentation. Available online: https:// wwwn.cdc.gov/Nchs/Nhanes/2005–2006/VARLK_D.html (accessed on 10 January 2020).
- European Food Safety Authority (EFSA). Data. Available online: http://www.efsa.europa.eu/en/topics/topic/data (accessed on 10 January 2020).
- Ambrus, Á.; Horváth, Z.; Farkas, Z.; Dorogházi, E.; Cseh, J.; Petrova, S.; Dimitrov, P.; Duleva, V.; Rangelova, L.; Chikova-Iscener, E. Pilot study in the view of a Pan-European dietary survey—Adolescents, adults and elderly. EFSA Support. Publ. 2013, 10, 508E. [Google Scholar] [CrossRef] [Green Version]
- NKUA. The Pan-European Food Data Bank Based on Household Budget Survey. 2004. Available online: http://www.nut.uoa.gr/Dafnesoftweb/ (accessed on 10 January 2020).
- FAO. FAOSTAT, Food Balance Sheets. 2009. Available online: http://faostat3.fao.org/faostat-gateway/go/ to/download/FB/*/E (accessed on 18 February 2020).
- European Food Safety Authority (EFSA). The food classification and description system FoodEx2 (revision 2). EFSA Support. Publ. 2015, 12, 804E. [Google Scholar]
- Karageorgou, D.; Magriplis, E.; Mitsopoulou, A.V.; Dimakopoulos, I.; Bakogianni, I.; Micha, R.; Michas, G.; Chourdakis, M.; Ntouroupi, T.; Tsaniklidou, S.M. Dietary patterns and lifestyle characteristics in adults: Results from the Hellenic National Nutrition and Health Survey (HNNHS). Public Health 2019, 171, 76–88. [Google Scholar] [CrossRef] [PubMed]
- Linou, A. National Dietary Guidelines for Adults; Institute of Preventive Medicine, Environmental and Occupational Health, Prolepsis: Athens, Greece, 2014; pp. 20–71. ISBN 978-960-503-559-4. [Google Scholar]
- European Food Safety Authority (EFSA). EU Menu Declaration. Available online: http://www.efsa.europa.eu/en/datexfoodcdb/datexeumenu.htm (accessed on 20 April 2020).
- Bland, J.M.; Altman, D.G. Statistical methods for assessing agreement between two methods of clinical measurement. Lancet 1986, 1, 307–310. [Google Scholar] [CrossRef]
- Davide, G. Understanding Bland Altman analysis. Biochem. Med. 2015, 25, 141–151. [Google Scholar]
- Varagiannis, P.; Magriplis, E.; Risvas, G.; Zampelas, A. Validation of a Self-reported Food Frequency for Overweight and Obese Children, Using Parental 3-Day Food Records: The 4yourfamily Study. Nutr. Today 2019, 54, 151–158. [Google Scholar] [CrossRef]
- Block, G.; Wakimoto, P.; Jensen, C.; Mandel, S.; Green, R.R. Validation of a Food Frequency Questionnaire for Hispanics. Prev. Chronic Dis. 2006, 3, A77. [Google Scholar]
- Johansson, I.; Hallmans, G.; Wikman, A.; Biessy, C. Validation and calibration of food-frequency questionnaire measurements in the Northern Sweden Health and Disease cohort. Public Health Nutr. 2002, 5, 487–496. [Google Scholar] [CrossRef]
- Tyrovolas, S.; Pounis, G.; Bountziouka, V.; Polychronopoulos, E.; Panagiotakos, D.B. Repeatability and validation of a short, semi-quantitative food frequency questionnaire for the elderly: The MEDIS-FFQ. J. Nutr. Elder. 2010, 29, 311–324. [Google Scholar] [CrossRef] [PubMed]
- Zhang, C.-X.; Ho, S.C. Validity and reproducibility of a food frequency Questionnaire among Chinese women in Guangdong province. Asia Pac. J. Clin. Nutr. 2009, 18, 240–250. [Google Scholar]
- Cheng, Y.; Yan, H.; Dibley, M.J.; Shen, Y.; Li, Q.; Zeng, L. Validity and reproducibility of a semi-quantitative food frequency questionnaire for use among pregnant women in rural China. Asia Pac. J. Clin. Nutr. 2008, 17, 166–177. [Google Scholar] [PubMed]
- Ambrosini, G.; De Klerk, N.; Musk, A.; Mackerras, D.; Ambrosini, G.; De Klerk, N. Agreement between a brief food frequency questionnaire and diet records using two statistical methods. Public Health Nutr. 2001, 4, 255–264. [Google Scholar] [CrossRef] [Green Version]
- Rodriguez, C.A.; Smith, E.R.; Villamor, E.; Zavaleta, N.; Respicio-Torres, G.; Contreras, C.; Perea, S.; Jimenez, J.; Tintaya, K.; Lecca, L.; et al. Development and Validation of a Food Frequency Questionnaire to Estimate Intake among Children and Adolescents in Urban Peru. Nutrients 2017, 9, 1121. [Google Scholar] [CrossRef] [PubMed]
- Willett, W.C.; Sampson, L.; Stampfer, M.J.; Rosner, A.B.; Bain, C.; Witschi, J.; Hennekens, C.H.; Speizer, F.E. Reproducibility and validity of a semiquantitative food frequency questionnaire. Am. J. Epidemiol. 1985, 122, 51–65. [Google Scholar] [CrossRef]
- Yang, Y.J.; Kim, M.K.; Hwang, S.H.; Ahn, Y.; Shim, J.E.; Kim, D.H. Relative validities of 3-day food records and the food frequency questionnaire. Nutr. Res. Pr. 2010, 4, 142–148. [Google Scholar] [CrossRef] [Green Version]
- Naska, A. Dietary habits in Greece: The European Prospective Investigation into Cancer and nutrition (the EPIC project). Arch. Hellen Med. 2005, 22, 259–269. [Google Scholar]
- Arvaniti, F.; Panagiotakos, D.B.; Pitsavos, C.; Zampelas, A.; Stefanadis, C. Dietary habits in a Greek sample of men and women: The ATTICA study. Cent. Eur. J. Public Health 2006, 14, 74–77. [Google Scholar] [CrossRef]
- Slimani, N.; Fahey, M.; Welch, A.; Wirfält, E.; Stripp, C.; Bergström, E.; Linseisen, J.; Schulze, M.B.; Bamia, C.; Chloptsios, Y.; et al. Diversity of dietary patterns observed in the European Prospective Investigation into Cancer and Nutrition (EPIC) project. Public Health Nutr. 2002, 5, 1311–1328. [Google Scholar] [CrossRef]
- Kromhout, D.; Keys, A.; Aravanis, C.; Buzina, R.; Fidanza, F.; Giampaoli, S.; Jansen, A.; Menotti, A.; Nedeljkovic, S.; Pekkarinen, M. Food consumption patterns in the 1960s in seven countries. Am. J. Clin. Nutr. 1989, 49, 889–894. [Google Scholar] [CrossRef] [PubMed]

| Food or Beverages | Frequency of Consumption Measured |
|---|---|
| Fruits (orange, apple, pear, etc., juices) | Never, <1 per month, 1–3 per month, 1 per week, 2–4 per week, 5–6 per week, 1 per day, 2–3 per day, 4–5 per day, 6 + per day |
| Vegetables (tomatoes, cucumber, lettuce, cabbage, etc.) | |
| Dairy (milk, yoghurt, cheese, milk substitutes, cream) | |
| Meat (red meat, including poultry, game, snails, and processed meat products) | |
| Fish (tuna, sardine, octopus, calamaries etc.) | |
| Starch foods (cereals, bread, pasta, rice) | |
| Legumes (beans, fava, lentils, etc.) | |
| Fats and Oils (butter, margarine, olive oil, canola oil, etc.) | |
| Nuts (walnuts, almonds, peanuts, etc.) | |
| Alcoholic beverages, wines and spirits (beers, red or white wines, whiskies, vodkas, etc.) | |
| Sweet (sweet beverages, sweet desserts, sweeteners, sugars, baked sweet products, sweet puff pastry, compote) | |
| Eggs | |
| Fast food (salty snacks, dressings, sauces, fast food, salty or sweet pies, salty puff pastry) | |
| Beverages (water, regular, sugar free, carbonated or non-carbonated) |
| Variable | Sample (n = 3796) 1 | Men (n = 1543, 42.82%) | Women (n = 2253, 57.18%) | p-Value 3 |
|---|---|---|---|---|
| Age 2 (years) | 39 (27, 57) | 37 (27, 56) | 40 (26, 58) | 0.289 |
| Weight (kg) | 72 (61, 82.5) | 82.48 ± 13.76 | 64 (57, 73) | <0.001 |
| Height (m) | 1.69 ± 0.11 | 1.77 (1.72, 1.82) | 1.64 (1.60, 1.68) | <0.001 |
| BMI 4 | 25.41 ± 4.78 | 26.29 ± 4.04 | 24.80 ± 5.16 | 0.819 |
| 24 hR | FPQ 3 | Spearman Correlation Coefficients | Wilcoxon Non-Parametric Pairwise Comparison Test | |
|---|---|---|---|---|
| Fruit | 105 (0, 216.67) 1,2 | 205.12 (125.76, 413.44) 1 | 0.373 ** | <0.001 4 |
| Vegetables | 151.58 (71.90, 258.90) | 580.48 (379.58, 861.18) | 0.136 ** | <0.001 |
| Dairy | 100.64 (32.28, 213.24) | 254.09 (125.81, 386.57) | 0.371 ** | <0.001 |
| Meat | 53.82 (10.50, 111.83) | 137.43 (80.60, 207.77) | 0.268 ** | <0.001 |
| Fish | 0 (0, 0) | 37.80 (22.65, 61.80) | 0.166 ** | <0.001 |
| Eggs | 0 (0, 9.84) | 7.15 (3.35, 21.45) | 0.142 ** | <0.001 |
| Starch foods | 121.89 (67.92, 205.62) | 129.78 (94.54, 175.44) | 0.111 ** | 0.974 |
| Legumes | 0 (0, 0) | 64.75 (39.73, 100.10) | 0.070 ** | <0.001 |
| Sweet | 42 (7.50, 132.50) | 75.14 (39.84, 128.88) | 0.261 ** | <0.001 |
| Beverages | 1444.74 (987.30, 1928.75) | 1825.75 (1463.50, 2249.00) | 0.251 ** | <0.001 |
| Nuts | 0 (0, 0) | 3.58 (0.43, 10.73) | 0.290 ** | <0.001 |
| Fats & Oils | 16.59 (6.82, 30.61) | 37.80 (19.72, 52.38) | 0.144 ** | <0.001 |
| Drinks & Spirits | 0 (0, 95.19) | 42.83 (11.31, 125.00) | 0.461 ** | <0.001 |
| Fast Food | 14.69 (0, 127.68) | 63.32 (34.91, 117.55) | 0.259 ** | <0.001 |
| Total Sample (n = 3796) 1 | Men (n = 1543) | Women (n = 2253) | Normal Weight (n = 1653) | Overweight (n = 1329) | Obese (n = 624) | |
|---|---|---|---|---|---|---|
| Fruit | 0.373 ** 3 | 0.395 ** | 0.357 ** | 0.389 ** | 0.384 ** | 0.367 ** |
| Vegetables | 0.136 ** | 0.145 ** | 0.149 ** | 0.090 ** | 0.161 ** | 0.193 ** |
| Dairy | 0.371 ** | 0.356 ** | 0.379 ** | 0.368 ** | 0.378 ** | 0.363 ** |
| Meat | 0.268 ** | 0.290 ** | 0.231 ** | 0.279 ** | 0.261 ** | 0.247 ** |
| Fish | 0.166 ** | 0.194 ** | 0.142 ** | 0.206 ** | 0.171 ** | - |
| Eggs | 0.142 ** | 0.143 ** | 0.141 ** | 0.138 ** | 0.125 ** | 0.158 ** |
| Starch foods | 0.111 ** | 0.097 ** | 0.114 ** | 0.162 ** | 0.100 ** | - |
| Legumes | 0.070 ** | 0.121 ** | 0.045 ** | 0.090 ** | 0.088 ** | - |
| Sweet | 0.261 ** | 0.234 ** | 0.279 ** | 0.237 ** | 0.233 ** | 0.299 ** |
| Beverages | 0.251 ** | 0.184 ** | 0.286 ** | 0.294 ** | 0.167 ** | 0.268 ** |
| Nuts | 0.290 ** | 0.267 ** | 0.307 ** | 0.311 ** | 0.290 ** | 0.239 ** |
| Fats & Oils | 0.144 ** | 0.141 ** | 0.161 ** | 0.131 ** | 0.181 ** | - |
| Drinks & Spirits | 0.461 ** | 0.454 ** | 0.413 ** | 0.424 ** | 0.500 ** | 0.473 ** |
| Fast Food | 0.259 ** | 0.275 ** | 0.220 ** | 0.259 ** | 0.259 ** | 0.285 ** |
| FPQ 1 | 24 hR | % Within the Agreement Interval 2 | |
|---|---|---|---|
| Fruit | 205.12 (125.76, 413.44) | 105 (0, 216.67) | 95.60 |
| Vegetables | 580.48 (379.58, 861.18) | 151.58 (71.90, 258.90) | 96.40 |
| Dairy | 254.09 (125.81, 386.57) | 100.64 (32.28, 213.24) | 95.79 |
| Meat | 137.43 (80.60, 207.77) | 53.82 (10.50, 111.83) | 96.60 |
| Fish | 37.80 (22.65, 61.80) | 0 (0, 0) | 96.65 |
| Eggs | 7.15 (3.35, 21.45) | 0 (0, 9.84) | 96.12 |
| Starch foods | 129.78 (94.54, 175.44) | 121.89 (67.92, 205.62) | 95.69 |
| Legumes | 64.75 (39.73, 100.10) | 0 (0, 0) | 96.86 |
| Sweet | 75.14 (39.84, 128.88) | 42 (7.50, 132.50) | 94.78 |
| Beverages | 1825.75 (1463.50, 2249.00) | 1444.74 (987.30, 1928.75) | 94.43 |
| Nuts | 3.58 (0.43, 10.73) | 0 (0, 0) | 99.34 |
| Fats & Oils | 37.80 (19.72, 52.38) | 16.59 (6.82, 30.61) | 96.61 |
| Drinks & Spirits | 42.83 (11.31, 125.00) | 0 (0, 95.19) | 95.15 |
| Fast Food | 63.32 (34.91, 117.55) | 14.69 (0, 127.68) | 95.47 |
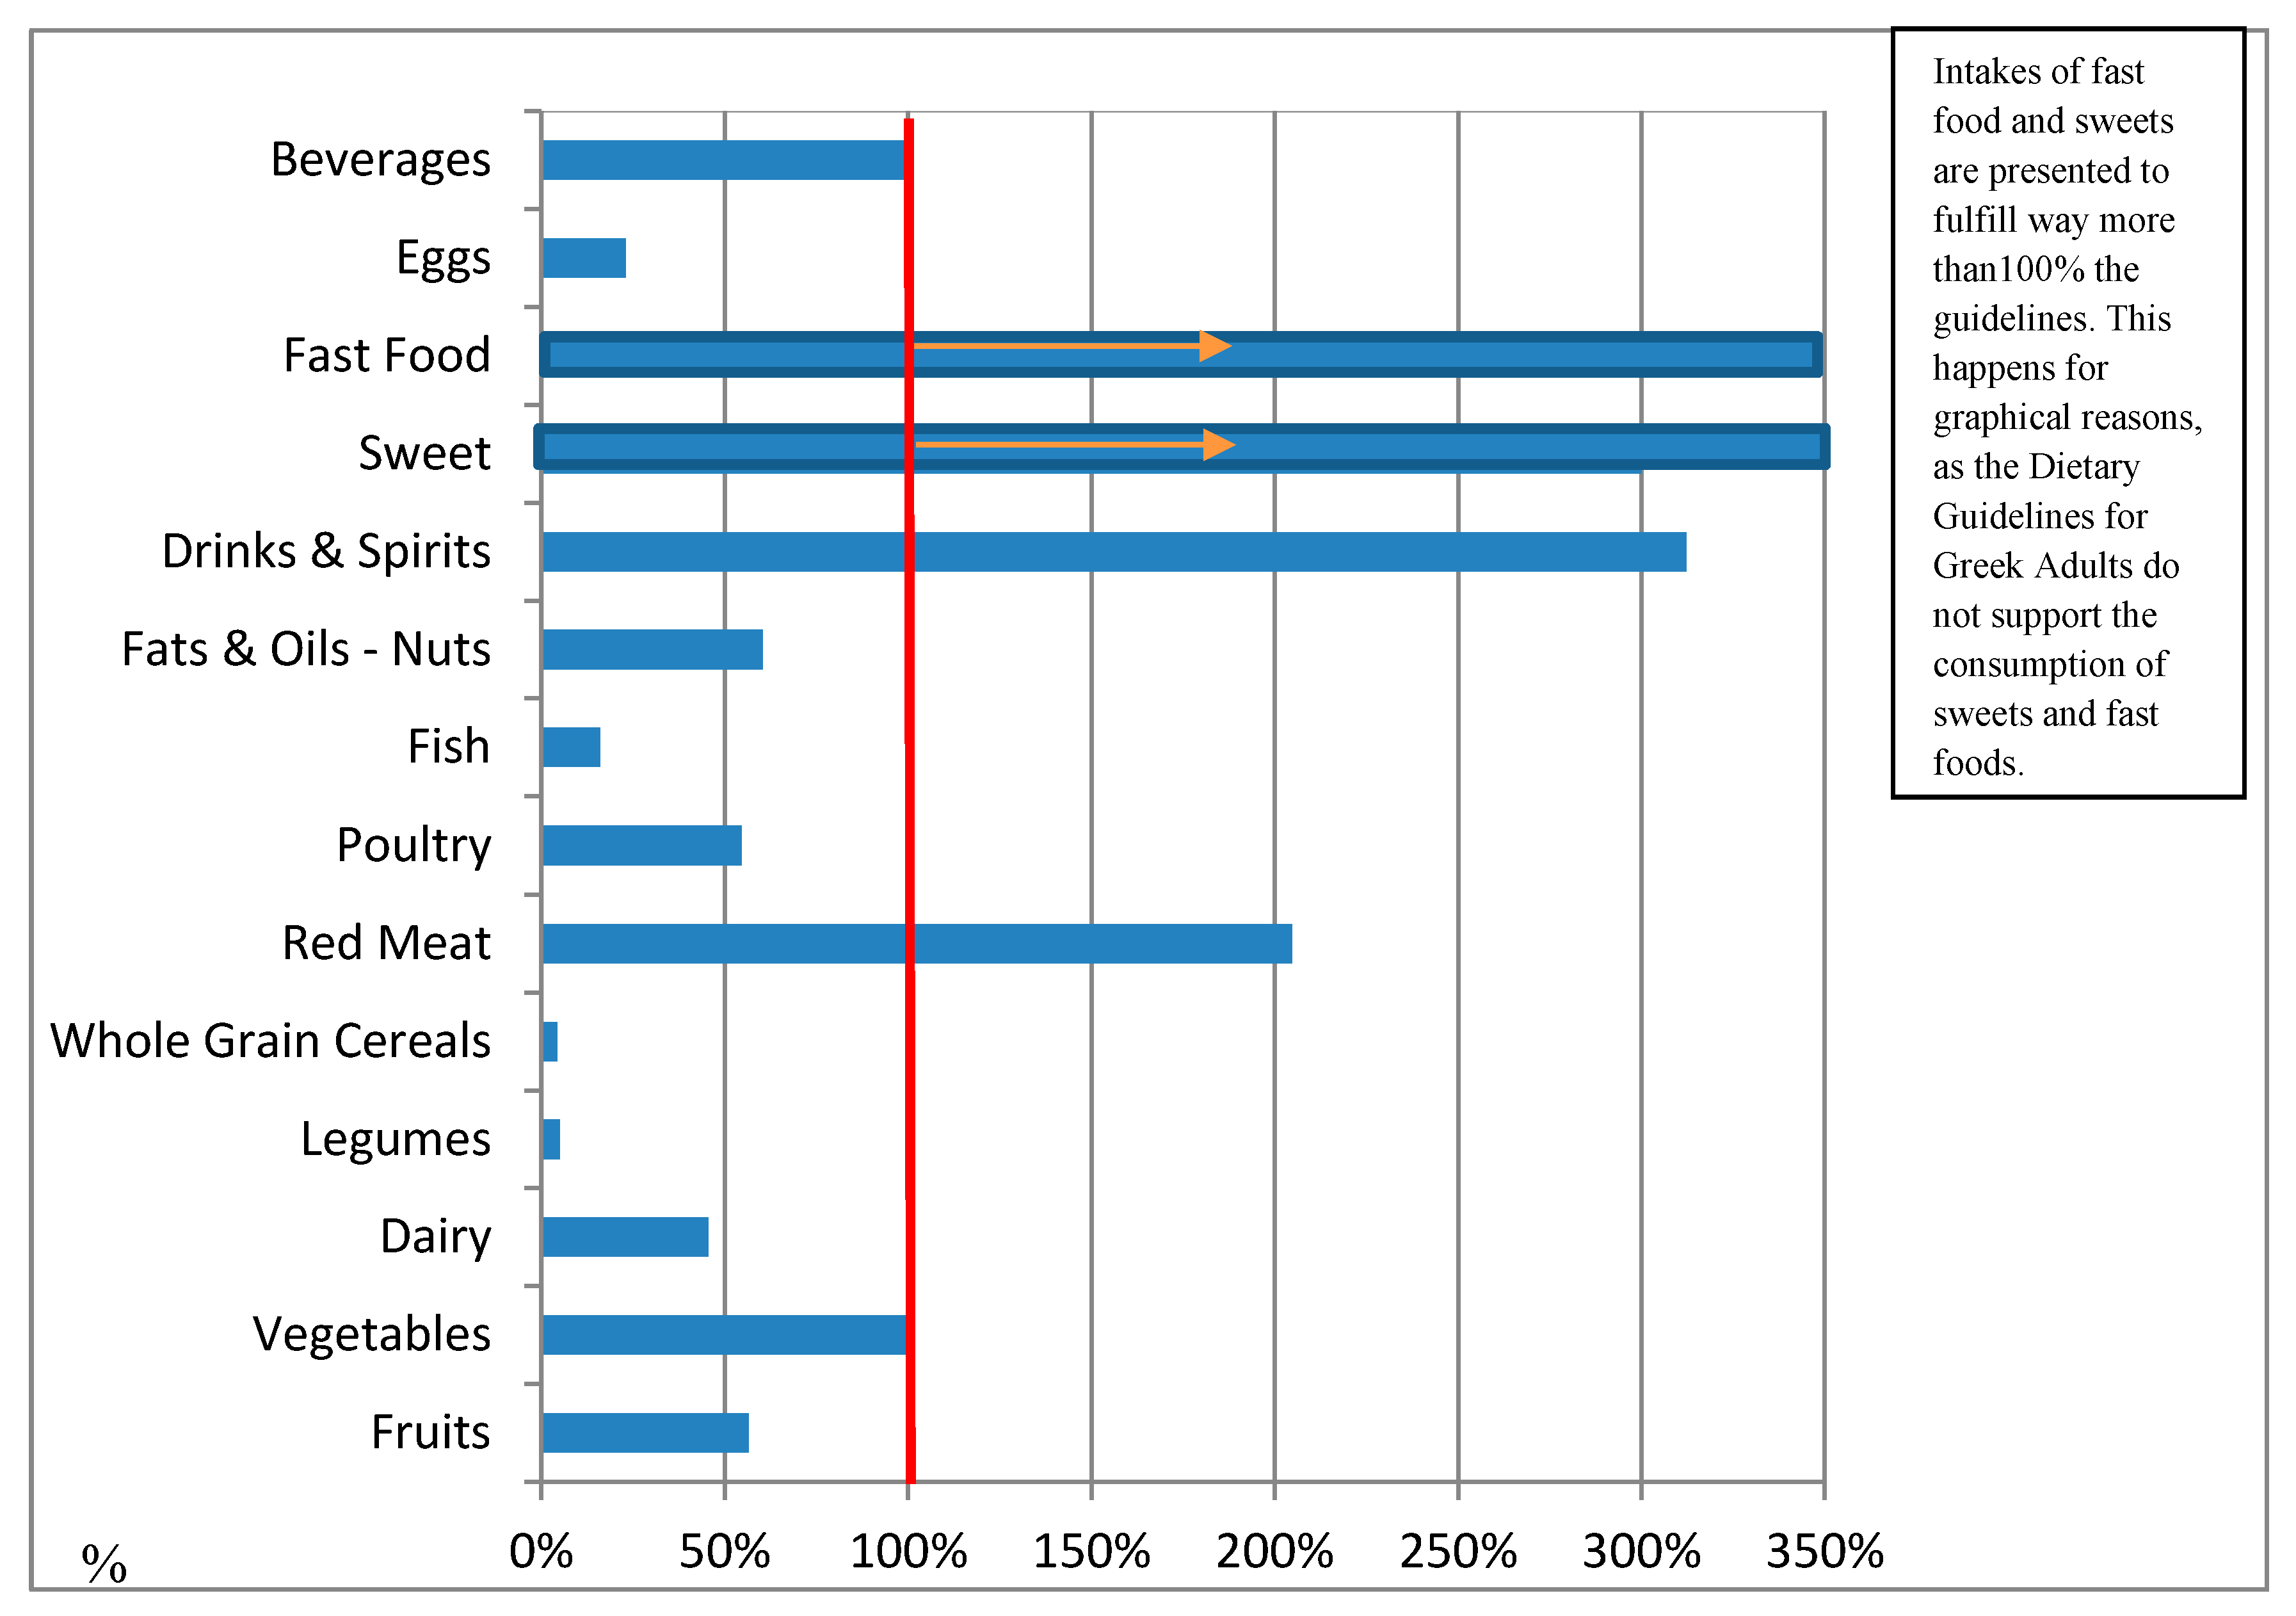
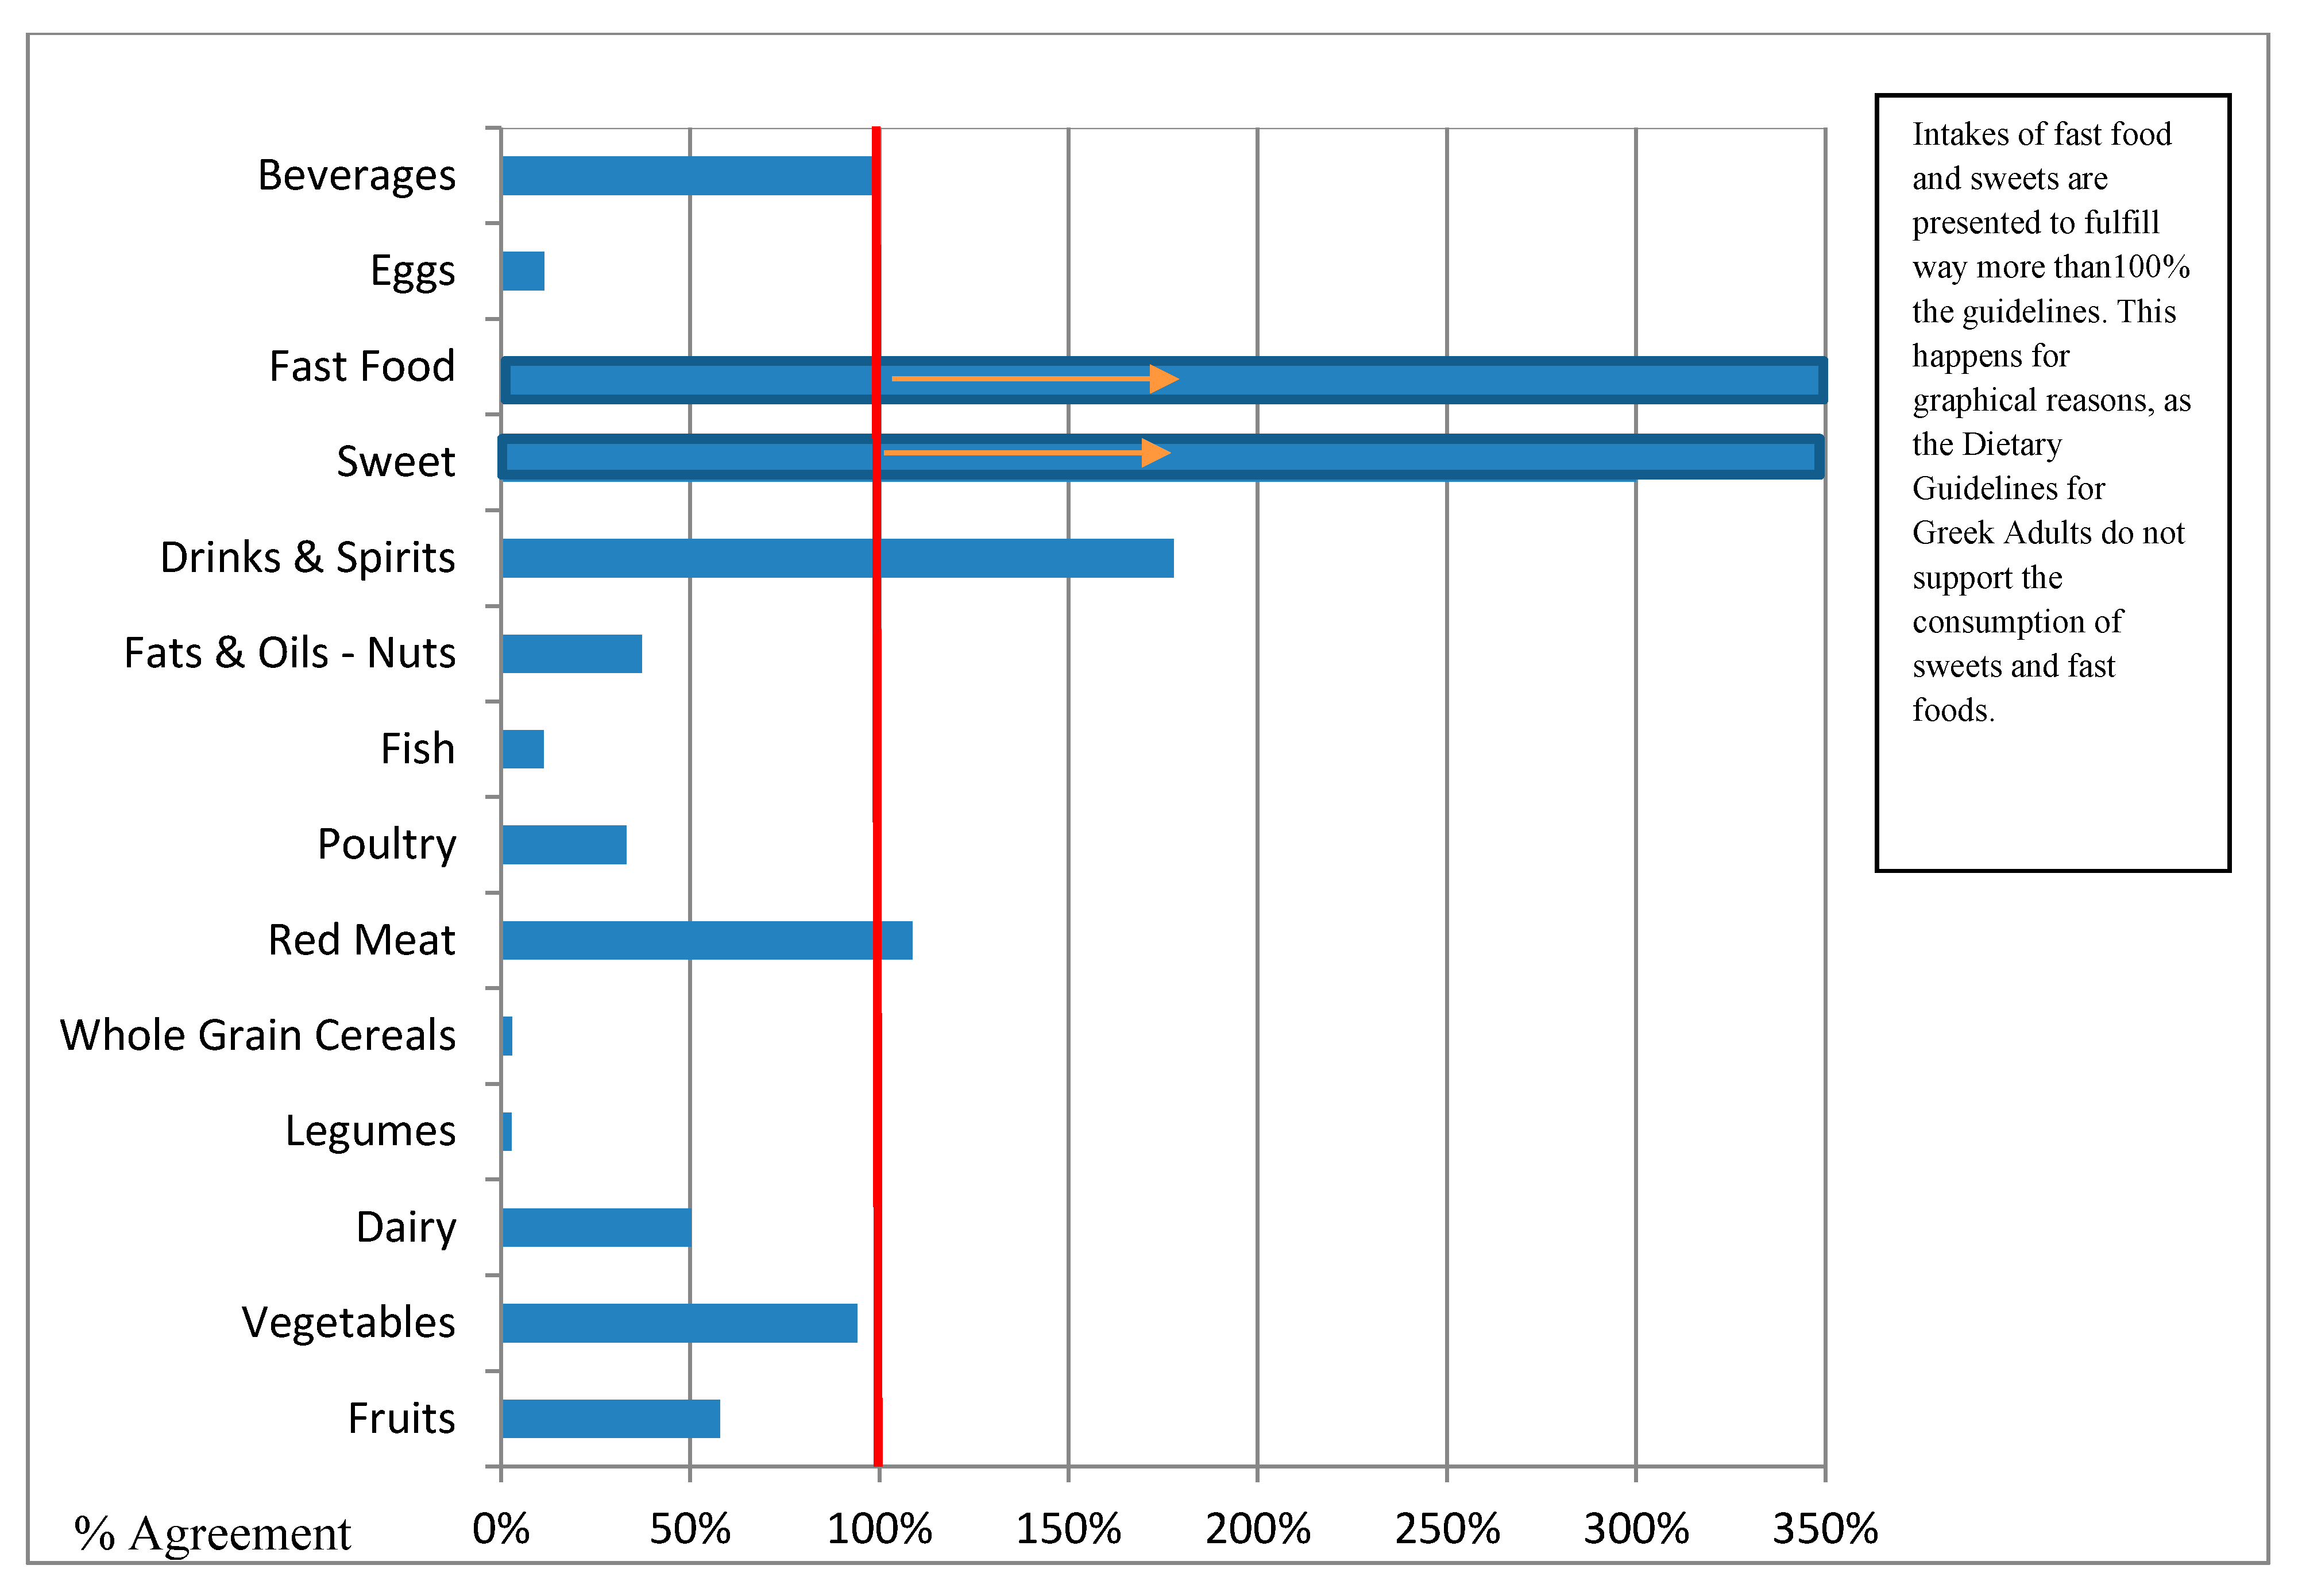
| A/A | Food Group | DGG 1 (g) | 24 hR 2 (g) | 24 hR 3 % | Combined 24 hR—FPQ 4 Intake (g) | Combined 24 hR—FPQ’s % Agreement with the Dietary Guidelines for Greek Adults 5 |
|---|---|---|---|---|---|---|
| 1 | Fruits | 480 | 148.7 | 30.98% | 270.77 | 56% |
| 2 | Vegetables | 700 | 193.82 | 27.69% | 632.63 | 90% |
| 3 | Dairy | 334 | 140.89 | 42.18% | 231.22 | 69% |
| 4 | Legumes | 75 | 14.72 | 19.63% | 2.57 | 3% |
| 5 | Refined Cereals * | 220 | 62.94 | 29% | 132.09 | 60% |
| 6 | Whole Grain Cereals | 227 | 88.05 | 39% | 7.17 | 3% |
| 7 | Red Meat ** | 19.29 | 51.22 | 266% | 27.78 | 144% |
| 8 | Poultry | 28.93 | 31.00 | 107% | 11.30 | 39% |
| 9 | Fish | 54 | 23.38 | 43.30% | 6.75 | 13% |
| 10 | Fats & Oils—Nuts | 112.5 | 27.61 | 24.54% | 48.91 | 44% |
| 11 | Drinks & Spirits | 45 | 88.28 | 130.79% | 92.25 | 205% |
| 12 | Sweet | limit | 97.62 | >100.00% | 59.04 | >100.00% |
| 13 | Fast Food | limit | 85.07 | >100.00% | 33.51 | >100.00% |
| 14 | Eggs | 29 | 10.52 | 36.28% | 4.76 | 16% |
| 15 | Beverages | 500 | 243.68 | 48.74% | 430.62 | 86% |
© 2020 by the authors. Licensee MDPI, Basel, Switzerland. This article is an open access article distributed under the terms and conditions of the Creative Commons Attribution (CC BY) license (http://creativecommons.org/licenses/by/4.0/).
Share and Cite
Smiliotopoulos, T.; Magriplis, E.; Zampelas, A. Validation of a Food Propensity Questionnaire for the Hellenic National Nutrition and Health Survey (HNNHS) and Results on This Population’s Adherence to Key Food-Group Nutritional Guidelines. Nutrients 2020, 12, 1808. https://doi.org/10.3390/nu12061808
Smiliotopoulos T, Magriplis E, Zampelas A. Validation of a Food Propensity Questionnaire for the Hellenic National Nutrition and Health Survey (HNNHS) and Results on This Population’s Adherence to Key Food-Group Nutritional Guidelines. Nutrients. 2020; 12(6):1808. https://doi.org/10.3390/nu12061808
Chicago/Turabian StyleSmiliotopoulos, Theodoros, Emmanuella Magriplis, and Antonis Zampelas. 2020. "Validation of a Food Propensity Questionnaire for the Hellenic National Nutrition and Health Survey (HNNHS) and Results on This Population’s Adherence to Key Food-Group Nutritional Guidelines" Nutrients 12, no. 6: 1808. https://doi.org/10.3390/nu12061808