Uptake of Australia’s Health Star Rating System 2014–2019
Abstract
1. Introduction
2. Methods
2.1. Data Source
2.2. Product Categorisation and Eligibility for HSR
2.3. Food Labelling and Food Composition Data
2.4. Calculation of HSR Values
2.5. Statistical Analyses
3. Results
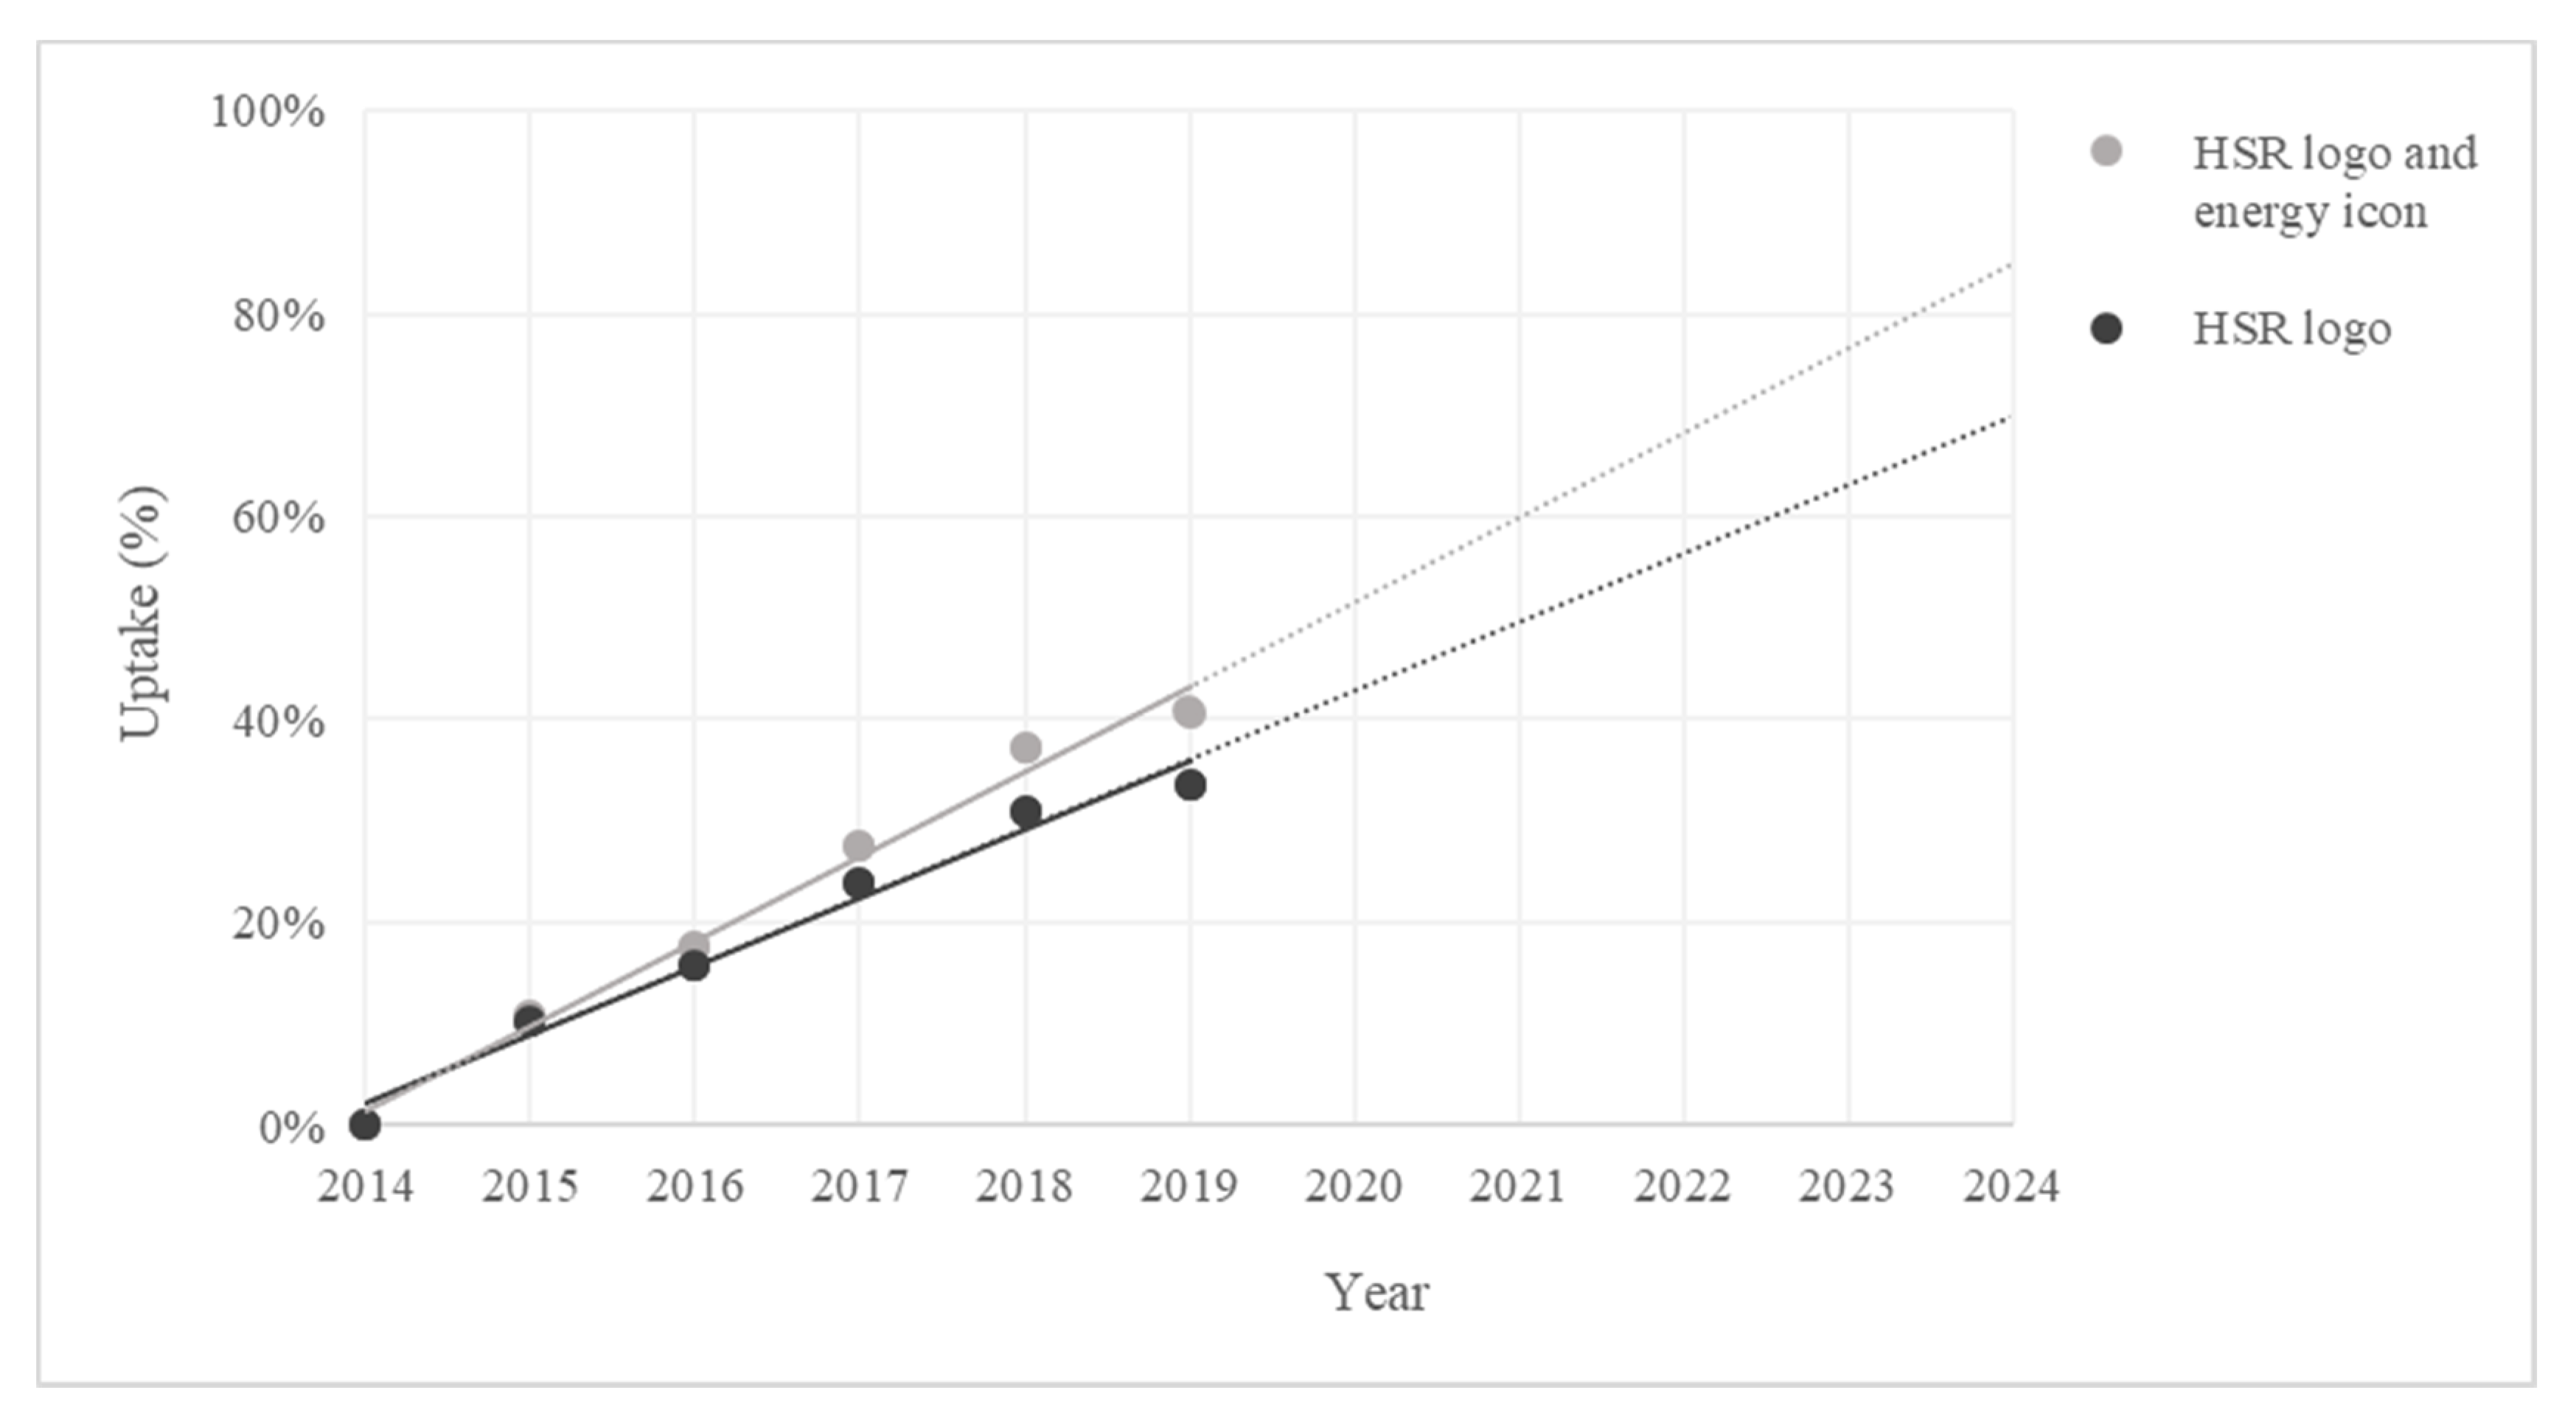
3.1. HSR Uptake over Time
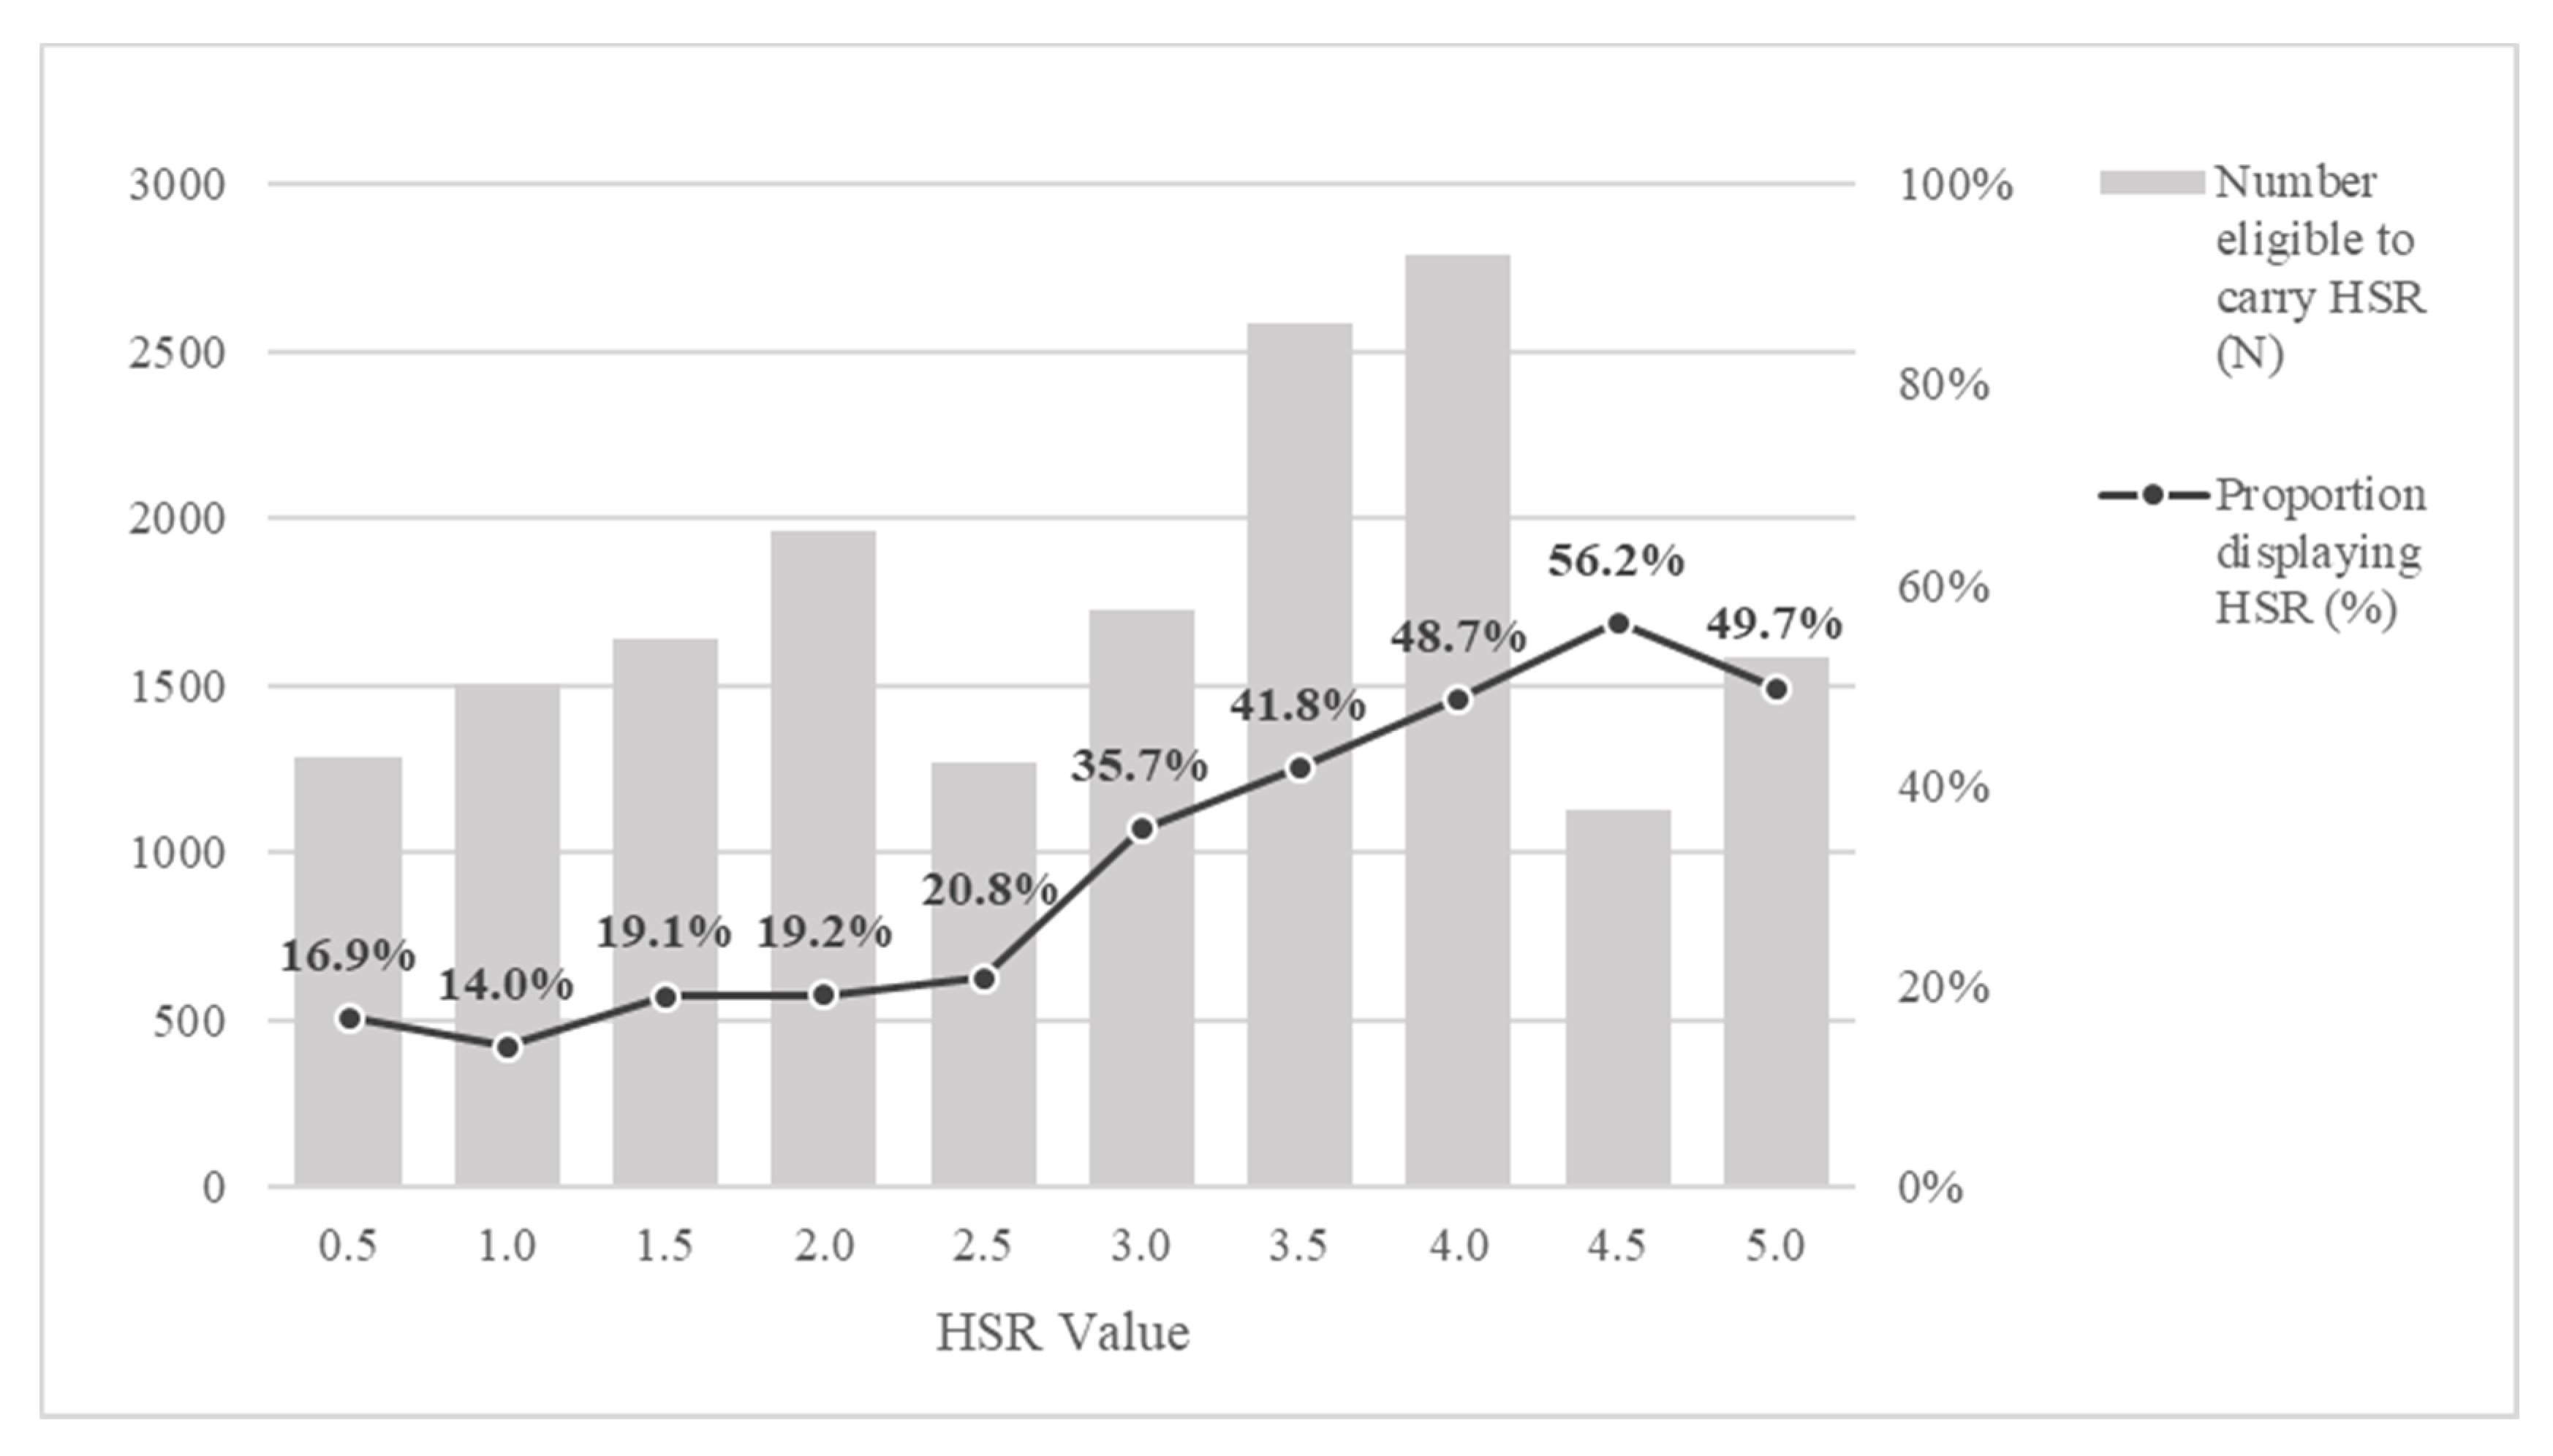
3.2. HSR Logo Uptake by HSR Value
3.3. HSR Uptake by Category
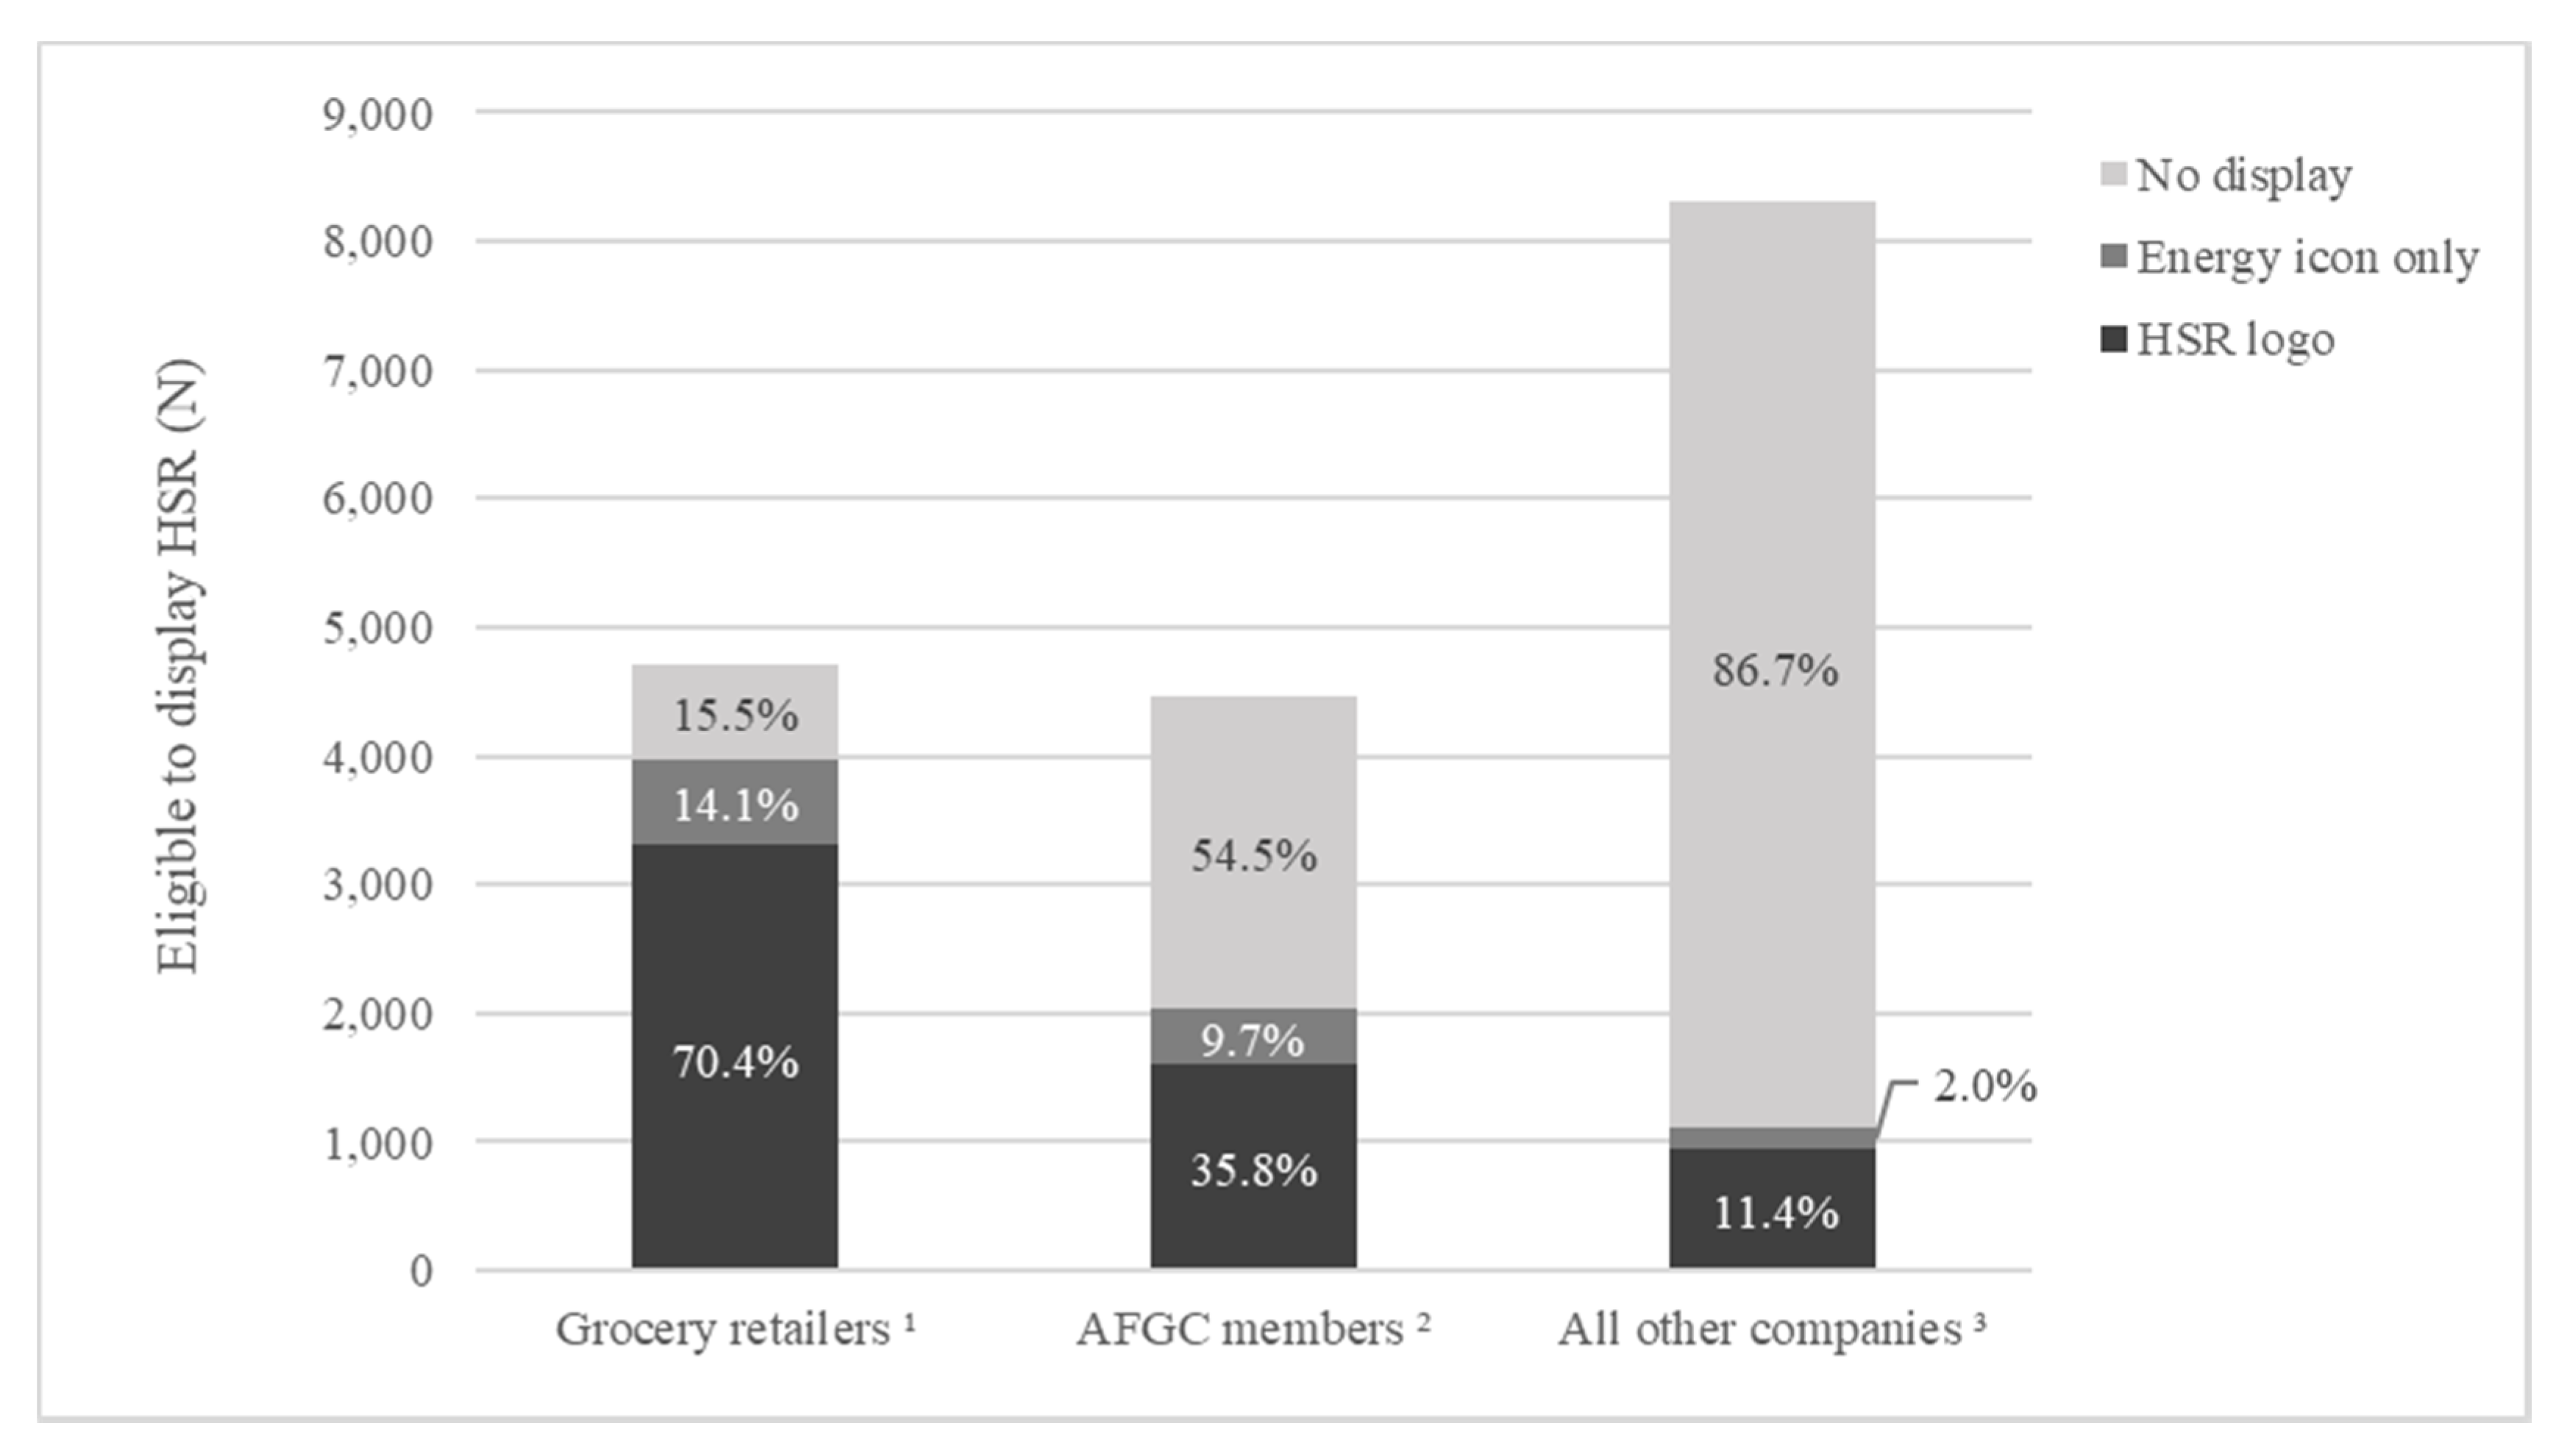
3.4. HSR Uptake by Manufacturer and Manufacturer Group
4. Discussion
5. Conclusions
Author Contributions
Funding
Conflicts of Interest
Appendix A
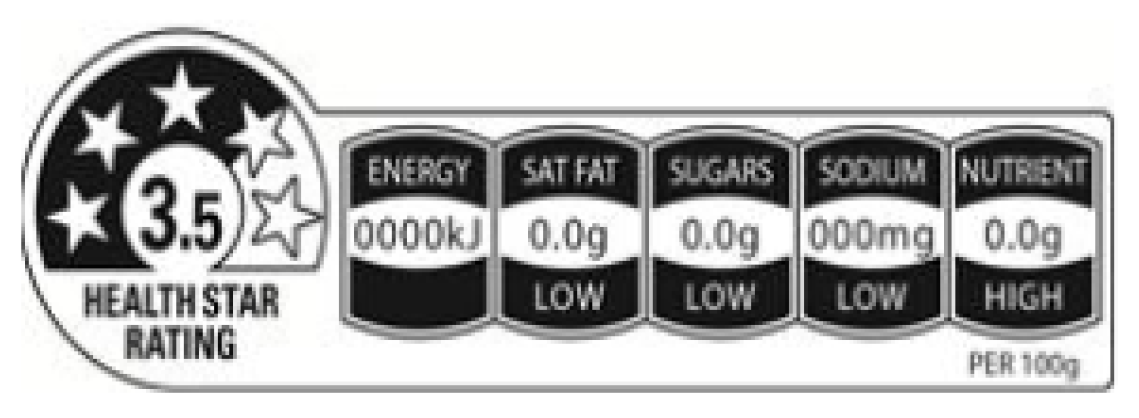
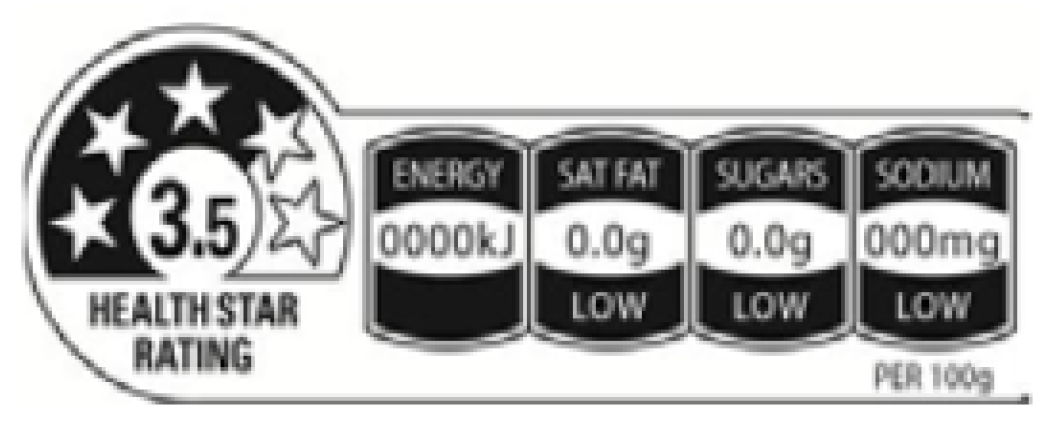
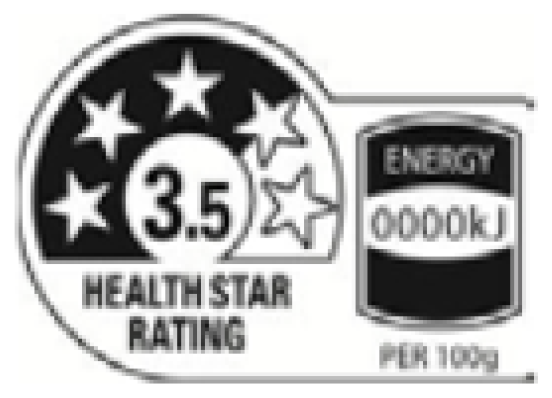

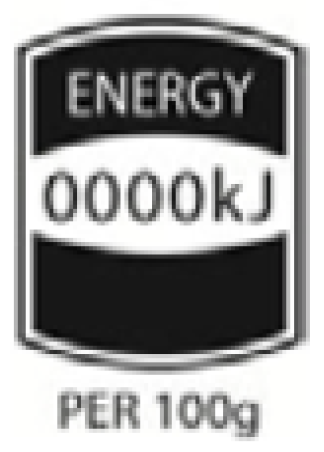
References
- World Health Organization. Global Action Plan for the Prevention and Control of Noncommunicable Diseases 2013–2020; World Health Organization: Geneva, Switzerland, 2013. [Google Scholar]
- World Health Organization. ’Best Buys’ and other Recommended Interventions for the Prevention and Control of Noncommunicable Diseases, Updated (2017) Appendix iii of the Global Action Plan for the Prevention and Control of Non-Communicable Diseases 2013–2020; World Health Organization: Geneva, Switzerland, 2017. [Google Scholar]
- Jones, A.; Neal, B.; Reeve, B.; Mhurchu, C.N.; Thow, A.M. Front-of-pack nutrition labelling to promote healthier diets: Current practice and opportunities to strengthen regulation worldwide. BMJ Glob. Health 2019, 4. [Google Scholar] [CrossRef] [PubMed]
- Department of Health. The Health Star Rating System (Website). Available online: http://healthstarrating.gov.au/internet/healthstarrating/publishing.nsf/content/home (accessed on 27 July 2017).
- MP Consulting. Five Year Review of the Health Star Rating -Final Report; Matthews Pegg Consulting: Melbourne, Australia, 2019. [Google Scholar]
- Australia and New Zealand Ministerial Forum on Food Regulation. The Australia and New Zealand Ministerial Forum on Food Regulation Response to the Health Star Rating System Five Year Review; Ministerial Forum on Food Regulation: Canberra, Australia, 2019.
- Jones, A.; Rådholm, K.; Neal, B. Defining ‘unhealthy’: A systematic analysis of alignment between the australian dietary guidelines and the health star rating system. Nutrients 2018, 10, 501. [Google Scholar] [CrossRef] [PubMed]
- Lawrence, M.; Lawrence, A.; Stanton, R.; Pollard, C.; Pulker, C.; Woods, J.; Ashton, B. Interpretive nutrient profiling algorithms are a limited tool for assessing the healthiness of countries’ packaged food and beverage supplies, and the conclusions are not substantiated by the data. Obes. Rev. Off. J. Int. Assoc. Study Obes. 2019. [Google Scholar] [CrossRef] [PubMed]
- Jones, A.; Thow, A.M.; Ni Mhurchu, C.; Sacks, G.; Neal, B. The performance and potential of the australasian health star rating system: A four-year review using the re-aim framework. Aust. N. Z. J. Public Health 2019, 43, 355–365. [Google Scholar] [CrossRef] [PubMed]
- Lawrence, M.A.; Pollard, C.; Vidgen, H.A.; Woods, J.L. The health star rating system–is its reductionist (nutrient) approach a benefit or risk for tackling dietary risk factors? Public Health Res. Pract. 2019, 29, e2911906. [Google Scholar] [CrossRef] [PubMed]
- Legislative and Governance Forum on Food Regulation. Available online: https://foodregulation.gov.au/internet/fr/publishing.nsf/Content/forum-communique-2013-December (accessed on 13 December 2013).
- Jones, A.; Shahid, M.; Neal, B. Uptake of australia’s Health Star Rating system. Nutrients 2018, 10, 997. [Google Scholar] [CrossRef] [PubMed]
- Tipping the Scales: Australian Obesity Prevention Consensus; Obesity Policy Coalition and GLOBE Obesity: Melbourne, Australia, 2017.
- Commonwealth of Australia. Final Report of the Senate Select Committee into the Obesity Epidemic in Australia; Commonwealth of Australia: Canberra, Australia, 2018. [Google Scholar]
- Dunford, E.; Trevena, H.; Goodsell, C.; Ng, K.H.; Webster, J.; Millis, A.; Goldstein, S.; Hugueniot, O.; Neal, B. Foodswitch: A mobile phone app to enable consumers to make healthier food choices and crowdsourcing of national food composition data. JMIR Mhealth Uhealth 2014, 2, e37. [Google Scholar] [CrossRef] [PubMed]
- Dunford, E.; Webster, J.; Metzler, A.B.; Czernichow, S.; Mhurchu, C.N.; Wolmarans, P.; Snowdon, W.; L’Abbe, M.; Li, N.; Maulik, P.K. International collaborative project to compare and monitor the nutritional composition of processed foods. Eur. J. Prev. Cardiol. 2012, 19, 1326–1332. [Google Scholar] [CrossRef] [PubMed]
- Health Star Rating Advisory Committee (HSRAC). Health Star Rating System Style Guide v5, 4th ed.; Department of Health: Canberra, Australia, 2017.
- Health Star Rating Advisory Committee (HSRAC). Guide for Industry to the Health Star Rating Calculator (HSRC), Version 5; Department of Health: Canberra, Australia, 2016.
- Food Standards Australia New Zealand. Nutrition Information User Guide to Standard 1.2.8 Nutrition Information Requirements; Food Standards Australia New Zealand: Canberra, Australia, 2013.
- Australian Food and Grocery Council. Australian Food and Grocery Council Annual Report 2018–2019; AFGC: Canberra, Australia, 2019. [Google Scholar]
- AiGroup. Aigroup—Confectionery. Available online: https://www.aigroup.com.au/business-services/industrysectors/confectionery/ (accessed on 28 April 2020).
- National Heart Foundation of Australia. Report on the Monitoring of the Implementation of the Health Star Rating System in the First Four Years of Implementation: June 2014 to June 2018; National Heart Foundation: Canberra, Australia, 2019. [Google Scholar]
- Magnusson, R.; Reeve, B. Food reformulation, responsive regulation, and “regulatory scaffolding”: Strengthening performance of salt reduction programs in australia and the united kingdom. Nutrients 2015, 7, 5281–5308. [Google Scholar] [CrossRef] [PubMed]
- Health Star Rating Technical Advisory Group (TAG). Five Year Review of the HSR System—Alignment of the HSR Algorithm with the Australia and New Zealand Dietary Guidelines Analysis of Alignment and Identification of Outliers; Matthews Pegg Consulting: Canberra, Australia, 2018.
- Kelly, B.; Jewell, J. What is the Evidence on the Policy Specifications, Development Processes and Effectiveness of Existing Front-of-Pack Food Labelling Policies in the Who European Region? WHO Regional Office for Europe: Copenhagen, Denmark, 2018. [Google Scholar]
- Pettigrew, S.; Dana, L.; Talati, Z. Enhancing the effectiveness of the health star rating via presentation modifications. Aust. N. Z. J. Public Health 2020, 44, 20–21. [Google Scholar] [CrossRef] [PubMed]
- Hamlin, R.; Hamlin, B. An experimental comparison of the impact of ‘warning’and ‘health star rating’fop labels on adolescents′ choice of breakfast cereals in new zealand. Nutrients 2020, 12, 1545. [Google Scholar] [CrossRef] [PubMed]
- Brennan, M. Is the health star rating system a thin response to a fat problem: An examination of the constitutionality of a mandatory front package labelling system. U. Notre Dame Austl. L. Rev. 2015, 17, 86. [Google Scholar] [CrossRef]
- Commonwealth of Australia. Country of Origin Food Labelling Information Standard Made under Section 134 of the Australian Consumer Law; Commonwealth of Australia: Canberra, Australia, 2016. [Google Scholar]
- World Cancer Research Fund International. WCRF International Food Policy Framework for Healthy Diets: NOURISHING. Available online: http://www.wcrf.org/policy_public_affairs/nourishing_framework/index.php (accessed on 16 June 2020).
- Ni Mhurchu, C.; Eyles, H.; Choi, Y.H. Effects of a voluntary front-of-pack nutrition labelling system on packaged food reformulation: The Health Star Rating system in New Zealand. Nutrients 2017, 9, 918. [Google Scholar] [CrossRef]
- Julia, C.; Hercberg, S. Development of a new front-of-pack nutrition label in france: The five-colour nutri-score. PANORAMA 2017, 712, 712–725. [Google Scholar]
- Food Packaging ‘Traffic Lights’ to Signal Healthy Choices on Salt, Fat and Sugar. Available online: https://www.theguardian.com/society/2013/jun/19/traffic-light-health-labels-food (accessed on 19 June 2013).
- Sacks, G.; Robinson, E.; Cameron, A. Inside Our Supermarkets: Assessment of Company Policies and Commitments Related to Obesity Prevention and Nutrition; Deakin University: Melbourne, Australia, 2018. [Google Scholar]
- Pulker, C.; Trapp, G.; Scott, J.; Pollard, C. What are the position and power of supermarkets in the australian food system, and the implications for public health? A systematic scoping review. Obes. Rev. 2018, 19, 198–218. [Google Scholar] [CrossRef]
- Jones, A. Regulatory Strategies to Promote Healthier Diets; University of Sydney: Sydney, Australia, 2019. [Google Scholar]
- Cameron, A.; Sacks, G.; Brown, A.; Ngan, W.; Isaacs, J. Customer and staff perceptions of a supermarket marketing intervention to promote healthy eating. In Proceedings of the World Congress on Public Health, Melbourne, Australia, 3–7 April 2017. [Google Scholar]
- Australian Food and Grocery Council. AFGC Submission: Draft Health Star Rating Five Year Review Report March 2019; AFGC: Canberra, Australia, 2019. [Google Scholar]
- World Health Organization. Safeguarding Against Possible Conflicts of Interest in Nutrition Programmes Draft Approach for the Prevention and Management of Conflicts of Interest in the Policy Development and Implementation of Nutrition Programmes at Country Level; World Health Organization: Geneva, Switzerland, 2017. [Google Scholar]
- World Health Organization. Guiding Principles and Framework Manual for Front-of-Pack Labelling for Promoting Healthy Diet; World Health Organization: Geneva, Switzerland, 2019. [Google Scholar]
- The Global Obesity Centre (GLOBE). Submission on the Health Star Rating System -Draft Five Year Report March 2019; GLOBE, Deakin University: Melbourne, Australia, 2019. [Google Scholar]
| Category | Products Surveyed (N) | Displaying HSR/Eligible to Display HSR (n/N) | Displaying HSR (%) | Mean HSR | ||
|---|---|---|---|---|---|---|
| HSR Logo | No HSR/Energy Icon Only | |||||
| Bread and bakery products | 2237 | 828/2089 | 39.6 | 2.4 | 2.2 | * |
| Cereal and grain products | 1827 | 886/1784 | 49.7 | 3.9 | 3.4 | * |
| Confectionery | 1259 | 443/1119 | 39.6 | 1.5 | 1.2 | * |
| Convenience foods | 1441 | 704/1383 | 50.9 | 3.4 | 3.5 | |
| Dairy | 2496 | 745/2382 | 31.3 | 3.1 | 2.7 | * |
| Edible oils and oil emulsions | 377 | 92/368 | 25.0 | 3.1 | 2.4 | * |
| Eggs | 66 | 9/65 | 13.8 | 4.0 | 4.0 | |
| Fish and fish products | 596 | 324/594 | 54.5 | 3.9 | 3.4 | * |
| Fruit and vegetables | 3064 | 1040/2032 | 51.2 | 4.1 | 3.6 | * |
| Meat and meat products | 1594 | 512/1168 | 43.8 | 3.1 | 2.4 | * |
| Non-alcoholic beverages | 2143 | 657/1429 | 46.0 | 4.1 | 2.3 | * |
| Sauces, dressings, spreads and dips | 1889 | 515/1832 | 28.1 | 3.4 | 2.4 | * |
| Snack foods | 656 | 204/637 | 32.0 | 2.9 | 2.4 | * |
| Special foods | 775 | 107/323 | 33.1 | 4.4 | 3.4 | * |
| Sugars, honey and related products | 307 | 52/272 | 19.1 | 1.1 | 1.3 | |
| Products in excluded categories | 500 | |||||
| Total | 21,227 | 7118/17,477 | 40.7 | 3.4 | 2.6 | |
| Company 1 | Products Surveyed (N) | Displaying HSR/Eligible to Display HSR (n/N) | Displaying HSR (%) | Mean HSR | ||
|---|---|---|---|---|---|---|
| HSR Logo | No HSR/Energy Icon Only | |||||
| McCain Foods | 119 | 116/119 | 97.5 | 3.7 | 3.5 | |
| Sanitarium + | 82 | 79/82 | 96.3 | 4.3 | 2.7 | * |
| Coles ^ | 2338 | 1602/1733 | 92.4 | 3.0 | 3.0 | |
| Simplot + | 423 | 375/423 | 88.7 | 4.0 | 3.0 | * |
| Woolworths ^ | 1357 | 958/1083 | 88.5 | 3.3 | 3.5 | |
| SPC Ardmona Operations | 84 | 69/84 | 82.1 | 3.9 | 2.7 | * |
| ALDI ^ | 1969 | 1419/1733 | 81.9 | 3.2 | 2.4 | * |
| Nestlé + | 408 | 242/309 | 78.3 | 3.9 | 1.4 | * |
| Coca-Cola Amatil + | 208 | 148/197 | 75.1 | - | 2.0 | |
| Kellogg’s + | 97 | 70/94 | 74.5 | 3.4 | 1.7 | * |
| Mars + | 437 | 215/290 | 74.1 | 3.5 | 1.3 | * |
| Campbell Arnott’s + | 230 | 158/225 | 70.2 | 2.7 | 1.9 | * |
| Schweppes | 137 | 87/131 | 66.4 | - | 1.8 | |
| Unilever + | 293 | 166/260 | 63.8 | 3.4 | 2.0 | * |
| Freedom Foods Group + | 128 | 71/122 | 58.2 | 4.4 | 3.8 | * |
| Lion Dairy & Drinks + | 245 | 119/229 | 52.0 | 3.9 | 2.6 | * |
| George Weston Foods + | 118 | 60/118 | 50.8 | 3.8 | 1.9 | * |
| The Smith’s Snackfood Company | 94 | 24/92 | 26.1 | 3.3 | 2.3 | * |
| Heinz | 307 | 64/261 | 24.5 | 4.0 | 3.0 | * |
| Goodman Fielder + | 195 | 40/175 | 22.9 | 3.8 | 2.5 | * |
| San Remo Macaroni Company | 150 | 13/150 | 8.7 | 3.5 | 3.4 | |
| Ricegrowers (SunRice) + | 134 | 11/127 | 8.7 | 3.6 | 3.1 | * |
| Bega Cheese + | 109 | 3/109 | 2.8 | 4.0 | 2.1 | * |
| The Market Grocer | 202 | 4/191 | 2.1 | 4.9 | 3.7 | |
| Mondelēz + | 295 | 0/291 | 0.0 | - | 1.3 | |
| Oriental Merchant | 196 | 0/188 | 0.0 | - | 2.1 | |
| IGA ^ | 289 | 0/161 | 0.0 | - | 2.6 | |
| Manassen Foods | 174 | 0/160 | 0.0 | - | 2.9 | |
| Parmalat | 136 | 0/135 | 0.0 | - | 3.2 | |
| General Mills + | 130 | 0/108 | 0.0 | - | 2.5 | |
| Murray Goulburn Co-operative Company | 91 | 0/91 | 0.0 | - | 3.4 | |
| All other companies | 10,052 | 1005/8006 | 12.6 | 4.0 | 2.7 | * |
| Total | 21,227 | 7118/17,477 | 40.7 | 3.4 | 2.6 | |
© 2020 by the authors. Licensee MDPI, Basel, Switzerland. This article is an open access article distributed under the terms and conditions of the Creative Commons Attribution (CC BY) license (http://creativecommons.org/licenses/by/4.0/).
Share and Cite
Shahid, M.; Neal, B.; Jones, A. Uptake of Australia’s Health Star Rating System 2014–2019. Nutrients 2020, 12, 1791. https://doi.org/10.3390/nu12061791
Shahid M, Neal B, Jones A. Uptake of Australia’s Health Star Rating System 2014–2019. Nutrients. 2020; 12(6):1791. https://doi.org/10.3390/nu12061791
Chicago/Turabian StyleShahid, Maria, Bruce Neal, and Alexandra Jones. 2020. "Uptake of Australia’s Health Star Rating System 2014–2019" Nutrients 12, no. 6: 1791. https://doi.org/10.3390/nu12061791
APA StyleShahid, M., Neal, B., & Jones, A. (2020). Uptake of Australia’s Health Star Rating System 2014–2019. Nutrients, 12(6), 1791. https://doi.org/10.3390/nu12061791


