Responsive Feeding, Infant Growth, and Postpartum Depressive Symptoms during 3 Months Postpartum


Abstract
1. Introduction
2. Materials and Methods
2.1. Sample and Setting
2.2. Sample Size Consideration
2.3. Measures
2.4. Study Design and Procedure
2.5. Statistical Analysis
3. Results
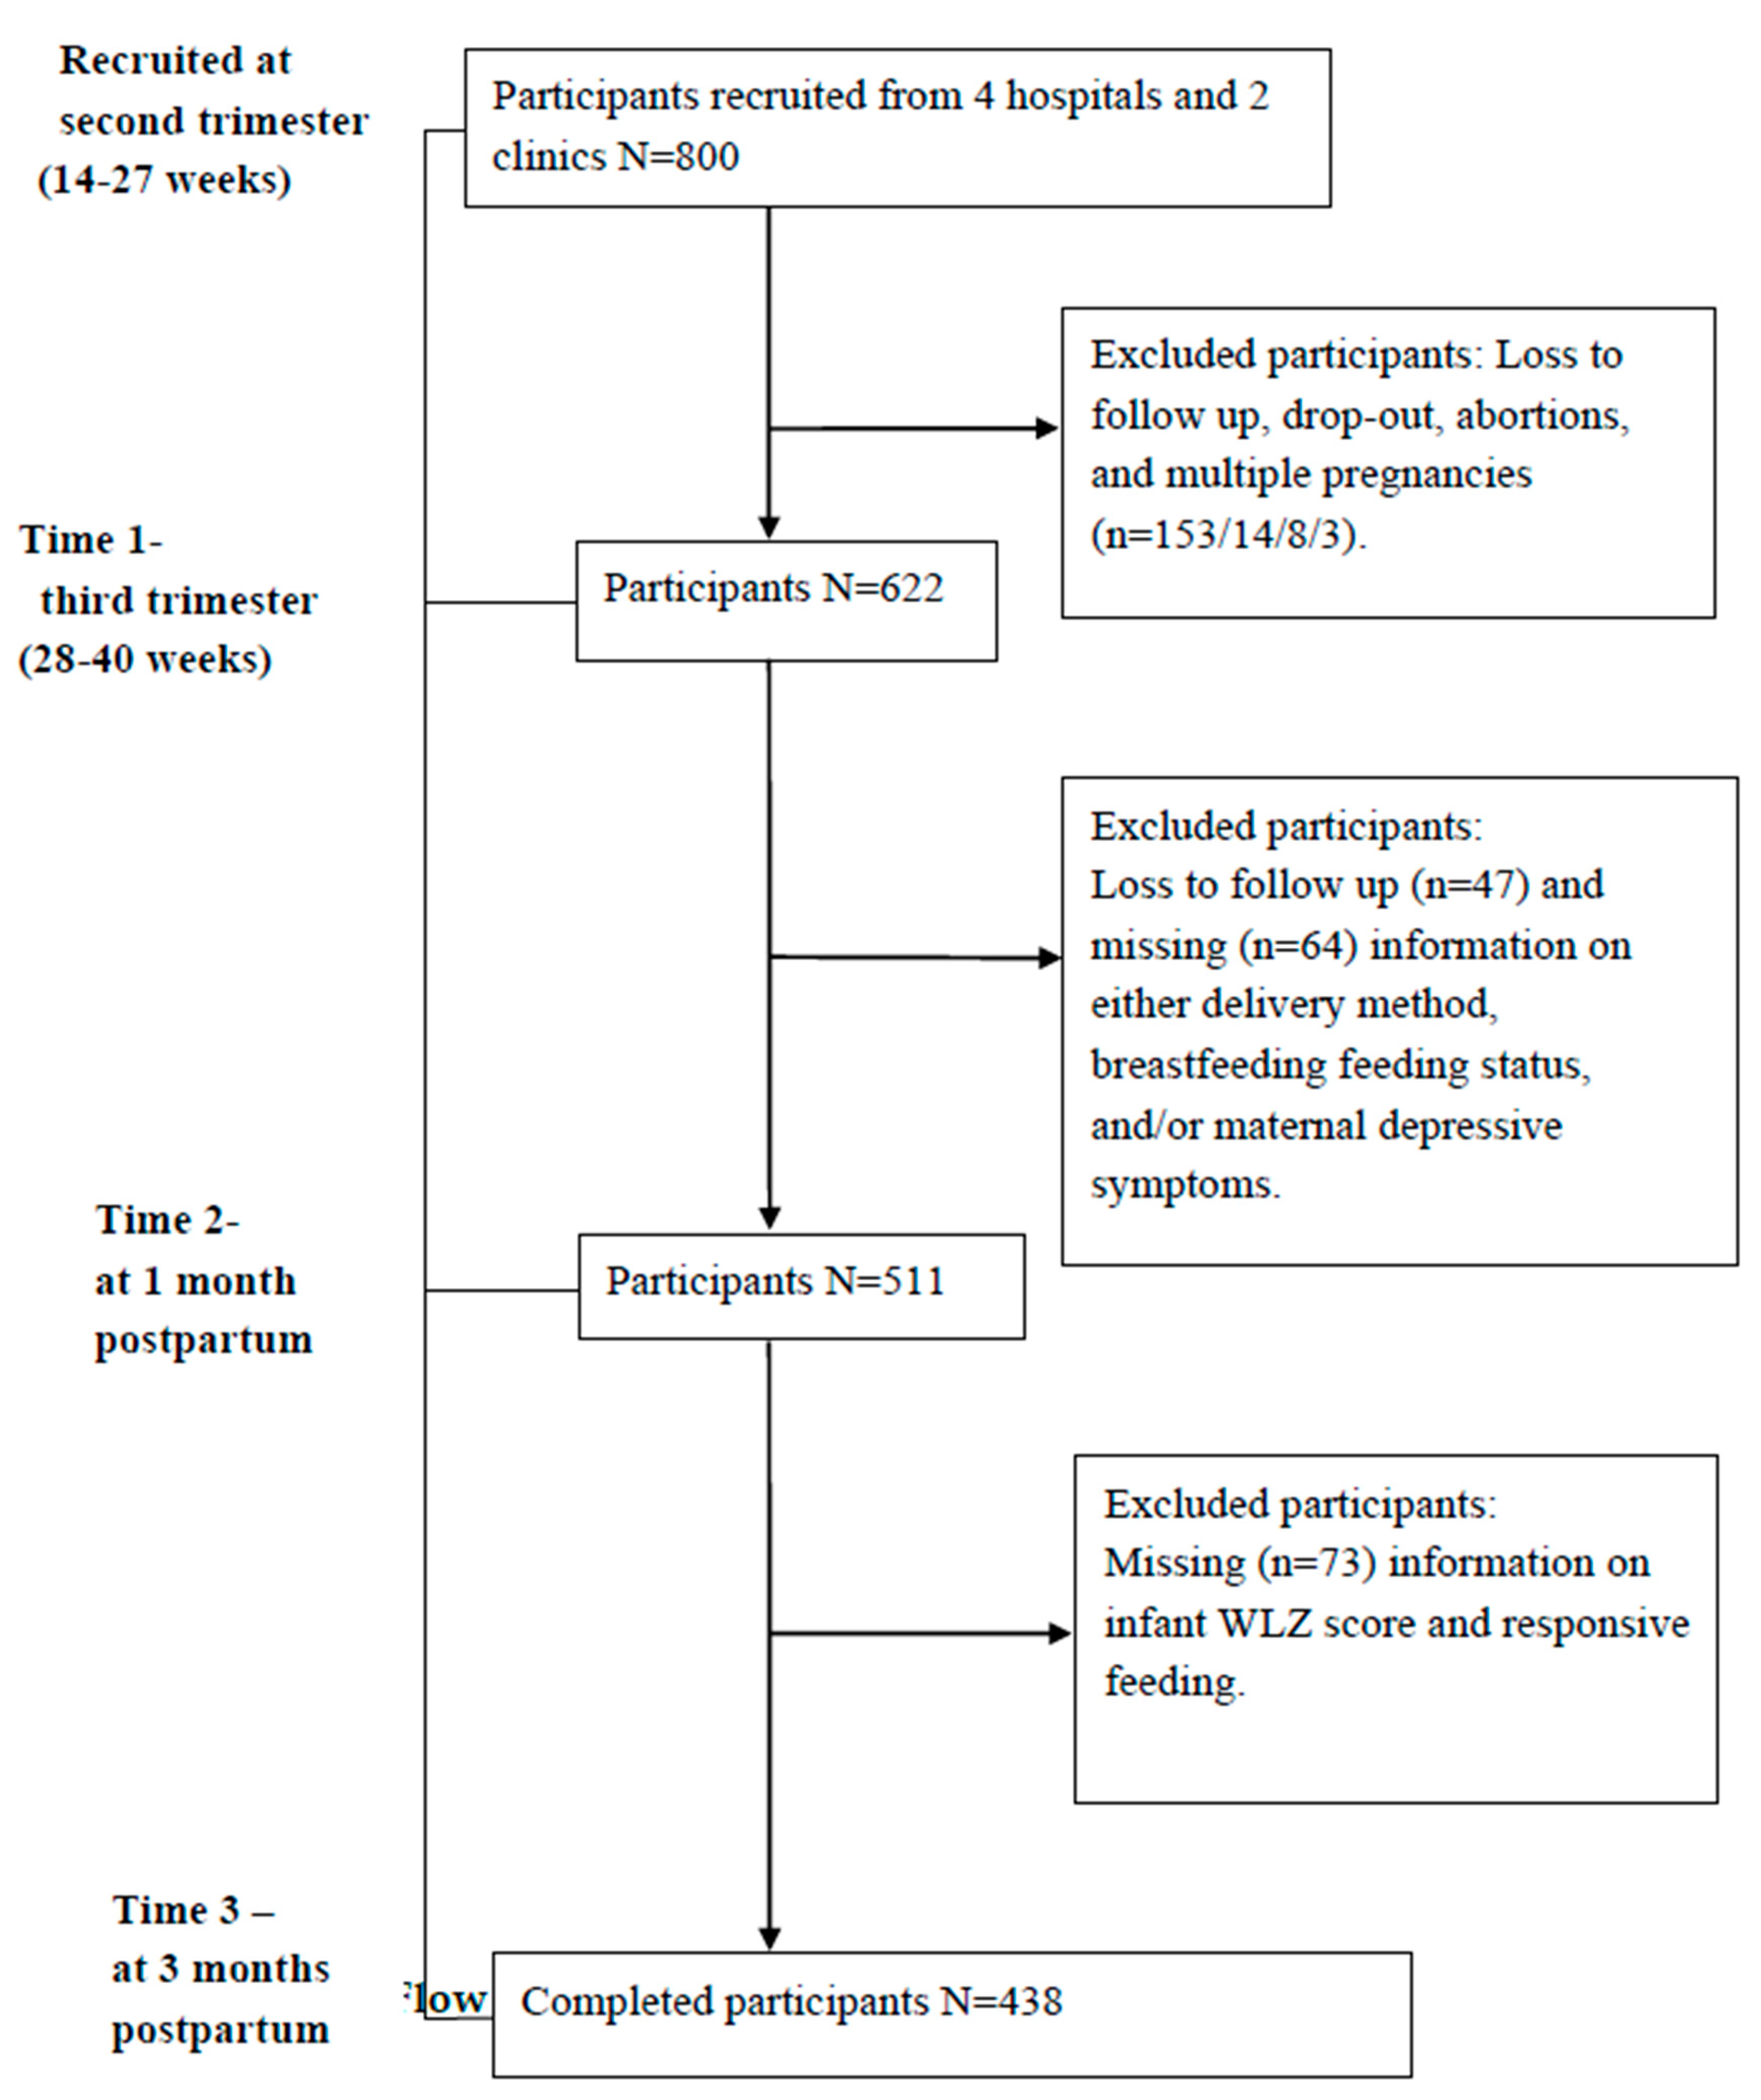
3.1. Sample Flows
3.2. Participant Characteristics
3.3. Descriptive of the Responsive Feeding Scale
3.4. Bi-Variate Analysis on Factors Associated with Responsive Feeding
3.5. Multi-Variate Results on Factors Associated with Responsive Feeding
4. Discussion
5. Conclusions
Author Contributions
Funding
Conflicts of Interest
References
- Shepard, D.N.; Chandler-Laney, P.C. Prospective associations of eating behaviors with weight gain in infants. Obesity 2015, 23, 1881–1885. [Google Scholar] [CrossRef]
- Landry, S.H.; Smith, K.E.; Swank, P.R. Responsive parenting: Establishing early foundations for social, communication, and independent problem-solving skills. Dev. Psychol. 2006, 42, 627–642. [Google Scholar] [CrossRef]
- Sall, N.S.; Bégin, F.; Dupuis, J.B.; Bourque, J.; Menasria, L.; Main, B.; Vong, L.; Hun, V.; Raminashvili, D.; Chea, C.; et al. A measurement scale to assess responsive feeding among Cambodian young children. Matern. Child Nutr. 2020, e12956. [Google Scholar] [CrossRef]
- Hurley, K.M.; Cross, M.B.; Hughes, S.O. A Systematic Review of Responsive Feeding and Child Obesity in High-Income Countries123. J. Nutr. 2011, 141, 495–501. [Google Scholar] [CrossRef] [PubMed]
- Whorld Health Organization (WHO). Infant and Young Child Feeding. Available online: http://www.wpro.who.int/nutrition_wpr/publications/infantchildfeeding.pdf (accessed on 20 April 2020).
- UNICEF. Responsive Feeding: Supporting Close and Loving Relationships. Available online: https://www.unicef.org.uk/babyfriendly/wp-content/uploads/sites/2/2017/12/Responsive-Feeding-Infosheet-Unicef-UK-Baby-Friendly-Initiative.pdf (accessed on 12 May 2018).
- Cassells, E.L.; Magarey, A.; Daniels, L.; Mallan, K.M. The influence of maternal infant feeding practices and beliefs on the expression of food neophobia in toddlers. Appetite 2014, 82, 36–42. [Google Scholar] [CrossRef] [PubMed]
- Mallan, K.M.; Daniels, L.; Wilson, J.L.; Jansen, E.; Nicholson, J. Association between maternal depressive symptoms in the early post-natal period and responsiveness in feeding at child age 2 years. Matern. Child Nutr. 2014, 11, 926–935. [Google Scholar] [CrossRef] [PubMed]
- Gross, R.S.; Fierman, A.H.; Mendelsohn, A.L.; Chiasson, M.A.; Rosenberg, T.J.; Scheinmann, R.; Messito, M.J. Maternal Perceptions of Infant Hunger, Satiety, and Pressuring Feeding Styles in an Urban Latina WIC Population. Acad. Pediatr. 2010, 10, 29–35. [Google Scholar] [CrossRef] [PubMed]
- McMeekin, S.; Jansen, E.; Mallan, K.M.; Nicholson, J.; Magarey, A.; Daniels, L. Associations between infant temperament and early feeding practices. A cross-sectional study of Australian mother-infant dyads from the NOURISH randomised controlled trial. Appetite 2013, 60, 239–245. [Google Scholar] [CrossRef]
- Heller, R.L.; Mobley, A.R. Instruments assessing parental responsive feeding in children ages birth to 5 years: A systematic review. Appetite 2019, 138, 23–51. [Google Scholar] [CrossRef]
- Mihrshahi, S.; Battistutta, D.; Magarey, A.; Daniels, L. Determinants of rapid weight gain during infancy: Baseline results from the NOURISH randomised controlled trial. BMC Pediatr. 2011, 11, 99. [Google Scholar] [CrossRef] [PubMed]
- Worobey, J.; Lopez, M.I.; Hoffman, D.J. Maternal Behavior and Infant Weight Gain in the First Year. J. Nutr. Educ. Behav. 2009, 41, 169–175. [Google Scholar] [CrossRef]
- Farrow, C.; Blissett, J. Does Maternal Control During Feeding Moderate Early Infant Weight Gain? Pediatrics 2006, 118, 293. [Google Scholar] [CrossRef]
- Fuglestad, A.J.; Demerath, E.W.; Finsaas, M.C.; Moore, C.J.; Georgieff, M.K.; Carlson, S.M. Maternal executive function, infant feeding responsiveness and infant growth during the first 3 months. Pediatr. Obes. 2017, 12, 102–110. [Google Scholar] [CrossRef]
- Norhayati, M.N.; Hazlina, N.N.; Asrenee, A.; Emilin, W.M.A.W. Magnitude and risk factors for postpartum symptoms: A literature review. J. Affect. Disord. 2015, 175, 34–52. [Google Scholar] [CrossRef]
- Field, T. Postpartum depression effects on early interactions, parenting, and safety practices: A review. Infant Behav. Dev. 2009, 33, 1–6. [Google Scholar] [CrossRef]
- Lovejoy, M.C.; Graczyk, P.A.; O’Hare, E.; Neuman, G. Maternal depression and parenting behavior: A meta-analytic review. Clin. Psychol. Rev. 2000, 20, 561–592. [Google Scholar] [CrossRef]
- Hurley, K.M.; Black, M.M.; Papas, M.A.; Caufield, L.E. Maternal Symptoms of Stress, Depression, and Anxiety Are Related to Nonresponsive Feeding Styles in a Statewide Sample of WIC Participants. J. Nutr. 2008, 138, 799–805. [Google Scholar] [CrossRef]
- Brown, A.; Arnott, B. Breastfeeding Duration and Early Parenting Behaviour: The Importance of an Infant-Led, Responsive Style. PLoS ONE 2014, 9, e83893. [Google Scholar] [CrossRef]
- McNally, J.; Hugh-Jones, S.; Caton, S.J.; Vereijken, C.; Weenen, H.; Hetherington, M.M. Communicating hunger and satiation in the first 2 years of life: A systematic review. Matern. Child Nutr. 2015, 12, 205–228. [Google Scholar] [CrossRef]
- Cerro, N.; Zeunert, S.; Simmer, K.N.; Daniels, L.A. Eating behaviour of children 1.5–3.5 years born preterm: Parents’ perceptions. J. Paediatr. Child Health 2002, 38, 72–78. [Google Scholar] [CrossRef]
- Polit, D.F.; Beck, C.T. Nursing Research: Generating and Assessing Evidence for Nursing Practice, 9th ed.; Lippincott Williams & Wilkins: Philadelphia, PA, USA, 2012; pp. 441–442. ISBN 978-1-6054-7782-4. [Google Scholar]
- Hollingshead, A.B. Two Factor Index of Social Position; Yale University Press: New Haven, CT, USA, 1957; pp. 1–22. [Google Scholar]
- Lindsay, P.; Parelius, R.J.; Parelius, A.P. The Sociology of Education. Teach. Sociol. 1988, 16, 215. [Google Scholar] [CrossRef]
- Center for Disease Control and Prevention (CDC). Weight Gain During Pregnancy. Available online: http://www.cdc.gov/reproductivehealth/maternalinfanthealth/ (accessed on 12 March 2017).
- Heh, S.; Coombes, L.; Bartlett, H. The association between depressive symptoms and social support in Taiwanese women during the month. Int. J. Nurs. Stud. 2004, 41, 573–579. [Google Scholar] [CrossRef]
- Whorld Health Organization (WHO). Child Growth Standards. Available online: https://www.who.int/childgrowth/software/en/ (accessed on 12 July 2018).
- Whorld Health Organization (WHO). Growth Standards Are Recommended for Use in the U.S. for Infants and Children 0 to 2 Years of Age. Available online: https://www.cdc.gov/growthcharts/who_charts.htm (accessed on 25 May 2019).
- Harbron, J.; Booley, S. Responsive feeding: Establishing healthy eating behaviour early on in life. S. Afr. J. Clin. Nutr. 2013, 26, 141–149. [Google Scholar]
- Gross, R.S.; Mendelsohn, A.L.; Fierman, A.H.; Hauser, N.R.; Messito, M.J. Maternal Infant Feeding Behaviors and Disparities in Early Child Obesity. Child. Obes. 2014, 10, 145–152. [Google Scholar] [CrossRef]
- Mallan, K.M.; Sullivan, S.E.; de Jersey, S.J.; Daniels, L. The relationship between maternal feeding beliefs and practices and perceptions of infant eating behaviours at 4 months. Appetite 2016, 105, 1–7. [Google Scholar] [CrossRef] [PubMed]
- Jafari, M.; Ansari-Pour, N. Why, When and How to Adjust Your P Values? Cell J. 2018, 20, 604–607. [Google Scholar] [PubMed]
- Mundfrom, D.J.; Perrett, J.J.; Schaffer, J.; Piccone, A.; Roozeboom, M. Bonferroni adjustments in tests for regression coefficients. Mult. Linear Regres. Viewpoints 2006, 32, 1–6. [Google Scholar]
- Dong, Y.; Peng, C.-Y.J. Principled missing data methods for researchers. SpringerPlus 2013, 2, 222. [Google Scholar] [CrossRef] [PubMed]
- Thompson, A.L.; Adair, L.S.; Bentley, M.E. Pressuring and restrictive feeding styles influence infant feeding and size among a low-income African American sample. Obesity 2013, 21, 562–571. [Google Scholar] [CrossRef]
- Fildes, A.; van Jaarsveld, C.H.M.; Llewellyn, C.; Wardle, J.; Fisher, A. Parental control over feeding in infancy. Influence of infant weight, appetite and feeding method. Appetite 2015, 91, 101–106. [Google Scholar] [CrossRef]
- Askie, L.M.; Espinoza, D.; Martin, A.; Daniels, L.A.; Mihrshahi, S.; Taylor, R.; Wen, L.M.; Campbell, K.; Hesketh, K.D.; Rissel, C.; et al. Interventions commenced by early infancy to prevent childhood obesity—The EPOCH Collaboration: An individual participant data prospective meta-analysis of four randomized controlled trials. Pediatr. Obes. 2020, 15, e12618. [Google Scholar] [CrossRef]
- Zhou, N.; Cheah, C.S.L.; van Hook, J.; Thompson, D.A.; Jones, S.S. A cultural understanding of Chinese immigrant mothers’ feeding practices. A qualitative study. Appetite 2014, 87, 160–167. [Google Scholar] [CrossRef]
- Gaffney, K.F.; Kitsantas, P.; Brito, A.; Swamidoss, C.S. Postpartum Depression, Infant Feeding Practices, and Infant Weight Gain at Six Months of Age. J. Pediatr. Health Care 2014, 28, 43–50. [Google Scholar] [CrossRef] [PubMed]
- Blissett, J.; Farrow, C. Predictors of maternal control of feeding at 1 and 2 years of age. Int. J. Obes. 2007, 31, 1520–1526. [Google Scholar] [CrossRef] [PubMed]
- Brown, A.; Lee, M. Breastfeeding Is Associated with a Maternal Feeding Style Low in Control from Birth. PLoS ONE 2013, 8, e54229. [Google Scholar] [CrossRef] [PubMed]
- Salonen, A.; Kaunonen, M.; Astedt-Kurki, P.; Isoaho, H.; Järvenpää, A.-L.; Tarkka, M.-T. Parenting self-efficacy after childbirth. J. Adv. Nurs. 2009, 65, 2324–2336. [Google Scholar] [CrossRef] [PubMed]
- Birch, L.L.; Fisher, J.; Grimm-Thomas, K.; Markey, C.; Sawyer, R.; Johnson, S. Confirmatory factor analysis of the Child Feeding Questionnaire: A measure of parental attitudes, beliefs and practices about child feeding and obesity proneness. Appetite 2001, 36, 201–210. [Google Scholar] [CrossRef] [PubMed]
- Wardle, J.; Guthrie, C.A.; Sanderson, S.; Rapoport, L. Development of the children’s eating behaviour questionnaire. J. Child Psychol. Psychiatry Allied Discip. 2001, 42, 963–970. [Google Scholar] [CrossRef] [PubMed]
- Beck, C.T. The effects of postpartum depression on maternal-infant interaction: A meta-analysis. Nurs. Res. 1995, 44, 299–305. [Google Scholar] [CrossRef]
- Moksony, F. Small is beautiful. The use and interpretation of R2 in social research. Szociol. Szemle 1990, 130–138. [Google Scholar]
- Chang, M.; Kuo, C.; Chiang, K. The effects of pre-pregnancy body mass index and gestational weight gain on neonatal birth weight in Taiwan. Int. J. Nurs. Midwifery 2010, 2, 28–34. [Google Scholar]
- Hung, T.-H.; Hung, T.-H. Pregestational body mass index, gestational weight gain, and risks for adverse pregnancy outcomes among Taiwanese women: A retrospective cohort study. Taiwan. J. Obstet. Gynecol. 2016, 55, 575–581. [Google Scholar] [CrossRef] [PubMed]
- Chang, P.-C.; Li, S.-F.; Yang, H.-Y.; Wang, L.-C.; Weng, C.-Y.; Chen, K.-F.; Chen, W.; Fan, S.-Y. Factors associated with cessation of exclusive breastfeeding at 1 and 2 months postpartum in Taiwan. Int. Breastfeed. J. 2019, 14, 18. [Google Scholar] [CrossRef] [PubMed]


| Measurement Time Points | Variables |
|---|---|
| During pregnancy | Age, educational level, family socio-economic status, parity, and maternal pre-pregnancy body mass index |
| 1-month postpartum | Gestational age at birth, mode of delivery, breastfeeding status, maternal depressive symptoms, infant gender, birth weight, and birth length |
| 3-month postpartum | Infant body weight and length at 3 months, responsive feeding |
| Items | Mean ± SD | Factor Loading | |
|---|---|---|---|
| Unforced Feeding | Feeding on Demand | ||
| 1. If the baby did not eat enough, you would feel depressed a | 2.60 ± 1.32 | 0.82 | 0.04 |
| 2. Worry about the baby not eating enough a | 2.84 ± 1.24 | 0.76 | −0.10 |
| 3. When you see other babies at the same age weighing more than your baby, you feel that your baby’s weighing less is your responsibility a | 3.40 ± 1.05 | 0.66 | −0.01 |
| 4. Feeding is like a fight a | 3.31 ± 0.94 | 0.58 | 0.04 |
| 5. When the baby is not willing to eat, you still continue feeding a | 3.19 ± 1.00 | 0.45 | 0.33 |
| 6. You will feed more to make sure the baby is full a | 3.45 ± 0.91 | 0.32 | −0.05 |
| 7. Whenever the baby wants to eat, you feed him/her | 2.91 ± 1.25 | −0.13 | 0.72 |
| 8. You only feed the baby at the fixed time a | 1.75 ± 1.46 | −0.02 | 0.75 |
| 9. Even if the baby is not hungry, you will feed him/her according to the scheduled time a | 2.69 ± 1.34 | 0.43 | 0.61 |
| 10. You would let the baby decide when to eat and finish | 2.59 ± 1.41 | −0.06 | 0.60 |
| Eigenvalue | 2.52 | 1.94 | |
| % of variance | 25.19 | 19.41 | |
| Variable | M ± SD or n (%) |
|---|---|
| Maternal age (years) | 33.3 ± 4.1 |
| ≤29 | 69 (15.8%) |
| 30–34 | 195 (44.5%) |
| ≥35 | 174 (39.7%) |
| Spousal age (years) | 35.7 ± 10.8 |
| ≤29 | 52 (11.9%) |
| 30–40 | 361 (82.4%) |
| 41–50 | 25 (5.7%) |
| Educational level | |
| Senior high school or lower | 54 (12.3%) |
| University or higher | 384 (87.7%) |
| Family socio-economic status | |
| Low | 77 (17.6%) |
| Middle | 187 (42.7%) |
| High | 174 (39.7%) |
| Pre-pregnancy BMI | |
| Underweight | 70 (16.0%) |
| Normal | 302 (68.9%) |
| Overweight | 49 (11.2%) |
| Obesity | 17 (3.9%) |
| Parity | |
| Primipara | 247 (56.4%) |
| Multipara | 191 (43.6%) |
| Delivery method | |
| Vaginal delivery | 301 (68.7%) |
| Cesarean delivery | 137 (31.3%) |
| Gestational age at birth | |
| 32–36 weeks | 23 (5.3%) |
| ≥37 weeks | 415 (94.7%) |
| Breastfeeding status at 1 month postpartum | |
| Exclusive breastfeeding | 196 (44.7%) |
| Partial breastfeeding | 190 (43.4%) |
| Formula feeding | 52 (11.9%) |
| Maternal depressive symptoms at 1 month postpartum | |
| No | 316 (72.1%) |
| Yes | 122 (27.9%) |
| Infant gender | |
| Male | 236 (53.9%) |
| Female | 202 (46.1%) |
| Infant weight-for-length at birth | |
| Underweight | 22 (5.0%) |
| Normal | 415 (94.7%) |
| Overweight | 1 (0.2%) |
| Infant weight-for-length at 3 months | |
| Underweight | 14 (3.2%) |
| Normal | 395 (90.2%) |
| Overweight | 29 (6.6%) |
| Infant at-birth to 3 months WLZ scores | |
| No change | 372 (84.9%) |
| Increase but in normal range | 22 (5.0%) |
| Increase to overweight | 29 (6.6%) |
| Decrease to underweight | 15 (3.4%) |
| Variables | Mean (SD) | t/F | p | Post Hoc Tests |
|---|---|---|---|---|
| Maternal ages (years) | 4.29 * | 0.01 | “≤29” > “30–34” * | |
| ≤29 | 30.62 (5.15) | “≤29” > “≥35” * | ||
| 30–34 | 28.35 (5.76) | |||
| ≥35 | 28.41 (6.18) | |||
| Family socio-economic status | 1.98 | 0.14 | - | |
| Low | 29.86 (5.22) | |||
| Middle | 28.71 (6.08) | |||
| High | 28.26 (5.91) | |||
| Parity | 3.67 * | <0.01 * | - | |
| Primipara | 27.84 (5.59) | |||
| Multipara | 29.89 (6.07) | |||
| Pre-pregnancy BMI | 1.41 | 0.24 | - | |
| Underweight | 27.67 (6.06) | |||
| Normal | 28.80 (5.94) | |||
| Overweight | 29.20 (5.12) | |||
| Obesity | 30.53 (5.96) | |||
| Delivery method | −0.31 | 0.76 | - | |
| Vaginal birth | 28.67 (5.79) | |||
| Cesarean birth | 28.86 (6.11) | |||
| Gestational age at birth | 0.14 | - | ||
| 32–36 weeks | 26.96 (4.28) | −1.49 | ||
| ≥37 weeks | 28.83 (5.95) | |||
| Breastfeeding status at 1 month postpartum | 13.57 * | <0.01 * | Exclusive > Partial * Exclusive > Formula * | |
| Exclusive breastfeeding | 30.30 (5.71) | |||
| Partial breastfeeding | 27.60 (5.79) | |||
| Formula | 26.96 (5.50) | |||
| Maternal depressive symptoms at 1 month postpartum | 3.91 * | <0.01 * | - | |
| Yes | 26.99 (5.95) | |||
| No | 29.41 (5.73) | |||
| Infant gender | 0.61 | 0.14 | - | |
| Male | 28.35 (5.93) | |||
| Female | 29.18 (5.82) | |||
| Infant growth status from birth to 3 months | 6.08 * | <0.01 * | I > IV * II > IV * | |
| No change (I) | 28.81 (5.81) | III > IV * | ||
| Increase but in normal range (II) | 28.41 (5.36) | |||
| Increase to overweight (III) | 30.90 (5.56) | |||
| Decrease to underweight (IV) | 23.13 (6.12) |
| Variables | β (95% CI) | p Value |
|---|---|---|
| Maternal age (years) | ||
| ≤29 | 0.16 (1.99, 4.14) | <0.01 * |
| 30–34 | 0.01 (−1.05, 1.26) | 0.86 |
| ≥35 | 1 | |
| Parity | ||
| Primipara | −0.14 (−2.75, −0.57) | <0.01 * |
| Multipara | 1 | |
| Breastfeeding status at 1 month postpartum | ||
| Excusive breastfeeding | 0.22 (0.84, 4.29) | <0.01 * |
| Partial breastfeeding | 0.04 (−1.24, 2.19) | 0.58 |
| Formula feeding | 1 | |
| Maternal depressive symptoms at 1 month postpartum | −0.14 (−3.04, −0.69) | <0.01 * |
| Infant growth—birth to 3 months | ||
| No change | 1 | |
| Increase but in normal range | −0.01 (−2.74, 2.01) | 0.76 |
| Increase to overweight | 0.08 (−0.24, 3.95) | 0.08 |
| Decrease to underweight | −0.12 (−7.10, −1.18) | <0.01 * |
© 2020 by the authors. Licensee MDPI, Basel, Switzerland. This article is an open access article distributed under the terms and conditions of the Creative Commons Attribution (CC BY) license (http://creativecommons.org/licenses/by/4.0/).
Share and Cite
Chen, T.-L.; Chen, Y.-Y.; Lin, C.-L.; Peng, F.-S.; Chien, L.-Y. Responsive Feeding, Infant Growth, and Postpartum Depressive Symptoms during 3 Months Postpartum. Nutrients 2020, 12, 1766. https://doi.org/10.3390/nu12061766
Chen T-L, Chen Y-Y, Lin C-L, Peng F-S, Chien L-Y. Responsive Feeding, Infant Growth, and Postpartum Depressive Symptoms during 3 Months Postpartum. Nutrients. 2020; 12(6):1766. https://doi.org/10.3390/nu12061766
Chicago/Turabian StyleChen, Tzu-Ling, Yi-Ying Chen, Chen-Li Lin, Fu-Shiang Peng, and Li-Yin Chien. 2020. "Responsive Feeding, Infant Growth, and Postpartum Depressive Symptoms during 3 Months Postpartum" Nutrients 12, no. 6: 1766. https://doi.org/10.3390/nu12061766
APA StyleChen, T.-L., Chen, Y.-Y., Lin, C.-L., Peng, F.-S., & Chien, L.-Y. (2020). Responsive Feeding, Infant Growth, and Postpartum Depressive Symptoms during 3 Months Postpartum. Nutrients, 12(6), 1766. https://doi.org/10.3390/nu12061766