Eveningness in Energy Intake among Adolescents with Implication on Anthropometric Indicators of Nutritional Status: The CRO-PALS Longitudinal Study

 ,
,  and
and 
Abstract

1. Introduction
2. Materials and Methods
2.1. Subjects
2.2. Assessment of Diet
- (1)
- Generating a working list of consumed food;
- (2)
- Updating the list that the respondent subsequently recalled;
- (3)
- Specifying the time and circumstances of the meal;
- (4)
- Asking for more detailed information on consumed food and beverages;
- (5)
- Final verification of the collected data.
2.3. Definition of Eveningness in Energy Intake
2.4. Anthropometric Data
- Triceps—At the back of the upper arm, halfway between the acromion process and the olecranon process;
- Biceps—At the front of the upper arm; at the same level as the triceps;
- Subscapular—About 2 cm below the lower angle of the scapula: a diagonal fold;
- Suprailiac—At the iliac crest; in anterior axillary line plane.
2.5. Physical Activity
2.6. Statistical Analysis
3. Results
4. Discussion
5. Conclusions
Supplementary Materials
Author Contributions
Funding
Acknowledgments
Conflicts of Interest
References
- Han, J.C.; Lawlor, D.A.; Kimm, S.Y.S. Childhood Obesity-2010: Progress and Challenges. Lancet 2010, 375, 1737–1748. [Google Scholar] [CrossRef]
- NCD Risk Factor Collaboration (NCD-RisC). Worldwide trends in body-mass index, underweight, overweight, and obesity from 1975 to 2016: A pooled analysis of 2416 population-based measurement studies in 128·9 million children, adolescents, and adults. Lancet 2017, 390, 2627–2642. [Google Scholar] [CrossRef]
- Singh, A.S.; Mulder, C.; Twisk, J.W.; van Mechelen, W.; Chinapaw, M.J. Tracking of childhood overweight into adulthood: A systematic review of the literature. Obes. Rev. 2008, 9, 474–488. [Google Scholar] [CrossRef] [PubMed]
- Spalding, K.L.; Arner, E.; Westermark, P.O.; Bernard, S.; Buchholz, B.A.; Bergmann, O.; Blomqvist, L.; Hoffstedt, J.; Näslund, E.; Britton, T.; et al. Dynamics of fat cell turnover in humans. Nature 2008, 453, 783–787. [Google Scholar] [CrossRef]
- Hill, J.O.; Wyatt, H.R.; Peters, J.C. Energy Balance and Obesity. Circulation 2012, 126, 126–132. [Google Scholar] [CrossRef]
- Huseinovic, E.; Winkvist, A.; Freisling, H.; Slimani, N.; Boeing, H.; Buckland, G.; Schwingshackl, L.; Olsen, A.; Tjønneland, A.; Stepien, M.; et al. Timing of eating across ten European countries - results from the European Prospective Investigation into Cancer and Nutrition (EPIC) calibration study. Public Health Nutr. 2019, 22, 324–335. [Google Scholar] [CrossRef]
- Almoosawi, S.; Vingeliene, S.; Karagounis, L.G.; Pot, G.K. Chrono-nutrition: A review of current evidence from observational studies on global trends in time-of-day of energy intake and its association with obesity. Proc. Nutr. Soc. 2016, 75, 487–500. [Google Scholar] [CrossRef]
- Lopez-Minguez, J.; Gómez-Abellán, P.; Garaulet, M. Timing of Breakfast, Lunch, and Dinner. Effects on Obesity and Metabolic Risk. Nutrients 2019, 11, 2624–2638. [Google Scholar] [CrossRef]
- Berg, C.; Lappas, G.; Wolk, A.; Strandhagen, E.; Torén, K.; Rosengren, A.; Thelle, D.; Lissner, L. Eating patterns and portion size associated with obesity in a Swedish population. Appetite 2009, 52, 21–26. [Google Scholar] [CrossRef]
- Kutsuma, A.; Nakajima, K.; Suwa, K. Potential association between breakfast skipping and concomitant late-night-dinner eating with metabolic syndrome and proteinuria in the Japanese population. Scientifica 2014, 2014, 1–9. [Google Scholar] [CrossRef]
- de Casto, J.M. The Time of Day of Food Intake Influences Overall Intake in Humans. J. Nutr. 2004, 134, 104–111. [Google Scholar] [CrossRef] [PubMed]
- Diederichs, T.; Perrar, I.; Roßbach, S.; Alexy, U.; Buyken, A.E. In adolescence a higher ‘eveningness in energy intake’ is associated with higher total daily energy intake. Appetite 2018, 128, 159–166. [Google Scholar] [CrossRef] [PubMed]
- Almoosawi, S.; Winter, J.; Prynne, C.J.; Hardy, R.; Stephen, A.M. Daily profiles of energy and nutrient intakes: Are eating profiles changing over time? Eur. J. Clin. Nutr. 2012, 66, 678–686. [Google Scholar] [CrossRef]
- Roßbach, S.; Diederichs, T.; Nöthlings, U.; Buyken, A.E.; Alexy, U. Relevance of chronotype for eating patterns in adolescents. Chronobiol. Int. 2017, 35, 336–347. [Google Scholar] [CrossRef] [PubMed]
- Moshfegh, A.J.; Rhodes, D.G.; Baer, D.J.; Murayi, T.; Clemens, J.C.; Rumpler, W.V.; Paul, D.R.; Sebastian, R.S.; Kuczynski, K.J.; Ingwersen, L.A.; et al. The US Department of Agriculture Automated Multiple-Pass Method reduces bias in the collection of energy intakes. Am. J. Clin. Nutr. 2008, 88, 324–332. [Google Scholar] [CrossRef] [PubMed]
- Tabacchi, G.; Garbagnati, F.; Wijnhoven, T.M.A.; Cairella, G.; SINU Working Group on Nutritional Surveillance in Adolescents. Dietary assessment methods in surveillance systems targeted to adolescents: A review of the literature. Nutr. Metab. Cardiovasc. Dis. 2019, 29, 761–774. [Google Scholar] [CrossRef]
- Senta, A.; Pucarin-Cvetković, J.; Jelinić, J.D. Quantitative Models of Food and Meals. Postgraduate Student Manual; Medicinska Naklada: Zagreb, Croatia, 1990. [Google Scholar]
- Kaić-Rak, A.; Antonić, K. Tablice O Sastavu Namirnica I Pića; Zavod za Zaštitu Zdravlja SR Hrvatske: Zagreb, Croatia, 1990. [Google Scholar]
- FoodData Central. Available online: https://fdc.nal.usda.gov/ (accessed on 30 March 2020).
- DTU Food Composition Data. Available online: http://www.foodcomp.dk/ (accessed on 30 March 2020).
- Vučetić, M. Velika Knjiga Kuharstva, 2nd ed.; EPH Media: Zagreb, Croatia, 2013; ISBN 978-953-338-110-7. [Google Scholar]
- Jureša, V.; Tiljak, K.M.; Musil, V. Croatian Anthropometric Reference Values for School Children and Youth Body Height, Body Weight, Body Mass Index, Waist Circumference, Hip Circumference, 2nd ed.; University of Zagreb, School of Medicine, Andrija Štampar School of Public Health: Zagreb, Croatia, 2014; ISBN 978-953-6255-50-4. [Google Scholar]
- Lohman, T.G.; Hingle, M.; Going, S.B. Body composition in children. Pediatr. Exerc. Sci. 2013, 25, 573–590. [Google Scholar] [CrossRef]
- Wong, S.L.; Leatherdale, S.T.; Manske, S.R. Reliability and validity of a school-based physical activity questionnaire. Med. Sci. Sports Exerc. 2006, 38, 1593–1600. [Google Scholar] [CrossRef]
- Garcia, T.P.; Marder, K. Statistical Approaches to Longitudinal Data Analysis in Neurodegenerative Diseases: Huntington’s Disease as a Model. Curr. Neurol. Neurosci. Rep. 2017, 17, 14. [Google Scholar] [CrossRef]
- Eurostat. Population on 1 January by Age Group and Sex. Available online: https://appsso.eurostat.ec.europa.eu/nui/submitViewTableAction.do (accessed on 3 April 2020).
- Mathias, K.C.; Almoosawi, S.; Karagounis, L.G. Protein and Energy Intakes Are Skewed toward the Evening among Children and Adolescents in the United States: NHANES 2013– 2014. J. Nutr. 2017, 147, 1160–1166. [Google Scholar] [CrossRef]
- Bo, S.; Musso, G.; Beccuti, G.; Fadda, M.; Fedele, D.; Gambino, R.; Gentile, L.; Durazzo, M.; Ghigo, E.; Cassad, M. Consuming More of Daily Caloric Intake at Dinner Predisposes to Obesity. A 6-Year Population-Based Prospective Cohort Study. PLoS ONE 2014, 9, e108467. [Google Scholar] [CrossRef] [PubMed]
- Arora, T.; Taheri, S. Associations among late chronotype, body mass index and dietary behaviors in young adolescents. Int. J. Obes. 2015, 39, 39–44. [Google Scholar] [CrossRef] [PubMed]
- Anothaisintawee, T.; Lertrattananon, D.; Thamakaison, S.; Thakkinstian, A.; Reutrakul, S. The Relationship Among Morningness-Eveningness, Sleep Duration, Social Jetlag, and Body Mass Index in Asian Patients With Prediabetes. Front. Endocrinol. 2018, 9, 435. [Google Scholar] [CrossRef] [PubMed]
- Siervogel, R.M.; Demerath, E.W.; Schubert, C.; Remsberg, K.E.; Chumlea, W.C.; Sun, S.; Czerwinski, S.A.; Towne, B. Puberty and body composition. Horm. Res. 2003, 60, 36–45. [Google Scholar] [CrossRef] [PubMed]
- Haas, G.-M.; Liepold, E.; Schwandt, P. Percentile curves for fat patterning in German adolescents. World J. Pediatr. 2010, 7, 16–23. [Google Scholar] [CrossRef] [PubMed]
- Klimek-Piotrowska, W.; Koziej, M.; Hołda, M.K.; Piątek, K.; Wszołek, K.; Tyszka, A.; Kmiotek, E.; Pliczko, M.; Śliwińska, A.; Krauss, K.; et al. Anthropometry and body composition of adolescents in Cracow, Poland. PLoS ONE 2015, 10, e0122274. [Google Scholar] [CrossRef]
- Henriksson, P.; Cuenca-García, M.; Labayen, I.; Esteban-Cornejo, I.; Henriksson, H.; Kersting, M.; Vanhelst, J.; Widhalm, K.; Gottrand, F.; Moreno, L.A.; et al. Diet quality and attention capacity in European adolescents: The Healthy Lifestyle in Europe by Nutrition in Adolescence (HELENA) study. Br. J. Nutr. 2017, 117, 1587–1595. [Google Scholar] [CrossRef]
- Wong, J.E.; Parnell, W.R.; Howe, A.S.; Lubransky, A.C.; Black, K.E.; Skidmore, P.M. Diet quality is associated with measures of body fat in adolescents from Otago, New Zealand. Public Health Nutr. 2015, 18, 1453–1460. [Google Scholar] [CrossRef]
- Levine, M.P.; Smolak, L. Body Image: Development in Adolescence. In Body Image: A Handbook of Theory, Research, and Clinical Practice; Cash, T.F., Pruzinsky, T., Eds.; The Guilford Press: New York, NY, USA, 2002; pp. 74–82. ISBN 1-57230-777-3. [Google Scholar]
- Sila, S.; Ilić, A.; Mišigoj-Duraković, M.; Sorić, M.; Radman, I.; Šatalić, Z. Obesity in Adolescents Who Skip Breakfast Is Not Associated with Physical Activity. Nutrients 2019, 11, 2511–2521. [Google Scholar] [CrossRef]
- Ramires, V.V.; Dumith, S.C.; Wehrmeister, F.C.; Hallal, P.C.; Menezes, A.M.B.; Gonçalves, H. Physical activity throughout adolescence and body composition at 18 years: 1993 Pelotas (Brazil) birth cohort study. Int. J. Behav. Nutr. Phys. Act. 2016, 13, 105–117. [Google Scholar] [CrossRef]
- Grochowska, E.; Kinal, A.; Sobek, Z.; Siatkowski, I.; Bednarczyk, M. Field study on the factors affecting egg weight loss, early embryonic mortality, hatchability, and chick mortality with the use of classification tree technique. Poult. Sci. 2019, 98, 3626–3636. [Google Scholar] [CrossRef] [PubMed]
- Grochowska, E.; Piwczyński, D.; Portolano, B.; Mroczkowski, S. Analysis of the influence of the PrP genotype on the litter size in Polish sheep using classification trees and logistic regression. Livest. Sci. 2014, 159, 11–17. [Google Scholar] [CrossRef]
- Feldman, D.; Gross, S. Mortgage default: Classification trees analysis. J. Real Estate Finan Econ. 2005, 30, 369–396. [Google Scholar] [CrossRef]
- Abu-Hanna, A.; de Keizer, N. Integrating classification trees with local logistic regression in intensive care prognosis. Artif. Intell. Med. 2003, 29, 5–23. [Google Scholar] [CrossRef]
- Austin, P.C. A comparison of regression trees, logistic regression, generalized additive models, and multivariate adaptive regression splines for predicting AMI mortality. Stat. Med. 2007, 26, 2937–2957. [Google Scholar] [CrossRef]
- Lee, R.D.; Nieman, D.C. Nutritional Assessment, 6th ed.; McGraw-Hill: New York, NY, USA, 2013; pp. 74–108. ISBN 978-0-07-802133-6. [Google Scholar]
- Basiotis, P.P.; Welsh, S.O.; Cronin, F.J.; Kelsay, J.L.; Mertz, W. Number of days of food intake records required to estimate individual and group nutrient intakes with defined confidence. J. Nutr. 1987, 117, 1638–1641. [Google Scholar] [CrossRef]
- Poslusna, K.; Ruprich, J.; de Vries, J.H.; Jakubikova, M.; van’t Veer, P. Misreporting of energy and micronutrient intake estimated by food records and 24 h recalls, control and adjustment methods in practice. Br. J. Nutr. 2009, 101, 73–85. [Google Scholar] [CrossRef]
- Foster, E.; Bradley, J. Methodological considerations and future insights for 24-h dietary recall assessment in children. Nutr. Res. 2018, 51, 1–11. [Google Scholar] [CrossRef]
- Crawford, P.B.; Obarzanek, E.; Morrison, J.; Sabry, Z.I. Comparative advantage of 3day food records over 24-h recall and 5-day food frequency validated by observation of 9- and 10-year-old girls. J. Am. Diet. Assoc. 1994, 94, 626–630. [Google Scholar] [CrossRef]
- McNutt, S.; Hall, J.; Cranston, B.; Soto, B.; Hults, S. The 24-h dietary recall data collection and coding methodology implemented for the 1999-2000 National Health and Nutrition Examination Survey. FASEB J. 2000, 14, A759. [Google Scholar]
- Zerón-Rugerio, M.F.; Hernáez, Á.; Porras-Loaiza, A.P.; Cambras, T.; Izquierdo-Pulido, M. Eating Jet Lag: A Marker of the Variability in Meal Timing and Its Association with Body Mass Index. Nutrients 2019, 11, 2980–2991. [Google Scholar] [CrossRef] [PubMed]
- Haines, P.S.; Hama, M.Y.; Guilke, D.K.; Popkin, B.M. Weekend eating in the United States is linked with greater energy, fat, and alcohol intake. Obes. Res. 2003, 11, 945–949. [Google Scholar] [CrossRef] [PubMed]


| Age/Gender | Whole Population | Male | Female |
|---|---|---|---|
| 15–16 years | |||
| Age/years | 15.6 (14.4, 16.9) | 15.6 (15.0, 16.9) | 15.6 (14.4, 16.9) |
| 18–19 years | |||
| Age/years | 18.6 (17.2, 19.9) | 18.6 (17.2, 19.9) | 18.5 (17.2, 19.9) |
| Nutritional Status | BMI Percentile Cut-Off Points (kgm−2) |
|---|---|
| Underweight | <5th percentile |
| Normal weight | ≥5th percentile <85th percentile |
| Overweight | ≥85th percentile <95th percentile |
| Obese | ≥95th percentile |
| 15–16 Years | 18–19 Years | |||||
|---|---|---|---|---|---|---|
| Energy Intake/kcal | Whole Population | Male | Female | Whole Population | Male | Female |
| Total daily energy intake (TDEI) | 1908 (1409; 2616) | 2381 (1815; 3083) | 1545 (1193; 2038) | 1919 (1363; 2740) | 2582 (1909; 3248) | 1508 (1196; 1980) |
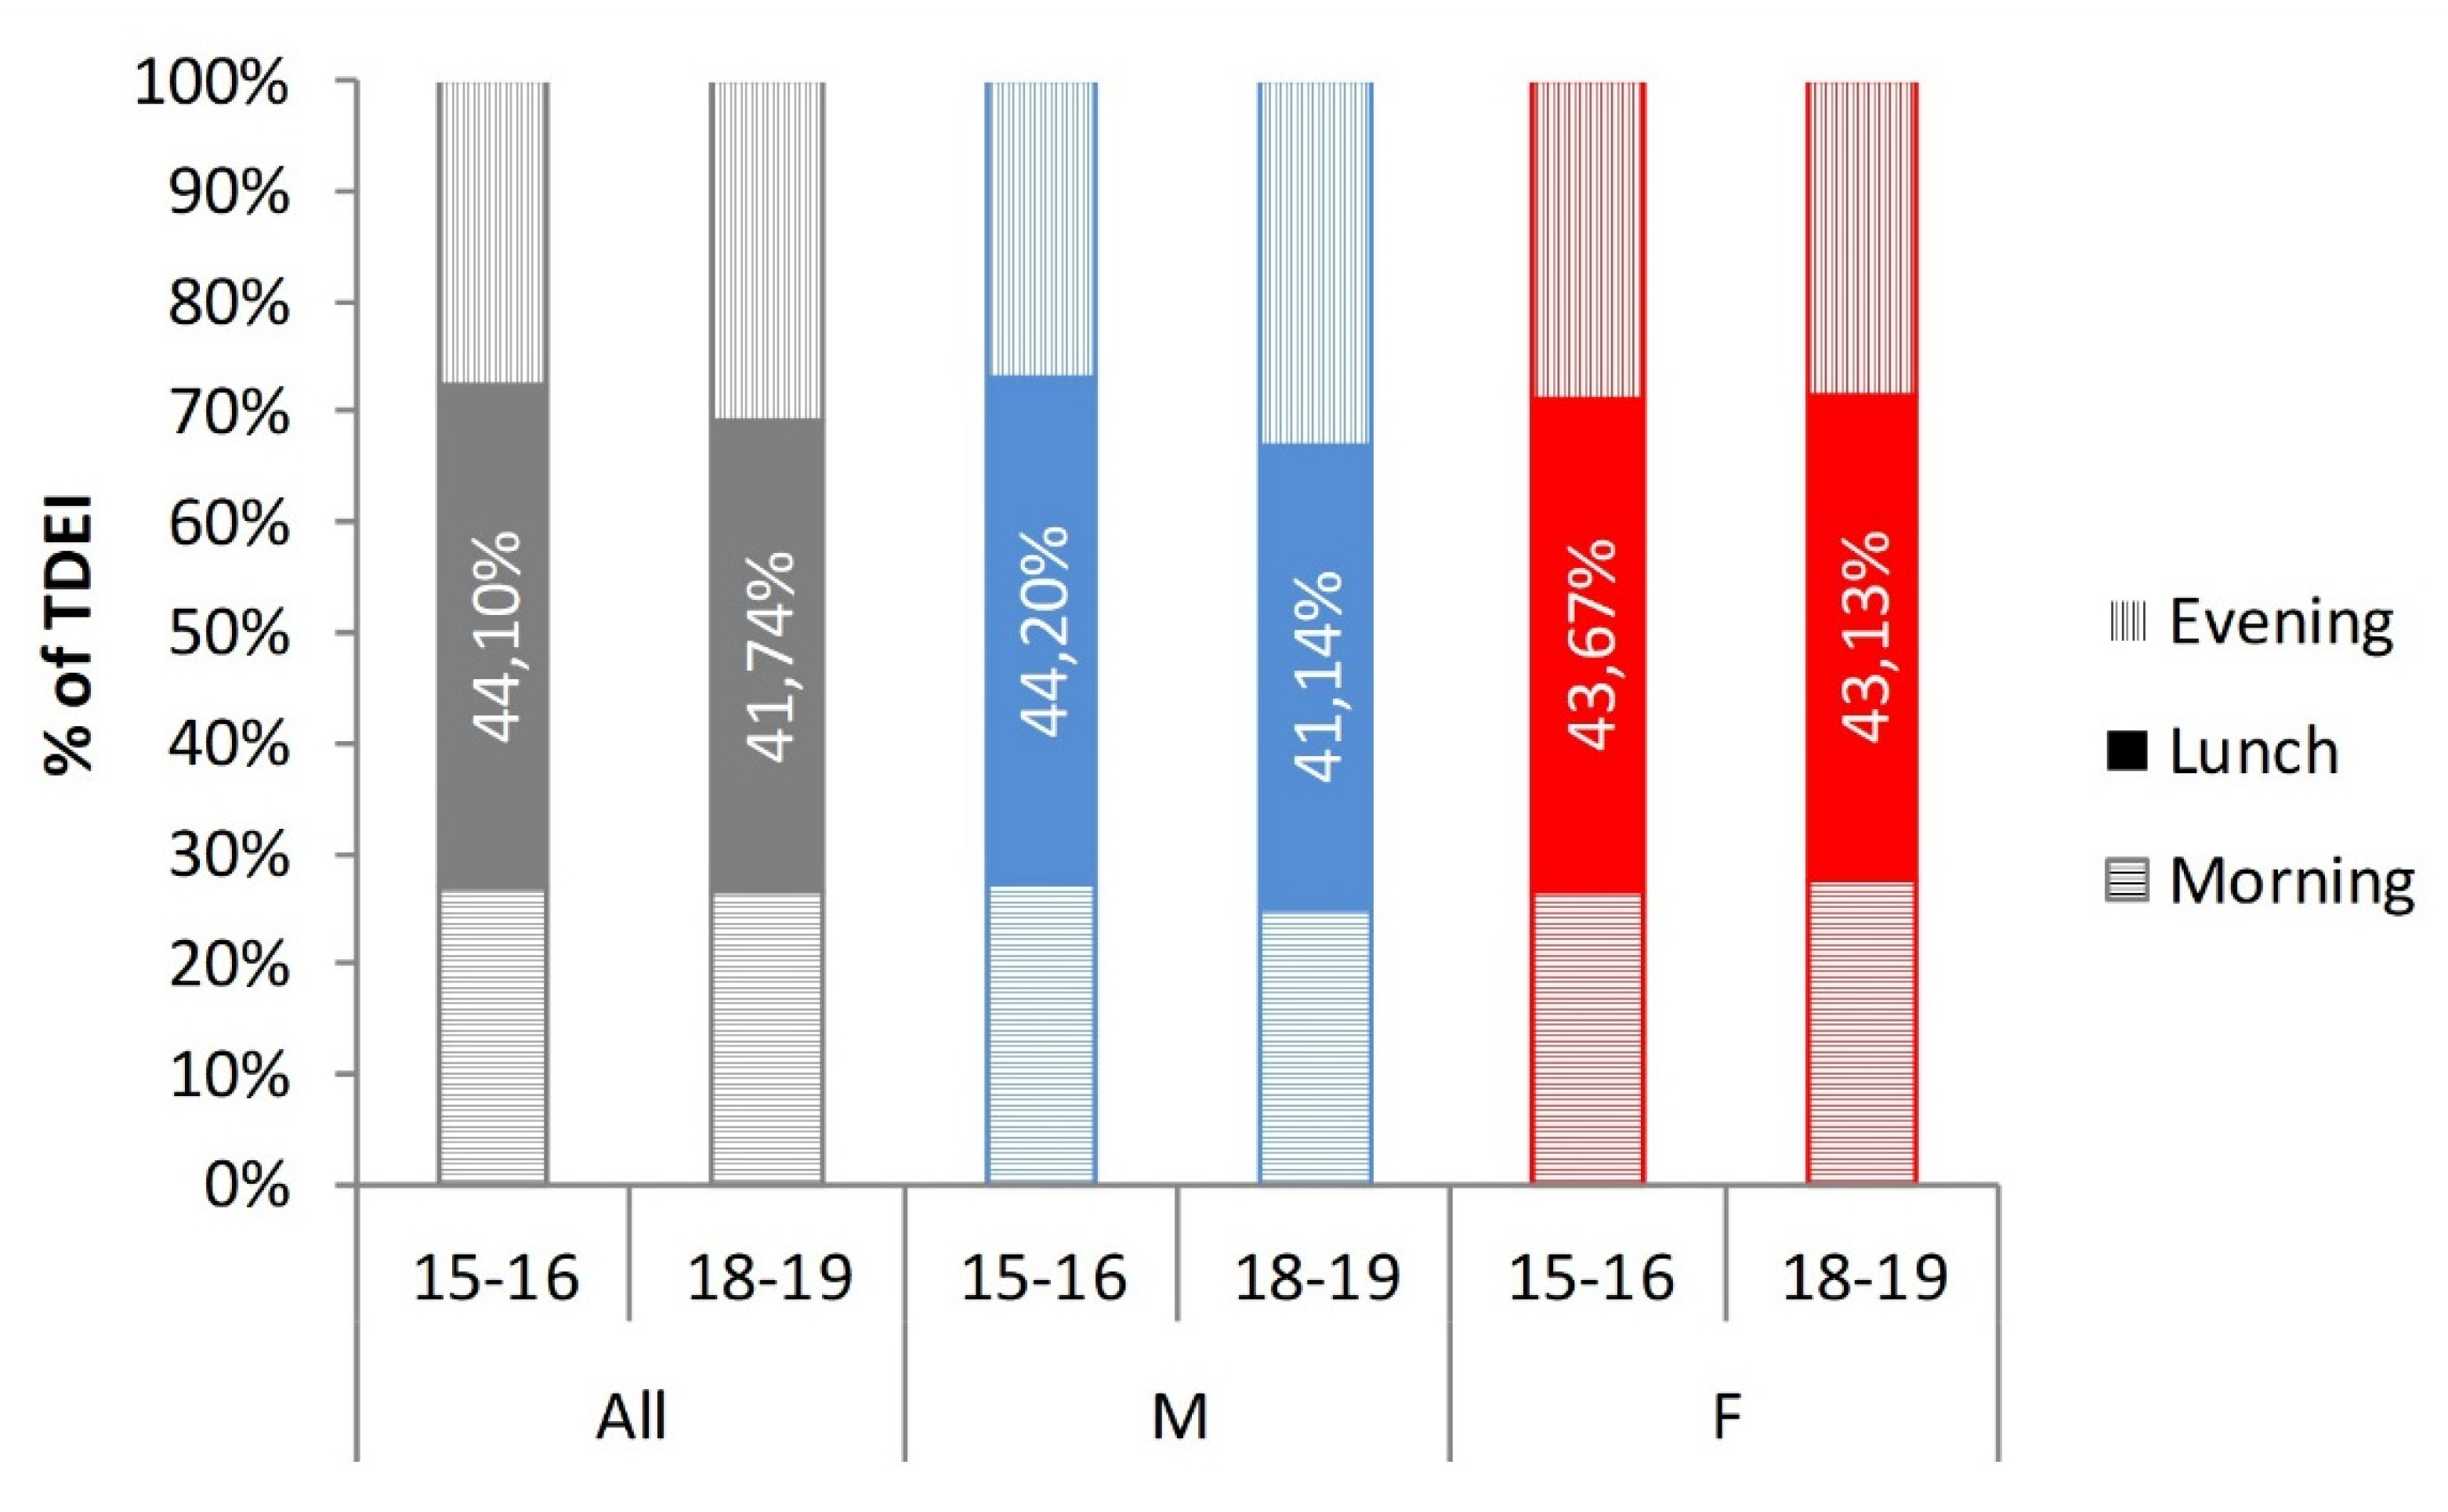
| Morning energy intake | 495 (283; 792) | 625 (363; 947) | 409 (230; 618) | 475 (305; 753) | 596 (356; 900) | 395 (279; 594) |
| (% of TDEI) | 26.2 (16.5; 37.5) | 26.2 (18.0; 37.3) | 26.0 (16.1; 37.6) | 25.9 (16.1; 35.6) | 24.2 (15.6; 33.7) | 27.4 (17.2; 37.9) |
| Evening energy intake | 508 (300; 869) | 619 (369; 1040) | 424 (267; 668) | 567 (320; 940) | 769 (471; 1177) | 435 (242; 645) |
| (% of TDEI) | 27.0 (17.8; 40.7) | 26.0 (17.8; 39.4) | 28.2 (17.3; 42.4) | 30.2 (19.8; 41.4) | 32.1 (22.4; 44.0) | 28.2 (17.9; 39.2) |
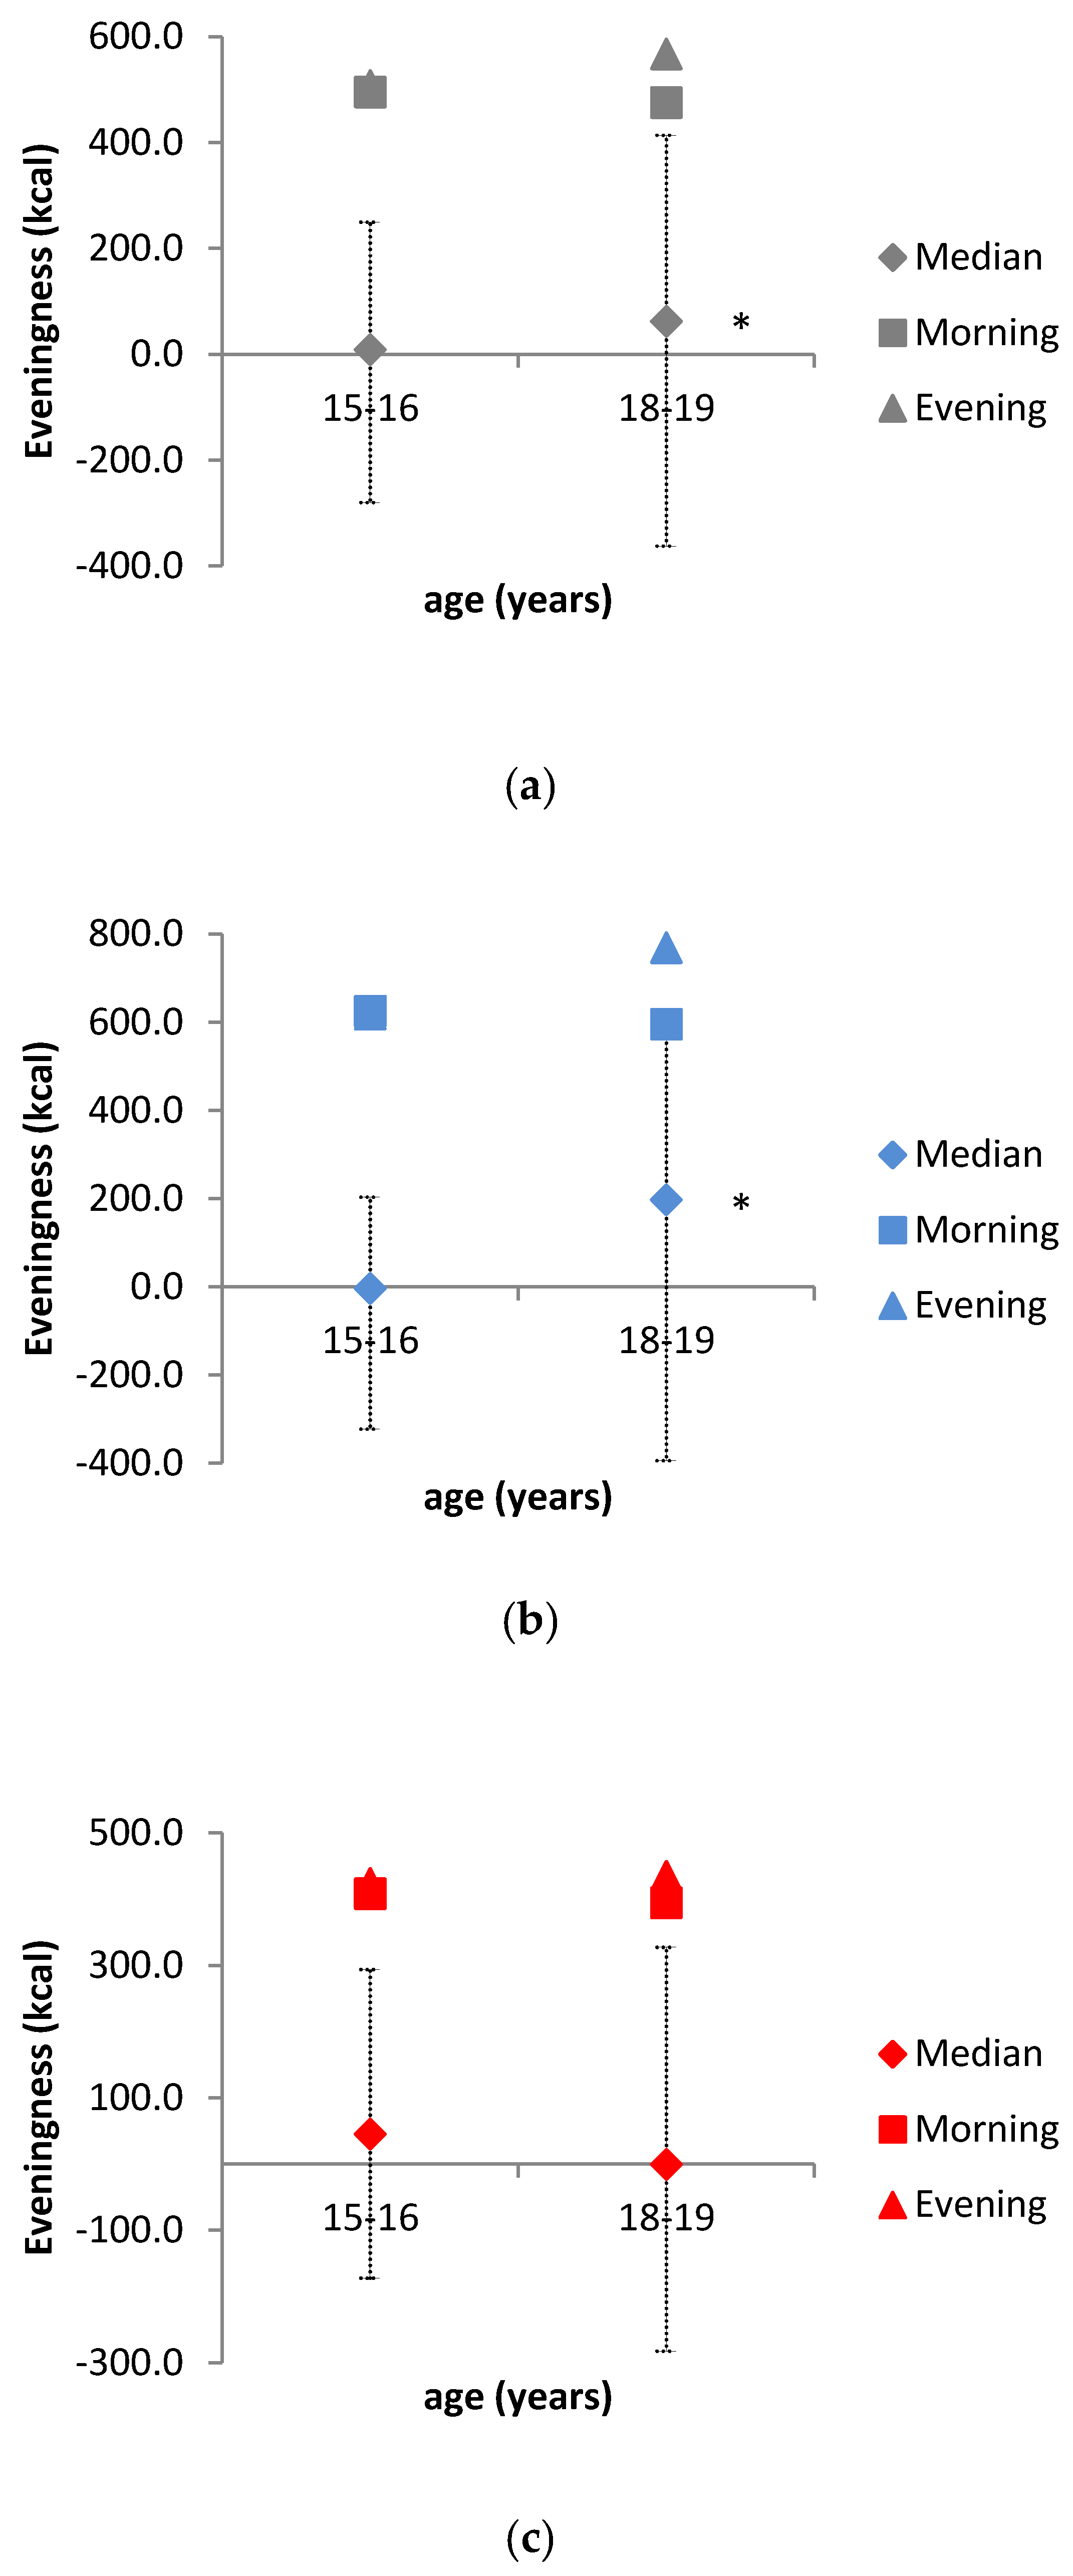
| Eveningness in energy intake * | 9 (−289; 351) | −3 (−319; 381) | 46 (−218; 327) | 62 (−241; 425) | 198 (−207; 592) | 0 (−248; 282) |
| 15–16 Years | 18–19 Years | |||||
|---|---|---|---|---|---|---|
| Anthropometric Data | Whole Population | Male | Female | Whole Population | Male | Female |
| BMI/kgm−2 | 21.0 (19.2; 23.2) | 20.9 (19.2; 23.0) | 21.1 (19.2; 23.4) | 21.9 (20.1; 23.9) | 22.2 (20.4; 24.3) | 21.6 (19.6; 23.3) |
| % overweight | / | 5.6 (25.27) | 10.5 (24.19) | / | 6.9 (26.46) | 10.2 (24.20) |
| % obese | / | 6.0 (28.72) | 5.2 (26.89) | / | 4.0 (29.52) | 6.6 (26.69) |
| WHR | 0.75 (0.72; 0.79) | 0.78 (0.76; 0.81) | 0.72 (0.69; 0.75) | 0.75 (0.71; 0.79) | 0.78 (0.76; 0.81) | 0.71 (0.69; 0.74) |
| Sum of 4 skinfolds/mm | 39.1 (29.5; 54.1) | 30.1 (25.6; 40.4) | 47.2 (37.9; 59.3) | 39.9 (30.5; 51.6) | 32.1 (26.7; 41.0) | 46.0 (38.6; 59.1) |
| Physical activity | ||||||
| AEEsd/kcalkg−1 | 8.1 (5.2; 13.1) | 9.5 (6.0; 14.1) | 7.3 (4.6; 11.8) | 7.0 (4.4; 11.2) | 8.2 (5.5; 12.3) | 5.9 (3.9; 9.6) |
© 2020 by the authors. Licensee MDPI, Basel, Switzerland. This article is an open access article distributed under the terms and conditions of the Creative Commons Attribution (CC BY) license (http://creativecommons.org/licenses/by/4.0/).
Share and Cite
Rešetar, J.; Pfeifer, D.; Mišigoj-Duraković, M.; Sorić, M.; Gajdoš Kljusurić, J.; Šatalić, Z. Eveningness in Energy Intake among Adolescents with Implication on Anthropometric Indicators of Nutritional Status: The CRO-PALS Longitudinal Study. Nutrients 2020, 12, 1710. https://doi.org/10.3390/nu12061710
Rešetar J, Pfeifer D, Mišigoj-Duraković M, Sorić M, Gajdoš Kljusurić J, Šatalić Z. Eveningness in Energy Intake among Adolescents with Implication on Anthropometric Indicators of Nutritional Status: The CRO-PALS Longitudinal Study. Nutrients. 2020; 12(6):1710. https://doi.org/10.3390/nu12061710
Chicago/Turabian StyleRešetar, Josip, Danijela Pfeifer, Marjeta Mišigoj-Duraković, Maroje Sorić, Jasenka Gajdoš Kljusurić, and Zvonimir Šatalić. 2020. "Eveningness in Energy Intake among Adolescents with Implication on Anthropometric Indicators of Nutritional Status: The CRO-PALS Longitudinal Study" Nutrients 12, no. 6: 1710. https://doi.org/10.3390/nu12061710
APA StyleRešetar, J., Pfeifer, D., Mišigoj-Duraković, M., Sorić, M., Gajdoš Kljusurić, J., & Šatalić, Z. (2020). Eveningness in Energy Intake among Adolescents with Implication on Anthropometric Indicators of Nutritional Status: The CRO-PALS Longitudinal Study. Nutrients, 12(6), 1710. https://doi.org/10.3390/nu12061710