Natural Magnesium-Enriched Deep-Sea Water Improves Insulin Resistance and the Lipid Profile of Prediabetic Adults: A Randomized, Double-Blinded Crossover Trial

Abstract
1. Introduction
2. Materials and Methods
2.1. Ethics
2.2. Subject
2.3. Preparation of Product (BDSW)
2.4. Method of Product Intake
2.5. Study Design
2.6. Statistical Analysis
3. Results
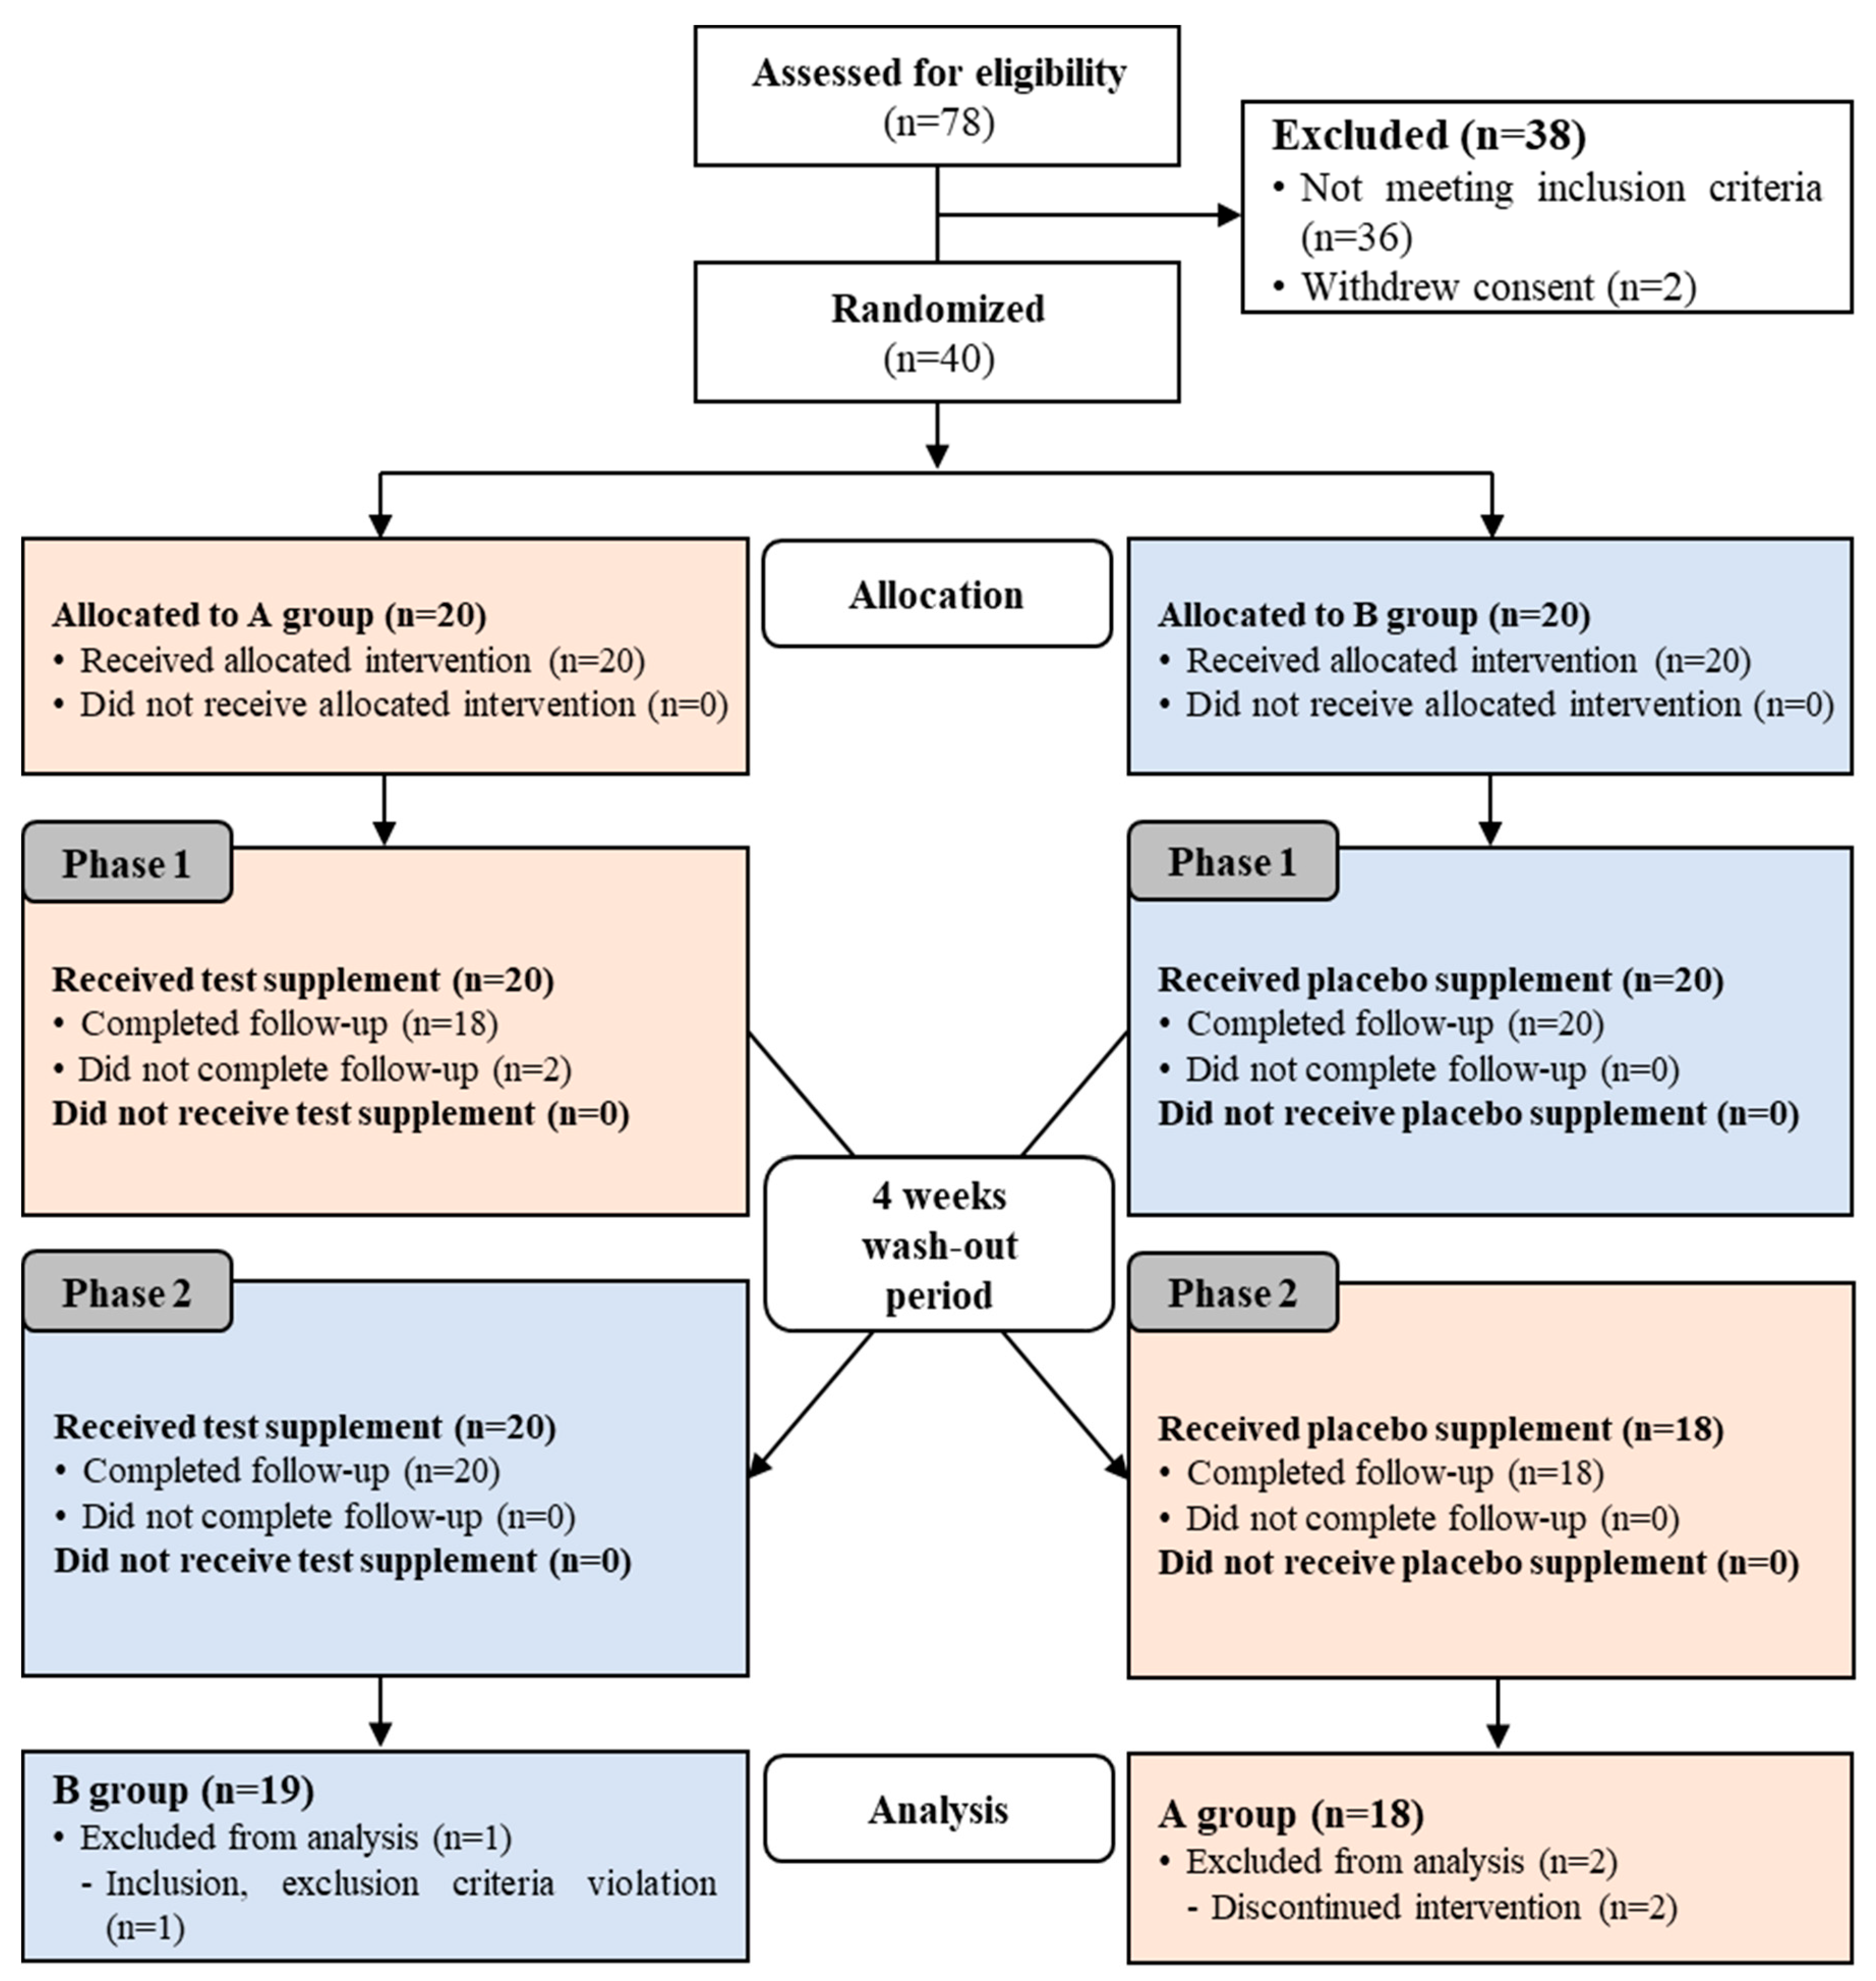
3.1. Subjects
3.2. Effects on Glycemic and Insulin-Sensitivity Parameters
3.3. Effect on Lipid Profiles
3.4. Dietary Intake Analysis
3.5. Safety Evaluation
4. Discussion
Supplementary Materials
Author Contributions
Funding
Conflicts of Interest
Appendix A


| Section/Topic | Item No | Checklist Item | Reported on Page No. |
|---|---|---|---|
| Title and abstract | |||
| 1a | Identification as a randomized trial in the title | 1 | |
| 1b | Structured summary of trial design, methods, results, and conclusions (for specific guidance see CONSORT for abstracts) | 1 | |
| Introduction | |||
| Background and objectives | 2a | Scientific background and explanation of the rationale | 1, 2 |
| 2b | Specific objectives or hypotheses | 2 | |
| Methods | |||
| Trial design | 3a | Description of trial design (such as parallel, factorial) including allocation ratio | 4, Figure A1 |
| 3b | Important changes to methods after trial commencement (such as eligibility criteria), with reasons | n/A | |
| Participants | 4a | Eligibility criteria for participants | 2, 3, Suppl. File 1 |
| 4b | Settings and locations where the data were collected | 2 | |
| Interventions | 5 | The interventions for each group with sufficient details to allow replication, including how and when they were actually administered | 2, 4, 5, Suppl. File 2 |
| Outcomes | 6a | Completely defined pre-specified primary and secondary outcome measures, including how and when they were assessed | 4, 5, Suppl. File 2 |
| 6b | Any changes to trial outcomes after the trial commenced, with reasons | n/A | |
| Sample size | 7a | How sample size was determined | 5, Figure A1 |
| 7b | When applicable, explanation of any interim analyses and stopping guidelines | n/A | |
| Randomization: | |||
| Sequence generation | 8a | Method used to generate the random allocation sequence | 4, Figure A1 |
| 8b | Type of randomization; details of any restriction (such as blocking and block size) | 4, Figure A1 | |
| Allocation concealment mechanism | 9 | Mechanism used to implement the random allocation sequence (such as sequentially numbered containers), describing any steps taken to conceal the sequence until interventions were assigned | 4 |
| Implementation | 10 | Who generated the random allocation sequence, who enrolled participants, and who assigned participants to interventions | 4 |
| Blinding | 11a | If done, who was blinded after assignment to interventions (for example, participants, care providers, those assessing outcomes) and how | 4 |
| 11b | If relevant, description of the similarity of interventions | n/A | |
| Statistical methods | 12a | Statistical methods used to compare groups for primary and secondary outcomes | 5 |
| 12b | Methods for additional analyses, such as subgroup analyses and adjusted analyses | 5 | |
| Results | |||
| Participant flow (a diagram is strongly recommended) | 13a | For each group, the numbers of participants who were randomly assigned, received intended treatment, and were analyzed for the primary outcome | 5, Figure A1 |
| 13b | For each group, losses and exclusions after randomization, together with reasons | 5, Figure A1 | |
| Recruitment | 14a | Dates defining the periods of recruitment and follow-up | Suppl. File 2 |
| 14b | Why the trial ended or was stopped | n/A | |
| Baseline data | 15 | A table showing baseline demographic and clinical characteristics for each group | Suppl. File 3, Table 3 |
| Numbers analyzed | 16 | For each group, number of participants (denominator) included in each analysis and whether the analysis was by original assigned groups | 5, Figure A1 |
| Outcomes and estimation | 17a | For each primary and secondary outcome, results for each group, and the estimated effect size and its precision (such as 95% confidence interval) | 5–8, Table 4, Table 5, and Table 6 |
| 17b | For binary outcomes, presentation of both absolute and relative effect sizes is recommended | n/A | |
| Ancillary analyses | 18 | Results of any other analyses performed, including subgroup analyses and adjusted analyses, distinguishing pre-specified from exploratory | n/A |
| Harms | 19 | All important harms or unintended effects in each group (for specific guidance see CONSORT for harms) | n/A |
| Discussion | |||
| Limitations | 20 | Trial limitations, addressing sources of potential bias, imprecision, and, if relevant, multiplicity of analyses | n/A |
| Generalizability | 21 | Generalizability (external validity, applicability) of the trial findings | 11, 12 |
| Interpretation | 22 | Interpretation consistent with results, balancing benefits and harms, and considering other relevant evidence | 11, 12 |
| Other information | |||
| Registration | 23 | Registration number and name of trial registry | 4 |
| Protocol | 24 | Where the full trial protocol can be accessed, if available | n/A |
| Funding | 25 | Sources of funding and other support (such as supply of drugs), role of funders | 12 |
References
- International Diabetes Federation. IDF Diabetes Atlas, 8th ed.; Artifex Creative Webnet Ltd.: London, UK, 2017; p. 6. [Google Scholar]
- Gardner, T.W.; Sundstrom, J.M. A proposal for early and personalized treatment of diabetic retinopathy based on clinical pathophysiology and molecular phenotyping. Vision Res. 2017, 139, 153–160. [Google Scholar] [CrossRef] [PubMed]
- Elgebaly, M.M.; Arreguin, J.; Storke, N. Targets, treatments, and outcomes updates in diabetic stroke. J. Stroke Cerebrovasc. Dis. 2019, 28, 1413–1420. [Google Scholar] [CrossRef] [PubMed]
- Doshi, S.M.; Friedman, A.N. Diagnosis and management of type 2 diabetic kidney disease. Clin. J. Am. Soc. Nephrol. 2017, 12, 1366–1373. [Google Scholar] [CrossRef]
- Meiszterics, Z.; Kónyi, A.; Hild, G.; Sárszegi, Z.; Gaszner, B. Effectiveness and safety of anti-ischemic trimetazidine in patients with stable angina pectoris and type 2 diabetes. J. Comp. Eff. Res. 2017, 6, 649–657. [Google Scholar] [CrossRef]
- Echouffo-Tcheugui, J.B.; Kolte, D.; Khera, S.; Aronow, H.D.; Abbott, J.D.; Bhatt, D.L.; Fonarow, G.C. Diabetes mellitus and cardiogenic shock complicating acute myocardial infarction. Am. J. Med. 2018, 131, 778–786. [Google Scholar] [CrossRef]
- Miyamura, M.; Yoshioka, S.; Hamada, A.; Takuma, D.; Yokota, J.; Kusunose, M.; Kyotani, S.; Kawakita, H.; Odani, K.; Tsutsui, Y.; et al. Difference between deep seawater and surface seawater in the preventive effect of atherosclerosis. Biol. Pharm. Bull. 2004, 27, 1784–1787. [Google Scholar] [CrossRef]
- de Baaij, J.H.; Hoenderop, J.G.; Bindels, R.J. Magnesium in man: Implications for health and disease. Physiol. Rev. 2015, 95, 1–46. [Google Scholar] [CrossRef]
- Panja, S.; Hua, B.; Zegarra, D.; Ha, T.; Woodson, S.A. Metals induce transient folding and activation of the twister ribozyme. Nat. Chem. Biol. 2017, 13, 1109–1114. [Google Scholar] [CrossRef]
- Kolte, D.; Vijayaraghavan, K.; Khera, S.; Sica, D.A.; Frishman, W.H. Role of magnesium in cardiovascular diseases. Cardiol. Rev. 2014, 22, 182–192. [Google Scholar] [CrossRef]
- Golshani-Hebroni, S. Mg(++) requirement for MtHK binding, and Mg(++) stabilization of mitochondrial membranes via activation of MtHK & MtCK and promotion of mitochondrial permeability transition pore closure: A hypothesis on mechanisms underlying Mg(++)’s antioxidant and cytoprotective effects. Gene 2016, 581, 1–13. [Google Scholar]
- Gröber, U.; Schmidt, J.; Kisters, K. Magnesium in prevention and therapy. Nutrients 2015, 23, 8199–8226. [Google Scholar] [CrossRef]
- Swaminathan, R. Magnesium metabolism and its disorders. Clin. Biochem. Rev. 2003, 24, 47–66. [Google Scholar]
- Sarrafzadegan, N.; Khosravi-Boroujeni, H.; Lotfizadeh, M.; Pourmogaddas, A.; Salehi-Abargouei, A. Magnesium status and the metabolic syndrome: A systematic review and meta-analysis. Nutrition 2016, 32, 409–417. [Google Scholar] [CrossRef]
- Del Gobbo, L.C.; Imamura, F.; Wu, J.H.Y.; de Oliveira Otto, M.C.; Chiuve, S.E.; Mozaffarian, D. Circulating and dietary magnesium and risk of cardiovascular disease: A systematic review and meta-analysis of prospective studies. Am. J. Clin. Nutr. 2013, 98, 160–173. [Google Scholar] [CrossRef]
- Simental-Mendía, L.E.; Sahebkar, A.; Rodríguez-Morán, M.; Guerrero-Romero, F. A systematic review and meta-analysis of randomized controlled trials on the effects of magnesium supplementation on insulin sensitivity and glucose control. Pharmacol. Res. 2016, 111, 272–282. [Google Scholar] [CrossRef]
- Hruby, A.; Meigs, J.B.; O’Donnell, C.J.; Jacques, P.F.; McKeown, N.M. Higher magnesium intake reduces risk of impaired glucose and insulin metabolism and progression from prediabetes to diabetes in middle-aged americans. Diabetes Care 2014, 37, 419–427. [Google Scholar] [CrossRef]
- Katsuda, S.; Yasukawa, T.; Nakagawa, K.; Miyake, M.; Yamasaki, M.; Katahira, K.; Mohri, M.; Shimizu, T.; Hazama, A. Deep-sea water improves cardiovascular hemodynamics in Kurosawa and Kusanagi-hypercholesterolemic (KHC) rabbits. Biol. Pharm. Bull. 2008, 31, 38–44. [Google Scholar] [CrossRef]
- Mizushima, S.; Cappuccio, F.P.; Nichols, R.; Elliott, P. Dietary magnesium intake and blood pressure: A qualitative overview of the observational studies. J. Hum. Hypertens. 1998, 12, 447–453. [Google Scholar] [CrossRef]
- Bak, J.P.; Kim, Y.M.; Son, J.; Kim, C.J.; Kim, E.H. Application of concentrated deep sea water inhibits the development of atopic dermatitis-like skin lesions in NC/Nga mice. BMC Complement. Altern. Med. 2012, 12, 108. [Google Scholar] [CrossRef]
- Ha, B.G.; Park, J.E.; Shin, E.J.; Shon, Y.H. Modulation of glucose metabolism by balanced deep-sea water ameliorates hyperglycemia and pancreatic function in streptozotocin-induced diabetic mice. PLoS ONE 2014, 9, e102095. [Google Scholar] [CrossRef]
- Ha, B.G.; Shin, E.J.; Park, J.E.; Shon, Y.H. Anti-diabetic effect of balanced deep-sea water and its mode of action in high-fat diet induced diabetic mice. Mar. Drugs 2013, 11, 4193–4212. [Google Scholar] [CrossRef]
- Ha, B.G.; Jung, S.S.; Jang, Y.K.; Jeon, B.Y.; Shon, Y.H. Mineral-enriched deep-sea water modulates lactate metabolism via PGC-1α-mediated metabolic reprogramming. Mar. Drugs 2019, 17, 611. [Google Scholar] [CrossRef]
- Suárez, A.; Pulido, N.; Casla, A.; Casanova, B.; Arrieta, F.J.; Rovira, A. Impaired tyrosine-kinase activity of muscle insulin receptors from hypomagnesaemic rats. Diabetologia 1995, 38, 1262–1270. [Google Scholar] [CrossRef]
- Lima Mde, L.; Cruz, T.; Rodrigues, L.E.; Bomfim, O.; Melo, J.; Correia, R.; Porto, M.; Cedro, A.; Vicente, E. Serum and intracellular magnesium deficiency in patients with metabolic syndrome--evidences for its relation to insulin resistance. Diabetes Res. Clin. Pract. 2009, 83, 257–262. [Google Scholar] [CrossRef]
- Barbagallo, M.; Dominguez, L.J.; Galioto, A.; Ferlisi, A.; Cani, C.; Malfa, L.; Pineo, A.; Busardo’, A.; Paolisso, G. Role of magnesium in insulin action, diabetes and cardio-metabolic syndrome X. Mol. Asp. Med. 2003, 24, 39–52. [Google Scholar] [CrossRef]
- Chaudhary, D.P.; Sharma, R.; Bansal, D.D. Implications of magnesium deficiency in type 2 diabetes: A review. Biol. Trace Elem. Res. 2010, 134, 119–129. [Google Scholar] [CrossRef]
- Mooren, F.C.; Krüger, K.; Völker, K.; Golf, S.W.; Wadepuhl, M.; Kraus, A. Oral magnesium supplementation reduces insulin resistance in non-diabetic subjects—A double-blind, placebo-controlled, randomized trial. Diabetes Obes. Metab. 2011, 13, 281–284. [Google Scholar] [CrossRef]
- Guerrero-Romero, F.; Rodríguez-Morán, M. Magnesium improves the beta-cell function to compensate variation of insulin sensitivity: Double-blind, randomized clinical trial. Eur. J. Clin. Investig. 2011, 41, 405–410. [Google Scholar] [CrossRef]
- Guerrero-Romero, F.; Tamez-Perez, H.E.; González-González, G.; Salinas-Martínez, A.M.; Montes-Villarreal, J.; Trevino-Ortiz, J.H.; Rodríguez-Morán, M. Oral magnesium supplementation improves insulin sensitivity in non-diabetic subjects with insulin resistance. A double-blind placebo-controlled randomized trial. Diabetes Metab. 2004, 30, 253–258. [Google Scholar] [CrossRef]
- Hadjistavri, L.S.; Sarafidis, P.A.; Georgianos, P.I.; Tziolas, I.M.; Aroditis, C.P.; Hitoglou-Makedou, A.; Zebekakis, P.E.; Pikilidou, M.I.; Lasaridis, A.N. Beneficial effects of oral magnesium supplementation on insulin sensitivity and serum lipid profile. Med. Sci. Monit. 2010, 16, CR307–CR312. [Google Scholar]
- Xu, J.; Xu, W.; Yao, H.; Sun, W.; Zhou, Q.; Cai, L. Associations of serum and urinary magnesium with the pre-diabetes, diabetes and diabetic complications in the Chinese Northeast Population. PLoS ONE 2013, 8, e56750. [Google Scholar] [CrossRef]
- Liu, Z.M.; Ho, S.C. The association of serum C-reactive protein, uric acid and magnesium with insulin resistance in Chinese postmenopausal women with prediabetes or early untreated diabetes. Maturitas 2011, 70, 176–181. [Google Scholar] [CrossRef]
- Dong, J.-Y.; Xun, P.; He, K.; Qin, L.-Q. Magnesium intake and risk of type 2 diabetes: Meta-analysis of prospective cohort studies. Diabetes Care 2011, 34, 2116–2122. [Google Scholar] [CrossRef]
- Hata, A.; Doi, Y.; Ninomiya, T.; Mukai, N.; Hirakawa, Y.; Hata, J.; Ozawa, M.; Uchida, K.; Shirota, T.; Kitazono, T.; et al. Magnesium intake decreases type 2 diabetes risk through the improvement of insulin resistance and inflammation: The Hisayama Study. Diabet. Med. 2013, 30, 1487–1494. [Google Scholar] [CrossRef]
- Veronese, N.; Watutantrige-Fernando, S.; Luchini, C.; Solmi, M.; Sartore, G.; Sergi, G.; Manzato, E.; Barbagallo, M.; Maggi, S.; Stubbs, B. Effect of magnesium supplementation on glucose metabolism in people with or at risk of diabetes: A systematic review and meta-analysis of double-blind randomized controlled trials. Eur. J. Clin. Nutr. 2016, 70, 1354–1359. [Google Scholar] [CrossRef]
- Mejía-Rodríguez, F.; Shamah-Levy, T.; Villalpando, S.; García-Guerra, A.; Méndez-Gómez Humarán, I. Iron, zinc, copper and magnesium deficiencies in Mexican adults from the National Health and Nutrition Survey 2006. Salud Publica. Mex. 2013, 55, 275–284. [Google Scholar] [CrossRef]
- Ford, E.S. Dietary magnesium intake in a National Sample of U.S. adults. J. Nutr. 2003, 133, 2879–2882. [Google Scholar] [CrossRef]
- Karve, A.; Hayward, R.A. Prevalence, diagnosis, and treatment of impaired fasting glucose and impaired glucose tolerance in nondiabetic U.S. adults. Diabetes Care 2010, 33, 2355–2359. [Google Scholar] [CrossRef]
- Guerrero-Romero, F.; Rodríguez-Morán, M.; Pérez-Fuentes, R.; Sánchez-Guillén, M.C.; González-Ortiz, M.; Martínez-Abundis, E.; Brito-Zurita, O.; Madero, A.; Figueroa, B.; Revilla-Monsalve, C.; et al. Prediabetes and its relationship with obesity in Mexican adults: The Mexican Diabetes Prevention (MexDiab) Study. Metab. Syndr. Relat. Disord. 2008, 6, 15–23. [Google Scholar] [CrossRef]
- Schimatschek, H.F.; Rempis, R. Prevalence of hypomagnesemia in an unselected German population of 16,000 individuals. Magnes. Res. 2001, 14, 283–290. [Google Scholar]
- Völzke, H.; Alte, D.; Schmidt, C.O.; Radke, D.; Lorbeer, R.; Friedrich, N.; Aumann, N.; Lau, K.; Piontek, M.; Born, G.; et al. Cohort profile: The study of health in Pomerania. Int. J. Epidemiol. 2011, 40, 294–307. [Google Scholar] [CrossRef] [PubMed]
- Rodríguez-Moran, M.; Guerrero-Romero, F. Oral magnesium supplementation improves the metabolic profile of metabolically obese, normal-weight individuals: A randomized double-blind placebo-controlled trial. Arch. Med. Res. 2014, 45, 388–393. [Google Scholar] [CrossRef] [PubMed]
- Rasic-Milutinovic, Z.; Perunicic-Pekovic, G.; Jovanovic, D.; Gluvic, Z.; Cankovic-Kadijevic, M. Association of blood pressure and metabolic syndrome components with magnesium levels in drinking water in some Serbian municipalities. J. Water Health 2012, 10, 161–169. [Google Scholar] [CrossRef]
| Component | BDSW | Placebo | |||
|---|---|---|---|---|---|
| Mixing Ratio (%) | Usage (g) | Mixing Ratio (%) | Usage (g) | ||
| Main component | BDSW (hardness 4000) | 97.9 | 430.8 | - | - |
| Purified water | - | - | 96.8 | 425.9 | |
| Minor component | Dextrin | - | - | 1.1 | 4.8 |
| Cranberry (concentrated solution) | 2.0 | 8.8 | 2.0 | 8.8 | |
| Cranberry scent | 0.1 | 0.4 | 0.1 | 0.4 | |
| Total | 100 | 440 | 100 | 440 | |
| Mineral | BDSW (mg/L) |
|---|---|
| Magnesium (Mg) | 813 |
| Calcium (Ca) | 275 |
| Potassium (K) | 20 |
| Sodium (Na) | 41 |
| Overall hardness 1) | 4000 |
| Assigned Group | First Period (0–8 Weeks) | Wash-Out Period (8–11 Weeks) | Second Period (12–20 Weeks) |
|---|---|---|---|
| A | BDSW intake | Placebo intake | |
| B | Placebo intake | BDSW intake |
| BDSW Group (n = 37) | Placebo Group (n = 37) | p-Value 1) | |
|---|---|---|---|
| FPG (mg/dL) | 99.59 ± 7.96 | 99.14 ± 10.05 | 0.828 |
| PPG0.5h (mg/dL) | 174.14 ± 18.68 | 177.65 ± 28.05 | 0.528 |
| PPG1.0h (mg/dL) | 189.62 ± 28.57 | 192.00 ± 37.05 | 0.758 |
| PPG1.5h (mg/dL) | 167.97 ± 37.67 | 176.30 ± 41.33 | 0.368 |
| PPG2h (mg/dL) | 149.32 ± 33.18 | 146.92 ± 38.95 | 0.776 |
| iAUC0−2h (hr*mg/dL) | 129.12 ± 37.88 | 136.47 ± 49.76 | 0.477 |
| FPI (μU/mL) | 8.66 ± 4.87 | 7.95 ± 3.88 | 0.494 |
| HOMA-IR | 2.13 ± 1.19 | 1.96 ± 1.03 | 0.510 |
| C-peptide (ng/mL) | 1.94 ± 0.70 | 1.91 ± 0.55 | 0.844 |
| HbA1c (%) | 5.82 ± 0.30 | 5.80 ± 0.32 | 0.766 |
| TC (mg/dL) | 204.30 ± 33.94 | 194.62 ± 34.08 | 0.225 |
| TG (mg/dL) | 138.81 ± 64.57 | 161.46 ± 100.70 | 0.254 |
| HDL-C (mg/dL) | 48.05 ± 8.93 | 47.22 ± 9.23 | 0.693 |
| LDL-C (mg/dL) | 128.41 ± 29.80 | 116.22 ± 33.00 | 0.100 |
| Weight (kg) | 66.37 ± 13.57 | 66.31 ± 13.71 | 0.986 |
| BMI (kg/m2) | 25.19 ± 4.01 | 25.16 ± 4.05 | 0.977 |
| BFM (g) | 20.01 ± 8.12 | 19.69 ± 8.31 | 0.868 |
| PBF (%) | 29.98 ± 7.20 | 29.58 ± 7.58 | 0.819 |
| WC (cm) | 88.67 ± 9.85 | 88.08 ± 9.82 | 0.797 |
| HC (cm) | 95.53 ± 9.17 | 95.36 ± 9.23 | 0.936 |
| WHR | 0.93 ± 0.05 | 0.92 ± 0.04 | 0.669 |
| BDSW Group (n = 37) | Placebo Group (n = 37) | p-Value 2) | ||||||||
|---|---|---|---|---|---|---|---|---|---|---|
| Baseline | 8 Weeks | Change Value | p-Value 1) | Baseline | 8 Weeks | Change Value | p-Value 1) | |||
| FPG (mg/dL) | 99.59 ± 7.96 | 100.32 ± 8.69 | 0.73 ± 4.88 | 0.369 | 99.14 ± 10.05 | 99.59 ± 7.79 | 0.46 ± 6.91 | 0.689 | 0.837 | |
| PPG (mg/dL) | 30 min | 174.14 ± 18.68 | 171.19 ± 20.69 | −2.95 ± 22.28 | 0.427 | 177.65 ± 28.05 | 176.54 ± 20.99 | −1.11 ± 26.92 | 0.804 | 0.734 |
| 60 min | 189.62 ± 28.57 | 183.65 ± 34.09 | −5.97 ± 32.36 | 0.269 | 192.00 ± 37.05 | 186.30 ± 35.07 | −5.70 ± 31.51 | 0.278 | 0.966 | |
| 90 min | 167.97 ± 37.67 | 160.84 ± 37.62 | −7.14 ± 35.34 | 0.227 | 176.30 ± 41.33 | 165.11 ± 34.25 | −11.19 ± 38.46 | 0.085 | 0.657 | |
| 120 min | 149.32 ± 33.18 | 141.86 ± 36.27 | −7.46 ± 34.58 | 0.198 | 146.92 ± 38.95 | 136.03 ± 29.18 | −10.89 ± 39.28 | 0.100 | 0.679 | |
| iAUC0−2h (h·mg/dL) | 129.12 ± 37.88 | 118.32 ± 39.24 | −10.81 ± 35.23 | 0.070 | 136.47 ± 49.76 | 124.18 ± 40.45 | −12.29 ± 43.32 | 0.093 | 0.900 | |
| BDSW Group (n = 37) | Placebo Group (n = 37) | p-Value 2) | |||||||
|---|---|---|---|---|---|---|---|---|---|
| Baseline | 8 Weeks | Change Value | p-Value 1) | Baseline | 8 Weeks | Change Value | p-Value 1) | ||
| FPI (μU/mL) | 8.66 ± 4.87 | 7.59 ± 3.87 | −1.07 ± 3.97 | 0.110 | 7.95 ± 3.88 | 8.62 ± 4.14 | 0.67 ± 2.76 | 0.151 | 0.042 * |
| HOMA-IR | 2.13 ± 1.19 | 1.87 ± 0.92 | −0.27 ± 1.01 | 0.113 | 1.96 ± 1.03 | 2.13 ± 1.03 | 0.17 ± 0.70 | 0.157 | 0.049 * |
| C-peptide (ng/mL) | 1.94 ± 0.70 | 1.87 ± 0.49 | −0.07 ± 0.53 | 0.452 | 1.91 ± 0.55 | 1.96 ± 0.57 | 0.05 ± 0.30 | 0.311 | 0.263 |
| HbA1c (%) | 5.82 ± 0.30 | 5.83 ± 0.32 | 0.01 ± 0.17 | 0.846 | 5.80 ± 0.32 | 5.84 ± 0.31 | 0.04 ± 0.15 | 0.088 | 0.249 |
| BDSW group (n = 37) | Placebo group (n = 37) | p-Value 2) | |||||||
|---|---|---|---|---|---|---|---|---|---|
| Baseline | 8 Weeks | Change Value | p-Value 1) | Baseline | 8 Weeks | Change Value | p-Value 1) | ||
| TC (mg/dL) | 204.30 ± 33.94 | 198.62 ± 33.21 | −5.68 ± 28.70 | 0.237 | 194.62 ± 34.08 | 205.03 ± 33.71 | 10.41 ± 23.02 | 0.009 ** | 0.006 ** |
| TG (mg/dL) | 138.81 ± 64.57 | 141.68 ± 81.61 | 2.86 ± 78.97 | 0.827 | 161.46 ± 100.70 | 140.14 ± 78.78 | −21.32 ± 78.09 | 0.105 | 0.184 |
| HDL-C (mg/dL) | 48.05 ± 8.93 | 49.14 ± 9.48 | 1.08 ± 7.34 | 0.376 | 47.22 ± 9.23 | 49.95 ± 9.36 | 2.73 ± 5.35 | 0.004 ** | 0.289 |
| LDL-C (mg/dL) | 128.41 ± 29.80 | 121.19 ± 32.86 | −7.22 ± 28.44 | 0.131 | 116.22 ± 33.00 | 127.22 ± 29.21 | 11.00 ± 23.68 | 0.008 ** | 0.003 ** |
| BDSW group (n = 37) | Placebo group (n = 37) | p-Value 2) | |||||||
|---|---|---|---|---|---|---|---|---|---|
| Baseline | 8 Weeks | Change Value | p-Value 1) | Baseline | 8 Weeks | Change Value | p-Value 1) | ||
| Calorie (kcal) | 1676.28 ± 410.77 | 1721.93 ± 449.86 | 19.35 ± 384.25 | 0.647 | 1767.29 ± 563.25 | 1753.15 ± 454.26 | −14.14 ± 495.96 | 0.863 | 0.622 |
| Carbohydrate (g) | 251.27 ± 68.93 | 263.63 ± 78.52 | 7.82 ± 60.88 | 0.367 | 259.77 ± 82.75 | 256.24 ± 71.15 | −3.53 ± 72.32 | 0.768 | 0.344 |
| Fat (g) | 42.82 ± 16.22 | 41.13 ± 16.83 | −2.47 ± 17.75 | 0.502 | 44.52 ± 22.18 | 45.12 ± 17.60 | 0.60 ± 24.77 | 0.884 | 0.624 |
| Protein (g) | 68.72 ± 19.28 | 69.32 ± 22.72 | 0.01 ± 22.70 | 0.927 | 71.02 ± 23.91 | 72.40 ± 20.32 | 1.38 ± 24.71 | 0.735 | 0.910 |
| Dietary fiber (g) | 22.83 ± 8.19 | 24.23 ± 8.48 | 1.24 ± 7.30 | 0.290 | 24.67 ± 9.24 | 24.39 ± 8.88 | −0.28 ± 8.40 | 0.843 | 0.265 |
| BDSW Group (n = 40) | Placebo Group (n = 40) | p-Value 2) | |||||||
|---|---|---|---|---|---|---|---|---|---|
| Baseline | 8 Weeks | Change Value | p-Value 1) | Baseline | 8 Weeks | Change Value | p-Value 1) | ||
| Hematology | |||||||||
| WBC (×103/μL) | 5.90 ± 1.74 | 5.76 ± 1.60 | −0.14 ± 1.41 | 0.547 | 5.77 ± 1.52 | 5.70 ± 1.41 | −0.07 ± 0.84 | 0.598 | 0.807 |
| RBC (×1003/μL) | 4.51 ± 0.34 | 4.52 ± 0.33 | 0.01 ± 0.15 | 0.831 | 4.51 ± 0.33 | 4.53 ± 0.35 | 0.02 ± 0.15 | 0.392 | 0.655 |
| Hemoglobin (g/dL) | 13.80 ± 1.11 | 13.84 ± 1.05 | 0.04 ± 0.51 | 0.667 | 13.85 ± 1.10 | 13.94 ± 1.14 | 0.09 ± 0.51 | 0.296 | 0.654 |
| Hematocrit (%) | 40.91 ± 2.75 | 41.08 ± 2.79 | 0.17 ± 1.38 | 0.440 | 40.97 ± 2.99 | 41.15 ± 3.03 | 0.18 ± 1.37 | 0.418 | 0.982 |
| Platelet (×103/μL) | 276.85 ± 72.02 | 277.98 ± 62.85 | 1.13 ± 24.97 | 0.777 | 272.73 ± 66.17 | 279.40 ± 60.35 | 6.68 ± 25.20 | 0.102 | 0.351 |
| Biochemistry | |||||||||
| ALP (IU/L) | 68.85 ± 18.24 | 68.18 ± 16.96 | −0.68 ± 6.66 | 0.525 | 68.13 ± 17.80 | 68.00 ± 19.18 | −0.13 ± 7.38 | 0.915 | 0.736 |
| GGT (IU/L) | 28.93 ± 18.73 | 27.68 ± 18.52 | −1.25 ± 8.21 | 0.342 | 28.53 ± 18.92 | 27.33 ± 19.18 | −1.20 ± 8.78 | 0.393 | 0.979 |
| AST (IU/L) | 24.15 ± 5.78 | 24.78 ± 6.29 | 0.63 ± 4.35 | 0.369 | 23.78 ± 5.70 | 23.43 ± 6.08 | −0.35 ± 5.88 | 0.709 | 0.427 |
| ALT (IU/L) | 25.95 ± 9.06 | 27.10 ± 10.99 | 1.15 ± 7.99 | 0.368 | 25.40 ± 8.94 | 24.53 ± 7.49 | −0.88 ± 6.55 | 0.404 | 0.262 |
| Total bilirubin (mg/dL) | 0.91 ± 0.35 | 0.86 ± 0.30 | −0.05 ± 0.24 | 0.189 | 0.86 ± 0.32 | 0.88 ± 0.27 | 0.01 ± 0.23 | 0.707 | 0.209 |
| Total protein (g/dL) | 7.32 ± 0.36 | 7.28 ± 0.31 | −0.04 ± 0.27 | 0.359 | 7.28 ± 0.36 | 7.34 ± 0.33 | 0.07 ± 0.30 | 0.176 | 0.101 |
| Albumin (g/dL) | 4.26 ± 0.19 | 4.25 ± 0.20 | −0.01 ± 0.16 | 0.841 | 4.22 ± 0.17 | 4.27 ± 0.18 | 0.04 ± 0.14 | 0.068 | 0.179 |
| BUN (mg/dL) | 15.28 ± 3.69 | 15.20 ± 3.63 | −0.08 ± 3.72 | 0.899 | 15.60 ± 3.48 | 14.60 ± 4.15 | −1.00 ± 4.20 | 0.139 | 0.308 |
| Creatinine (mg/dL) | 0.62 ± 0.14 | 0.63 ± 0.13 | 0.01 ± 0.13 | 0.698 | 0.63 ± 0.14 | 0.64 ± 0.14 | 0.01 ± 0.07 | 0.642 | 0.910 |
| eGFR (mL/min/1.7) | 107.93 ± 8.22 | 106.58 ± 8.30 | −1.35 ± 11.49 | 0.462 | 106.62 ± 8.03 | 106.29 ± 8.18 | −0.33 ± 5.05 | 0.686 | 0.582 |
| Urinary | |||||||||
| SG | 1.02 ± 0.00 | 1.02 ± 0.01 | 0.00 ± 0.01 | 0.570 | 1.02 ± 0.00 | 1.02 ± 0.00 | 0.00 ± 0.01 | 0.517 | 0.985 |
| pH | 6.14 ± 0.72 | 5.89 ± 0.72 | −0.25 ± 0.74 | 0.040 * | 6.30 ± 0.86 | 6.09 ± 0.75 | −0.21 ± 0.78 | 0.094 | 0.817 |
| BDSW Group (n = 40) | Placebo Group (n = 40) | p-Value 2) | |||||||
|---|---|---|---|---|---|---|---|---|---|
| Baseline | 8 Weeks | Change Value | p-Value 1) | Baseline | 8 Weeks | Change Value | p-Value 1) | ||
| SBP (mmHg) | 119.65 ± 12.46 | 120.83 ± 10.70 | 1.18 ± 11.40 | 0.518 | 120.03 ± 11.89 | 121.70 ± 10.43 | 1.68 ± 9.59 | 0.277 | 0.827 |
| DBP (mmHg) | 77.90 ± 8.95 | 78.98 ± 9.27 | 1.08 ± 6.66 | 0.314 | 77.38 ± 9.83 | 79.95 ± 7.56 | 2.58 ± 5.70 | 0.007 ** | 0.324 |
| Pulse (number/min) | 71.80 ± 9.91 | 72.20 ± 10.37 | 0.40 ± 8.92 | 0.778 | 71.70 ± 9.49 | 73.10 ± 9.42 | 1.40 ± 5.55 | 0.118 | 0.556 |
© 2020 by the authors. Licensee MDPI, Basel, Switzerland. This article is an open access article distributed under the terms and conditions of the Creative Commons Attribution (CC BY) license (http://creativecommons.org/licenses/by/4.0/).
Share and Cite
Ham, J.Y.; Shon, Y.H. Natural Magnesium-Enriched Deep-Sea Water Improves Insulin Resistance and the Lipid Profile of Prediabetic Adults: A Randomized, Double-Blinded Crossover Trial. Nutrients 2020, 12, 515. https://doi.org/10.3390/nu12020515
Ham JY, Shon YH. Natural Magnesium-Enriched Deep-Sea Water Improves Insulin Resistance and the Lipid Profile of Prediabetic Adults: A Randomized, Double-Blinded Crossover Trial. Nutrients. 2020; 12(2):515. https://doi.org/10.3390/nu12020515
Chicago/Turabian StyleHam, Ji Yeon, and Yun Hee Shon. 2020. "Natural Magnesium-Enriched Deep-Sea Water Improves Insulin Resistance and the Lipid Profile of Prediabetic Adults: A Randomized, Double-Blinded Crossover Trial" Nutrients 12, no. 2: 515. https://doi.org/10.3390/nu12020515
APA StyleHam, J. Y., & Shon, Y. H. (2020). Natural Magnesium-Enriched Deep-Sea Water Improves Insulin Resistance and the Lipid Profile of Prediabetic Adults: A Randomized, Double-Blinded Crossover Trial. Nutrients, 12(2), 515. https://doi.org/10.3390/nu12020515