A Randomized Study of the Effect of Replacing Sugar-Sweetened Soda by Reduced Fat Milk on Cardiometabolic Health in Male Adolescent Soda Drinkers


Abstract
1. Introduction
2. Materials and Methods
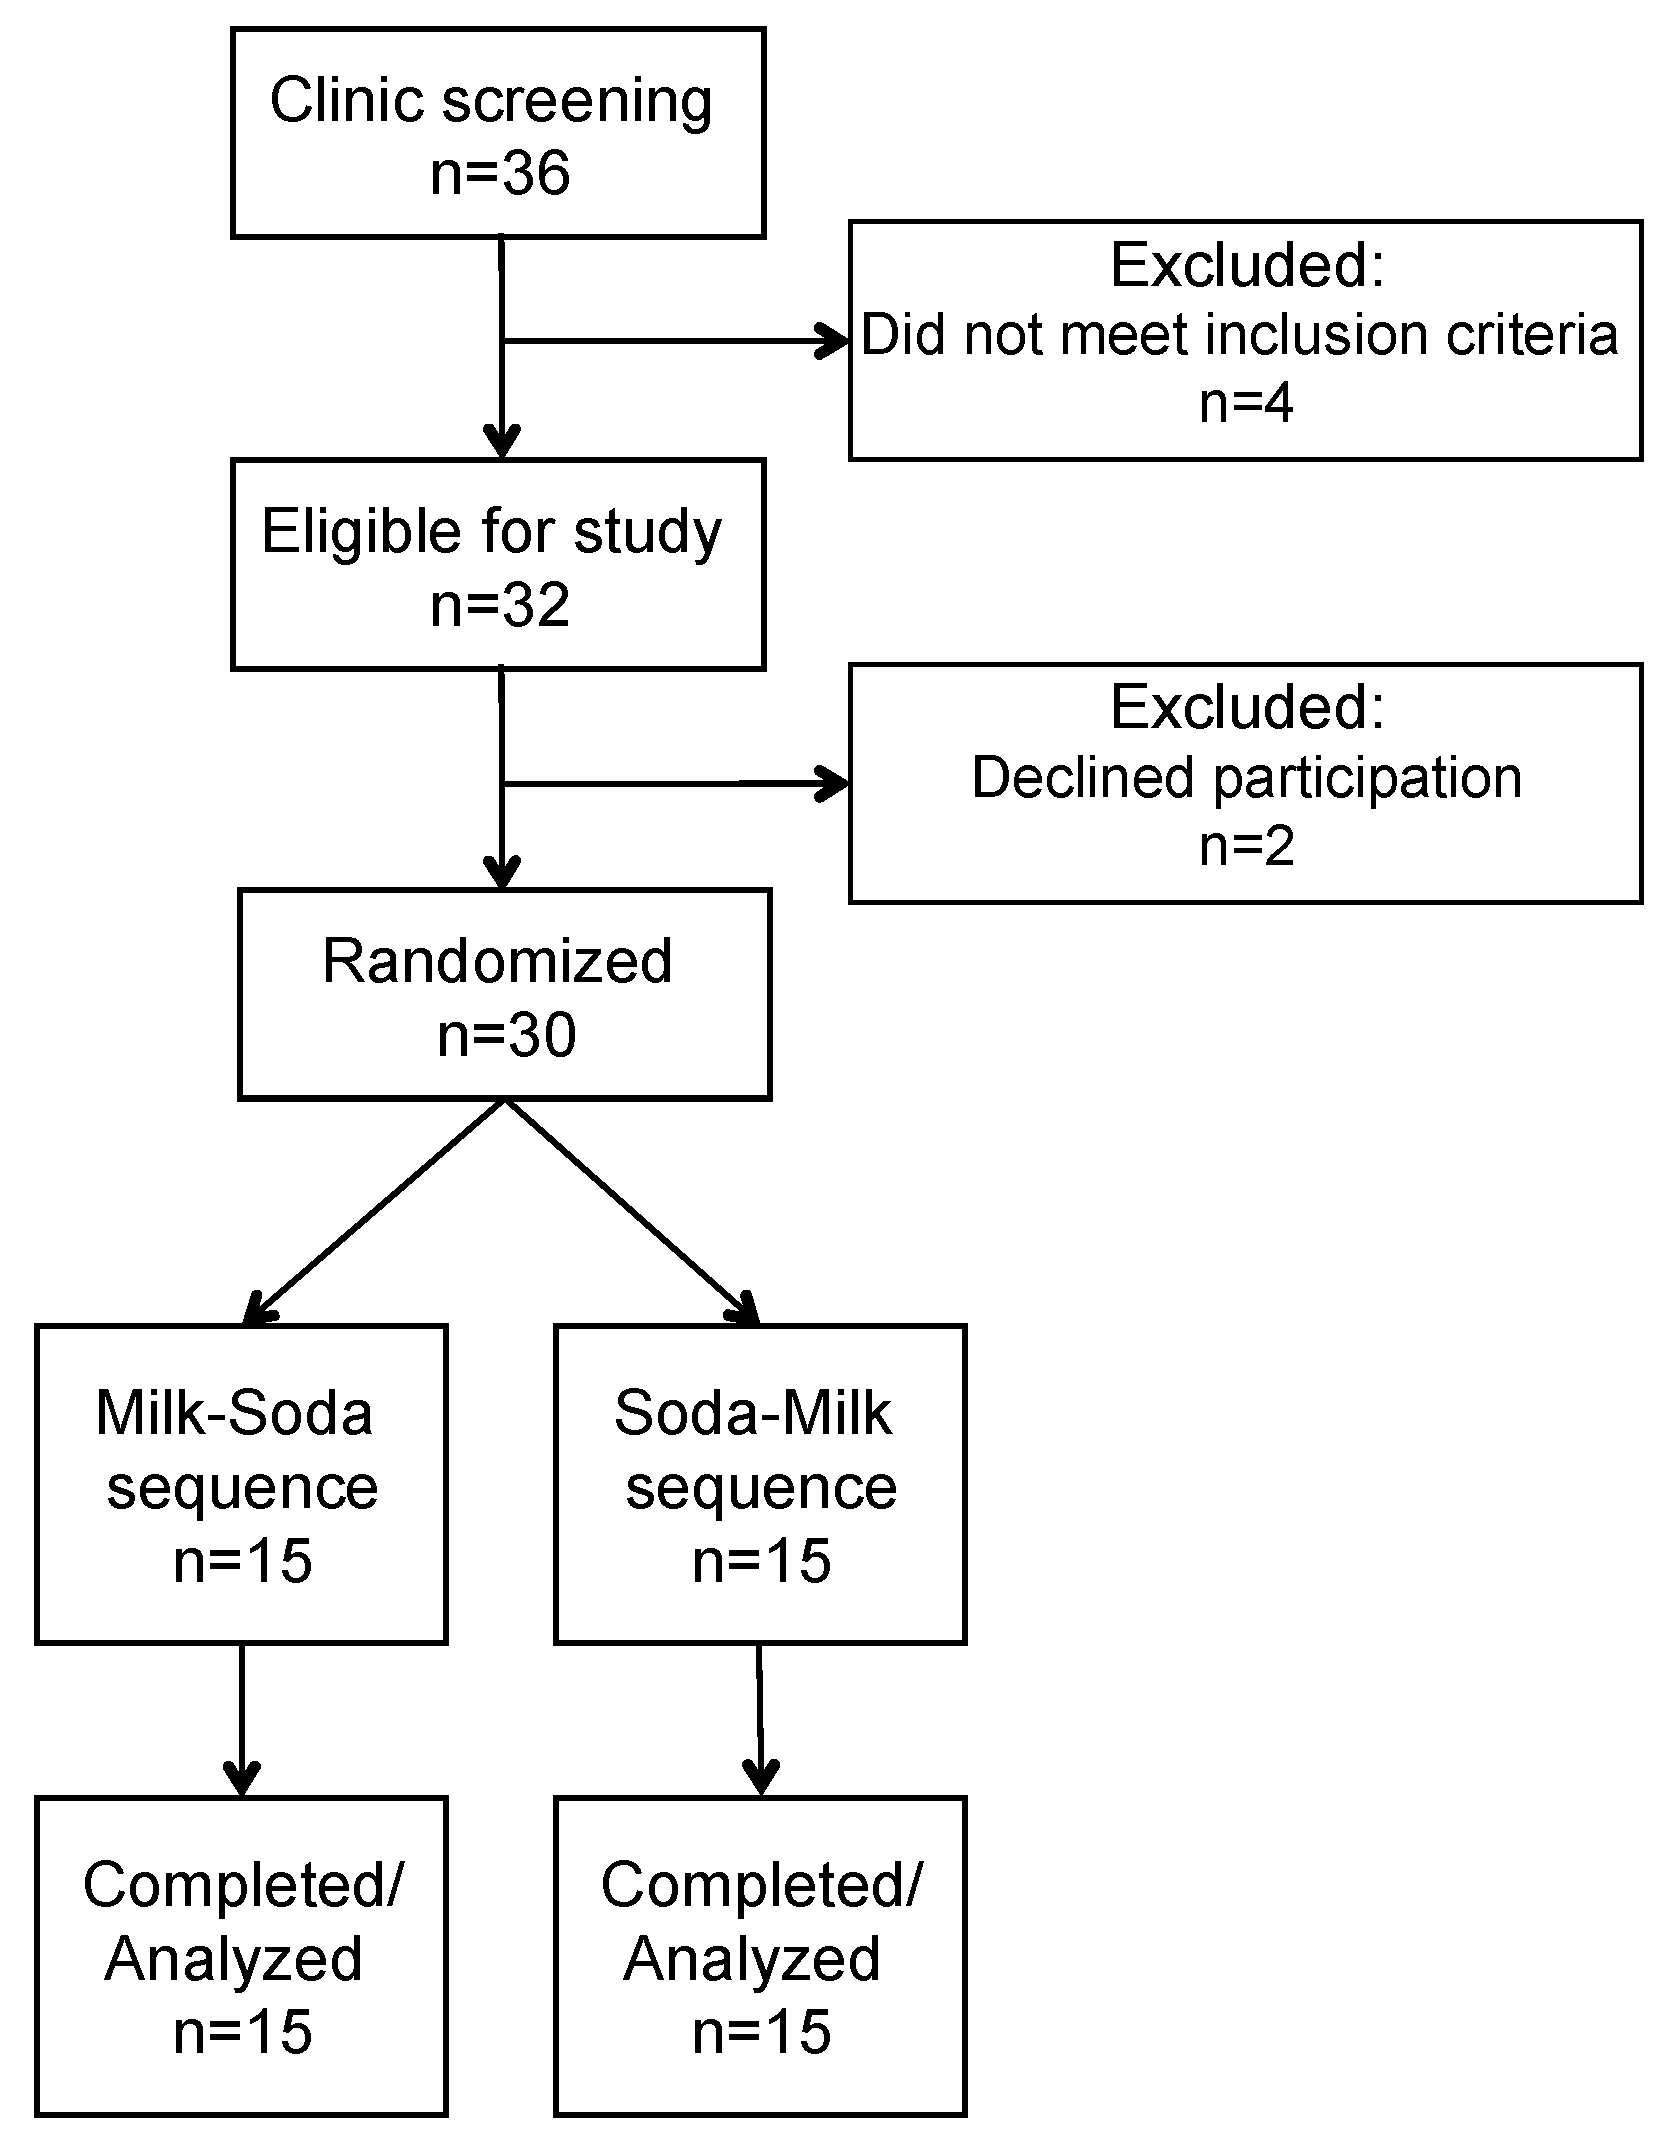
2.1. Study Design
2.2. Participant Recruitment and Enrollment
2.3. Diet and Physical Activity Assessment
2.4. Clinical Procedures
2.5. Laboratory Procedures
2.6. Data Analysis
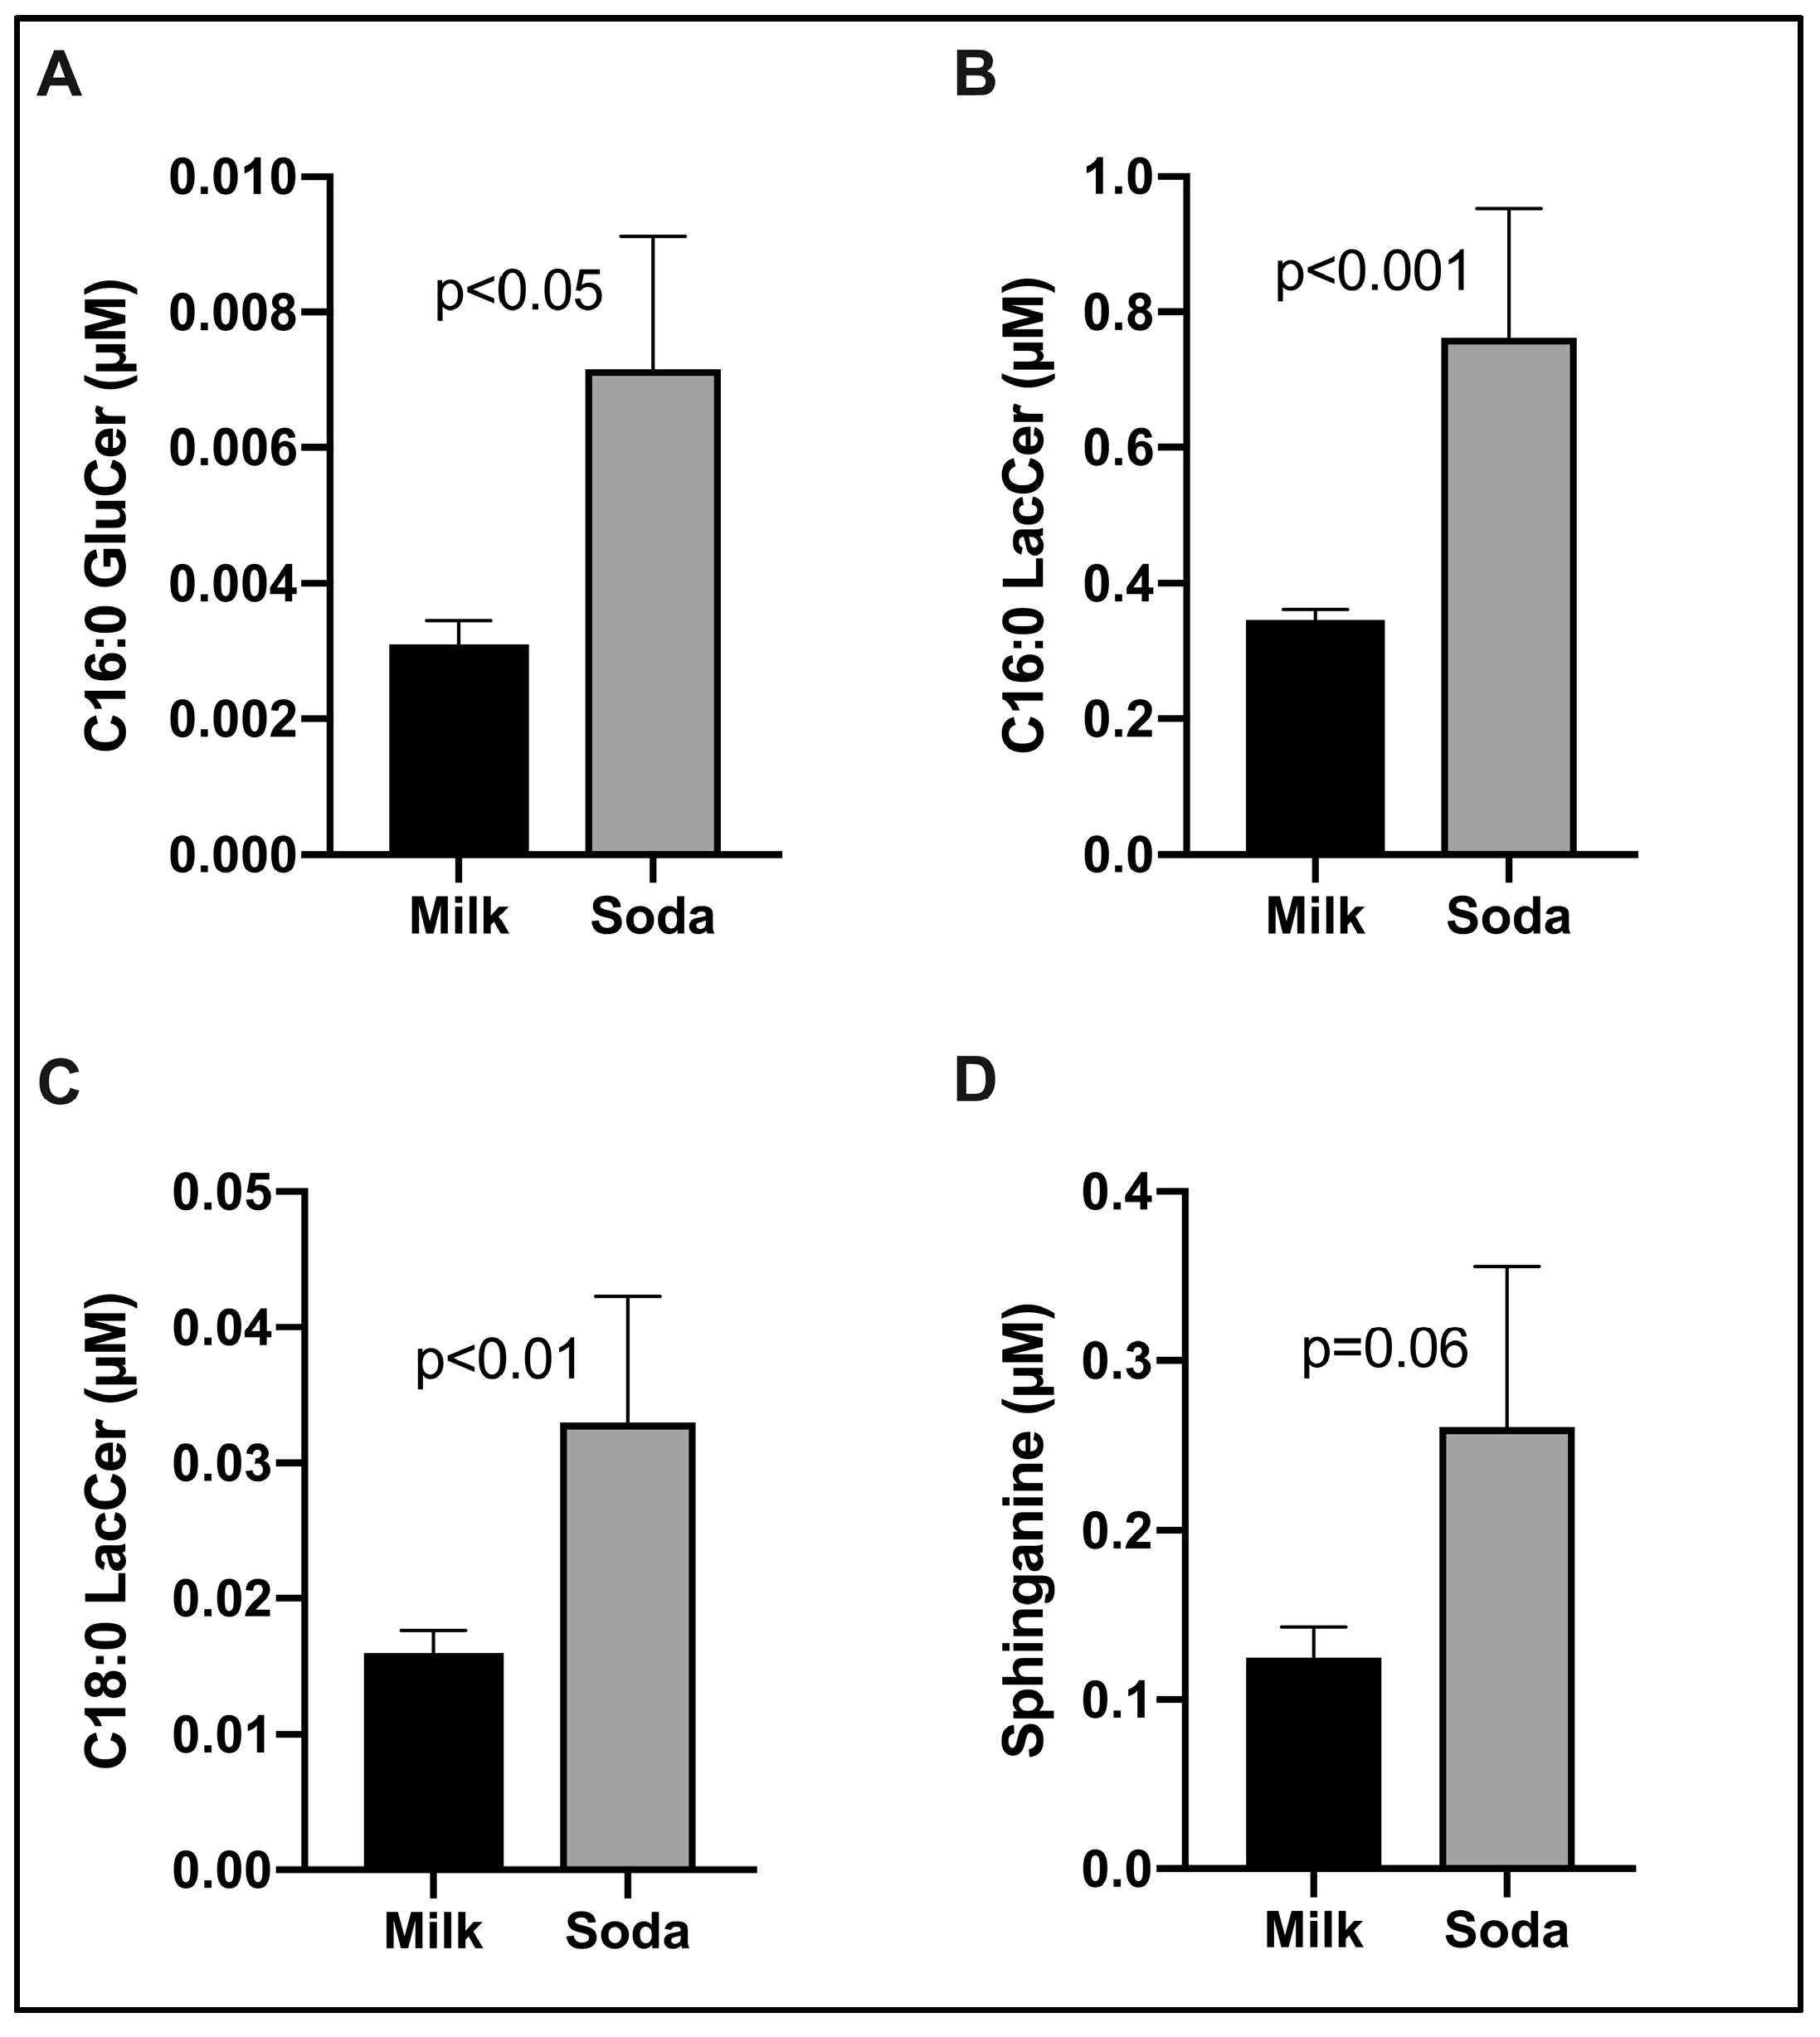
3. Results
4. Discussion
5. Conclusions
Author Contributions
Funding
Acknowledgments
Conflicts of Interest
References
- Bleich, S.N.; Vercammen, K.A.; Koma, J.W.; Li, Z. Trends in Beverage Consumption among Children and Adults, 2003–2014. Obesity (Silver Spring) 2018, 26, 432–441. [Google Scholar] [CrossRef] [PubMed]
- Bray, G.A.; Nielsen, S.J.; Popkin, B.M. Consumption of high-fructose corn syrup in beverages may play a role in the epidemic of obesity. Am. J. Clin. Nutr. 2004, 79, 537–543. [Google Scholar] [CrossRef] [PubMed]
- Dhingra, R.; Sullivan, L.; Jacques, P.F.; Wang, T.J.; Fox, C.S.; Meigs, J.B.; D’Agostino, R.B.; Gaziano, J.M.; Vasan, R.S. Soft drink consumption and risk of developing cardiometabolic risk factors and the metabolic syndrome in middle-aged adults in the community. Circulation 2007, 116, 480–488. [Google Scholar] [CrossRef] [PubMed]
- Hu, F.B.; Malik, V.S. Sugar-sweetened beverages and risk of obesity and type 2 diabetes: Epidemiologic evidence. Physiol. Behav. 2010, 100, 47–54. [Google Scholar] [CrossRef] [PubMed]
- Berkey, C.S.; Rockett, H.R.; Field, A.E.; Gillman, M.W.; Colditz, G.A. Sugar-added beverages and adolescent weight change. Obes. Res. 2004, 12, 778–788. [Google Scholar] [CrossRef] [PubMed]
- Malik, V.S.; Willett, W.C.; Hu, F.B. Sugar-sweetened beverages and BMI in children and adolescents: Reanalyses of a meta-analysis. American J. Clin. Nutr. 2009, 89, 438–439, author reply 439–440. [Google Scholar] [CrossRef]
- Zheng, M.; Rangan, A.; Allman-Farinelli, M.; Rohde, J.F.; Olsen, N.J.; Heitmann, B.L. Replacing sugary drinks with milk is inversely associated with weight gain among young obesity-predisposed children. Br. J. Nutr. 2015, 114, 1448–1455. [Google Scholar] [CrossRef]
- Stanhope, K.L.; Schwarz, J.M.; Keim, N.L.; Griffen, S.C.; Bremer, A.A.; Graham, J.L.; Hatcher, B.; Cox, C.L.; Dyachenko, A.; Zhang, W.; et al. Consuming fructose-sweetened, not glucose-sweetened, beverages increases visceral adiposity and lipids and decreases insulin sensitivity in overweight/obese humans. J Clin Invest 2009, 119, 1322–1334. [Google Scholar] [CrossRef]
- Aeberli, I.; Gerber, P.A.; Hochuli, M.; Kohler, S.; Haile, S.R.; Gouni-Berthold, I.; Berthold, H.K.; Spinas, G.A.; Berneis, K. Low to moderate sugar-sweetened beverage consumption impairs glucose and lipid metabolism and promotes inflammation in healthy young men: A randomized controlled trial. Am. J. Clin. Nutr. 2011, 94, 479–485. [Google Scholar] [CrossRef]
- Maersk, M.; Belza, A.; Stodkilde-Jorgensen, H.; Ringgaard, S.; Chabanova, E.; Thomsen, H.; Pedersen, S.B.; Astrup, A.; Richelsen, B. Sucrose-sweetened beverages increase fat storage in the liver, muscle, and visceral fat depot: A 6-mo randomized intervention study. Am. J. Clin. Nutr. 2012, 95, 283–289. [Google Scholar] [CrossRef]
- Musunuru, K.; Orho-Melander, M.; Caulfield, M.P.; Li, S.; Salameh, W.A.; Reitz, R.E.; Berglund, G.; Hedblad, B.; Engstrom, G.; Williams, P.T.; et al. Ion mobility analysis of lipoprotein subfractions identifies three independent axes of cardiovascular risk. Arterioscler Thromb Vasc Biol 2009, 29, 1975–1980. [Google Scholar] [CrossRef] [PubMed]
- Aeberli, I.; Zimmermann, M.B.; Molinari, L.; Lehmann, R.; l’Allemand, D.; Spinas, G.A.; Berneis, K. Fructose intake is a predictor of LDL particle size in overweight schoolchildren. Am. J. Clin. Nutr. 2007, 86, 1174–1178. [Google Scholar] [CrossRef] [PubMed][Green Version]
- Gugliucci, A.; Lustig, R.H.; Caccavello, R.; Erkin-Cakmak, A.; Noworolski, S.M.; Tai, V.W.; Wen, M.J.; Mulligan, K.; Schwarz, J.M. Short-term isocaloric fructose restriction lowers apoC-III levels and yields less atherogenic lipoprotein profiles in children with obesity and metabolic syndrome. Atherosclerosis 2016, 253, 171–177. [Google Scholar] [CrossRef] [PubMed]
- Keller, A.; O’Reilly, E.J.; Malik, V.; Buring, J.E.; Andersen, I.; Steffen, L.; Robien, K.; Mannisto, S.; Rimm, E.B.; Willett, W.; et al. Substitution of sugar-sweetened beverages for other beverages and the risk of developing coronary heart disease: Results from the Harvard Pooling Project of Diet and Coronary Disease. Prev. Med. 2020, 131, 105970. [Google Scholar] [CrossRef]
- Hannun, Y.A.; Obeid, L.M. Sphingolipids and their metabolism in physiology and disease. Nat. Rev. Mol. Cell Biol. 2018, 19, 175–191. [Google Scholar] [CrossRef]
- Holland, W.L.; Summers, S.A. Sphingolipids, insulin resistance, and metabolic disease: New insights from in vivo manipulation of sphingolipid metabolism. Endocr. Rev. 2008, 29, 381–402. [Google Scholar] [CrossRef]
- Kusminski, C.M.; Scherer, P.E. Lowering ceramides to overcome diabetes. Science 2019, 365, 319–320. [Google Scholar] [CrossRef]
- Krauss, R.M.; Blanche, P.J.; Rawlings, R.S.; Fernstrom, H.S.; Williams, P.T. Separate effects of reduced carbohydrate intake and weight loss on atherogenic dyslipidemia. Am. J. Clin. Nutr. 2006, 83, 1025–1031. [Google Scholar] [CrossRef]
- Mangravite, L.M.; Chiu, S.; Wojnoonski, K.; Rawlings, R.S.; Bergeron, N.; Krauss, R.M. Changes in atherogenic dyslipidemia induced by carbohydrate restriction in men are dependent on dietary protein source. J. Nutr. 2011, 141, 2180–2185. [Google Scholar] [CrossRef]
- Stanhope, K.L.; Medici, V.; Bremer, A.A.; Lee, V.; Lam, H.D.; Nunez, M.V.; Chen, G.X.; Keim, N.L.; Havel, P.J. A dose-response study of consuming high-fructose corn syrup-sweetened beverages on lipid/lipoprotein risk factors for cardiovascular disease in young adults. Am. J. Clin. Nutr. 2015, 101, 1144–1154. [Google Scholar] [CrossRef]
- Hughes, A.R.; Summer, S.S.; Ollberding, N.J.; Benken, L.A.; Kalkwarf, H.J. Comparison of an interviewer-administered with an automated self-administered 24 h (ASA24) dietary recall in adolescents. Public Health Nutr. 2017, 20, 3060–3067. [Google Scholar] [CrossRef][Green Version]
- Chiu, S.; Bergeron, N.; Williams, P.T.; Bray, G.A.; Sutherland, B.; Krauss, R.M. Comparison of the DASH (Dietary Approaches to Stop Hypertension) diet and a higher-fat DASH diet on blood pressure and lipids and lipoproteins: A randomized controlled trial. Am. J. Clin. Nutr. 2016, 103, 341–347. [Google Scholar] [CrossRef] [PubMed]
- Bielawski, J.; Szulc, Z.M.; Hannun, Y.A.; Bielawska, A. Simultaneous quantitative analysis of bioactive sphingolipids by high-performance liquid chromatography-tandem mass spectrometry. Methods 2006, 39, 82–91. [Google Scholar] [CrossRef] [PubMed]
- Dreon, D.M.; Fernstrom, H.A.; Williams, P.T.; Krauss, R.M. Reduced LDL particle size in children consuming a very-low-fat diet is related to parental LDL-subclass patterns. Am. J. Clin. Nutr. 2000, 71, 1611–1616. [Google Scholar] [CrossRef] [PubMed][Green Version]
- Expert Panel on Integrated Guidelines for Cardiovascular Health and Risk Reduction in Children and Adolescents; National Heart, Lung, and Blood Institute. Expert panel on integrated guidelines for cardiovascular health and risk reduction in children and adolescents: Summary report. Pediatrics 2011, 128 (Suppl. 5), S213–S256. [Google Scholar] [CrossRef] [PubMed]
- Rosinger, A.; Herrick, K.; Gahche, J.; Park, S. Sugar-Sweetened Beverage Consumption among U.S. Youth, 2011–2014; NCHS Data Brief; National Center for Health Statistics: Hyattsville, MD, USA, 2017; pp. 1–8.
- Moran, A.; Jacobs, D.R., Jr.; Steinberger, J.; Steffen, L.M.; Pankow, J.S.; Hong, C.P.; Sinaiko, A.R. Changes in insulin resistance and cardiovascular risk during adolescence: Establishment of differential risk in males and females. Circulation 2008, 117, 2361–2368. [Google Scholar] [CrossRef]
- Freedman, D.S.; Bowman, B.A.; Otvos, J.D.; Srinivasan, S.R.; Berenson, G.S. Levels and correlates of LDL and VLDL particle sizes among children: The Bogalusa heart study. Atherosclerosis 2000, 152, 441–449. [Google Scholar] [CrossRef]
- Austin, M.A.; Breslow, J.L.; Hennekens, C.H.; Buring, J.E.; Willett, W.C.; Krauss, R.M. Low-density lipoprotein subclass patterns and risk of myocardial infarction. JAMA 1988, 260, 1917–1921. [Google Scholar] [CrossRef]
- Drouin-Chartier, J.P.; Cote, J.A.; Labonte, M.E.; Brassard, D.; Tessier-Grenier, M.; Desroches, S.; Couture, P.; Lamarche, B. Comprehensive Review of the Impact of Dairy Foods and Dairy Fat on Cardiometabolic Risk. Adv. Nutr. 2016, 7, 1041–1051. [Google Scholar] [CrossRef]
- Austin, M.A.; King, M.C.; Vranizan, K.M.; Krauss, R.M. Atherogenic lipoprotein phenotype. A proposed genetic marker for coronary heart disease risk. Circulation 1990, 82, 495–506. [Google Scholar] [CrossRef]
- Austin, M.A.; King, M.C.; Vranizan, K.M.; Newman, B.; Krauss, R.M. Inheritance of low-density lipoprotein subclass patterns: Results of complex segregation analysis. Am. J. Hum. Genet. 1988, 43, 838–846. [Google Scholar] [PubMed]
- Kang, H.S.; Gutin, B.; Barbeau, P.; Litaker, M.S.; Allison, J.; Le, N.A. Low-density lipoprotein particle size, central obesity, cardiovascular fitness, and insulin resistance syndrome markers in obese youths. Int. J. Obes. Relat. Metab. Disord. J. Int. Assoc. Study Obes. 2002, 26, 1030–1035. [Google Scholar] [CrossRef][Green Version]
- Miyashita, M.; Okada, T.; Kuromori, Y.; Harada, K. LDL particle size, fat distribution and insulin resistance in obese children. Eur. J. Clin. Nutr. 2006, 60, 416–420. [Google Scholar] [CrossRef] [PubMed]
- Ortega, F.B.; Lee, D.C.; Katzmarzyk, P.T.; Ruiz, J.R.; Sui, X.; Church, T.S.; Blair, S.N. The intriguing metabolically healthy but obese phenotype: Cardiovascular prognosis and role of fitness. Eur. Heart J. 2013, 34, 389–397. [Google Scholar] [CrossRef] [PubMed]
- Flegal, K.M.; Ogden, C.L.; Yanovski, J.A.; Freedman, D.S.; Shepherd, J.A.; Graubard, B.I.; Borrud, L.G. High adiposity and high body mass index-for-age in US children and adolescents overall and by race-ethnic group. Am. J. Clin. Nutr. 2010, 91, 1020–1026. [Google Scholar] [CrossRef] [PubMed]
- Lamb, M.M.; Ogden, C.L.; Carroll, M.D.; Lacher, D.A.; Flegal, K.M. Association of body fat percentage with lipid concentrations in children and adolescents: United States, 1999–2004. Am. J. Clin. Nutr. 2011, 94, 877–883. [Google Scholar] [CrossRef] [PubMed]
- Conwell, L.S.; Trost, S.G.; Spence, L.; Brown, W.J.; Batch, J.A. The feasibility of a home-based moderate-intensity physical activity intervention in obese children and adolescents. Br. J. Sports Med. 2010, 44, 250–255. [Google Scholar] [CrossRef]
- Tudor-Locke, C.; Craig, C.L.; Cameron, C.; Griffiths, J.M. Canadian children’s and youth’s pedometer-determined steps/day, parent-reported TV watching time, and overweight/obesity: The CANPLAY Surveillance Study. Int. J. Behav. Nutr. Phys. Act. 2011, 8, 66. [Google Scholar] [CrossRef]
- Lustig, R.H.; Mulligan, K.; Noworolski, S.M.; Tai, V.W.; Wen, M.J.; Erkin-Cakmak, A.; Gugliucci, A.; Schwarz, J.M. Isocaloric fructose restriction and metabolic improvement in children with obesity and metabolic syndrome. Obesity (Silver Spring) 2016, 24, 453–460. [Google Scholar] [CrossRef]
- Mager, D.R.; Iniguez, I.R.; Gilmour, S.; Yap, J. The effect of a low fructose and low glycemic index/load (FRAGILE) dietary intervention on indices of liver function, cardiometabolic risk factors, and body composition in children and adolescents with nonalcoholic fatty liver disease (NAFLD). JPEN J. Parenter. Enteral Nutr. 2015, 39, 73–84. [Google Scholar] [CrossRef]
- Schwimmer, J.B.; Ugalde-Nicalo, P.; Welsh, J.A.; Angeles, J.E.; Cordero, M.; Harlow, K.E.; Alazraki, A.; Durelle, J.; Knight-Scott, J.; Newton, K.P.; et al. Effect of a Low Free Sugar Diet vs Usual Diet on Nonalcoholic Fatty Liver Disease in Adolescent Boys: A Randomized Clinical Trial. JAMA 2019, 321, 256–265. [Google Scholar] [CrossRef] [PubMed]
- Chiavaroli, L.; de Souza, R.J.; Ha, V.; Cozma, A.I.; Mirrahimi, A.; Wang, D.D.; Yu, M.; Carleton, A.J.; Di Buono, M.; Jenkins, A.L.; et al. Effect of Fructose on Established Lipid Targets: A Systematic Review and Meta-Analysis of Controlled Feeding Trials. J. Am. Heart Assoc. 2015, 4, e001700. [Google Scholar] [CrossRef] [PubMed]
- Wiesner, P.; Leidl, K.; Boettcher, A.; Schmitz, G.; Liebisch, G. Lipid profiling of FPLC-separated lipoprotein fractions by electrospray ionization tandem mass spectrometry. J. Lipid Res. 2009, 50, 574–585. [Google Scholar] [CrossRef] [PubMed]
- Scherer, M.; Bottcher, A.; Schmitz, G.; Liebisch, G. Sphingolipid profiling of human plasma and FPLC-separated lipoprotein fractions by hydrophilic interaction chromatography tandem mass spectrometry. Biochim. Biophys. Acta 2011, 1811, 68–75. [Google Scholar] [CrossRef] [PubMed]
- Aerts, J.M.; Ottenhoff, R.; Powlson, A.S.; Grefhorst, A.; van Eijk, M.; Dubbelhuis, P.F.; Aten, J.; Kuipers, F.; Serlie, M.J.; Wennekes, T.; et al. Pharmacological inhibition of glucosylceramide synthase enhances insulin sensitivity. Diabetes 2007, 56, 1341–1349. [Google Scholar] [CrossRef] [PubMed]
- Chatterjee, S.; Bedja, D.; Mishra, S.; Amuzie, C.; Avolio, A.; Kass, D.A.; Berkowitz, D.; Renehan, M. Inhibition of glycosphingolipid synthesis ameliorates atherosclerosis and arterial stiffness in apolipoprotein E-/- mice and rabbits fed a high-fat and -cholesterol diet. Circulation 2014, 129, 2403–2413. [Google Scholar] [CrossRef]
- Kim, M.; Jung, S.; Lee, S.H.; Lee, J.H. Association between arterial stiffness and serum L-octanoylcarnitine and lactosylceramide in overweight middle-aged subjects: 3-year follow-up study. PLoS ONE 2015, 10, e0119519. [Google Scholar] [CrossRef]
- Chavez, J.A.; Siddique, M.M.; Wang, S.T.; Ching, J.; Shayman, J.A.; Summers, S.A. Ceramides and glucosylceramides are independent antagonists of insulin signaling. J. Biol. Chem. 2014, 289, 723–734. [Google Scholar] [CrossRef]
- Te Morenga, L.A.; Howatson, A.J.; Jones, R.M.; Mann, J. Dietary sugars and cardiometabolic risk: Systematic review and meta-analyses of randomized controlled trials of the effects on blood pressure and lipids. Am. J. Clin. Nutr. 2014, 100, 65–79. [Google Scholar] [CrossRef]
- Feig, D.I. The role of uric acid in the pathogenesis of hypertension in the young. J. Clin. Hypertens. (Greenwich) 2012, 14, 346–352. [Google Scholar] [CrossRef]
- Rho, Y.H.; Zhu, Y.; Choi, H.K. The epidemiology of uric acid and fructose. Semin. Nephrol. 2011, 31, 410–419. [Google Scholar] [CrossRef] [PubMed]
- Feig, D.I.; Johnson, R.J. Hyperuricemia in childhood primary hypertension. Hypertension 2003, 42, 247–252. [Google Scholar] [CrossRef] [PubMed]
- Nguyen, S.; Choi, H.K.; Lustig, R.H.; Hsu, C.Y. Sugar-sweetened beverages, serum uric acid, and blood pressure in adolescents. J. Pediatrics 2009, 154, 807–813. [Google Scholar] [CrossRef] [PubMed]
- Hwang, I.S.; Ho, H.; Hoffman, B.B.; Reaven, G.M. Fructose-induced insulin resistance and hypertension in rats. Hypertension 1987, 10, 512–516. [Google Scholar] [CrossRef]
- Lin, W.T.; Huang, H.L.; Huang, M.C.; Chan, T.F.; Ciou, S.Y.; Lee, C.Y.; Chiu, Y.W.; Duh, T.H.; Lin, P.L.; Wang, T.N.; et al. Effects on uric acid, body mass index and blood pressure in adolescents of consuming beverages sweetened with high-fructose corn syrup. Int. J. Obes. (Lond.) 2013, 37, 532–539. [Google Scholar] [CrossRef]
- Soedamah-Muthu, S.S.; Verberne, L.D.; Ding, E.L.; Engberink, M.F.; Geleijnse, J.M. Dairy consumption and incidence of hypertension: A dose-response meta-analysis of prospective cohort studies. Hypertension 2012, 60, 1131–1137. [Google Scholar] [CrossRef]
- Ralston, R.A.; Lee, J.H.; Truby, H.; Palermo, C.E.; Walker, K.Z. A systematic review and meta-analysis of elevated blood pressure and consumption of dairy foods. J. Hum. Hypertens. 2012, 26, 3–13. [Google Scholar] [CrossRef]
- Ding, M.; Huang, T.; Bergholdt, H.K.; Nordestgaard, B.G.; Ellervik, C.; Qi, L.; Consortium, C. Dairy consumption, systolic blood pressure, and risk of hypertension: Mendelian randomization study. BMJ 2017, 356, j1000. [Google Scholar] [CrossRef]
- Hidayat, K.; Du, H.Z.; Yang, J.; Chen, G.C.; Zhang, Z.; Li, Z.N.; Qin, L.Q. Effects of milk proteins on blood pressure: A meta-analysis of randomized control trials. Hypertens. Res. 2017, 40, 264–270. [Google Scholar] [CrossRef]


| Mean ± SD | |
|---|---|
| Age, y | 15.3 ± 1.5 |
| Weight, kg | 86.8 ± 15.7 |
| BMI, z-score | 1.8 ± 0.5 |
| Body fat, % | 29 ± 9 |
| Systolic BP, mmHg | 119 ± 9 |
| Systolic BP, z-score | 0.2 ± 0.8 |
| Diastolic BP, mmHg | 60 ± 6 |
| Diastolic BP, z-score | −0.5 ± 0.6 |
| Triglyceride, mmol/L | 1.02 ± 0.48 |
| Total cholesterol, mmol/L | 3.75 ± 0.50 |
| LDL-cholesterol, mmol/L | 2.14 ± 0.39 |
| HDL-cholesterol, mmol/L | 1.15 ± 0.26 |
| Glucose, mmol/L | 5.64 ± 0.28 |
| Baseline | Soda | Milk | p-Value 3 (milk vs. soda) | |
|---|---|---|---|---|
| Carbohydrate, %E | 48.8 ± 2.1 | 47.2 ± 1.4 | 41.5 ± 1.4 | 0.0002 |
| Sugar, %E | 23 ± 2 | 22± 1 | 16 ± 1 | <0.0001 |
| Total fat, %E | 36.1 ± 1.4 | 37.4 ± 1.3 | 38.5 ± 1.0 | 0.35 |
| SFA, %E | 12.7 ± 0.5 | 13.0 ± 0.6 | 14.8 ± 0.5 | 0.004 |
| MUFA, %E | 13.1 ± 0.6 | 14.2 ± 0.6 | 13.7 ± 0.5 | 0.53 |
| PUFA, %E | 7.1 ± 0.5 | 7.9 ± 3.2 | 6.7 ± 0.4 | 0.02 |
| Protein, %E | 16.1 ± 0.7 | 16.0 ± 0.7 | 20.1 ± 0.8 | <0.0001 |
| Calcium, mg | 995 ± 115 | 716 ± 58 | 1389 ± 108 | <0.0001 |
| Cholesterol, mg | 281 ± 30 | 275 ± 35 | 328 ± 30 | 0.13 |
| Magnesium, mg | 252 ± 29 | 199 ± 15 | 261 ± 18 | 0.0002 |
| Potassium, mg | 2225 ± 214 | 1680 ± 161 | 2392 ± 153 | <0.0001 |
| Zinc, mg | 12.6 ± 1.1 | 10.6 ± 0.7 | 14.0 ± 1.0 | 0.002 |
| Caffeine, mg | 23.7 ± 5.6 | 21.4 ± 4.2 | 4.1 ± 1.6 | 0.0002 |
| Soda | Milk | p-Value 2 | |
|---|---|---|---|
| Weight, kg | 87.7 ± 16.1 | 87.7 ± 16.2 | 0.43 |
| Waist circumference, cm | 86 ± 10 | 88 ± 12 | 0.32 |
| Body fat, % | 29 ± 10 | 30 ± 10 | 0.27 |
| LDL peak particle diameter, nm | 22.4 ± 0.6 | 22.4 ± 0.5 | 0.73 |
| Systolic BP, mmHg | 118 ± 10 | 116 ± 7 | 0.06 |
| Systolic BP, z-score | 0.2 ± 1.0 | 0.0 ± 0.8 | 0.04 |
| Diastolic BP, mmHg | 62 ± 6 | 62 ± 4 | 0.82 |
| Diastolic BP, z-score | −0.4 ± 0.5 | −0.4 ± 0.4 | 0.69 |
| Triglyceride, mmol/L | 0.89 ± 0.49 | 1.05 ± 0.66 | 0.09 |
| Total cholesterol, mmol/L | 3.56 ± 0.52 | 3.60 ± 0.55 | 0.53 |
| LDL-cholesterol, mmol/L | 2.04 ± 0.41 | 2.02 ± 0.43 | 0.63 |
| HDL-cholesterol, mmol/L | 1.10 ± 0.27 | 1.10 ± 0.25 | 0.84 |
| Apolipoprotein B, g/dL | 0.60 ± 0.13 | 0.61 ± 0.15 | 0.48 |
| Apolipoprotein A1, g/dL | 1.16 ± 0.21 | 1.17 ± 0.20 | 0.57 |
| Lipoprotein particle concentrations, nmol/L | |||
| Large VLDL | 12.2 ± 8.3 | 15.2 ± 11.1 | 0.14 |
| Medium VLDL | 33.8 ± 18 | 37.7 ± 20.3 | 0.25 |
| Small VLDL | 31.6 ± 10.3 | 32 ± 11.2 | 0.84 |
| IDL | 82.9 ± 21.3 | 85.5 ± 25 | 0.76 |
| Large LDL | 490 ± 142 | 501 ± 132 | 0.61 |
| Med LDL | 134 ± 63 | 134 ± 63 | 0.09 |
| Small LDL | 89 ± 41 | 101± 59 | 0.21 |
| Very small LDL | 143 ± 48 | 136 ± 37 | 0.26 |
| Small HDL | 12,930 ± 2176 | 13,434 ± 2522 | 0.15 |
| Large HDL | 5481 ± 1078 | 5596 ± 1200 | 0.48 |
| HOMA-IR | 0.54 ± 0.21 | 0.54 ± 0.23 | 0.96 |
| Uric acid, μmol/L | 381 ± 58 | 362 ± 62 | 0.02 |
| hsCRP, nmol/L | 11.6 ± 13.4 | 10.6 ± 11.1 | 0.75 |
| ALT, U/L | 27.2 ± 7.7 | 28.4 ± 8.3 | 0.39 |
| AST, U/L | 20.9 ± 5.2 | 22.4 ± 4.9 | 0.09 |
© 2020 by the authors. Licensee MDPI, Basel, Switzerland. This article is an open access article distributed under the terms and conditions of the Creative Commons Attribution (CC BY) license (http://creativecommons.org/licenses/by/4.0/).
Share and Cite
Chiu, S.; Siri-Tarino, P.; Bergeron, N.; Suh, J.H.; Krauss, R.M. A Randomized Study of the Effect of Replacing Sugar-Sweetened Soda by Reduced Fat Milk on Cardiometabolic Health in Male Adolescent Soda Drinkers. Nutrients 2020, 12, 405. https://doi.org/10.3390/nu12020405
Chiu S, Siri-Tarino P, Bergeron N, Suh JH, Krauss RM. A Randomized Study of the Effect of Replacing Sugar-Sweetened Soda by Reduced Fat Milk on Cardiometabolic Health in Male Adolescent Soda Drinkers. Nutrients. 2020; 12(2):405. https://doi.org/10.3390/nu12020405
Chicago/Turabian StyleChiu, Sally, Patty Siri-Tarino, Nathalie Bergeron, Jung H. Suh, and Ronald M. Krauss. 2020. "A Randomized Study of the Effect of Replacing Sugar-Sweetened Soda by Reduced Fat Milk on Cardiometabolic Health in Male Adolescent Soda Drinkers" Nutrients 12, no. 2: 405. https://doi.org/10.3390/nu12020405
APA StyleChiu, S., Siri-Tarino, P., Bergeron, N., Suh, J. H., & Krauss, R. M. (2020). A Randomized Study of the Effect of Replacing Sugar-Sweetened Soda by Reduced Fat Milk on Cardiometabolic Health in Male Adolescent Soda Drinkers. Nutrients, 12(2), 405. https://doi.org/10.3390/nu12020405