The Specific Carbohydrate Diet and Diet Modification as Induction Therapy for Pediatric Crohn’s Disease: A Randomized Diet Controlled Trial

 ,
,  ,
,  ,
,
Abstract
:1. Introduction
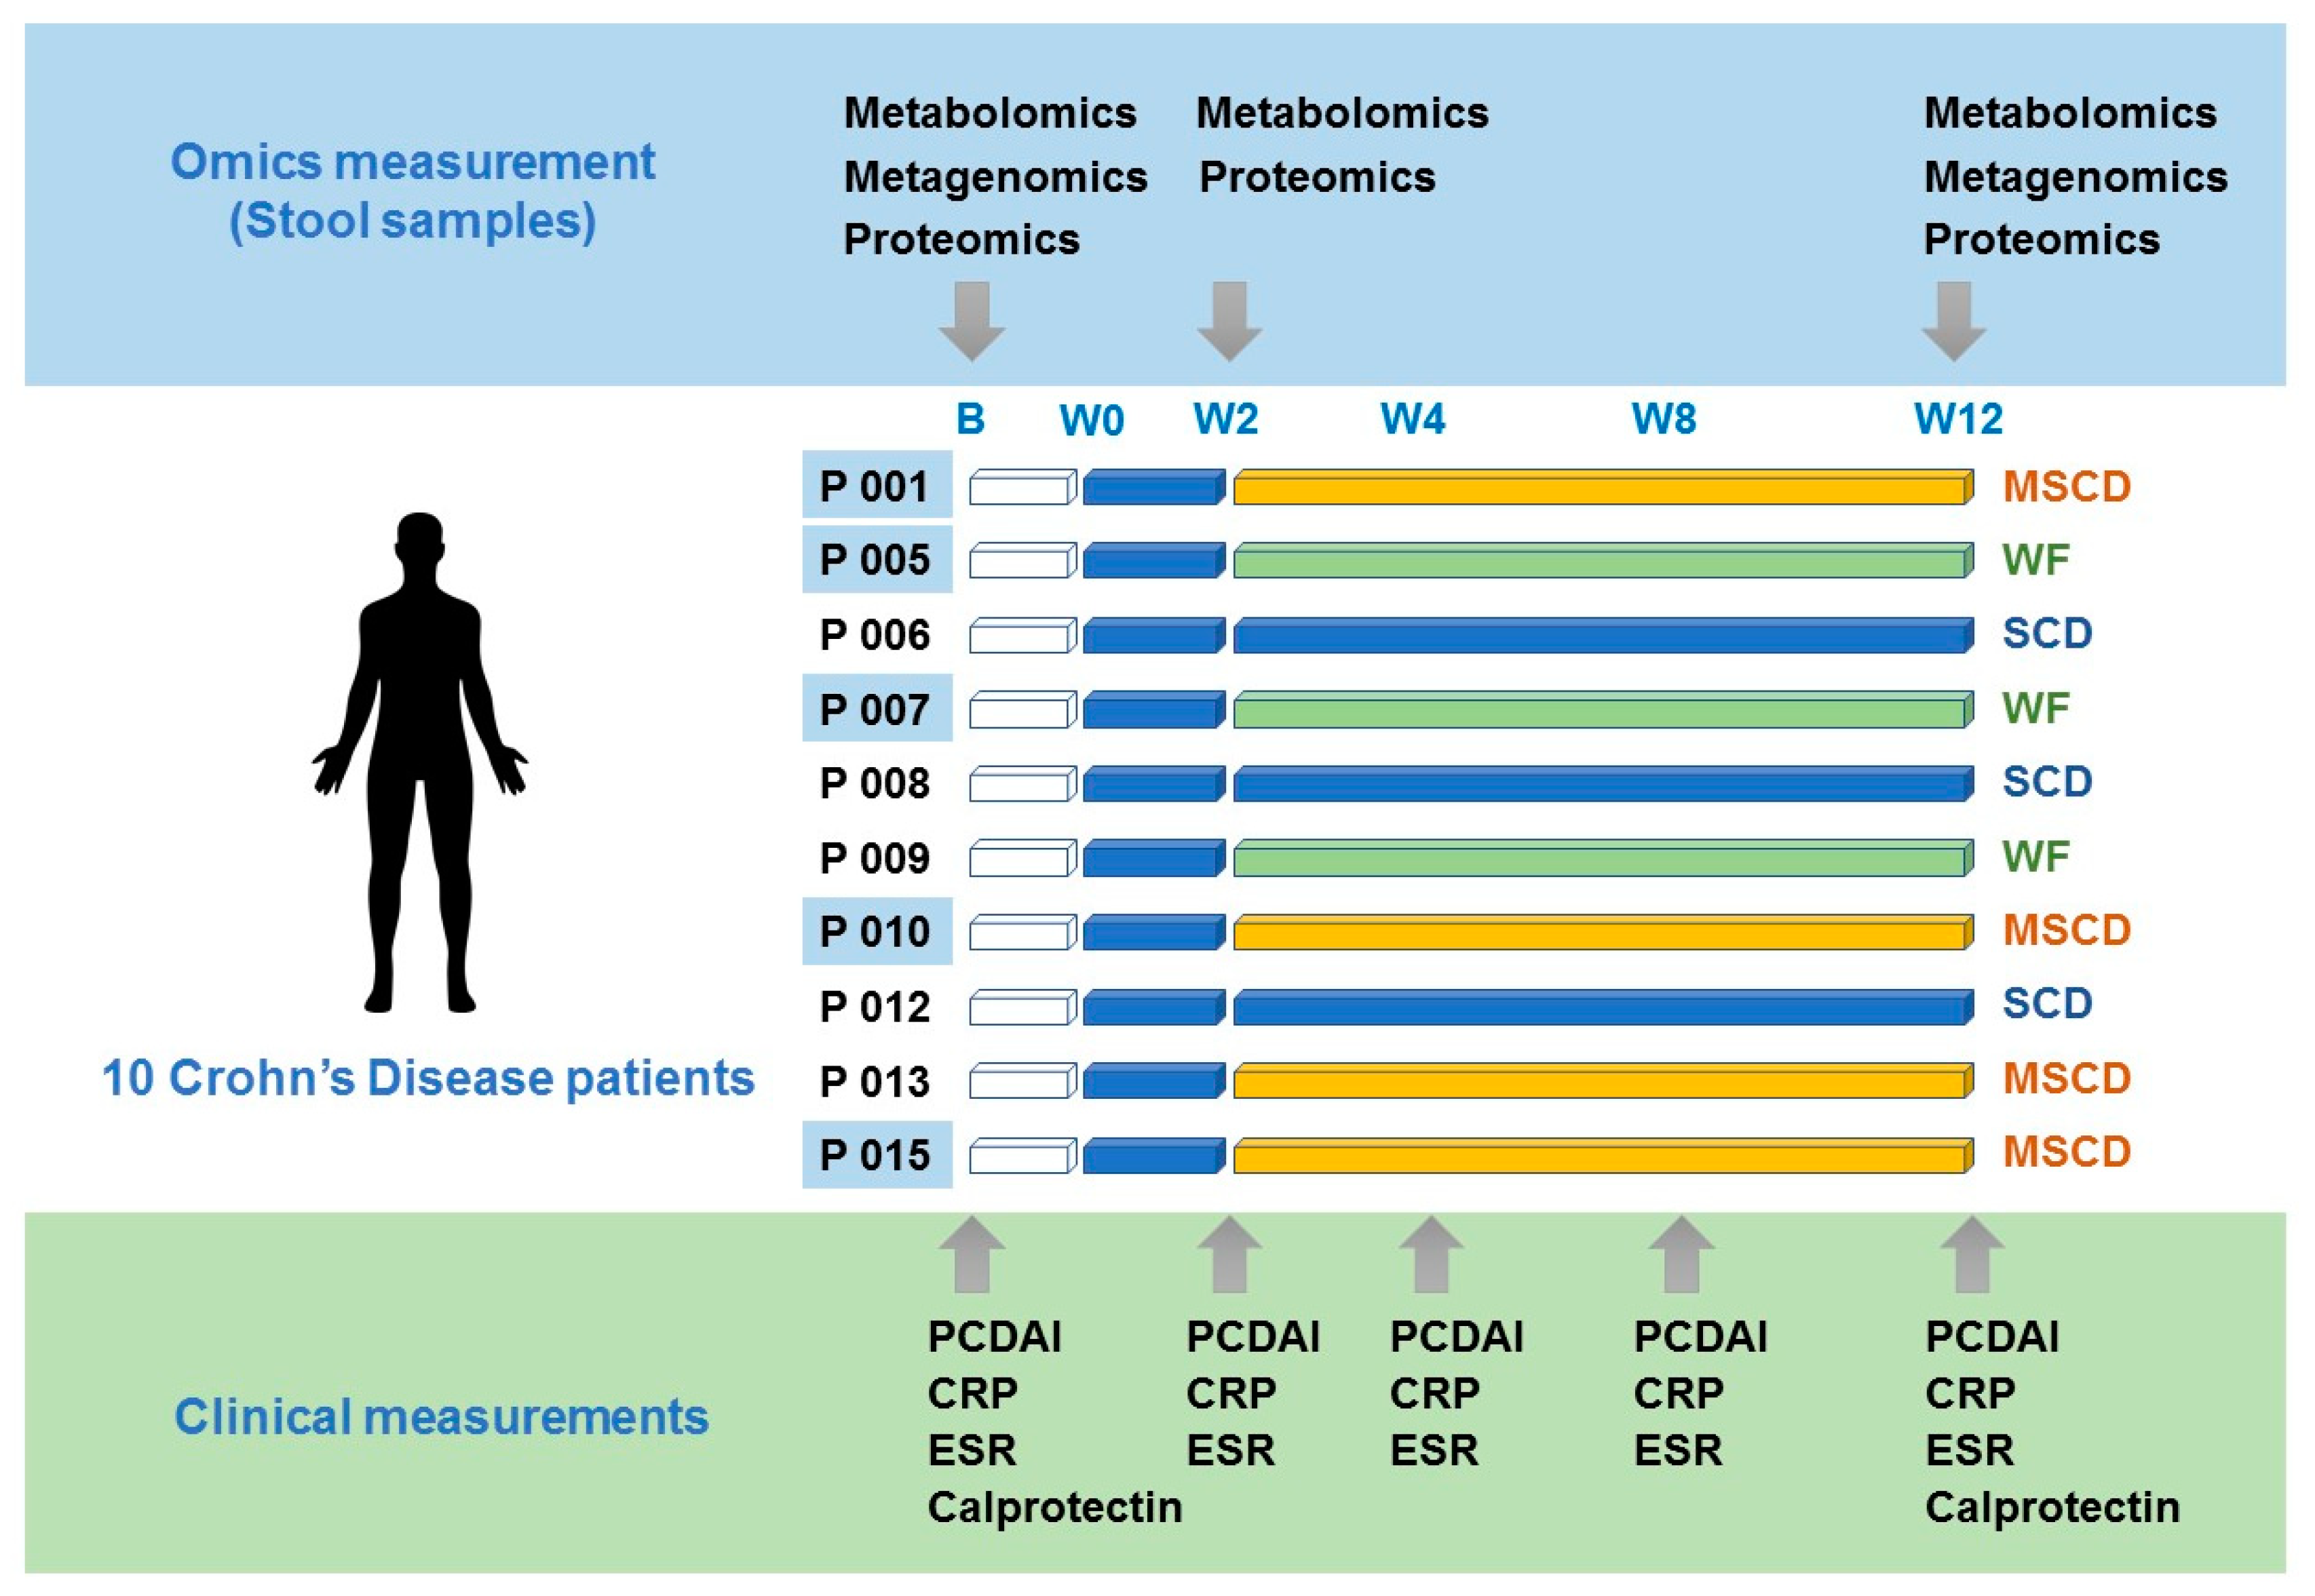
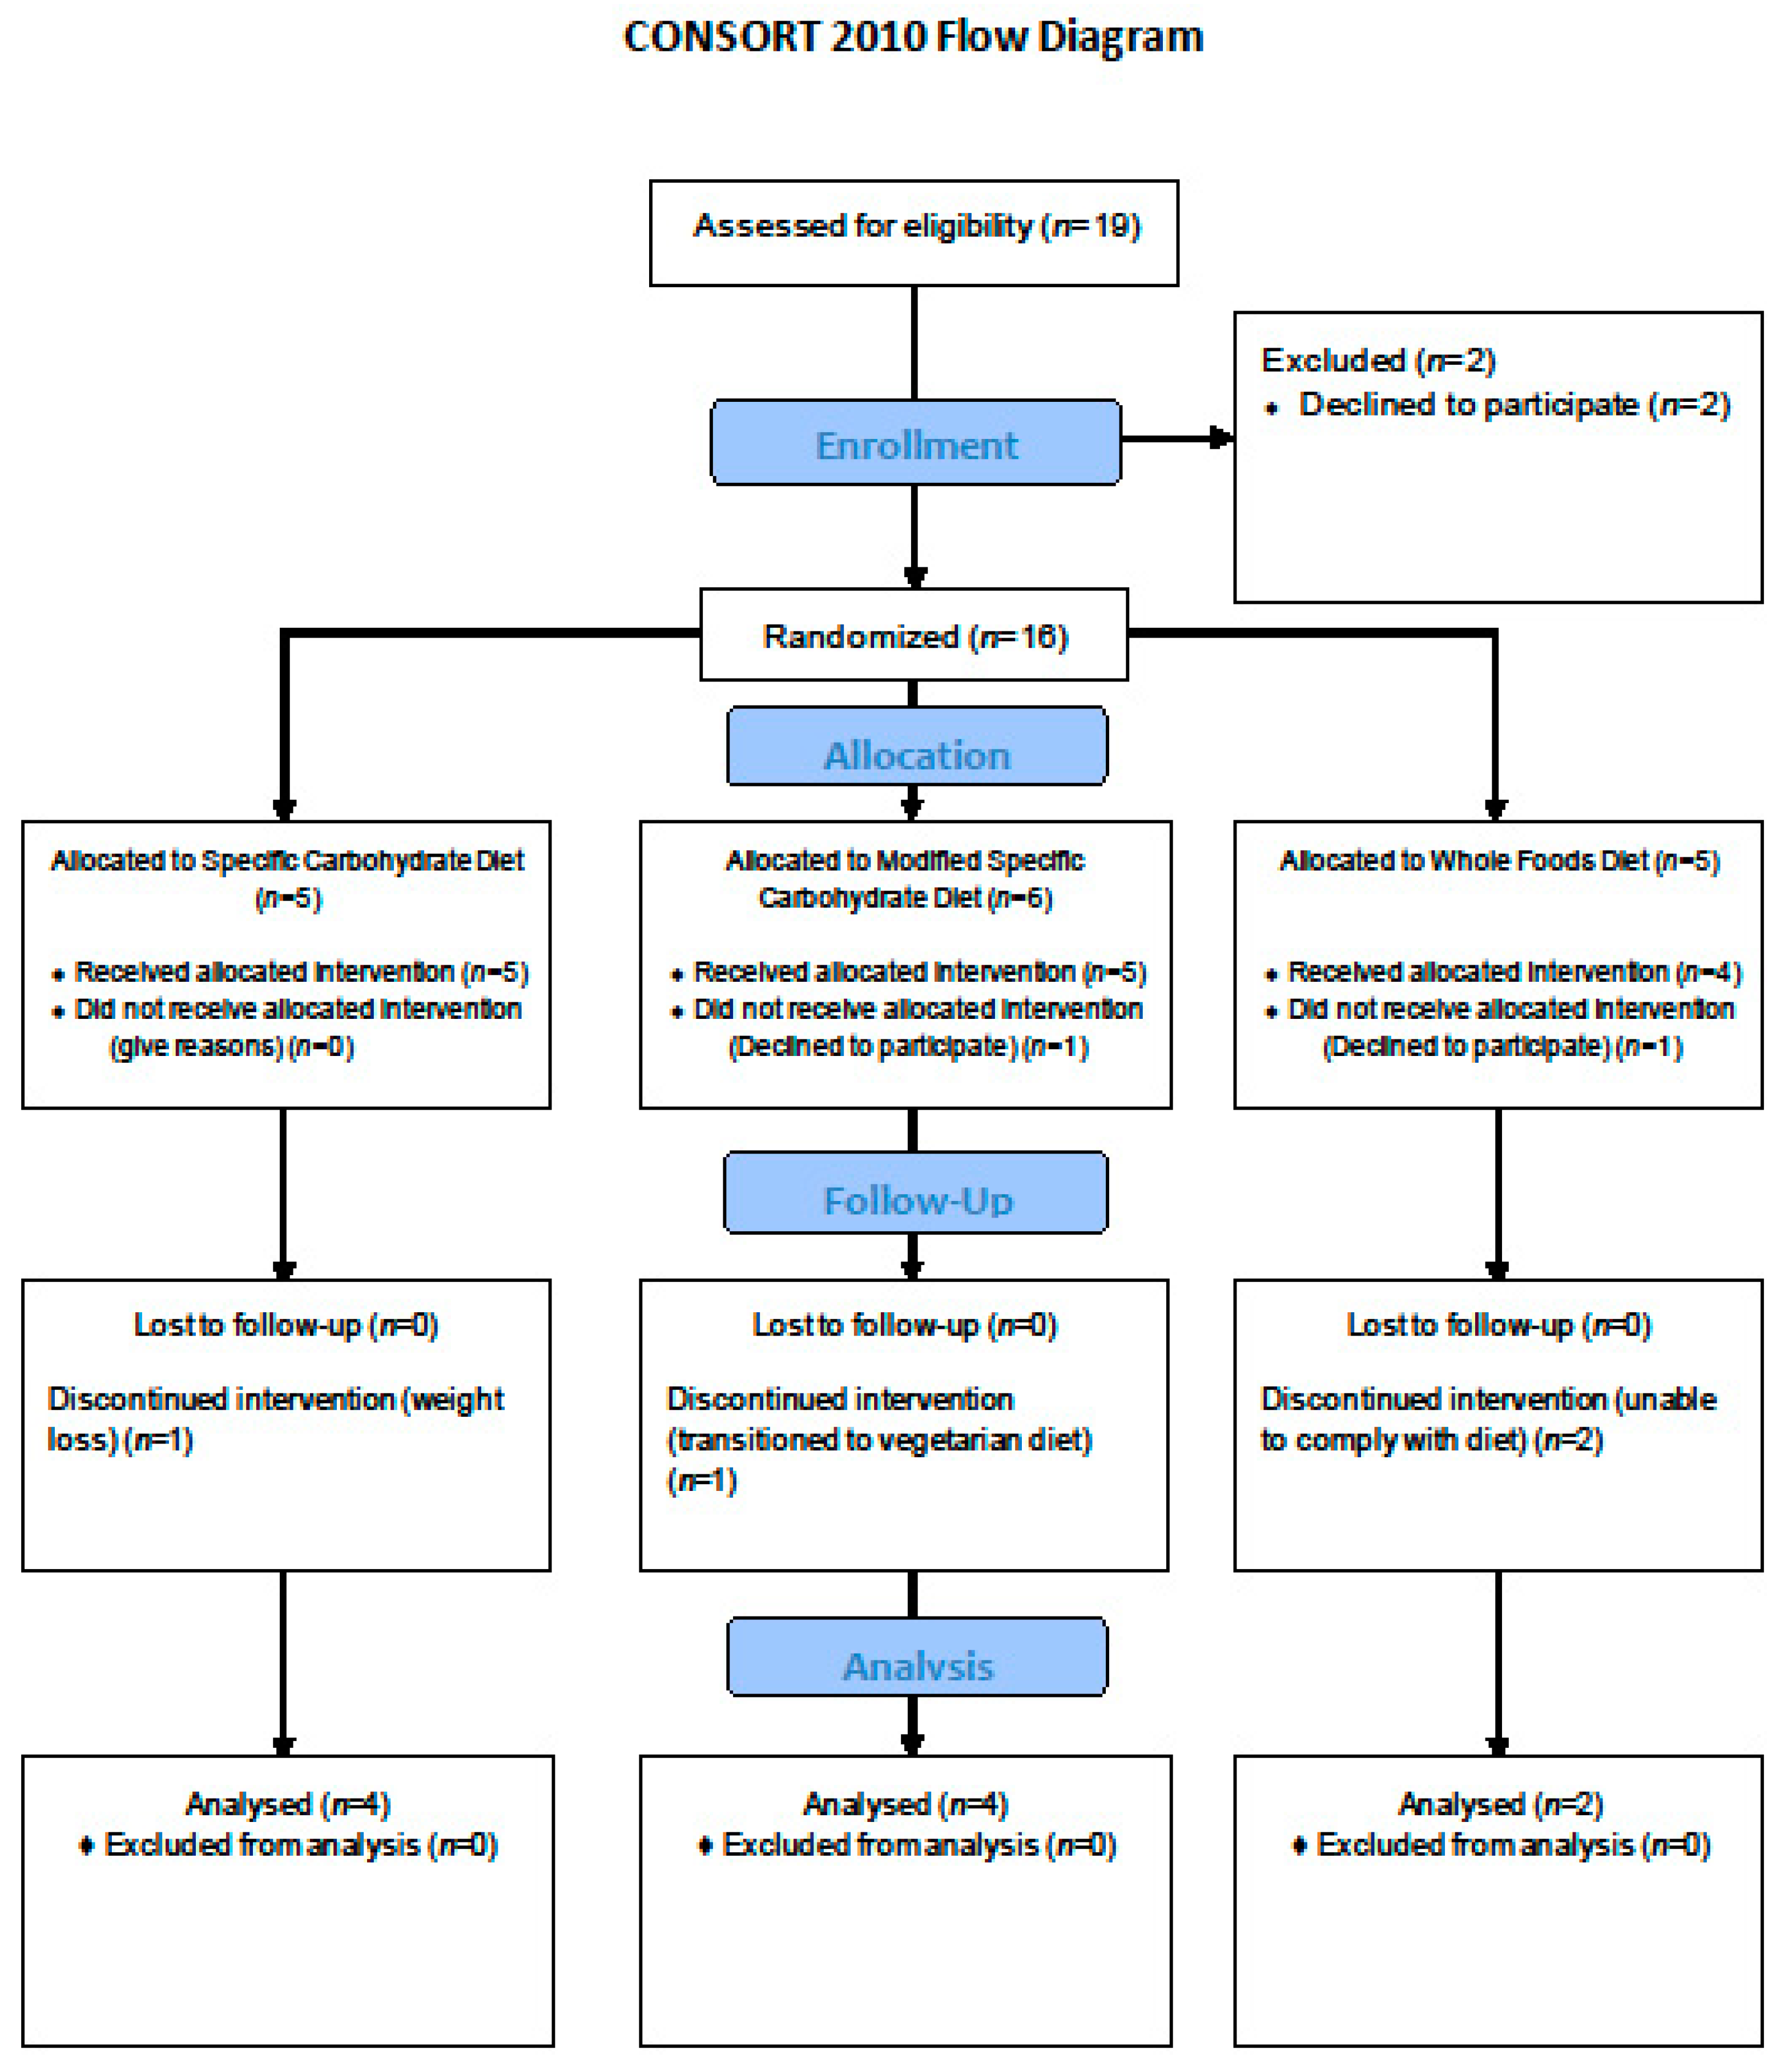
2. Materials and Methods
2.1. Study Setting and Participants
2.2. Randomization and Blinding
Study Intervention
2.3. Assessment of Participants
2.4. Metagenomics
2.5. Protein/Metabolite Extraction
2.6. Metaproteomics
2.7. Metabolomics
2.8. Data Analysis
3. Results
3.1. Participant Characteristics
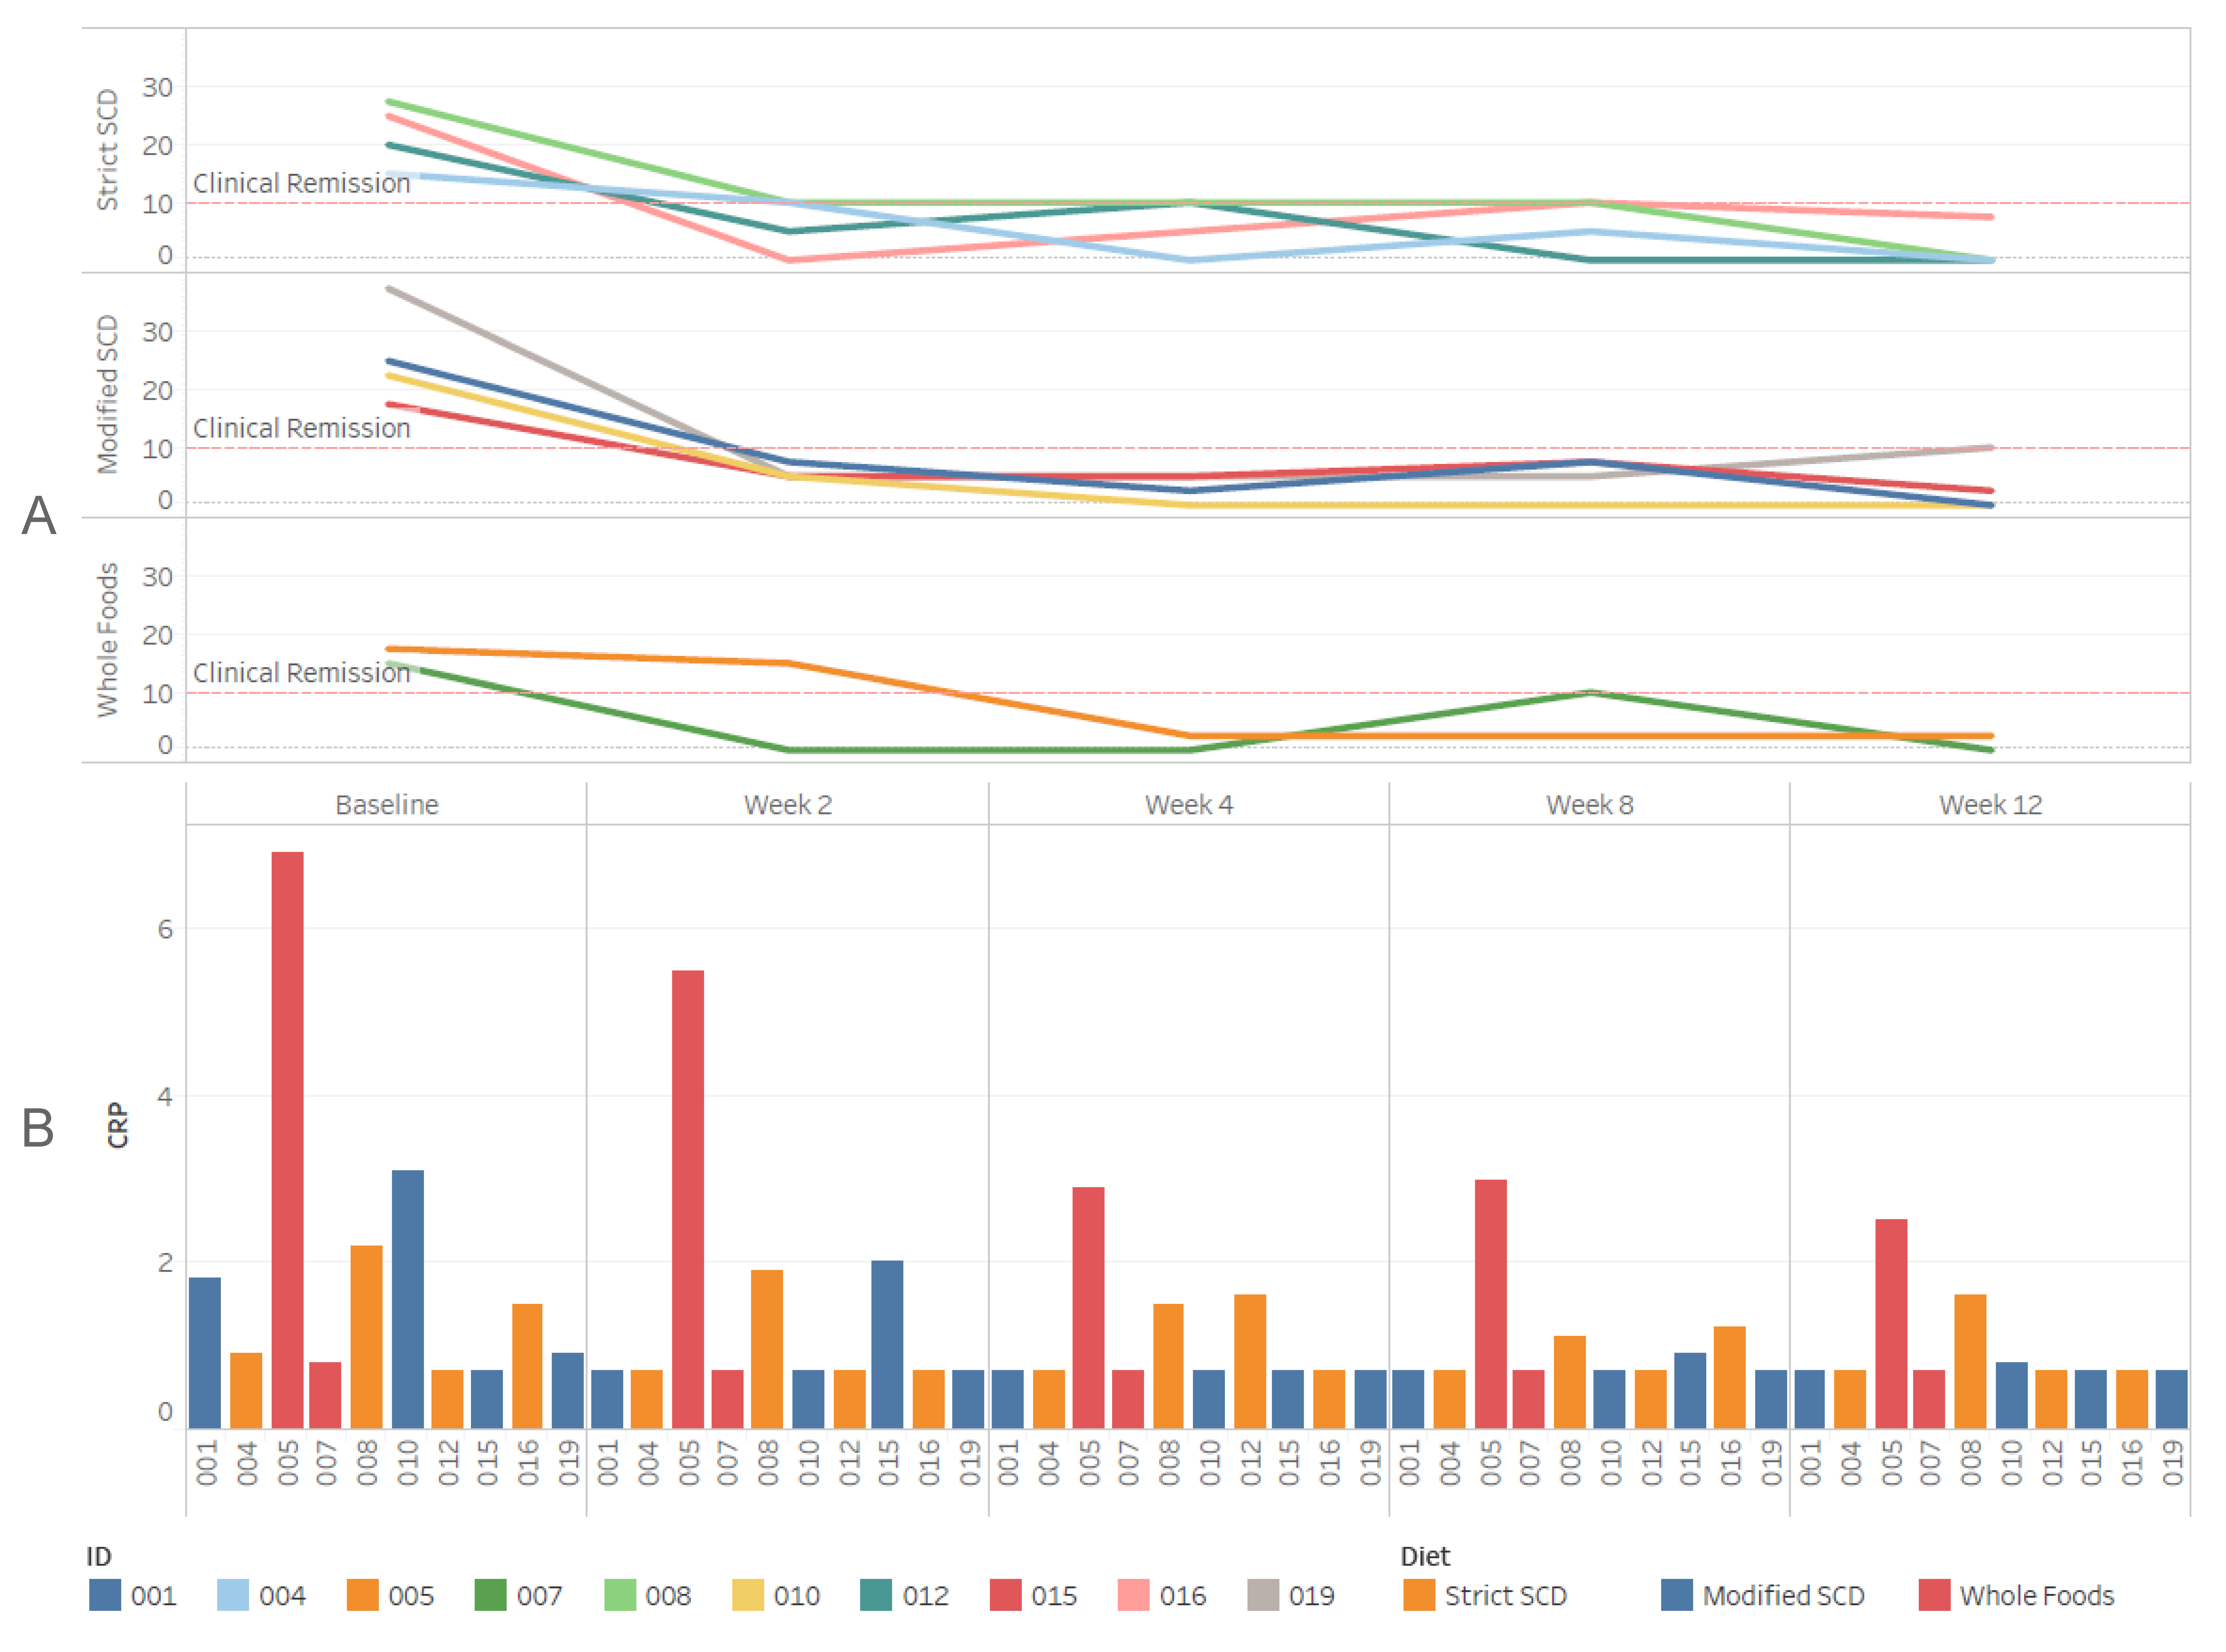
3.2. Clinical Outcomes
3.3. Specific Carbohydrate Diet
3.4. Modified SCD
3.5. Whole Food
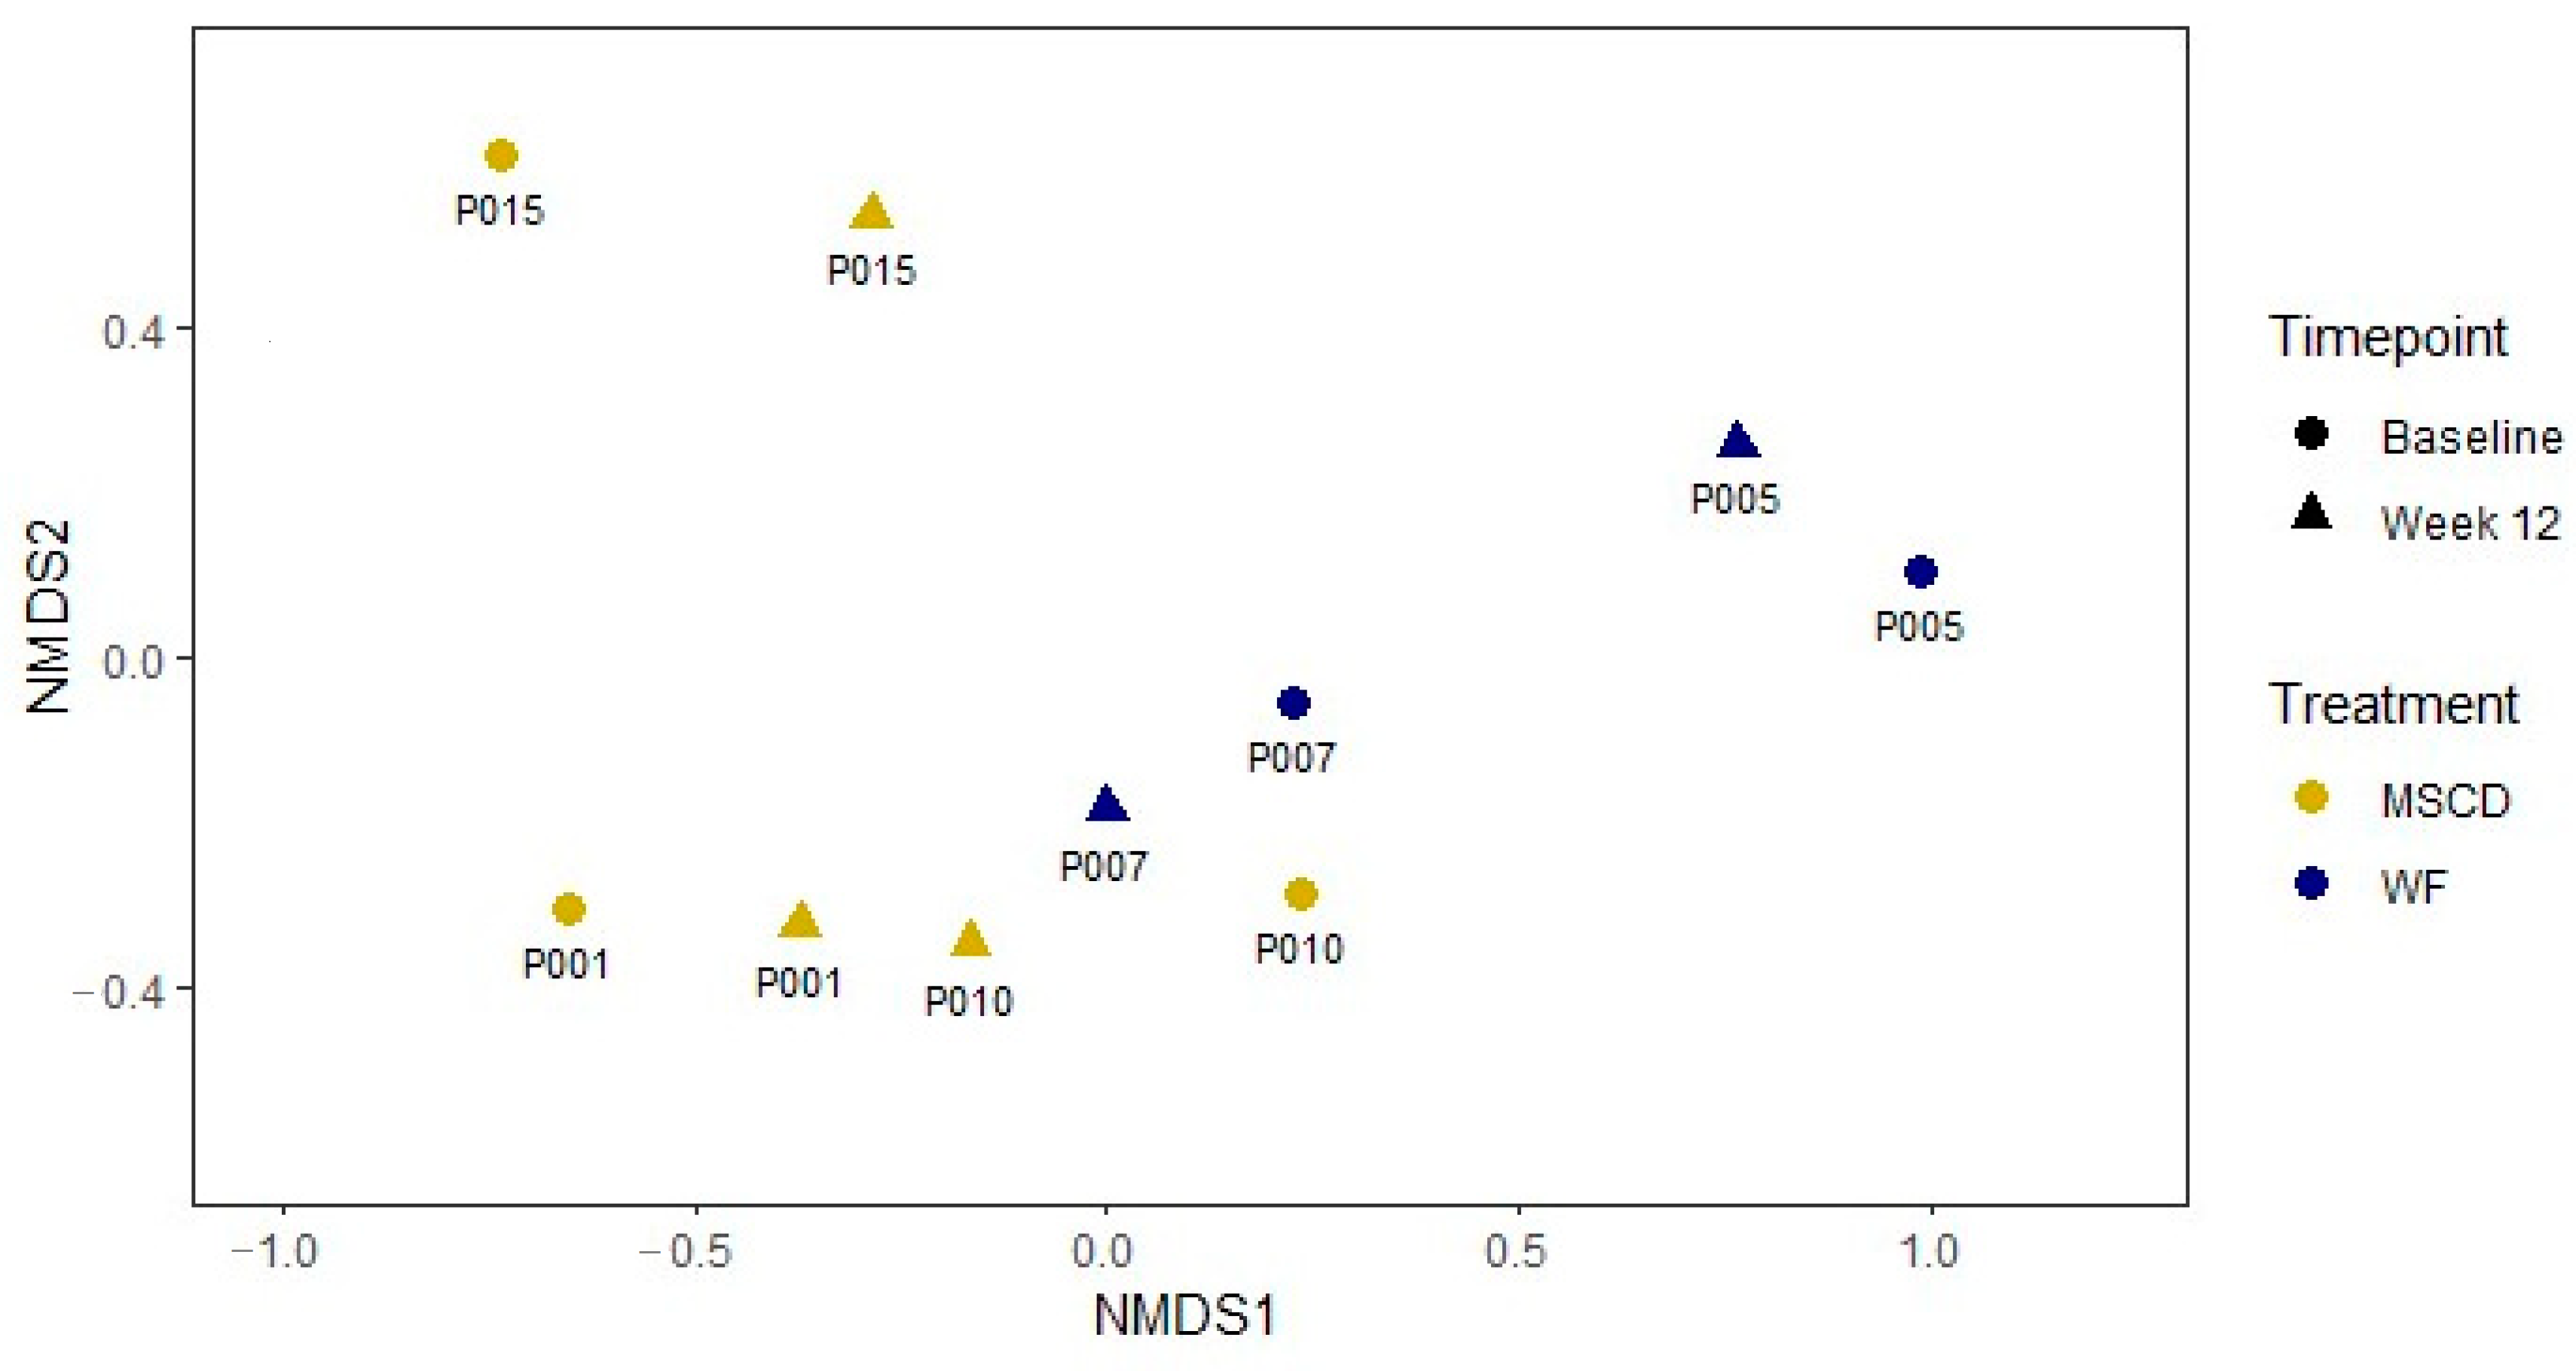
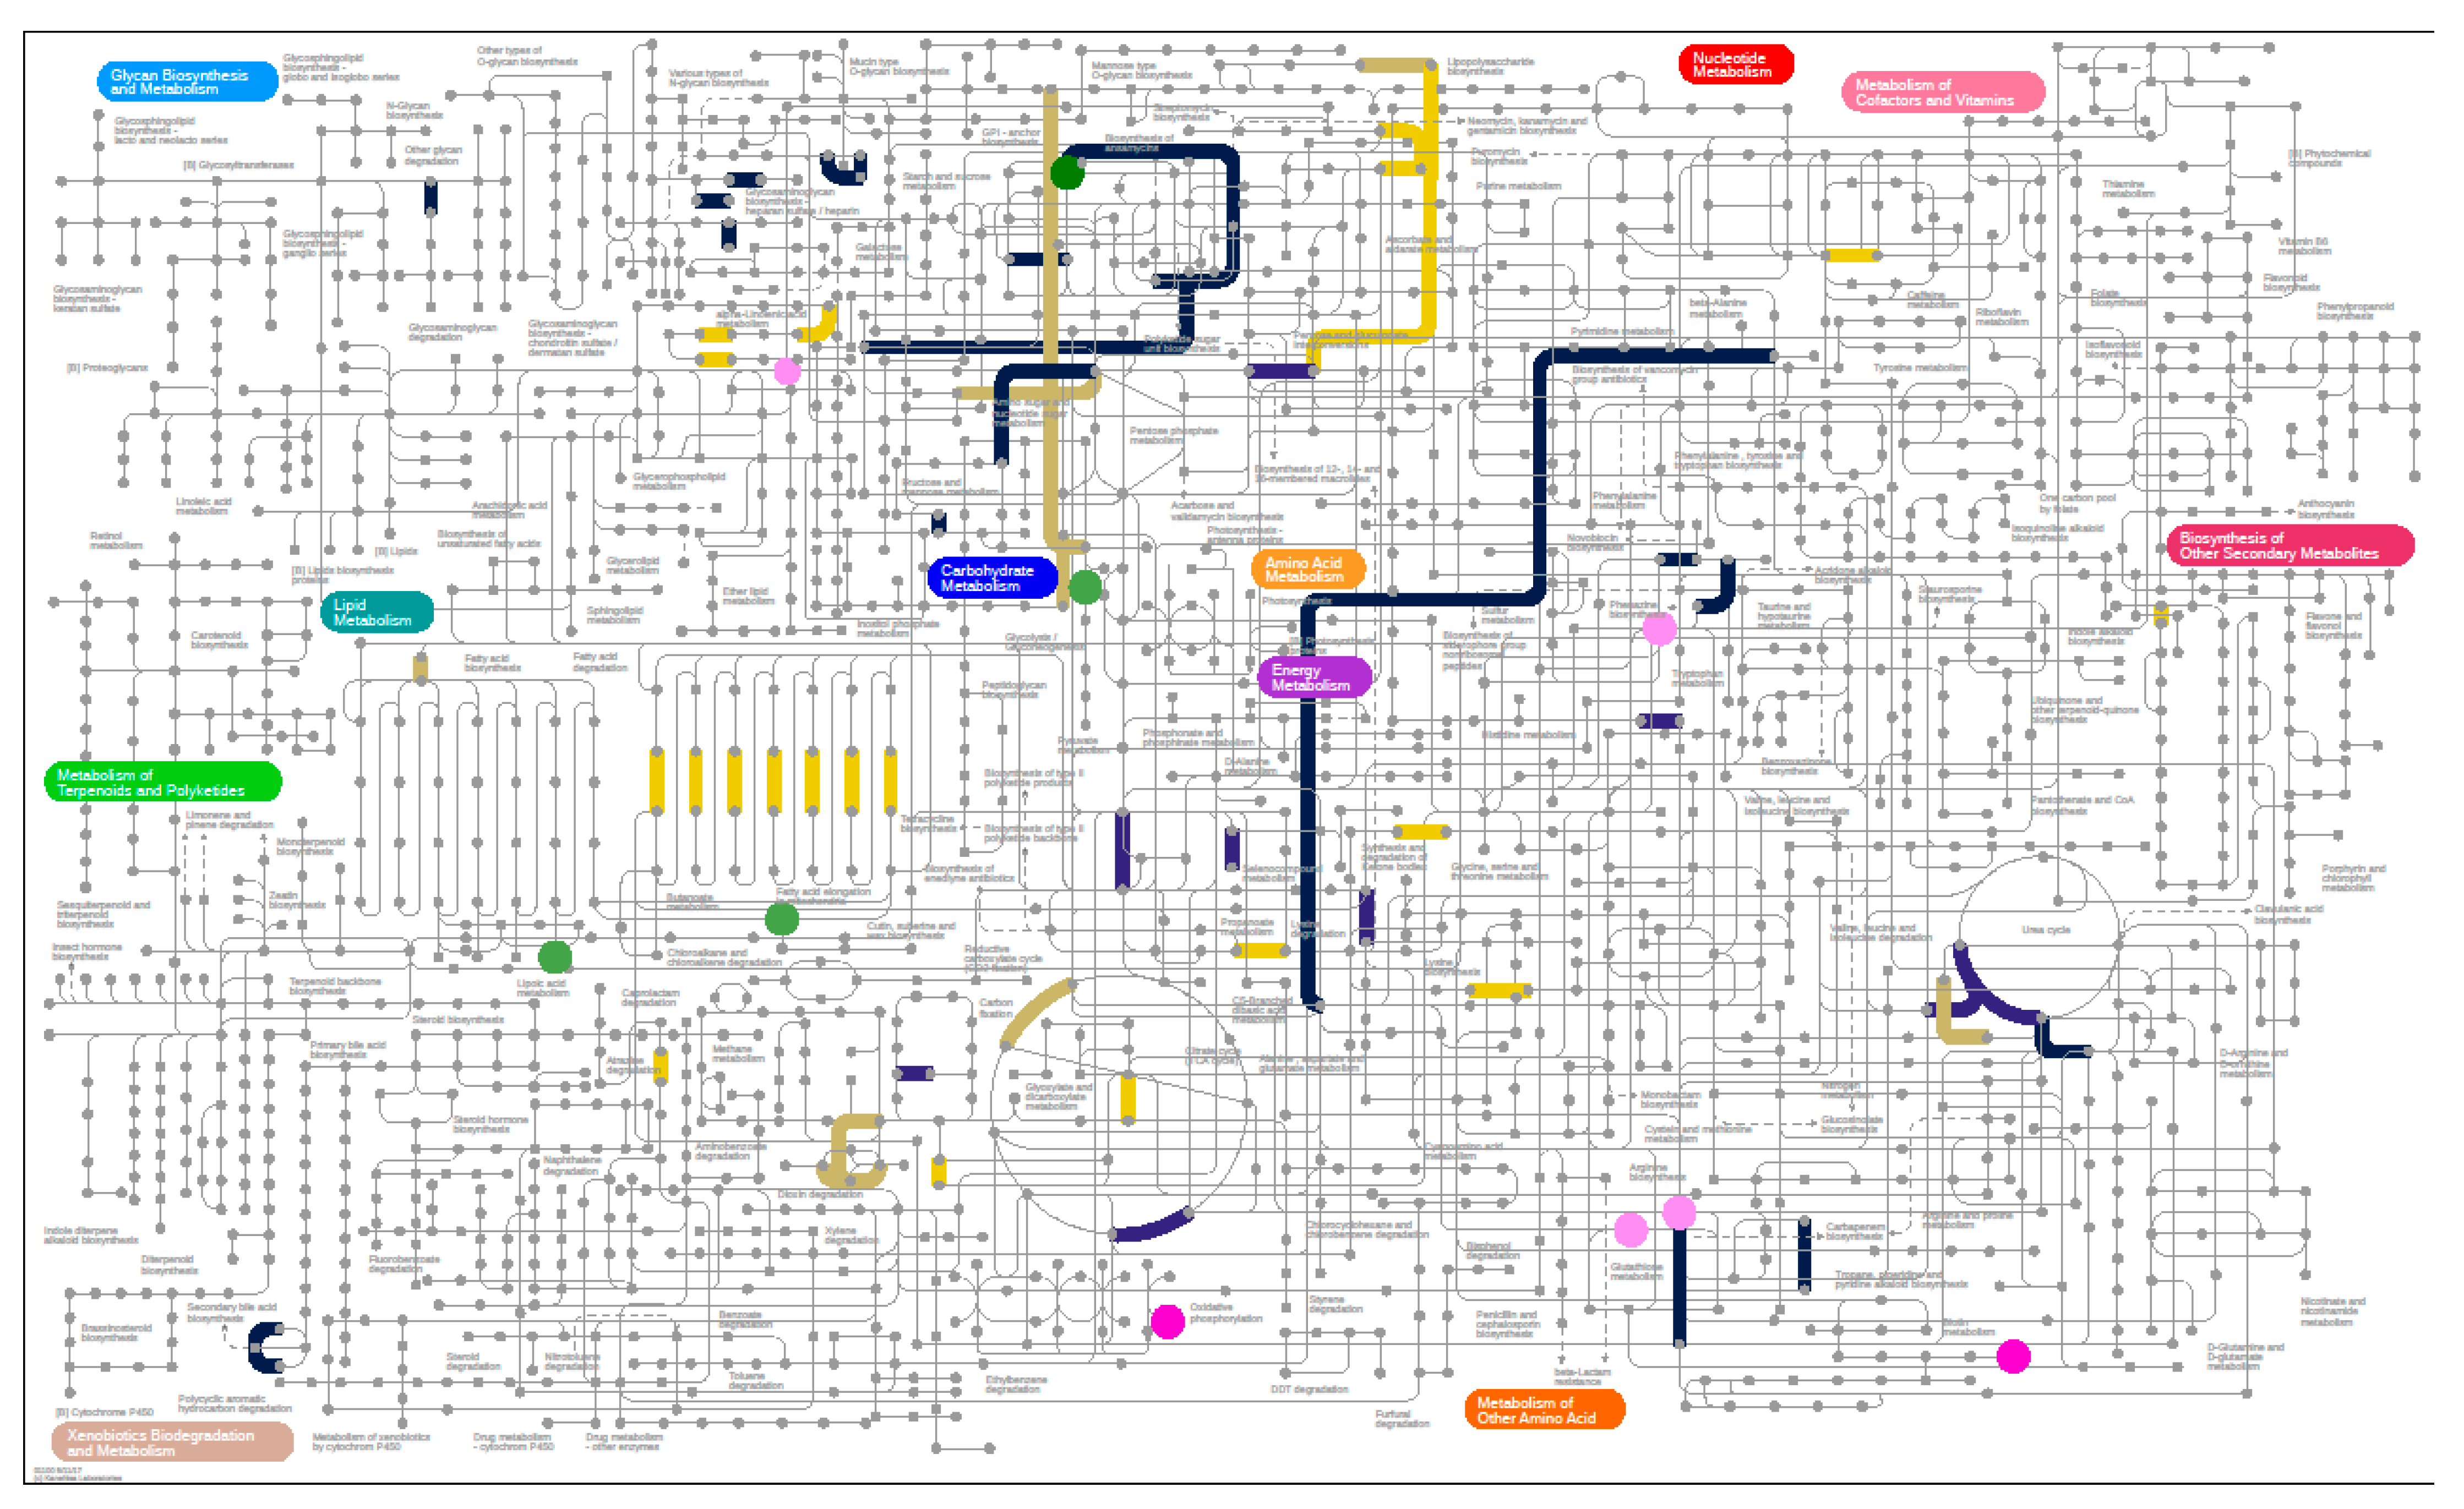
3.6. Microbiome
3.6.1. Metagenomics
3.6.2. Metabolomics
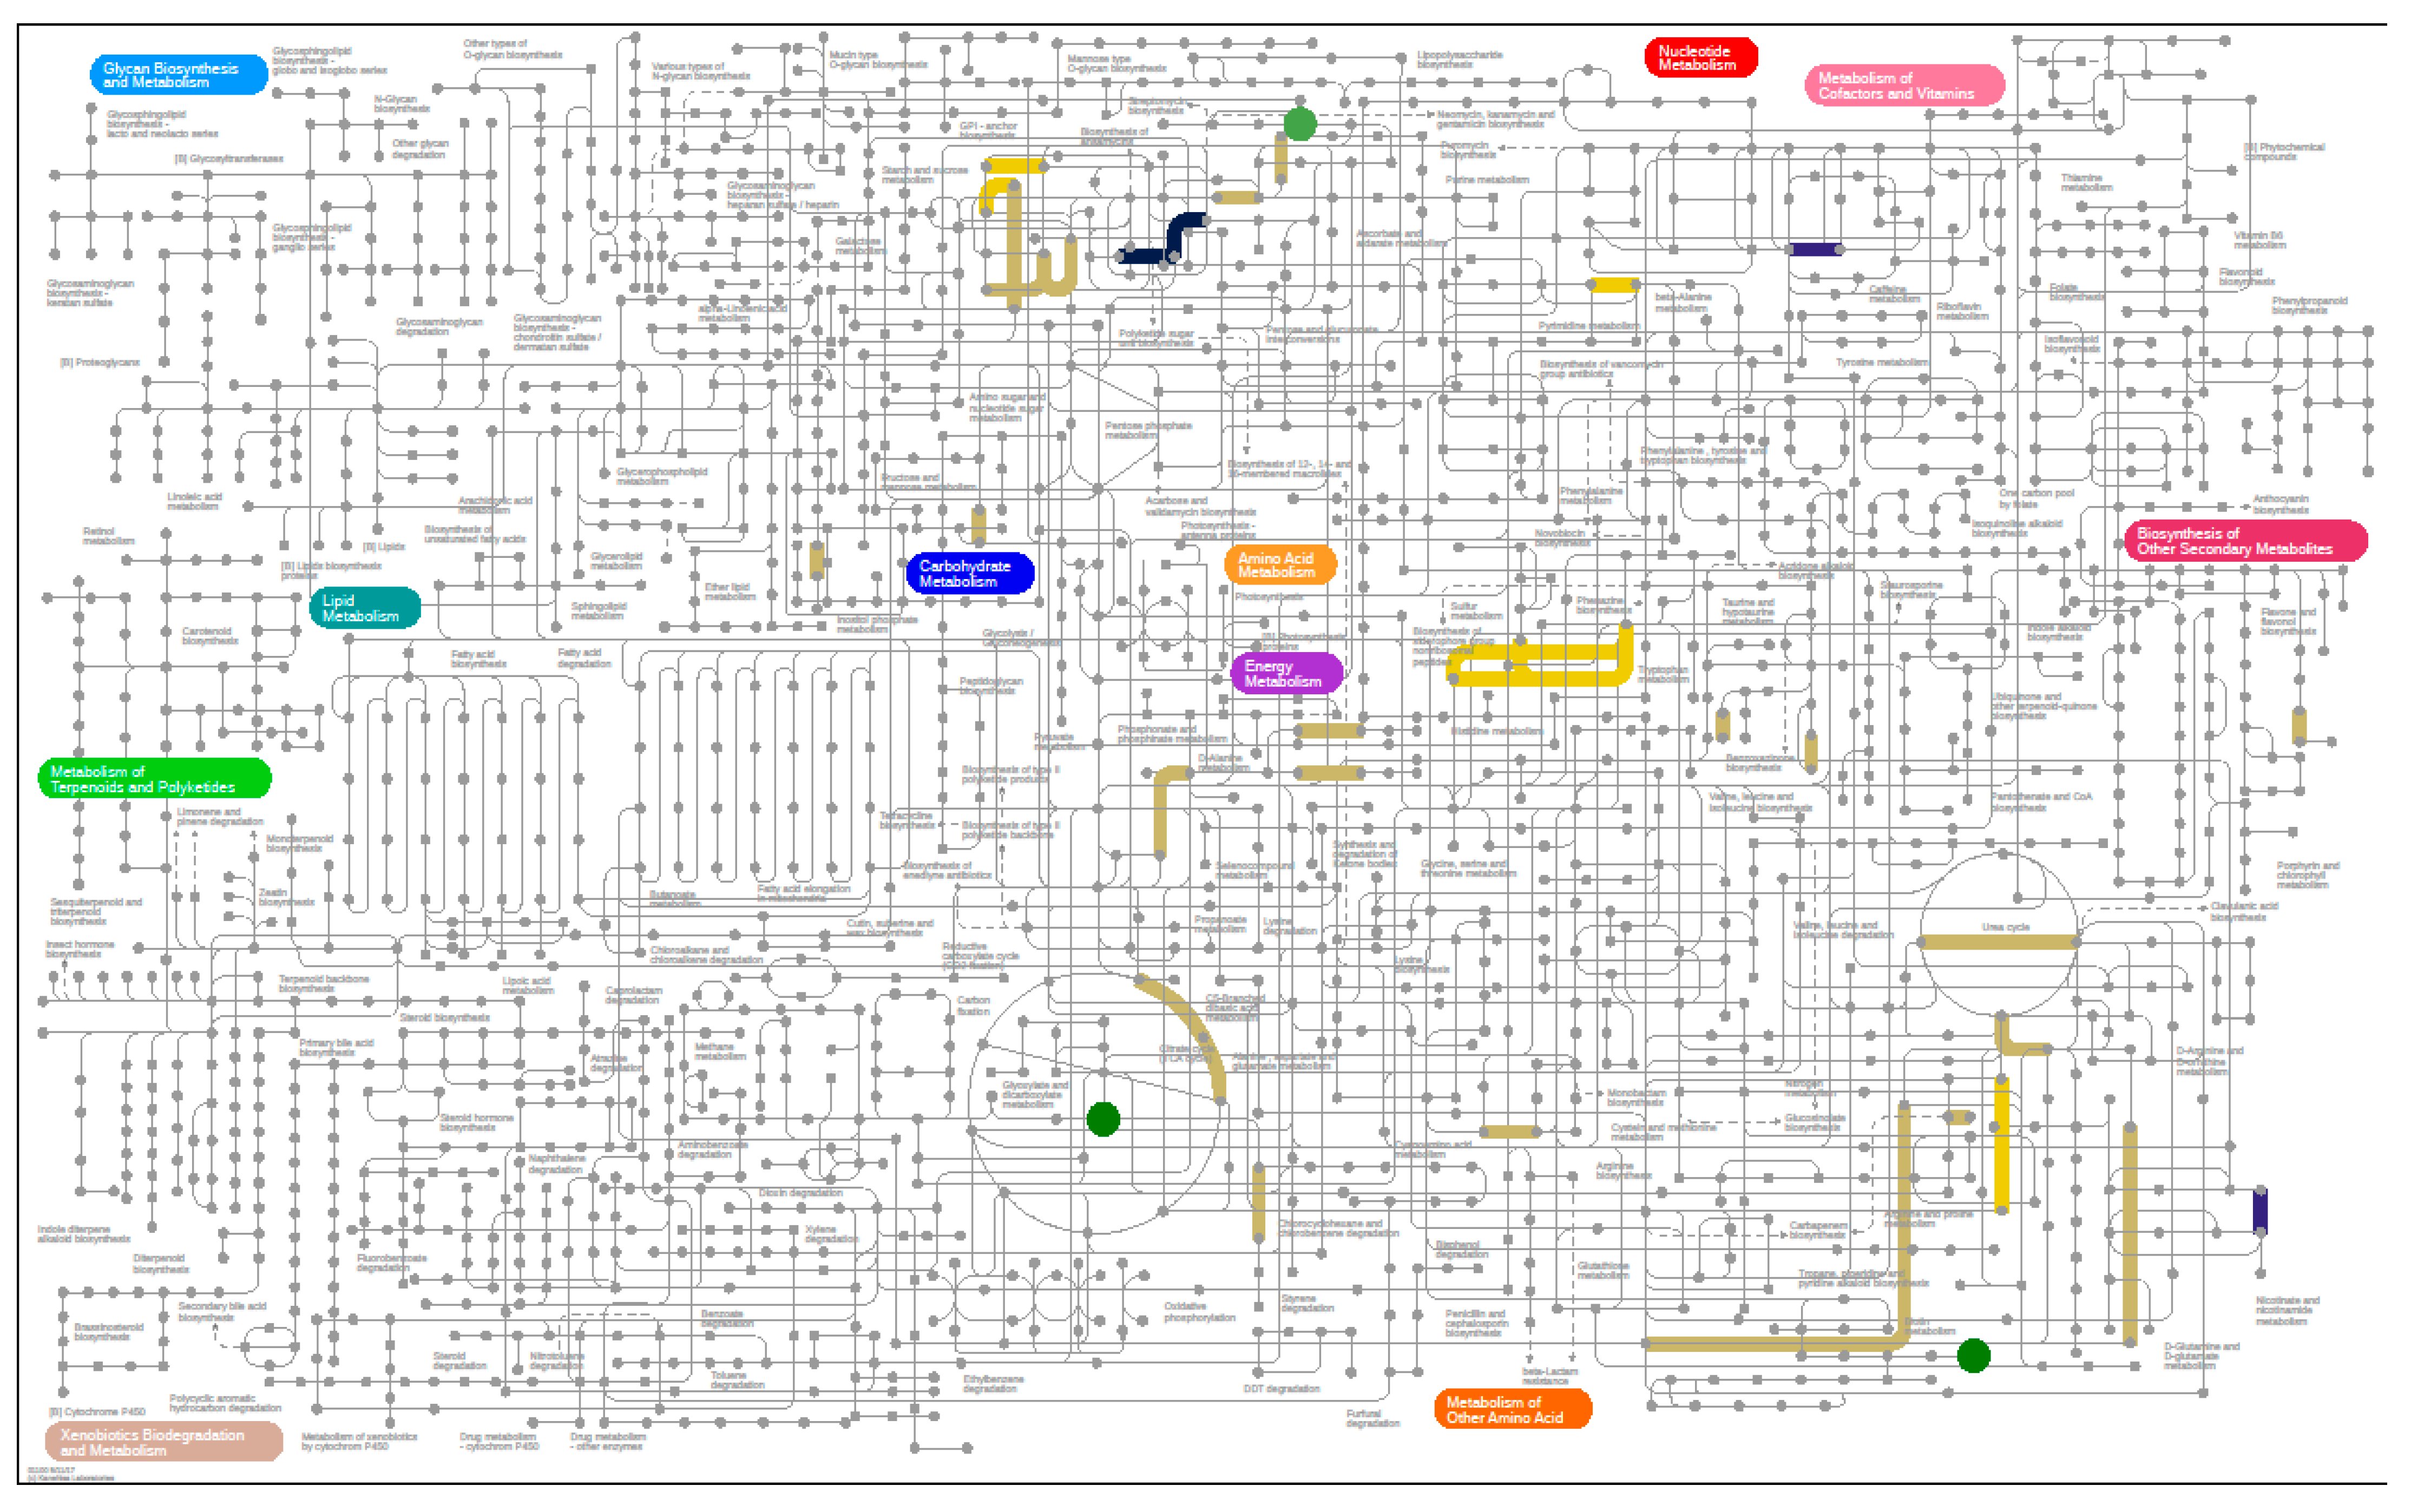
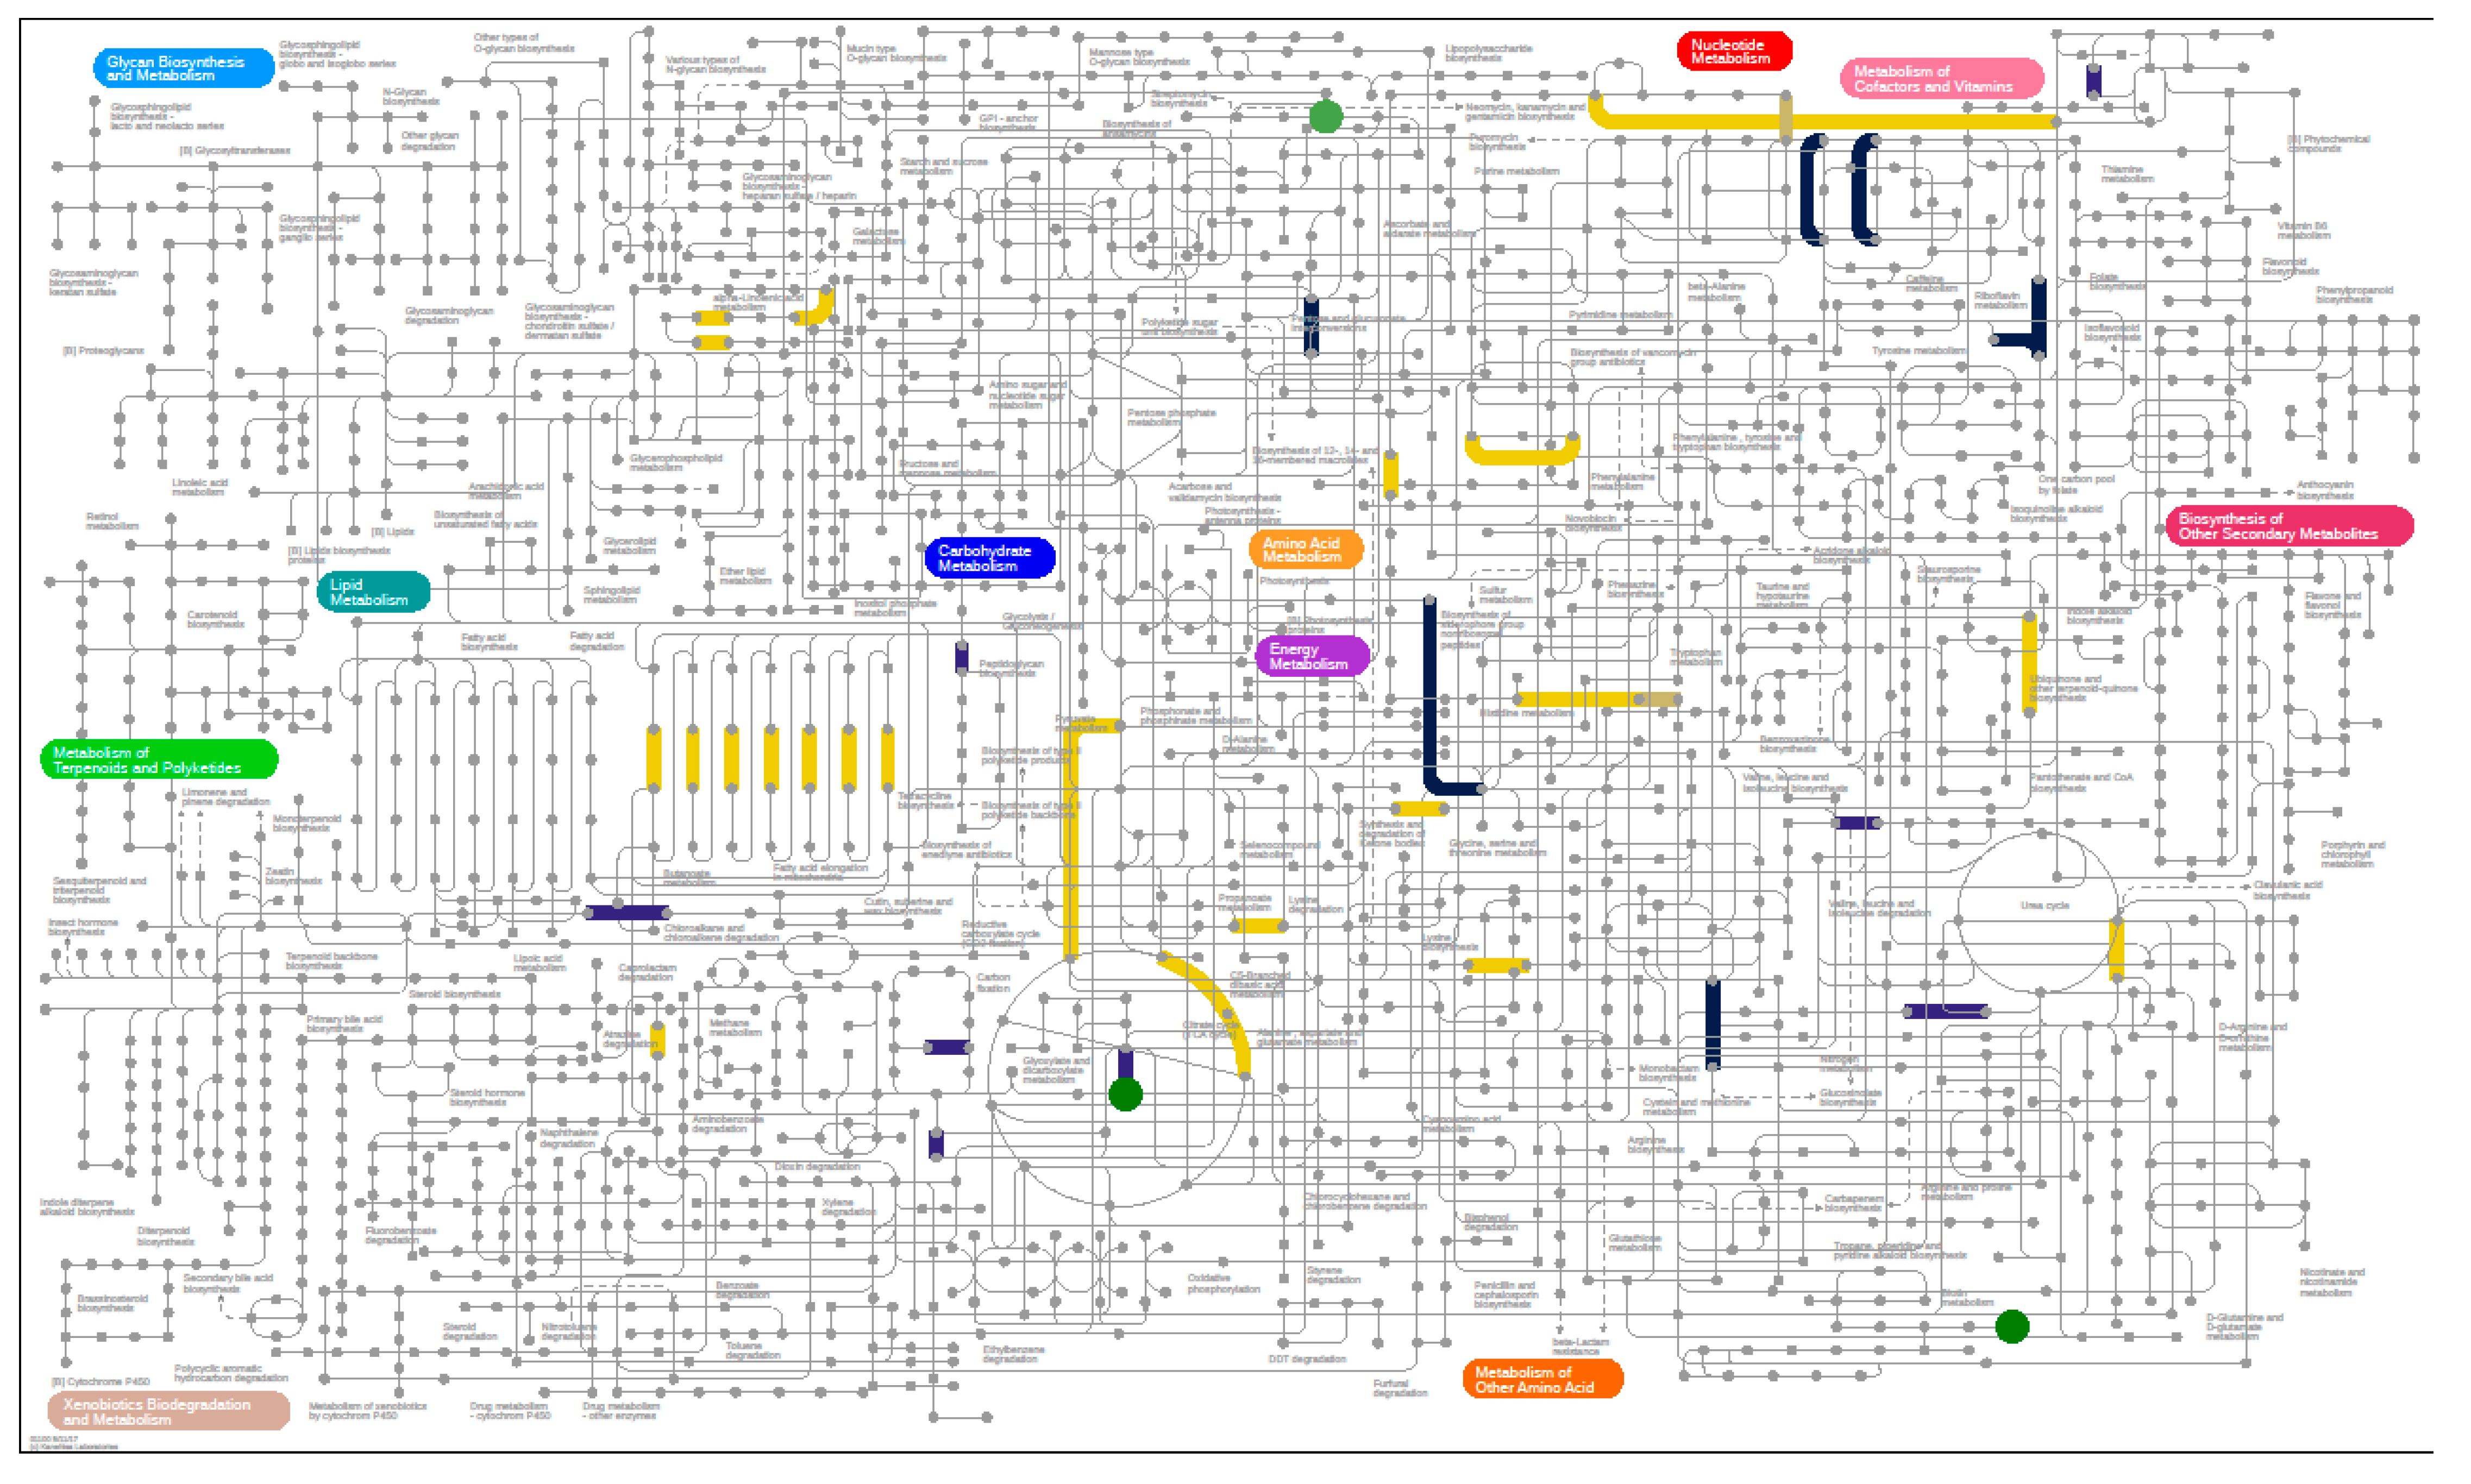
3.6.3. Metaproteomics Analysis
4. Discussion
Supplementary Materials
Author Contributions
Funding
Conflicts of Interest
References
- Levine, A.; Koletzko, S.; Turner, D.; Escher, J.C.; Cucchiara, S.; De Ridder, L.; Kolho, K.-L.; Veres, G.; Russell, R.; Paerregaard, A.; et al. The ESPGHAN Revised Porto Criteria for the Diagnosis of Inflammatory Bowel Disease in Children and Adolescents. J. Pediatr. Gastroenterol. Nutr. 2013, 58, 795–806. [Google Scholar] [CrossRef] [Green Version]
- Prevention CfDCa. Inflamm. Bowel Dis. 2018. Available online: https://www.cdc.gov/ibd/data-statistics.htm (accessed on 6 December 2020).
- Vindigni, S.M.; Zisman, T.L.; Suskind, D.L.; Damman, C.J. The intestinal microbiome, barrier function, and immune system in inflammatory bowel disease: A tripartite pathophysiological circuit with implications for new therapeutic directions. Ther. Adv. Gastroenterol. 2016, 9, 606–625. [Google Scholar] [CrossRef] [Green Version]
- Lane, E.R.; Zisman, T.L.; Suskind, D.L. The microbiota in inflammatory bowel disease: Current and therapeutic insights. J. Inflamm. Res. 2017, 10, 63–73. [Google Scholar] [CrossRef] [Green Version]
- Wu, G.D.; Chen, J.; Hoffmann, C.; Bittinger, K.; Chen, Y.-Y.; Keilbaugh, S.A.; Bewtra, M.; Knights, D.; Walters, W.A.; Knight, R.; et al. Linking Long-Term Dietary Patterns with Gut Microbial Enterotypes. Science 2011, 334, 105–108. [Google Scholar] [CrossRef] [PubMed] [Green Version]
- Carmody, R.N.; Gerber, G.K.; Luevano, J.M.; Gatti, D.M.; Somes, L.; Svenson, K.L.; Turnbaugh, P.J. Diet Dominates Host Genotype in Shaping the Murine Gut Microbiota. Cell Host Microbe 2015, 17, 72–84. [Google Scholar] [CrossRef] [PubMed] [Green Version]
- Rothschild, D.; Weissbrod, O.; Barkan, E.; Kurilshikov, A.; Korem, T.; Zeevi, D.; Costea, P.I.; Godneva, A.; Kalka, I.N.; Bar, N.; et al. Environment dominates over host genetics in shaping human gut microbiota. Nature 2018, 555, 210–215. [Google Scholar] [CrossRef] [PubMed]
- Lewis, J.D.; Chen, E.Z.; Baldassano, R.N.; Otley, A.R.; Griffiths, A.M.; Lee, D.; Bittinger, K.; Bailey, A.G.; Friedman, E.S.; Hoffmann, C.; et al. Inflammation, Antibiotics, and Diet as Environmental Stressors of the Gut Microbiome in Pediatric Crohn’s Disease. Cell Host Microbe 2015, 18, 489–500. [Google Scholar] [CrossRef] [Green Version]
- Martinez-Medina, M.; Denizot, J.; Dreux, N.; Robin, F.; Billard, E.; Bonnet, R.; Darfeuille-Michaud, A.; Barnich, N. Western diet induces dysbiosis with increased E coli in CEABAC10 mice, alters host barrier function favouring AIEC colonisation. Gut 2014, 63, 116–124. [Google Scholar] [CrossRef]
- Chassaing, B.; Koren, O.; Goodrich, J.K.; Poole, A.C.; Srinivasan, S.; Ley, R.E.; Gewirtz, A.T. Dietary emulsifiers impact the mouse gut microbiota promoting colitis and metabolic syndrome. Nature 2015, 519, 92–96. [Google Scholar] [CrossRef] [Green Version]
- Nickerson, K.P.; Chanin, R.; McDonald, C. Deregulation of intestinal anti-microbial defense by the dietary additive, maltodextrin. Gut Microbes 2015, 6, 78–83. [Google Scholar] [CrossRef] [PubMed] [Green Version]
- Nickerson, K.P.; McDonald, C. Crohn’s disease-associated adherent-invasive Escherichia coli adhesion is enhanced by exposure to the ubiquitous dietary polysaccharide maltodextrin. PLoS ONE 2012, 7, e52132. [Google Scholar] [CrossRef] [PubMed] [Green Version]
- Canani, R.B.; Terrin, G.; Borrelli, O.; Romano, M.T.; Manguso, F.; Coruzzo, A.; D’Armiento, F.; Romeo, E.F.; Cucchiara, S. Short- and long-term therapeutic efficacy of nutritional therapy and corticosteroids in paediatric Crohn’s disease. Dig. Liver Dis. 2006, 38, 381–387. [Google Scholar] [CrossRef] [PubMed]
- Borrelli, O.; Cordischi, L.; Cirulli, M.; Paganelli, M.; Labalestra, V.; Uccini, S.; Russo, P.M.; Cucchiara, S. Polymeric Diet Alone Versus Corticosteroids in the Treatment of Active Pediatric Crohn’s Disease: A Randomized Controlled Open-Label Trial. Clin. Gastroenterol. Hepatol. 2006, 4, 744–753. [Google Scholar] [CrossRef] [PubMed]
- Greenberg, G.R.; Fleming, C.R.; Jeejeebhoy, K.N.; Rosenberg, I.H.; Sales, D.; Tremaine, W.J. Controlled trial of bowel rest and nutritional support in the management of Crohn’s disease. Gut 1988, 29, 1309–1315. [Google Scholar] [CrossRef] [PubMed]
- Day, A.S.; Whitten, K.E.; Lemberg, D.A.; Clarkson, C.; Vitug-Sales, M.; Jackson, R.; Bohane, T.D. Exclusive enteral feeding as primary therapy for Crohn’s disease in Australian children and adolescents: A feasible and effective approach. J. Gastroenterol. Hepatol. 2006, 21, 1609–1614. [Google Scholar] [CrossRef]
- Dziechciarz, P.; Horvath, A.; Shamir, R.; Szajewska, H. Meta-analysis: Enteral nutrition in active Crohn’s disease in children. Aliment. Pharmacol. Ther. 2007, 26, 795–806. [Google Scholar] [CrossRef]
- Green, N.; Miller, T.; Suskind, D.L.; Lee, D. A Review of Dietary Therapy for IBD and a Vision for the Future. Nutrition 2019, 11, 947. [Google Scholar] [CrossRef] [Green Version]
- Levine, A.; Wine, E.; Assa, A.; Boneh, R.S.; Shaoul, R.; Kori, M.; Cohen, S.; Peleg, S.; Shamaly, H.; On, A.; et al. Crohn’s Disease Exclusion Diet Plus Partial Enteral Nutrition Induces Sustained Remission in a Randomized Controlled Trial. Gastroenterology 2019, 157, 440–450.e8. [Google Scholar] [CrossRef] [Green Version]
- Suskind, D.L.; Cohen, S.A.; Brittnacher, M.J.; Wahbeh, G.; Lee, D.; Shaffer, M.L.; Braly, K.; Hayden, H.S.; Klein, J.; Gold, B.; et al. Clinical and Fecal Microbial Changes with Diet Therapy in Active Inflammatory Bowel Disease. J. Clin. Gastroenterol. 2018, 52, 155–163. [Google Scholar] [CrossRef]
- Haas, S.V.; Haas, M.P. The treatment of celiac disease with the specific carbohydrate diet; report on 191 additional cases. Am. J. Gastroenterol. 1955, 23, 344–360. [Google Scholar] [PubMed]
- Dixon, L.J.; Kabi, A.; Nickerson, K.P.; McDonald, C. Combinatorial Effects of Diet and Genetics on Inflammatory Bowel Disease Pathogenesis. Inflamm. Bowel Dis. 2015, 21, 912–922. [Google Scholar] [CrossRef]
- Suskind, D.L.; Wahbeh, G.; Gregory, N.; Vendettuoli, H.; Christie, D. Nutritional therapy in pediatric Crohn disease: The specific carbohydrate diet. J. Pediatr. Gastroenterol. Nutr. 2014, 58, 87–91. [Google Scholar] [CrossRef] [PubMed] [Green Version]
- Obih, C.; Wahbeh, G.; Lee, D.; Braly, K.; Giefer, M.; Shaffer, M.L.; Nielson, H.; Suskind, D.L. Specific carbohydrate diet for pediatric inflammatory bowel disease in clinical practice within an academic IBD center. Nutrition 2016, 32, 418–425. [Google Scholar] [CrossRef] [PubMed]
- Hyams, J.; Markowitz, J.; Otley, A.; Rosh, J.; Mack, D.; Bousvaros, A.; Kugathasan, S.; Pfefferkorn, M.; Tolia, V.; Evans, J.; et al. Evaluation of the Pediatric Crohn Disease Activity Index: A Prospective Multicenter Experience. J. Pediatr. Gastroenterol. Nutr. 2005, 41, 416–421. [Google Scholar] [CrossRef]
- Borrud, L.; Chiappa, M.M.; Burt, V.L.; Gahche, J.; Zipf, G.; Johnson, C.L.; Dohrmann, S.M. National Health and Nutrition Examination Survey: National youth fitness survey plan, operations, and analysis. Vital Health Stat. Ser. 2 2014, 163, 1–24. [Google Scholar]
- Wood, D.E.; Salzberg, S.L. Kraken: Ultrafast metagenomic sequence classification using exact alignments. Genome Biol. 2014, 15, R46. [Google Scholar] [CrossRef] [PubMed] [Green Version]
- Li, D.; Liu, C.-M.; Luo, R.; Sadakane, K.; Lam, T.W. MEGAHIT: An ultra-fast single-node solution for large and complex metagenomics assembly via succinct de Bruijn graph. Bioinformatics 2015, 31, 1674–1676. [Google Scholar] [CrossRef] [Green Version]
- Hyatt, D.; Chen, G.-L.; Locascio, P.F.; Land, M.L.; Larimer, F.W.; Hauser, L.J. Prodigal: Prokaryotic gene recognition and translation initiation site identification. BMC Bioinform. 2010, 11, 119. [Google Scholar] [CrossRef] [Green Version]
- Seemann, T. Prokka: Rapid prokaryotic genome annotation. Bioinformatics 2014, 30, 2068–2069. [Google Scholar] [CrossRef]
- Li, H.; Handsaker, B.; Wysoker, A.; Fennell, T.; Ruan, J.; Homer, N.; Marth, G.; Abecasis, G.; Durbin, R. 1000 Genome Project Data Processing Subgroup. The Sequence Alignment/Map format and SAMtools. Bioinformatics 2009, 25, 2078–2079. [Google Scholar] [CrossRef] [PubMed] [Green Version]
- Vasimuddin, M.; Misra, S.; Li, H.; Aluru, S. Efficient Architecture—Aware Acceleration of BWA-MEM for Multicore Systems. In Proceedings of the 2019 IEEE International Parallel and Distributed Processing Symposium (IPDPS), Rio de Janeiro, Brazil, 20–24 May 2019; pp. 314–324. [Google Scholar]
- Pedersen, B.S.; Quinlan, A.R. Mosdepth: Quick coverage calculation for genomes and exomes. Bioinformatics 2018, 34, 867–868. [Google Scholar] [CrossRef] [PubMed]
- Nakayasu, E.S.; Nicora, C.D.; Sims, A.C.; Burnum-Johnson, K.E.; Kim, Y.-M.; Kyle, J.E.; Matzke, M.M.; Shukla, A.K.; Chu, R.K.; Schepmoes, A.A.; et al. MPLEx: A Robust and Universal Protocol for Single-Sample Integrative Proteomic, Metabolomic, and Lipidomic Analyses. mSystems 2016, 1, e00043-16. [Google Scholar] [CrossRef] [PubMed] [Green Version]
- Nicora, C.D.; Sims, A.C.; Bloodsworth, K.J.; Kim, Y.-M.; Moore, R.J.; Kyle, J.E.; Nakayasu, E.S.; Metz, T.O. Metabolite, Protein, and Lipid Extraction (MPLEx): A Method that Simultaneously Inactivates Middle East Respiratory Syndrome Coronavirus and Allows Analysis of Multiple Host Cell Components Following Infection. Methods Mol. Biol. 2019, 2099, 173–194. [Google Scholar] [CrossRef] [Green Version]
- Chambers, M.C.; MacLean, B.; Burke, R.D.; Amodei, D.; Ruderman, D.L.; Neumann, S.; Gatto, L.; Fischer, B.; Pratt, B.; Egertson, J.D.; et al. A cross-platform toolkit for mass spectrometry and proteomics. Nat. Biotechnol. 2012, 30, 918–920. [Google Scholar] [CrossRef]
- Kim, S.; Pevzner, P.A. MS-GF+ makes progress towards a universal database search tool for proteomics. Nat. Commun. 2014, 5, 1–10. [Google Scholar] [CrossRef] [Green Version]
- Elias, J.E.; Gygi, S.P. Target-Decoy Search Strategy for Mass Spectrometry-Based Proteomics. Methods Mol. Biol. 2010, 604, 55–71. [Google Scholar] [CrossRef] [Green Version]
- Ekim, Y.-M.; Enowack, S.; Olsen, M.T.; Becraft, E.D.; Wood, J.M.; Ethiel, V.; Eklapper, I.; Fredrickson, J.K.; Bryant, D.A.; Ward, D.M.; et al. Diel metabolomics analysis of a hot spring chlorophototrophic microbial mat leads to new hypotheses of community member metabolisms. Front. Microbiol. 2015, 6, 209. [Google Scholar] [CrossRef]
- Oksanen, J.; Blanchet, F.G.; Friendly, M.; Kindt, R.; Legendre, P.; McGlinn, D.; Minchin, P.R.; O’Hara, R.B.; Simpson, G.L.; Solymos, P. Vegan: Community Ecology Package. R package Version 2.5-6. 2019. Available online: https://rdrr.io/cran/vegan/ (accessed on 18 February 2020).
- Abbott, D.W.; Boraston, A.B. Structural Biology of Pectin Degradation by Enterobacteriaceae. Microbiol. Mol. Biol. Rev. 2008, 72, 301–316. [Google Scholar] [CrossRef] [Green Version]
- Fujimoto, T.; Imaeda, H.; Takahashi, K.; Kasumi, E.; Bamba, S.; Fujiyama, Y.; Andoh, A. Decreased abundance of Faecalibacterium prausnitzii in the gut microbiota of Crohn’s disease. J. Gastroenterol. Hepatol. 2013, 28, 613–619. [Google Scholar] [CrossRef]
- Frank, D.N.; Amand, A.L.S.; Feldman, R.A.; Boedeker, E.C.; Harpaz, N.; Pace, N.R. Molecular-phylogenetic characterization of microbial community imbalances in human inflammatory bowel diseases. Proc. Natl. Acad. Sci. USA 2007, 104, 13780–13785. [Google Scholar] [CrossRef] [PubMed] [Green Version]
- Wang, W.; Chen, L.; Zhou, R.; Wang, X.; Song, L.; Huang, S.; Wang, G.; Xia, B.; Forbes, B.A. Increased Proportions of Bifidobacterium and the Lactobacillus Group and Loss of Butyrate-Producing Bacteria in Inflammatory Bowel Disease. J. Clin. Microbiol. 2014, 52, 398–406. [Google Scholar] [CrossRef] [PubMed] [Green Version]
- Ley, R.E.; Peterson, D.A.; Gordon, J.I. Ecological and Evolutionary Forces Shaping Microbial Diversity in the Human Intestine. Cell 2006, 124, 837–848. [Google Scholar] [CrossRef] [PubMed] [Green Version]
- The Human Microbiome Project Consortium. Structure, function and diversity of the healthy human microbiome. Nature 2012, 486, 207–214. [Google Scholar] [CrossRef] [PubMed] [Green Version]
- Flores, G.E.; Caporaso, J.G.; Henley, J.B.; Rideout, J.R.; Domogala, D.; Chase, J.; Leff, J.W.; Vázquez-Baeza, Y.; Gonzalez, A.; Knight, R.; et al. Temporal variability is a personalized feature of the human microbiome. Genome Biol. 2014, 15, 531. [Google Scholar] [CrossRef] [Green Version]
- Costello, E.K.; Lauber, C.L.; Hamady, M.; Fierer, N.; Gordon, J.I.; Knight, R. Bacterial community variation in human body habitats across space and time. Science 2009, 326, 1694–1697. [Google Scholar] [CrossRef] [Green Version]
- Halfvarson, J.; Brislawn, C.J.; Lamendella, R.; Vázquez-Baeza, Y.; Walters, W.A.; Bramer, L.M.; D’Amato, M.; Bonfiglio, F.; McDonald, D.; Gonzalez, A.; et al. Dynamics of the human gut microbiome in inflammatory bowel disease. Nat. Microbiol. 2017, 2, 1–7. [Google Scholar] [CrossRef] [Green Version]
- Takaishi, H.; Matsuki, T.; Nakazawa, A.; Takada, T.; Kado, S.; Asahara, T.; Kamada, N.; Sakuraba, A.; Yajima, T.; Higuchi, H.; et al. Imbalance in intestinal microflora constitution could be involved in the pathogenesis of inflammatory bowel disease. Int. J. Med. Microbiol. 2008, 298, 463–472. [Google Scholar] [CrossRef]
- Willing, B.; Halfvarson, J.; Dicksved, J.; Rosenquist, M.; Järnerot, G.; Engstrand, L.; Tysk, C.; Jansson, J.K. Twin studies reveal specific imbalances in the mucosa-associated microbiota of patients with ileal Crohn’s disease. Inflamm. Bowel Dis. 2009, 15, 653–660. [Google Scholar] [CrossRef]
- Manichanh, C.; Rigottier-Gois, L.; Bonnaud, E.; Gloux, K.; Pelletier, E.; Frangeul, L.; Nalin, R.; Jarrin, C.; Chardon, P.; Marteau, P.; et al. Reduced diversity of faecal microbiota in Crohn’s disease revealed by a metagenomic approach. Gut 2006, 55, 205–211. [Google Scholar] [CrossRef] [Green Version]
- Sokol, H.; Seksik, P.; Furet, J.P.; Firmesse, O.; Nion-Larmurier, I.; Beaugerie, L.; Cosnes, J.; Corthier, G.; Marteau, P.; Doré, J. Low counts of Faecalibacterium prausnitzii in colitis microbiota. Inflamm. Bowel Dis. 2009, 15, 1183–1189. [Google Scholar] [CrossRef] [PubMed]
- Miquel, S.; Martín, R.; Rossi, O.; Bermúdez-Humarán, L.G.; Chatel, J.M.; Sokol, H.; Thomas, M.; Wells, J.M.; Langella, P. Faecalibacterium prausnitzii and human intestinal health. Curr. Opin. Microbiol. 2013, 16, 255–261. [Google Scholar] [CrossRef] [PubMed]
- Willing, B.P.; Dicksved, J.; Halfvarson, J.; Andersson, A.F.; Lucio, M.; Zheng, Z.; Järnerot, G.; Tysk, C.; Jansson, J.K.; Engstrand, L. A Pyrosequencing Study in Twins Shows That Gastrointestinal Microbial Profiles Vary With Inflammatory Bowel Disease Phenotypes. Gastroenterology 2010, 139, 1844–1854.e1. [Google Scholar] [CrossRef] [PubMed]
- Wan, N.; Wang, H.; Ng, C.K.; Mukherjee, M.; Ren, D.; Cao, B.; Tang, Y.J. Bacterial Metabolism During Biofilm Growth Investigated by 13C Tracing. Front. Microbiol. 2018, 9, 2657. [Google Scholar] [CrossRef] [PubMed]
- D’Haens, G.R.; Ferrante, M.; Vermeire, S.; Baert, F.; Noman, M.; Moortgat, L.; Geens, P.; Iwens, D.; Aerden, I.; Van Assche, G.; et al. Fecal calprotectin is a surrogate marker for endoscopic lesions in inflammatory bowel disease. Inflamm. Bowel Dis. 2012, 18, 2218–2224. [Google Scholar] [CrossRef]


| Participant Demographics | ||
|---|---|---|
| Anthropometrics | Age (y) | 14.4 ± 3.00 |
| Age at Diagnosis (y) | 10.9 ± 4.83 | |
| Height (cm) | 158 ± 12.9 | |
| Weight (kg) | 52.2 ± 13.5 | |
| BMI | 20.5 ± 2.96 | |
| Sex | Male | 8 (57.1%) |
| Female | 6 (42.9%) | |
| Disease Phenotype | Inflammatory, non-penetrating, non-stricturing | 14 (100.0%) |
| Stricturing only | 0 (0.0%) | |
| Penetrating only | 0 (0.0%) | |
| Both stricturing and penetrating | 0 (0.0%) | |
| Medications | Aminosalicylates | 4 (22.2%) |
| Antibiotics for IBD | 0 (0.0%) | |
| Biologics | 4 (22.2%) | |
| Corticosteroids | 0 (0.0%) | |
| Immunomodulators | 3 (16.7%) | |
| Other immune suppresants | 0 (0.0%) | |
| Rectal Therapy | 0 (0.0%) | |
| None | 8 (44.4%) | |
| PGA | Normal | 0 (0.0%) |
| Mild | 6 (42.9%) | |
| Moderate | 8 (57.1%) | |
| Severe | 0 (0.0%) | |
| SaMPLE | Raw Reads | QC Reads | Unclassified a | Human | Richness b | Inv Simpson b |
|---|---|---|---|---|---|---|
| P001 B | 151,597,524 | 129,774,388 | 28.12% | 1.75% | 4218 | 14.05 |
| P001 12 | 154,162,426 | 136,058,126 | 31.97% | 0.30% | 4218 | 12.14 |
| P005 B | 147,131,300 | 130,725,972 | 29.74% | 32.42% | 4216 | 4.64 |
| P005 12 | 152,188,186 | 132,869,602 | 53.25% | 1.28% | 4216 | 10.86 |
| P007 B | 133,198,464 | 114,558,570 | 36.28% | 0.26% | 4215 | 13.57 |
| P007 12 | 196,850516 | 172,507,988 | 34.46% | 0.56% | 4217 | 17.68 |
| P010 B | 148,457,710 | 123,323,294 | 30.41% | 1.01% | 4216 | 13.87 |
| P010 12 | 160,592,310 | 150,922,746 | 25.34% | 0.69% | 4217 | 11.23 |
| P015 B | 150,180,158 | 110,457,378 | 32.76% | 1.18% | 4198 | 4.77 |
| P015 12 | 165,946,068 | 130,556,042 | 47.70% | 3.04% | 4210 | 15.42 |
| Metabolites | 001 | 010 | 015 | 005 | 007 | |||||
|---|---|---|---|---|---|---|---|---|---|---|
| W02/S | W12/S | W02/S | W12/S | W02/S | W12/S | W02/S | W12/S | W02/S | W12/S | |
| 1,2-propanediol | 11.5 | 6.7 | 15.4 | 8.6 | 10.5 | 6.2 | 39.7 | 26.7 | 21.0 | 12.8 |
| Unknown 002 | 0.0 | 0.0 | 0.0 | 0.0 | 19.9 | 95.3 | 136.7 | 102.1 | 132.8 | 84.0 |
| 2-piperidinone | 5.7 | 3.8 | 14.4 | 20.2 | 51.9 | 19.4 | 171.6 | 39.3 | 142.7 | 101.3 |
| Unknown 018 | 66.4 | 3.8 | 6.0 | 19.8 | 108.7 | 84.2 | 244.0 | 195.1 | 97.8 | 89.6 |
| benzenepropanoic acid | 22.2 | 18.5 | 108.6 | 0.0 | 79.8 | 62.0 | 275.2 | 55.9 | 115.2 | 125.1 |
| tetrahydro-2-pyranone | 21.6 | 14.3 | 109.7 | 57.4 | 85.6 | 14.0 | 490.7 | 99.8 | 231.6 | 198.3 |
| Unknown 010 | 68.8 | 48.6 | 81.8 | 65.1 | 44.2 | 23.2 | 160.7 | 20.4 | 917.5 | 1310.0 |
| 2-phenylmalonic acid | 40.7 | 33.3 | 93.2 | 67.3 | 65.8 | 44.6 | 383.7 | 72.4 | 112.0 | 146.8 |
| Unknown 033 | 144.3 | 90.0 | 0.0 | 0.0 | 102.7 | 23.2 | 304.3 | 126.9 | 112.6 | 51.3 |
| p-cresol | 82.0 | 46.6 | 43.5 | 60.2 | 97.8 | 30.7 | 96.6 | 43.8 | 163.5 | 431.9 |
| 2,6-dimethylpyrazine | 0.0 | 267.8 | 0.0 | 0.0 | 86.3 | 22.3 | 188.8 | 181.8 | 0.0 | 0.0 |
| Unknown 012 | 42.0 | 99.2 | 27.5 | 1.7 | 81.8 | 133.3 | 55.6 | 0.0 | 3029.1 | 2395.9 |
| Unknown 030 | 68.1 | 82.5 | 50.2 | 36.8 | 135.2 | 37.7 | 151.0 | 263.0 | 91.6 | 139.6 |
| butanoic acid | 59.5 | 86.6 | 90.2 | 56.5 | 103.0 | 47.7 | 47.1 | 81.9 | 259.9 | 370.7 |
| 3-ethyl-2,5-dimethylpyrazine | 111.0 | 111.6 | 2.5 | 120.2 | 82.6 | 20.0 | 238.8 | 122.8 | 1949.6 | 3010.6 |
| Unknown 029 | 68.4 | 33.2 | 109.6 | 78.6 | 106.8 | 62.8 | 140.0 | 58.6 | 77.7 | 77.0 |
| propanoic acid | 57.9 | 81.8 | 139.0 | 86.9 | 80.2 | 38.2 | 116.4 | 52.6 | 186.6 | 171.7 |
| Acetate | 104.3 | 90.0 | 95.5 | 65.0 | 87.5 | 55.5 | 117.8 | 61.9 | 165.5 | 141.7 |
| Indole | 69.9 | 32.2 | 128.8 | 90.2 | 99.4 | 86.3 | 134.9 | 74.0 | 70.0 | 73.9 |
| furaneol | 97.1 | 85.1 | 143.4 | 53.8 | 78.6 | 54.9 | 262.2 | 149.2 | 181.4 | 119.5 |
| 3-methylbutanoic acid | 58.2 | 39.5 | 173.8 | 121.3 | 69.2 | 51.3 | 84.3 | 34.4 | 228.3 | 270.3 |
| tetradecanoic acid | 101.7 | 104.4 | 156.7 | 38.1 | 116.0 | 2.5 | 168.2 | 60.1 | 140.5 | 141.0 |
| isobutyric acid | 55.3 | 48.1 | 183.2 | 117.9 | 73.3 | 48.9 | 48.8 | 23.0 | 212.0 | 228.4 |
| 4-methylpentanoic acid | 33.3 | 63.8 | 88.9 | 71.8 | 256.7 | 61.4 | 139.0 | 15.2 | 181.3 | 124.7 |
| Metabolite | 001_B | 005_B | 007_B | 010_B | 015_B | 001_W2 | 005_W2 | 007_W2 | 010_W2 | 015_W2 | p-Value | Pattern |
|---|---|---|---|---|---|---|---|---|---|---|---|---|
| oleic acid | 26.24 | 26.56 | 27.35 | 26.88 | 27.19 | 27.38 | 27.99 | 27.65 | 28.50 | 28.13 | 0.0048 | Up |
| campesterol | 21.53 | 22.16 | 22.54 | 23.25 | 21.90 | 20.21 | 20.92 | 21.32 | 21.09 | 21.41 | 0.0076 | Down |
| stigmasterol | 21.48 | 20.63 | 20.75 | 21.86 | 21.06 | 20.17 | N/A | 20.10 | 19.81 | 20.56 | 0.0113 | Down |
| lignoceric acid * | 21.17 | 20.91 | 20.99 | 21.94 | 21.43 | 21.50 | 22.00 | 21.83 | 22.07 | 22.62 | 0.0248 | Up |
| 1-eicosanol * | 23.06 | 20.75 | 20.28 | 23.03 | 22.01 | 19.97 | 19.97 | 20.49 | 19.16 | 20.81 | 0.0254 | Down |
| phosphate ion | 24.61 | 24.37 | 25.55 | 24.11 | 25.10 | 24.74 | 26.81 | 25.87 | 26.26 | 25.67 | 0.0312 | Up |
| 1-monolinolein * | 21.56 | 22.50 | 22.64 | 21.70 | 22.05 | 22.41 | 22.93 | 22.32 | 22.88 | 23.18 | 0.0404 | Up |
| pimelic acid | 19.87 | 21.15 | 19.46 | 19.30 | 22.11 | 21.97 | 21.42 | 21.78 | 21.27 | 21.96 | 0.0490 | Up |
| maltose | 19.82 | 20.24 | 20.92 | 19.64 | 20.95 | 20.37 | 19.32 | 18.83 | 18.60 | 19.65 | 0.0494 | Down |
| L-cysteine | 20.97 | 21.22 | 20.77 | 21.31 | 22.76 | 21.75 | 24.69 | 23.15 | 22.23 | 22.19 | 0.0585 | Up |
| stearic acid | 22.72 | 23.86 | 23.65 | 24.28 | 23.32 | 22.32 | 22.96 | 23.31 | 22.85 | 23.01 | 0.0587 | Down |
| 3-hydroxypyridine | 17.18 | 18.72 | 19.59 | 17.45 | 16.97 | 19.76 | 20.44 | 21.08 | 19.89 | 17.28 | 0.0706 | Up |
| methyl oleate | 21.96 | 22.40 | 23.10 | 22.88 | 21.08 | 20.87 | 24.64 | 24.61 | 25.62 | 25.39 | 0.0715 | Up |
| L-glutamic acid | 26.25 | 25.79 | 26.05 | 25.64 | 23.79 | 26.62 | 27.65 | 26.05 | 26.49 | 26.12 | 0.0734 | Up |
| N-acetyl-D-mannosamine | 22.94 | 24.14 | 24.32 | 25.04 | 23.36 | 22.55 | 20.95 | 23.72 | 23.19 | 23.34 | 0.0833 | Down |
| heptadecanoic acid | 23.77 | 24.25 | 23.90 | 26.11 | 24.01 | 23.27 | 23.42 | 24.06 | 22.90 | 23.75 | 0.0863 | Down |
| myristic acid | 24.76 | 24.77 | 24.39 | 25.79 | 24.69 | 24.16 | 23.84 | 25.08 | 23.59 | 24.32 | 0.0865 | Down |
| 2-oleoylglycerol * | 20.83 | 20.88 | 21.44 | 20.83 | 21.34 | 20.90 | 21.78 | 21.16 | 22.25 | 21.85 | 0.0970 | Up |
| palmitic acid | 24.91 | 25.86 | 25.52 | 26.46 | 25.59 | 24.59 | 25.15 | 25.51 | 25.17 | 25.20 | 0.0998 | Down |
| Proteins Identified | Human Proteins | % Non-Human Assigned EC | EC Families | EC Diversity (Inv Simpson) | |
|---|---|---|---|---|---|
| P001 B | 9768 | 550 | 51.00% | 714 | 132 |
| P001 2 | 10767 | 444 | 50.10% | 707 | 130 |
| P001 12 | 11545 | 371 | 50.62% | 763 | 147 |
| P005 B | 5103 | 1353 | 38.53% | 568 | 98 |
| P005 2 | 6184 | 1749 | 37.44% | 613 | 95 |
| P005 12 | 10483 | 1441 | 43.91% | 761 | 112 |
| P007 B | 11034 | 650 | 47.09% | 740 | 103 |
| P007 2 | 8289 | 559 | 44.46% | 685 | 97 |
| P007 12 | 9086 | 505 | 46.91% | 679 | 107 |
| P010 B | 7975 | 585 | 48.54% | 660 | 107 |
| P010 2 | 11353 | 697 | 47.08% | 774 | 120 |
| P010 12 | 12109 | 718 | 46.73% | 776 | 116 |
| P015 B | 3841 | 622 | 40.93% | 551 | 89 |
| P015 2 | 4797 | 672 | 40.84% | 609 | 115 |
| P015 12 | 6498 | 611 | 44.52% | 655 | 110 |
Publisher’s Note: MDPI stays neutral with regard to jurisdictional claims in published maps and institutional affiliations. |
© 2020 by the authors. Licensee MDPI, Basel, Switzerland. This article is an open access article distributed under the terms and conditions of the Creative Commons Attribution (CC BY) license (http://creativecommons.org/licenses/by/4.0/).
Share and Cite
Suskind, D.L.; Lee, D.; Kim, Y.-M.; Wahbeh, G.; Singh, N.; Braly, K.; Nuding, M.; Nicora, C.D.; Purvine, S.O.; Lipton, M.S.; et al. The Specific Carbohydrate Diet and Diet Modification as Induction Therapy for Pediatric Crohn’s Disease: A Randomized Diet Controlled Trial. Nutrients 2020, 12, 3749. https://doi.org/10.3390/nu12123749
Suskind DL, Lee D, Kim Y-M, Wahbeh G, Singh N, Braly K, Nuding M, Nicora CD, Purvine SO, Lipton MS, et al. The Specific Carbohydrate Diet and Diet Modification as Induction Therapy for Pediatric Crohn’s Disease: A Randomized Diet Controlled Trial. Nutrients. 2020; 12(12):3749. https://doi.org/10.3390/nu12123749
Chicago/Turabian StyleSuskind, David L., Dale Lee, Young-Mo Kim, Ghassan Wahbeh, Namita Singh, Kimberly Braly, Mason Nuding, Carrie D. Nicora, Samuel O. Purvine, Mary S. Lipton, and et al. 2020. "The Specific Carbohydrate Diet and Diet Modification as Induction Therapy for Pediatric Crohn’s Disease: A Randomized Diet Controlled Trial" Nutrients 12, no. 12: 3749. https://doi.org/10.3390/nu12123749
APA StyleSuskind, D. L., Lee, D., Kim, Y.-M., Wahbeh, G., Singh, N., Braly, K., Nuding, M., Nicora, C. D., Purvine, S. O., Lipton, M. S., Jansson, J. K., & Nelson, W. C. (2020). The Specific Carbohydrate Diet and Diet Modification as Induction Therapy for Pediatric Crohn’s Disease: A Randomized Diet Controlled Trial. Nutrients, 12(12), 3749. https://doi.org/10.3390/nu12123749