Article

Multinutrients for the Treatment of Psychiatric Symptoms in Clinical Samples: A Systematic Review and Meta-Analysis of Randomized Controlled Trials

1
Helfgott Research Institute, National University of Natural Medicine, Portland, OR 97201, USA
2
Child and Adolescent Psychiatry, Oregon Health & Science University, Portland, OR 97239, USA
3
Adult Psychiatry, Oregon Health & Science University, Portland, OR 97239, USA
4
Australian Research Centre in Complementary and Integrative Medicine, Faculty of Health, University of Technology Sydney, Sydney 2007, Australia
5
Department of Psychology, Swansea University, Swansea SA2 8PP, UK
6
School of Psychology, Speech and Hearing, University of Canterbury, 8140 Christchurch, New Zealand
*
Authors to whom correspondence should be addressed.
Nutrients 2020, 12(11), 3394; https://doi.org/10.3390/nu12113394
Submission received: 20 October 2020 / Accepted: 28 October 2020 / Published: 4 November 2020
(This article belongs to the Section Micronutrients and Human Health)

Abstract

:
This systematic review and meta-analysis focused on randomized controlled trials (RCT) of multinutrients consisting of at least four vitamins and/or minerals as interventions for participants with psychiatric symptoms. A systematic search identified 16 RCTs that fit the inclusion criteria (n = 1719 participants) in six psychiatric categories: depression, post-disaster stress, antisocial behavior, behavioral deficits in dementia, attention-deficit/hyperactivity disorder, and autism. Grading of Recommendations, Assessment, Development and Evaluations (GRADE) was used to rate the evidence base. Significant clinical benefit was assessed using minimal clinically important differences (MIDs). Due to heterogeneity in participants, multinutrient formulas, outcome measures, and absence of complete data, only the Attention-Deficit/Hyperactivity Disorder (ADHD) category was eligible for meta-analyses. In ADHD populations, statistically and clinically significant improvements were found in global functioning, Mean Difference (MD) −3.3, p = 0.001, MID −3.26; Standardized Mean Difference (SMD) −0.49 p = 0.001 MD −0.5), clinician ratings of global improvement (MD −0.58, p = 0.001, MID −0.5) and ADHD improvement (MD −0.54, p = 0.002, MID −0.5), and clinician (but not observer) measures of ADHD inattentive symptoms (MD −1.53, p = 0.05, MID −0.5). Narrative synthesis also revealed a pattern of benefit for global measures of improvement, for example: in autism, and in participants with behavioral deficits in dementia. Post-natural disaster anxiety and the number of violent incidents in prison populations also improved. Broad-spectrum formulas (vitamins + minerals) demonstrated more robust effects than formulas with fewer ingredients. This review highlights the need for robust methodology-RCTs that report full data, including means and standard deviations for all outcomes-in order to further elucidate the effects of multinutrients for psychiatric symptoms.

1. Introduction

Poor nutrition is increasingly identified as a modifiable risk factor for the development and persistence of psychiatric problems [1], with research identifying that the Western diet, high in salt, saturated fat, ultra-processed ingredients, and sugar is most consistently associated with poor mental health [2,3]. Interventions aimed at modifying diet and encouraging greater adherence to the Mediterranean diet have shown success at improving mental health (e.g., anxiety and depression) for some, but not all, study participants [4,5]. A common hypothesis across these diet improvement studies is that nutrient density is increased through higher consumption of vegetables and fruit, and lower consumption of ultra-processed foods.
However, a number of factors may impair an individual’s ability to fully benefit from dietary manipulation alone: both environmental and individual variables. On the environmental front, the depletion of essential nutrients in our food (e.g., magnesium, selenium, copper) over the last century [6], the use of herbicides and pesticides that diminish essential nutrients in crops through chelation of minerals [7], an emphasis on high-yield crops at the expense of nutrient density [8], and even the increase in atmospheric CO2 [9,10] have all been identified as threats to the quality of human nutrition and contributors to the reduced nutrient density of plants.
At the individual level, several factors may contribute to the need for more nutrients than what might be available in one’s diet, even if characterized as a “healthy” diet. These factors include poor gut health and microbiome composition [11,12,13], the presence of inflammation [14], genetic variation leading to possible in-born errors of metabolism, which slow metabolic activity due to suboptimal availability of vitamin and mineral cofactors [15], and mitochondrial dysfunction that may result in decreased production of cellular energy in psychiatric disorders [13,16,17]. The presence of any of these factors may effectively reduce the availability of nutrients necessary for optimal brain health.
Bearing in mind these factors, micronutrient supplementation may be a consideration beyond diet manipulation. However, there is an ongoing debate as to whether a single or multiple ingredient intervention is appropriate [18]. The majority of studies conducted over the last 100 years in the field of psychology and psychiatry have focused on one nutrient in order to determine the active ingredient. A number of systematic reviews and meta-analyses have highlighted the concentrated effort to find the single nutrient that may alleviate symptoms associated with complex psychiatric issues such as mood [19,20,21], psychosis [22], attention-deficit/hyperactivity disorder (ADHD) [23] or antisocial behaviors [24], with most of these studies finding only modest benefit from a single nutrient approach.
Based on an improved understanding of the physiological requirements of the brain [25], researchers are acknowledging that the search for a single nutrient to resolve complex psychiatric symptoms is unrealistic. Instead, consuming a variety of essential minerals and vitamins in combination, rather than single nutrients, makes physiological sense [17].
For example, multiple nutrients are required in biological processes related to optimizing metabolic function for mental health such as the methylation and the Krebs cycles [17]. Neurotransmitter metabolism-synthesis, uptake, and breakdown-requires enzymes at each step, and the enzymes are dependent upon multiple cofactors, most of which are a variety of vitamins and minerals. These biological processes support the necessity of ingesting nutrients in combination in order to optimize brain health.
The last two decades have ushered in a slow, but progressive expansion in the number of clinical trials conducted using a broad-spectrum multinutrient approach to treat psychological symptoms, demonstrating larger effect sizes than single nutrient studies [26,27] with the effects consistently demonstrating a global benefit, while symptom-specific improvement has varied by the rater (e.g., parent, teacher, and self). These broad-spectrum formulas are based on the premise that a multinutrient approach effectively addresses the complex array of cofactor requirements for optimal brain function. To date, there have been no systematic reviews or meta-analyses considering the strength of the multinutrient approach in randomized controlled trials (RCTs) in a clinical population. As such, this systematic review and meta-analysis will evaluate the scientific literature on the use of multinutrient and broad-spectrum multinutrients for the treatment of psychiatric symptoms. Multinutrients are defined, for the purpose of inclusion in this paper, as formulas containing four or more ingredients: vitamins and/or minerals, with most nutrient levels at or below Recommended Dietary Allowances (RDAs), now referred to as Dietary Reference Intakes (DRIs). Broad-spectrum multinutrient formulas are further delineated in this paper as containing a full complement of vitamins and essential minerals, typically 20+ ingredients, many above RDA levels, but below upper tolerable limits (ULs) [28].
Historically, clinicians and consumers have turned to the RDA/DRI as a metric to gauge the sufficient amount of a nutrient needed for optimal health. Developed in 1941 by the National Academy of Medicine (formerly the Institute of Medicine (IOM) of the National Academies), the RDA/DRI is the nutrient level determined to prevent frank deficiency in an otherwise healthy population [28]. In the context of mental health, the RDA is not necessarily an appropriate metric, as RDA levels were not established to account for brain health [29]. As a highly metabolically active organ, the brain may require nutrients at levels higher than the RDA, but at doses below upper tolerable limits (ULs) or lowest observed adverse events levels (LOAELs) [28], particularly in individuals who are experiencing psychiatric symptoms.

2. Materials and Methods

This systematic review was prospectively registered with the National Institute for Health Research website PROSPERO. Details of the protocol can be accessed at: www.crd.york.ac.uk/PROSPERO/display_record.php?RecordID=79164.

2.1. Studies Included

The study selection criteria were defined before searches were completed. Only articles available in English on RCTs were included. Searching was limited to human studies. Abstracts, letters, and conference reports were searched for full-text references. There was no restriction on blinding.

2.2. Participants

Only studies investigating psychological or psychiatric symptoms or outcomes (e.g., acute stress, ADHD, or depression) in humans were included in the review. The selection criteria required that participants were admitted to this study with elevated symptoms on at least one psychological measure, or this study required a psychiatric diagnosis or presentation (e.g., Major Depressive Disorder) for enrollment. Trials in asymptomatic or healthy populations, or trials focused solely on improving cognition, learning or achievement in the absence of a deficit were excluded. Trials on populations with dementia, without externalizing or internalizing behavioral concerns (e.g., aggression, mood, and anxiety) were excluded, as the topic area deemed was appropriate for a separate review. No other exclusion criteria applied (e.g., population age, gender, and sample size).

2.3. Interventions

The selection criteria required that the formulas studied must consist of at least four vitamins and/or minerals. Formulas containing botanicals, amino acids and essential fatty acids (EFAs) were included only if part of a formula or treatment alongside at least four vitamins and/or minerals. A minimum of four was chosen: (1) to capture, for example, the B vitamins essential for the methylation cycle and important for brain health [30] (though studies did not have to contain four B vitamins); (2) to measure the impact of nutrients used as a combination intervention, in contrast to an ’add on’ to another nutrient of interest (e.g., EFAs). Formulas without complete information on specific ingredients (including dose) were excluded (e.g., an herbal formula [31] containing vitamins did not specify ingredients or dose). In this review, the term “multinutrients” is defined as vitamins and minerals, given their importance as necessary cofactors for neurotransmission. No restrictions were placed on intervention length. Studies were required to provide information on treatment responses. Formula brand names were listed when provided.

2.4. Comparators/Control

All control treatments were included: placebos, non-treatment controls (e.g., waitlist), and active controls (e.g., single-nutrient supplements, medications or psychological therapies).

2.5. Outcome Measures

Only studies that used a psychological measure of psychiatric symptoms (e.g., acute stress, mood, and anxiety) were included. Studies that used measures of cognition/cognitive decline/dementia only (without assessing other psychological symptoms such as mood) were excluded. Studies were included regardless of whether the psychological measure was a primary or secondary outcome measure. As per published consensus guidelines [32], authors were inclusive in primary analyses and then explored the sources of heterogeneity, including clinical heterogeneity in subsequent sensitivity analyses [32]. This review’s primary outcome was a change in score on measures of psychological symptoms (e.g., mood, anxiety, and inattention) from baseline to end of intervention period (or last follow up).

2.6. Search Strategies for Identification of Studies

2.6.1. Electronic Searches

Relevant studies were identified through literature searches using MEDLINE, PsycINFO, PsycARTICLES, the Cochrane Central Register of Controlled Trials (CENTRAL) and Google Scholar, for studies published up to 31 May 2019. There was no cut-off date. The searches were conducted using Medical Subject Headings (MeSH) terms where possible and included vocabulary related to micronutrients (e.g., vitamin and mineral), as well as psychological or psychiatric disorders (e.g., autism and ADHD); search strategies were adapted as appropriate for the database. See Appendix A for specific search strategies.

2.6.2. Other Sources

To minimize publication bias, grey literature was searched. Sources including doctoral dissertations, clinical trials registries: the Australian New Zealand Clinical Trials Registry, anzctr.org.au, the European Union Clinical Trials Register, clinicaltrialsregister.eu, and the National Institutes of Health, United States-based ClinicalTrials.gov were searched for any unpublished trials, and the authors were contacted for results. Reference sections from relevant articles were examined for additional resources and included if a study met the criteria.

2.7. Selection of Studies

The Preferred Reporting Items for Systematic Reviews and Meta-Analyses (PRISMA) process was used for study selection. Study identification was conducted by two authors independently and in duplicate (Jeanette Johnstone, Andrew Hughes); discrepancies were discussed and resolved by consensus. Both authors read full abstracts of studies if either rater judged this study to be potentially relevant. If doubt existed, the article was included for the next stage of evaluation. After the screening, all remaining full-text articles were independently screened by the larger team of authors for possible inclusion. Agreement between the raters was monitored using Covidence v2.0, Veritas Health Innovation, Melbourne, Australia, www.covidence.org, and is reported below. Any disagreement was resolved by discussion. The authors of this review were not blind to the authors, journals, results, or conclusions of the included studies.

2.8. Data Extraction

Data from the included studies were extracted by a pair of reviewers independently and in duplicate (Andrew Hughes, Amy Romijn, Jeanette Johnstone) to maximize accuracy. Coded information was extracted using Covidence, and included population, sample size, number of participants in each group, intervention, control product, length of intervention period, and psychological outcome measures used.

2.9. Assessment of Methodological Quality of Included Studies

Studies were scored independently by a pair of reviewers (Andrew Hughes, Amy Romijn, Jeanette Johnstone) using the Cochrane risk of bias tool [33] to assess risk of bias across the following domains: sequence generation, allocation concealment, blinding of participants and personnel, blinding of outcome assessment, incomplete outcome data, selective reporting, and other risk of bias. Any reviewer disagreement was resolved by consensus and recorded using Covidence.

2.10. Data Synthesis and Measures of Treatment Effect

We planned to be cautious when deciding when to pool across studies due to the presumed high level of heterogeneity inherent in this type of study design. Effect sizes were computed using parameters taken from study reports including means and standard deviation (SD) or standard error (SE); correlation coefficients; odds ratios (OR) or a regression coefficient with an N or 95% Confidence Interval (CI); p-value with an N. Effect estimates for continuous outcomes were reported using mean differences or standardized mean differences as appropriate. Because not all statistically significant differences are large enough to be clinically meaningful, findings are presented alongside established or estimated minimal clinically important differences (MIDs) to aid in clinical interpretability. Published MIDs were used if available. If unavailable, authors followed published guidance and used 0.5 SD as an estimate of MIDs [34].

2.11. Missing Data

Reporting of per-protocol (completer) data, rather than intention-to-treat (ITT) data, was noted in the narrative synthesis. Where studies did not present sufficient data and/or statistical test results to allow for the calculation of the effect estimate, authors were contacted. When further information was not available, the authors’ interpretation of their results was outlined in the appropriate table and narrative synthesis, noting insufficient data to calculate effect estimates.

2.12. Assessment of the Quality of the Effect Estimate

We used the GRADE criteria to explore the certainty in the effect estimates reported in this review. While described in detail elsewhere [35], briefly, GRADE assumes that an RCT evidence base begins as high quality, and is ranked down as appropriate by the assessment of the following five domains: (1) risk of bias of the included studies, (2) inconsistency in the effect estimate across studies, (3) indirectness of the outcome measure to the outcome of interest, (4) imprecision of the summary estimate, and (5) publication bias. GRADE rating was performed independently and in duplicate by Joshua Goldenberg and Andrew Hughes, with disagreement resolved by consensus. Based on published guidelines, we used formalized language to discuss the results based on the GRADE rating and magnitude of effect [36].

3. Results

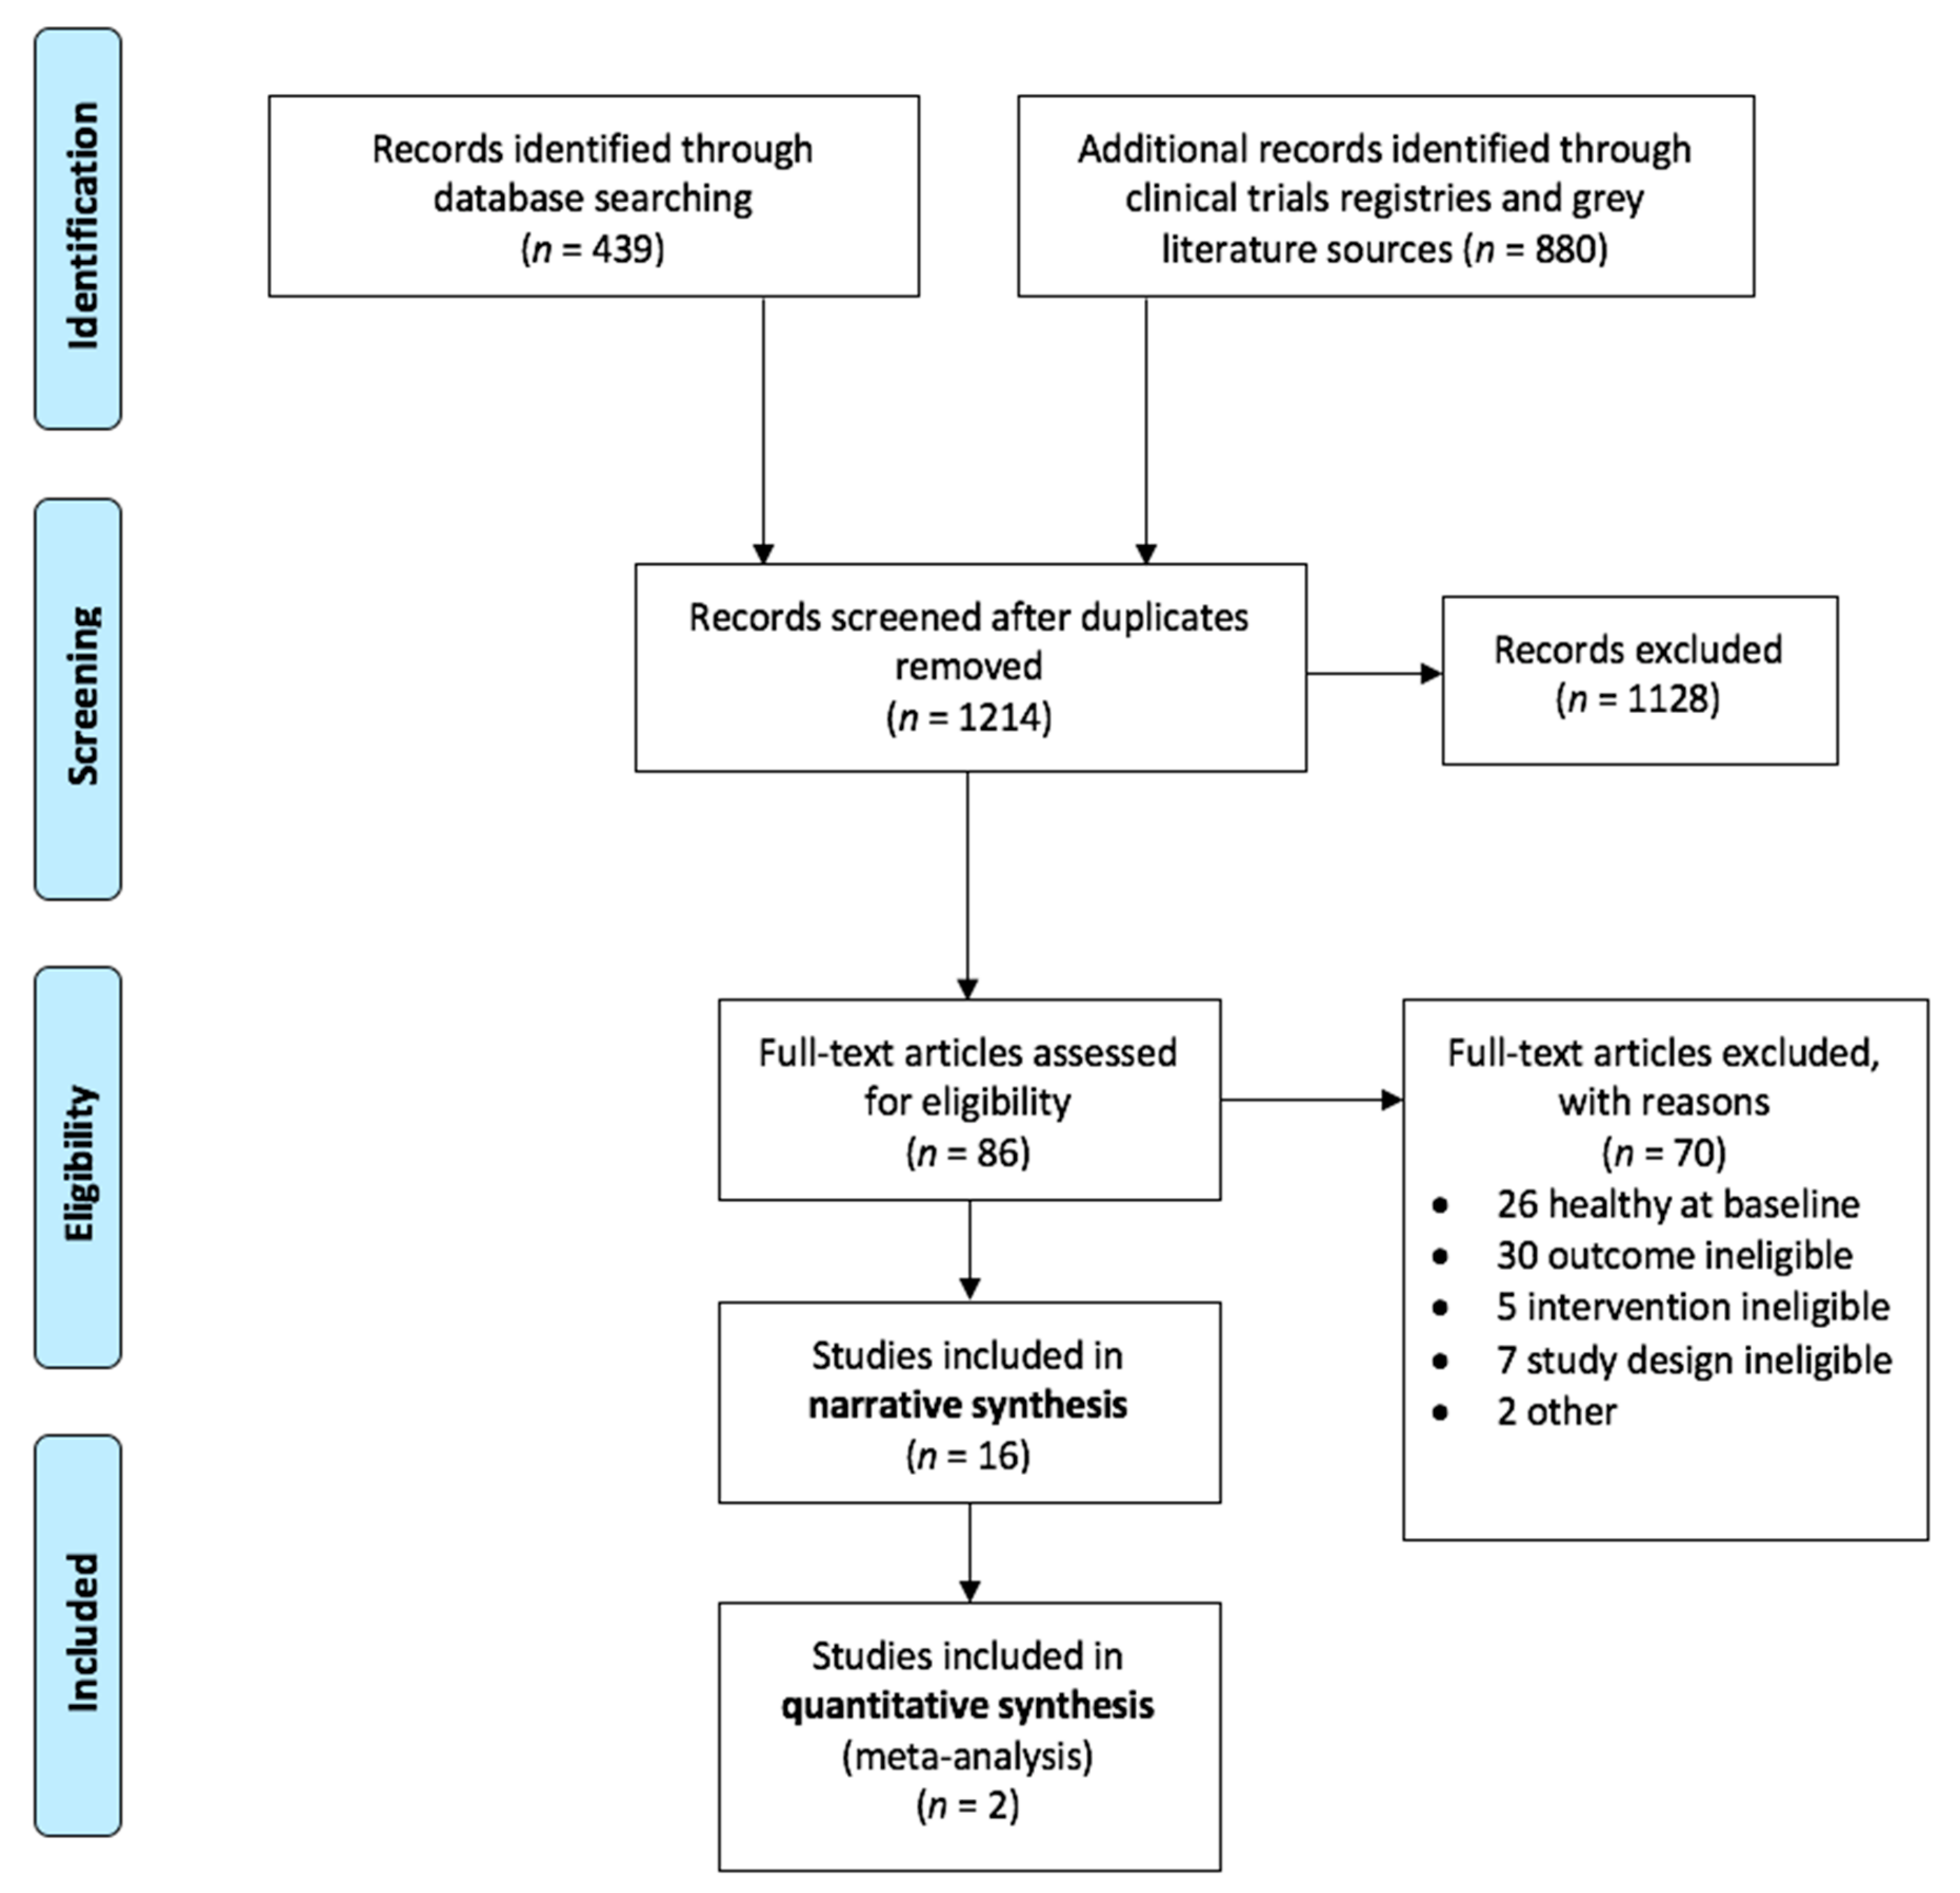
3.1. Study Selection and Inclusion

Figure 1 contains the PRISMA [37] flow diagram for study selection and inclusion. Of the 1214 abstracts screened, 16 studies met the inclusion criteria in the following six psychiatric categories: depression, post-natural disaster stress, antisocial behaviors, behavioral issues in dementia, ADHD, and autism; n = 1737 participants in total. Study characteristics are displayed in tabular and narrative form and described in a narrative synthesis below. If a study was registered prior to initiation, the registration is noted in the table. Because of the heterogeneity among study samples, nutrient formulas, and outcome measures, and due to unavailability of sufficient data to meta-analyze, only two studies were included in a quantitative synthesis meta-analysis [26,27].
Of the 16 studies, one study included only women [38]; one only men [39]; four included only children [27,40,41,42]; one study included adults and children [43]; and the rest only adults, both men and women [26,44,45,46,47,48,49,50,51]. Two of the studies included participants taking adjunct medications for depression [44,47]; the rest of the studies required participants to be off psychotropic medication. Two studies enrolled participants with depressive symptoms plus a genetic or inflammatory marker associated with depression [45,46]. One study added exercise and light exposure as part of the active treatment [38]. One study used vitamin D as an active control [48]. One study pooled two groups: a polyunsaturated fatty acids (PUFAs) plus multinutrients group with a PUFA-alone group and compared them to placebo. The researchers compared the PUFA groups to one another [41].

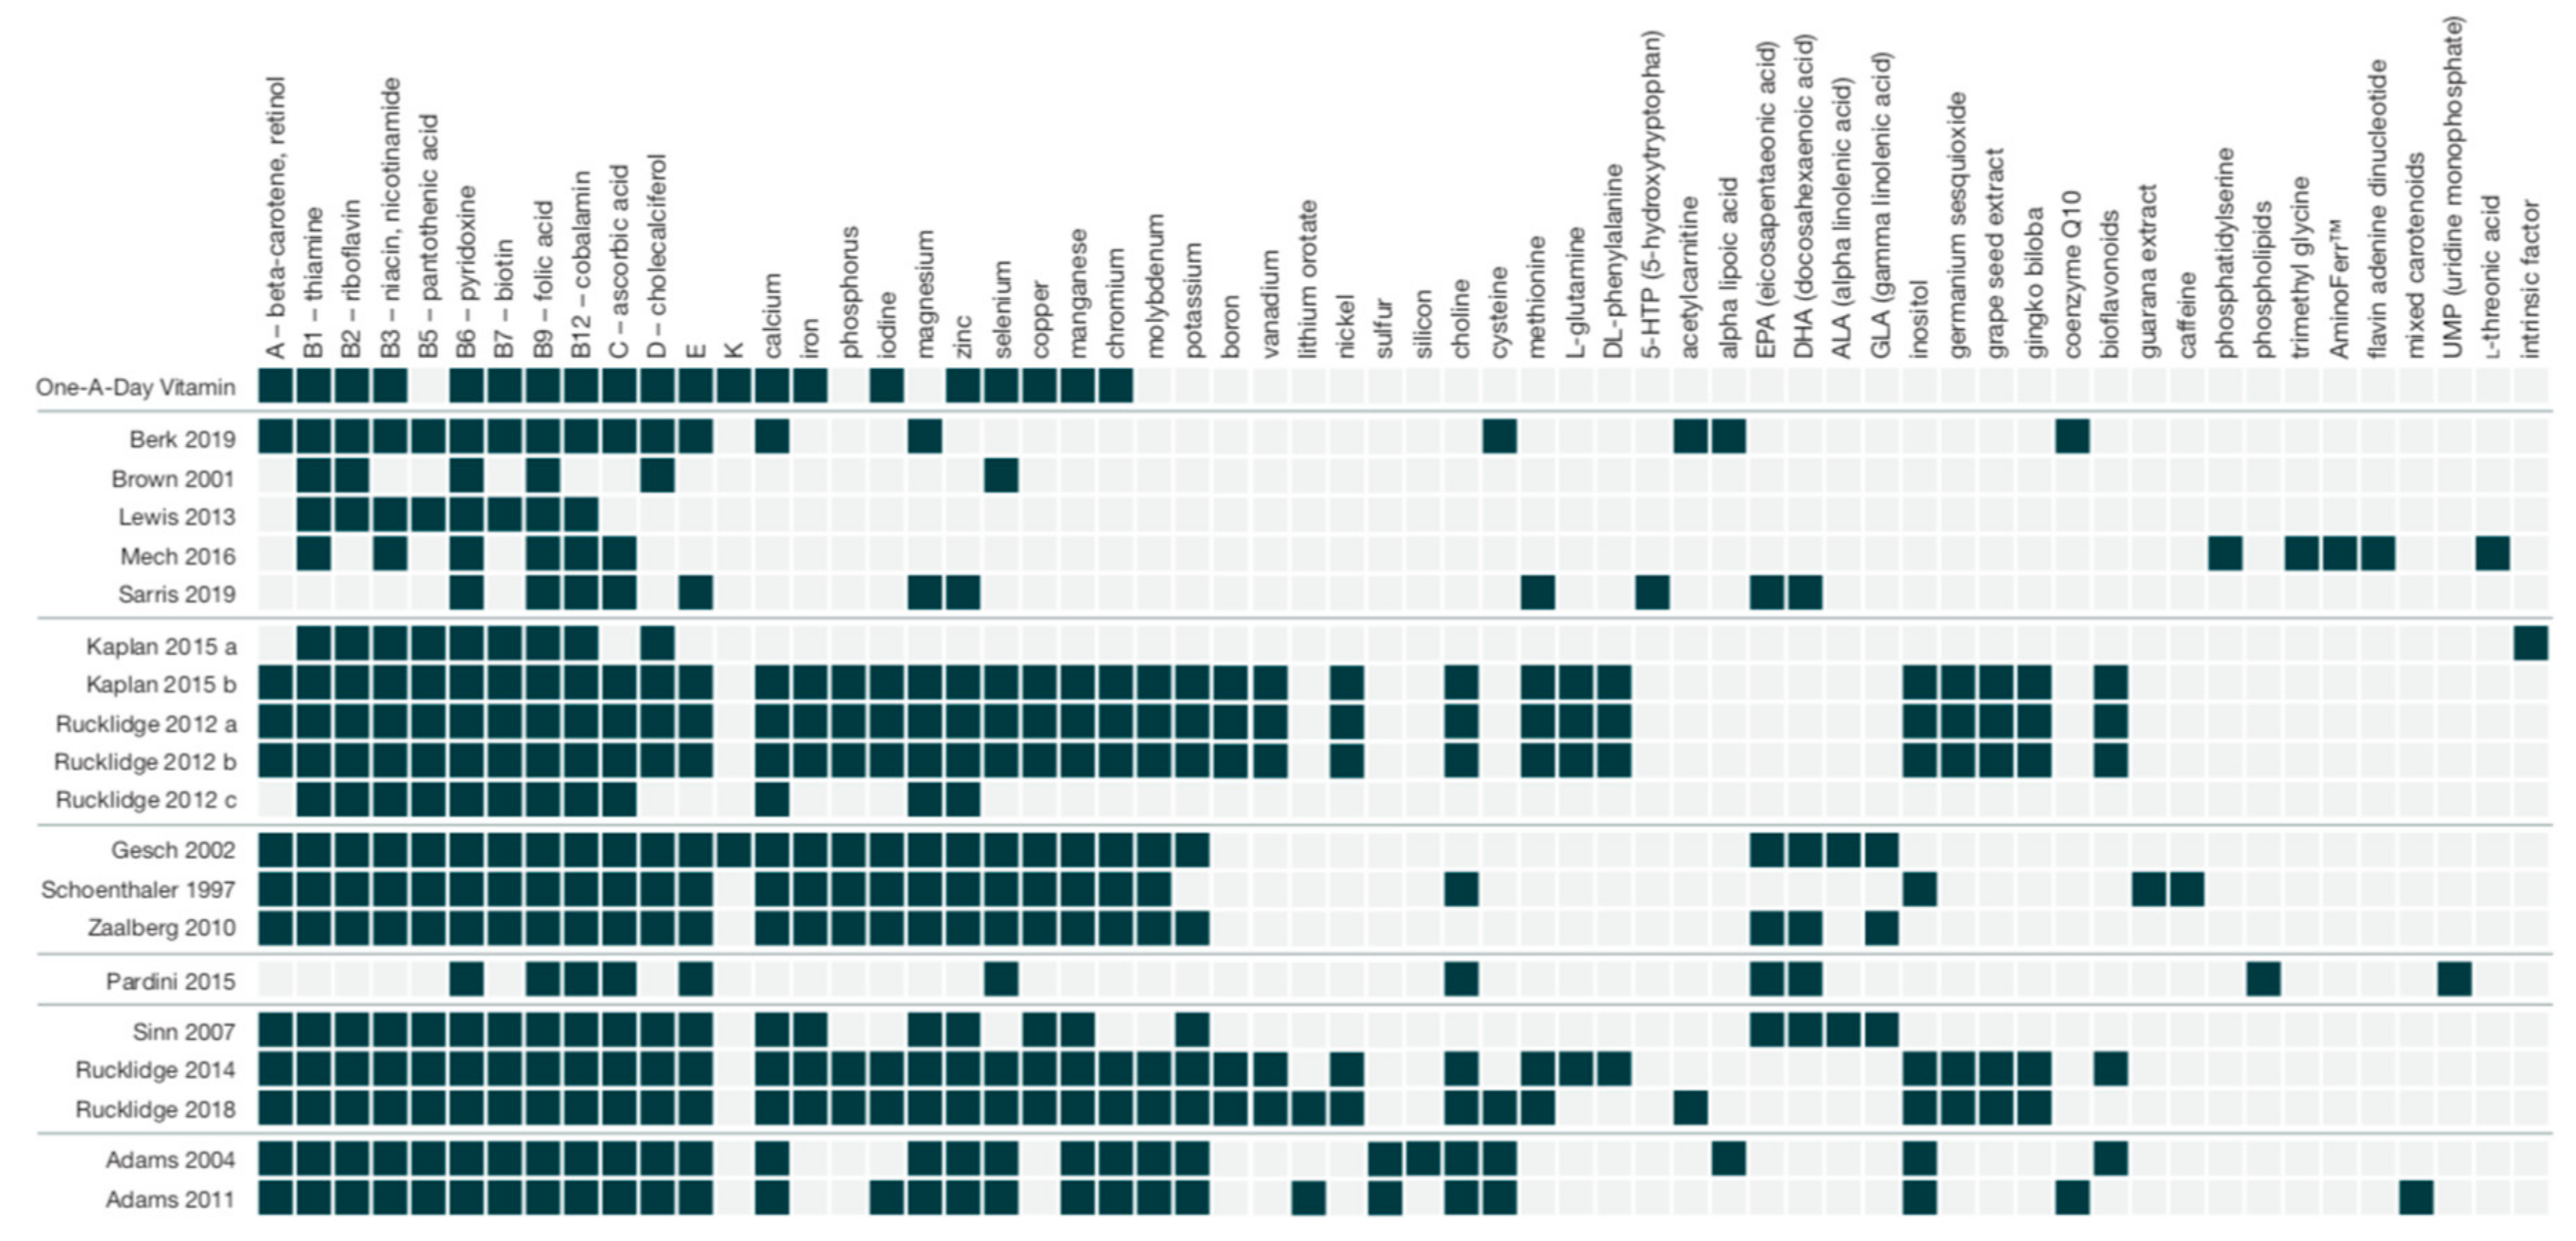
3.2. Formula Ingredients

Per the inclusion criteria, studies used formulas with ≥4 ingredients; range: 6–36. All the formulas contained vitamins B6, B9, and B12; thirteen of the formulas contained vitamin D; all the formulas except two included minerals [45,46]; range of minerals: 1–15. Ingredients and dosages for each of the formulas are listed in the tables. A visual representation of the included ingredients in each study’s formula is found in Figure 2. An over-the-counter formula, One-A-Day, is included for comparison in Figure 2, Figure 3 and Figure 4. In addition to differences between formula ingredients, the dosage of individual ingredients varied widely, with nutrients at or below the RDA, and others at levels 10–50× the RDA, but below ULs or LOAELs. For comparison across studies, the vitamin and mineral dose ranges, based on the RDA, are shown in Figure 3. Ingredients in the formulas used in the depression studies, plus a study of adults with ADHD, some of whom had moderate depression at baseline, are depicted in Figure 4. Figure 5 illustrates the forest plots of the meta-analysis. Figure 6 shows dosage comparison between formulas for magnesium and zinc, two minerals important for neurotransmission.

3.3. Psychiatric Categories

3.3.1. Depression

Five studies investigated the impact of multinutrients on depression [38,44,45,46,47] (n = 707). See Table 1. The patient populations in these studies ranged from those with mild to moderate depressive symptoms [38], to adults classified with treatment-resistant Major Depressive Disorder (MDD) [47]; patients with MDD and an elevated inflammatory marker [46], or genetic polymorphism [45], and adults with bipolar disorder and current depressive symptoms [44]. Four of the studies lasted 8 weeks [38,45,46,47], and one lasted 16 weeks [44]. The key outcome for depression improvement was measured using the following instruments across the studies: the Montgomery-Asberg Depression Rating Scale (MADRS) [52], the Beck Depression Inventory (BDI) [53], and the Center for Epidemiologic Studies Depression Scale (CES-D) [54].
Three studies utilized the MADRS [44,45,47]. However, heterogeneity in populations, the inclusion criteria, and formula variations precluded meta-analysis. Berk et al., 2019 [44] enrolled 181 participants (115 included in the completer analyses) with a diagnosis of bipolar disorder who were currently experiencing depressive symptoms and were on a stable dose of medication (antidepressant, mood stabilizer, antipsychotic, or benzodiazepine). A statistically significant improvement was not observed with multinutrients compared to placebo after 16 weeks, with a mean difference (MD) −0.4, p = 0.91. However, 4 weeks post-discontinuation (20 weeks after baseline), a statistically significant mean difference on the MADRS of −5.2 (p = 0.03) was reported in the 110 completers, which is clinically significant, based on the estimated minimal clinically important difference (MID) (range: 1.6–1.9) [55]
Mech et al., 2016 [45] enrolled 330 participants (282 included in completer analyses) with major depression and an identified methylenetetrahydrofolate (MTHFR) (C677T or A1298C) polymorphism. The authors reported a mean change score difference between the multinutrient and placebo groups of −10.7 on the MADRS, which is clinically significant based on the estimated MID (range: 1.6–1.9) [55] (between group p-value not provided).
Sarris et al., 2019 [47] enrolled 158 participants (113 included in the completer analyses) with MDD who were taking an antidepressant for at least 4 weeks. The observed mean difference of multinutrients over placebo of −1.75 was not statistically significant (p = 0.33).
Two studies utilized the BDI to compare multinutrients to placebo for adults with depressive disorders [46,47]. The populations were too heterogeneous to meta-analyze: Lewis et al., 2013 [46] enrolled participants depressed at baseline with elevated homocysteine levels, while Sarris et al., 2019 [47] enrolled treatment-resistant participants taking antidepressant medication. Lewis and colleagues studied 60 adults, and although authors reported improvements in the intervention group compared to placebo on the BDI, they also stated “effect for time by randomization was not significant,” suggesting that multinutrients did not demonstrate a statistically significant difference compared to placebo (MD −0.4, p-value not provided). The 113 participants studied by Sarris et al. (2019) [47] did not demonstrate a statistically significant difference for multinutrients compared to placebo (MD −4.4, p = 0.13).
Brown et al. (2001) [38] enrolled 104 adult women with mild to moderate depression, utilizing the CES-D to compare multinutrients to placebo in intention-to-treat (ITT) analyses. A statistically, but not clinically, significant difference after 8 weeks was observed (MD −3.1, p = 0.004, estimated MID = 4.0) [34].
For the outcome of clinical improvement in depression, we rated the overall quality of the evidence base (GRADE) for multinutrients to be low. We rated down once due to inconsistency because the effects were not consistent across studies and populations, and once for imprecision, because we were unable to pool effect estimates across studies, and individual study estimates were imprecise. See Table 2, GRADE-Summary of Results. Overall, multinutrients may improve symptoms in individuals with bipolar and current depressive symptoms taking medication after 20 weeks (not significant at 16 weeks). In women with mild to moderate depression, multinutrients may improve symptoms slightly. In other studies (Lewis et al., 2013 [46], Mech et al., 2016 [45], Sarris et al., 2019 [47]) multinutrients may have little or no difference in outcome, though insufficient data were available to enable exact qualification [45,46].

3.3.2. Post-Natural Disaster Stress

Two unblinded randomized studies examined the effect of broad-spectrum multinutrients on acute post-natural disaster stress [48,49] (n = 147, ITT analyses), with treatment ranging from 4 to 6 weeks. See Table 3.
Rucklidge at al. 2012 [49] included 91 adults experiencing elevated symptoms of depression, anxiety or stress after the 2011 earthquake in Christchurch, New Zealand, while Kaplan et al., 2015 [48] examined the impact of multinutrients in 56 adults experiencing elevated symptoms of depression, anxiety or stress after the 2013 floods in Alberta, Canada. Both studies used the Depression Anxiety and Stress Scale (DASS) [56] as a primary outcome measure; and for ethical reasons, both studies used active-only control treatments, no placebo. Rucklidge [49] compared two different doses of EMP+TM (4 or 8 capsules, daily), a broad-spectrum multinutrient formula containing 36 ingredients, to BeroccaTM, a B complex, which also contains minerals, as an active control [49]. Kaplan et al., 2015 compared EMP+ with a B complex and used vitamin D alone as an active control [48]. Methodological heterogeneity involving the use of all active treatments in the Rucklidge [49] study precluded meta-analysis. Both studies reported significant within-group reductions in symptoms among all groups in the studies. Rucklidge [49] found no significant differences between the B complex and EMP+ on primary outcomes, as measured by the DASS. However post-hoc analysis indicated that high-dose EMP+ showed significantly greater clinical improvement over the B complex control intervention, as measured by a modified Clinical Global Impression-Improvement rated by the participants on subscales for mood (p < 0.05) and anxiety (p < 0.05). Kaplan [48] reported that EMP+ and B complex were significantly more effective than the single nutrient vitamin D comparator [47]. Compared to vitamin D, the EMP+ group had greater improvement on the DASS subscales for anxiety (d = 1.08, 95% CI = 0.37–1.79, p < 0.05) and stress (d = 0.88, 95% CI = 0.19–1.58, p < 0.05) and the B complex group also had greater improvement on anxiety (d = 0.89, 95% CI = 0.22–1.57, p < 0.05) and stress (d = 0.76, 95% CI = 0.10–1.43, p < 0.05).
We rated the overall quality of the evidence base (GRADE) for multinutrients for post-natural disaster stress to be low. We rated down once for imprecision because we were unable to pool effect estimates across studies, and individual study estimates were imprecise. We rated down once for risk of bias as both studies were unblinded. See Table 2. Overall, multinutrients and B complex may improve symptoms of mood, stress and anxiety following a natural disaster based on self-report, with a possible additional benefit of multinutrients in improving mood and anxiety over B complex.

3.3.3. Antisocial Behaviors

Three studies investigated the impact of multinutrients on offending behaviors in incarcerated populations, two in adults: Zaalberg et al., 2010 and Gesch et al., 2002 [39,50], and one in adolescents: Schoenthaler et al., 1997 [40] (n = 445); all used completer analyses. Trial length ranged from 2 weeks to 9 months. All three studies used a broad-spectrum multinutrient approach, with the number of ingredients ranging from 18 to 29, provided at or above RDA levels. See Table 4.
Two studies [39,50] investigated the effect of multinutrient supplementation compared to placebo on disciplinary incidents per 1000 prison days in populations of adult prisoners (n = 393). Due to insufficient data (lacking CIs or group percentages), studies could not be combined for meta-analysis. Gesch [50] reported that 177 participants receiving the active intervention committed 26.3% fewer offences (95% CI 8.3–44.3%; p = 0.03) than the placebo group, but insufficient data were provided to calculate between group differences. Zaalberg [39] (n = 221) also reported a reduced number of incidents in the active group (p = 0.017) and an increase in the placebo group. Zaalberg [39] reported non-significant effects of multinutrients compared to placebo on the Social Dysfunction and Aggression (SDAS) and the Symptom Checklist 90 (SCL-90) scales.
Schoenthaler et al., 1997 [40] investigated the effect of multinutrient supplementation on the number of violent rule infractions in a population of incarcerated individuals (n = 62) aged 13–17. The multinutrient group observed a decrease in mean rule violations per subject of 2.85 in the treatment arm, compared to 1.63 in the placebo arm, a difference which was statistically significant (p = 0.005).
We rated the overall quality of the evidence base (GRADE) of multinutrients for antisocial behaviors to be low. We rated down once for imprecision because we were unable to pool effect estimates across studies and individual study estimates were imprecise. We rated down once for risk of bias as blinding was broken in Zaalberg [39] and was assessed as having a high risk of bias. See Table 2. Overall, multinutrients may improve offending behaviors in incarcerated individuals.

3.3.4. Behavioral Issues in Dementia

One study, Pardini et al., 2015 [51] investigated the use of multinutrients or placebo for the behavioral variant of frontotemporal dementia (bv-FTD) in 26 adults, aged 50–65 years, for twelve weeks, with a crossover to the other intervention for another 12 weeks. Participants were required to have a previous bv-FTD diagnosis for inclusion. See Table 5. Measures included the Clinical Global Impression-Severity (CGI-S) and the Neuropsychiatric Inventory (NPI). A statistically and clinically significant effect of multinutrients compared to placebo was found using the CGI-S (p < 0.01, MD −1.15), which was larger than the estimated MID of 0.5 [34]. However, using the NPI instrument, this study suggests a statistically significant, but not clinically significant effect (MD −4.70, p < 0.01, estimated MID −8.2) [57].
We rated the overall quality of the evidence base (GRADE) to be low. We rated down twice for imprecision as there was only a single study with very few participants (Table 2). Overall, multinutrients may improve symptoms related to bv-FTD as measured by clinician-rated severity and may slightly improve symptoms as measured by the NPI.

3.3.5. ADHD

Three studies investigated the impact of broad-spectrum multinutrients in populations with ADHD: two in children [27,41] and one in adults [26]. See Table 6. Two Rucklidge studies [26,27] were sufficiently homogenous for meta-analysis and examined global and ADHD symptom improvement in 173 patients (80 adults, 93 children). Global assessments were measured with the Global Assessment of Functioning (GAF) scale for adults [58], and the Children’s Global Assessment Scale (CGAS) [59]. Global improvement was measured using the CGI-I overall and the Clinical Global Impression-Improvement-ADHD scale (CGI-I-ADHD). ADHD symptom improvement was measured with the Connors’ Rating Scales (CRS) and the Connors’ Adult ADHD Rating Scale (CAARS).
Based on the meta-analysis, there were statistically and clinically significant improvements on global functioning on the GAF and the CGAS (MD −3.3, p = 0.001, MID −3.26; SMD −0.49 p = 0.001 MD −0.5); and clinically and statistically significant improvements in clinician-rated CGI-I overall scores (MD −0.58, p = 0.001, MID −0.5), CGI-I ADHD scores (MD −0.54, p = 0.002, MID −0.5) and the Clinician-rated ADHD Inattention Change Score (MD −1.53, p = 0.05, MID −0.5). No effect was found for clinician-rated total ADHD change or hyperactivity scores. No effect was observed for pooled observer-rated ADHD scores. However, ADHD symptom improvement was clinically and statistically significant in the study of adults when measured by participant-report (MD −6.71, p = 0.009, estimated MID −5.4) [34]. See Figure 5.
A post-hoc sensitivity analysis revealed that 21 adults in the Rucklidge et al., 2014 study [26] met the criteria for moderate depression at baseline (MADRS score >/= 20). Participants in the micronutrient group demonstrated greater change in symptoms compared to those in the placebo group: micronutrient group: n = 11, MD = 9.5 standard error (SE) = 2.7; the placebo group: n = 10, MD = 5.1 SE = 2.0, p = 0.039, effect size (ES) = 0.64.
A third study, Sinn and Bryan, 2007 [41], compared the effects of two groups combined (a polyunsaturated fatty acids (PUFAs) plus multinutrients group and a PUFA-alone group) to placebo among 87 children with ADHD (completers’ analyses). Based on the Connors’ Parent and Teacher Rating Scales, the combined PUFA groups demonstrated significant improvements compared to placebo on parent ratings of inattention, hyperactivity/impulsivity, and ADHD index scores, but not teacher-rated scales. However, there were no group differences between the PUFA + multinutrients group compared with PUFA alone. Multinutrients alone were not compared to placebo. See Table 6.
We rated the overall quality of the evidence base (GRADE) for global/symptomatic improvement in ADHD to be low. We rated down once for inconsistency as there was considerable variation in the estimated effect between the different study instruments and raters. We rated down once for imprecision as the total sample size did not meet the optimal information size, See Table 2. Overall, depending on the formula used, multinutrients may improve ADHD symptoms based on clinician-rated global functioning and inattention, and self-report ADHD measures, but not observer-rated measures, or clinician-rated hyperactivity (Rucklidge et al., 2014 and 2018). In one study [41], insufficient data were reported to enable exact qualification of multinutrient outcomes.

3.3.6. Autism

Two studies, one in children and adults with autism, Adams et al., 2011 [43] (n = 104), and one in children with autism, Adams and Holloway, 2004 [42] (n = 20), both three months in duration, examined a broad-spectrum multinutrient formula containing 29 ingredients, at doses typically higher than the RDA. See Table 7. Enrollment required a prior diagnosis of autism, pervasive developmental disorder/not otherwise specified, or Asperger’s syndrome by a psychiatrist or other clinical professional.
Clinical improvement in autism was based on the Parent Global Impressions (PGI)-Revised scales. Among the 20 children with autism, multinutrients demonstrated a statistically and clinically significant effect on the PGI sleep subscale (MD = 1.1, p = 0.03, MID −0.5) [42]. Among 104 children and adults with autism, multinutrients demonstrated a statistically significant (all p-values ≤ 0.02), but not clinically significant difference on the PGI overall, hyperactivity, tantrumming, and receptive language subscales, based on the CGI-I MID of 0.5 (MD = 0.33, p < 0.01) [34]. While the studies were adequately homogenous for pooling, insufficient data were available for meta-analysis. See Table 2.
We rated the overall quality of the evidence base (GRADE) for global impression in autism to be low. We rated down once due to inconsistency because the effects were not consistent across studies and populations. We rated down once for imprecision, because we were unable to pool effect estimates across studies and individual study estimates were imprecise. See Figure 2. Overall, multinutrients may slightly improve some autism outcomes.

4. Discussion

This paper systematically reviewed the RCT literature using multinutrient formulas containing vitamins and minerals as treatment for psychiatric symptoms in clinical populations. Sixteen studies were identified across six clinical areas (depression, post-disaster stress, antisocial personality behaviors, and behaviors in dementia, ADHD, and autism), with one to three studies within each category, except for depression, with five studies. Given the heterogeneity of the study formulas, populations, outcome measures used, and the absence of complete data reporting for both the active and placebo groups, only the ADHD domain could be meta-analyzed. The overall quality of evidence (GRADE) for the six areas ranged from very low to low. The limited number and small sample sizes of available RCT evidence led to down rating for imprecision across all areas. Additional concerns included risk of bias and inconsistency. Despite signals of important clinical benefit emerging across several of the studies (based on MID), alongside a substantial literature showing multinutrient benefit based on experimental methodologies beyond the traditional RCT design [60], the consistency in robust positive findings for multinutrients based on RCT evidence is lacking. Four key reasons are highlighted for these inconsistencies, which could be addressed in future studies.

4.1. Populations and Outcomes Studied

One striking finding is how few studies have been conducted using a multinutrient approach with clinical samples based on the criteria from the Diagnostic and Statistical Manual (DSM). Within this review, the DSM criteria were used in four studies of MDD, three of ADHD, two of autism and one of behavioral variants of dementia. Indeed, most studies using a multinutrient approach are conducted on non-clinical samples [61]. In these populations, given the low symptom levels at baseline, smaller effects may be observed due to a floor effect, hindering the ability to detect meaningful change. Another change consideration is the outcome of interest. Given the possible biological effects of multinutrients (e.g., optimizing neurotransmitter synthesis [62], enabling adenosine triphosphate (ATP) production [63], altering the microbiome [64], the changes may be more appropriately classified as “a metabolic tune-up” [65] and reflected in global improvement, rather than treatment of a particular symptom. For example, in the two ADHD studies where meta-analyses were possible, the most robust effects were global-the GAF/CGAS ratings: ES = 0.46/0.48; the CGI: ES = 0.57, 0.46. In contrast, effects were inconsistent for the core ADHD symptoms, depending on the rater. In narrative synthesis, Adams et al.’s autism study [43] reported a global beneficial effect with a medium effect size = 0.46 and Pardini [51] showed a significant group difference on change on the CGI-Severity score. In the prison studies, the reduction in disciplinary incidents may be interpreted as a global “calming” effect observed as reduced aggression and rule breaking behavior. Aggression also improved in the child ADHD study [27], as reported by parents and teachers. Future research would benefit from focusing on the global effect of multinutrients on observable and measurable psychiatric problems, based on the DSM diagnostic criteria.

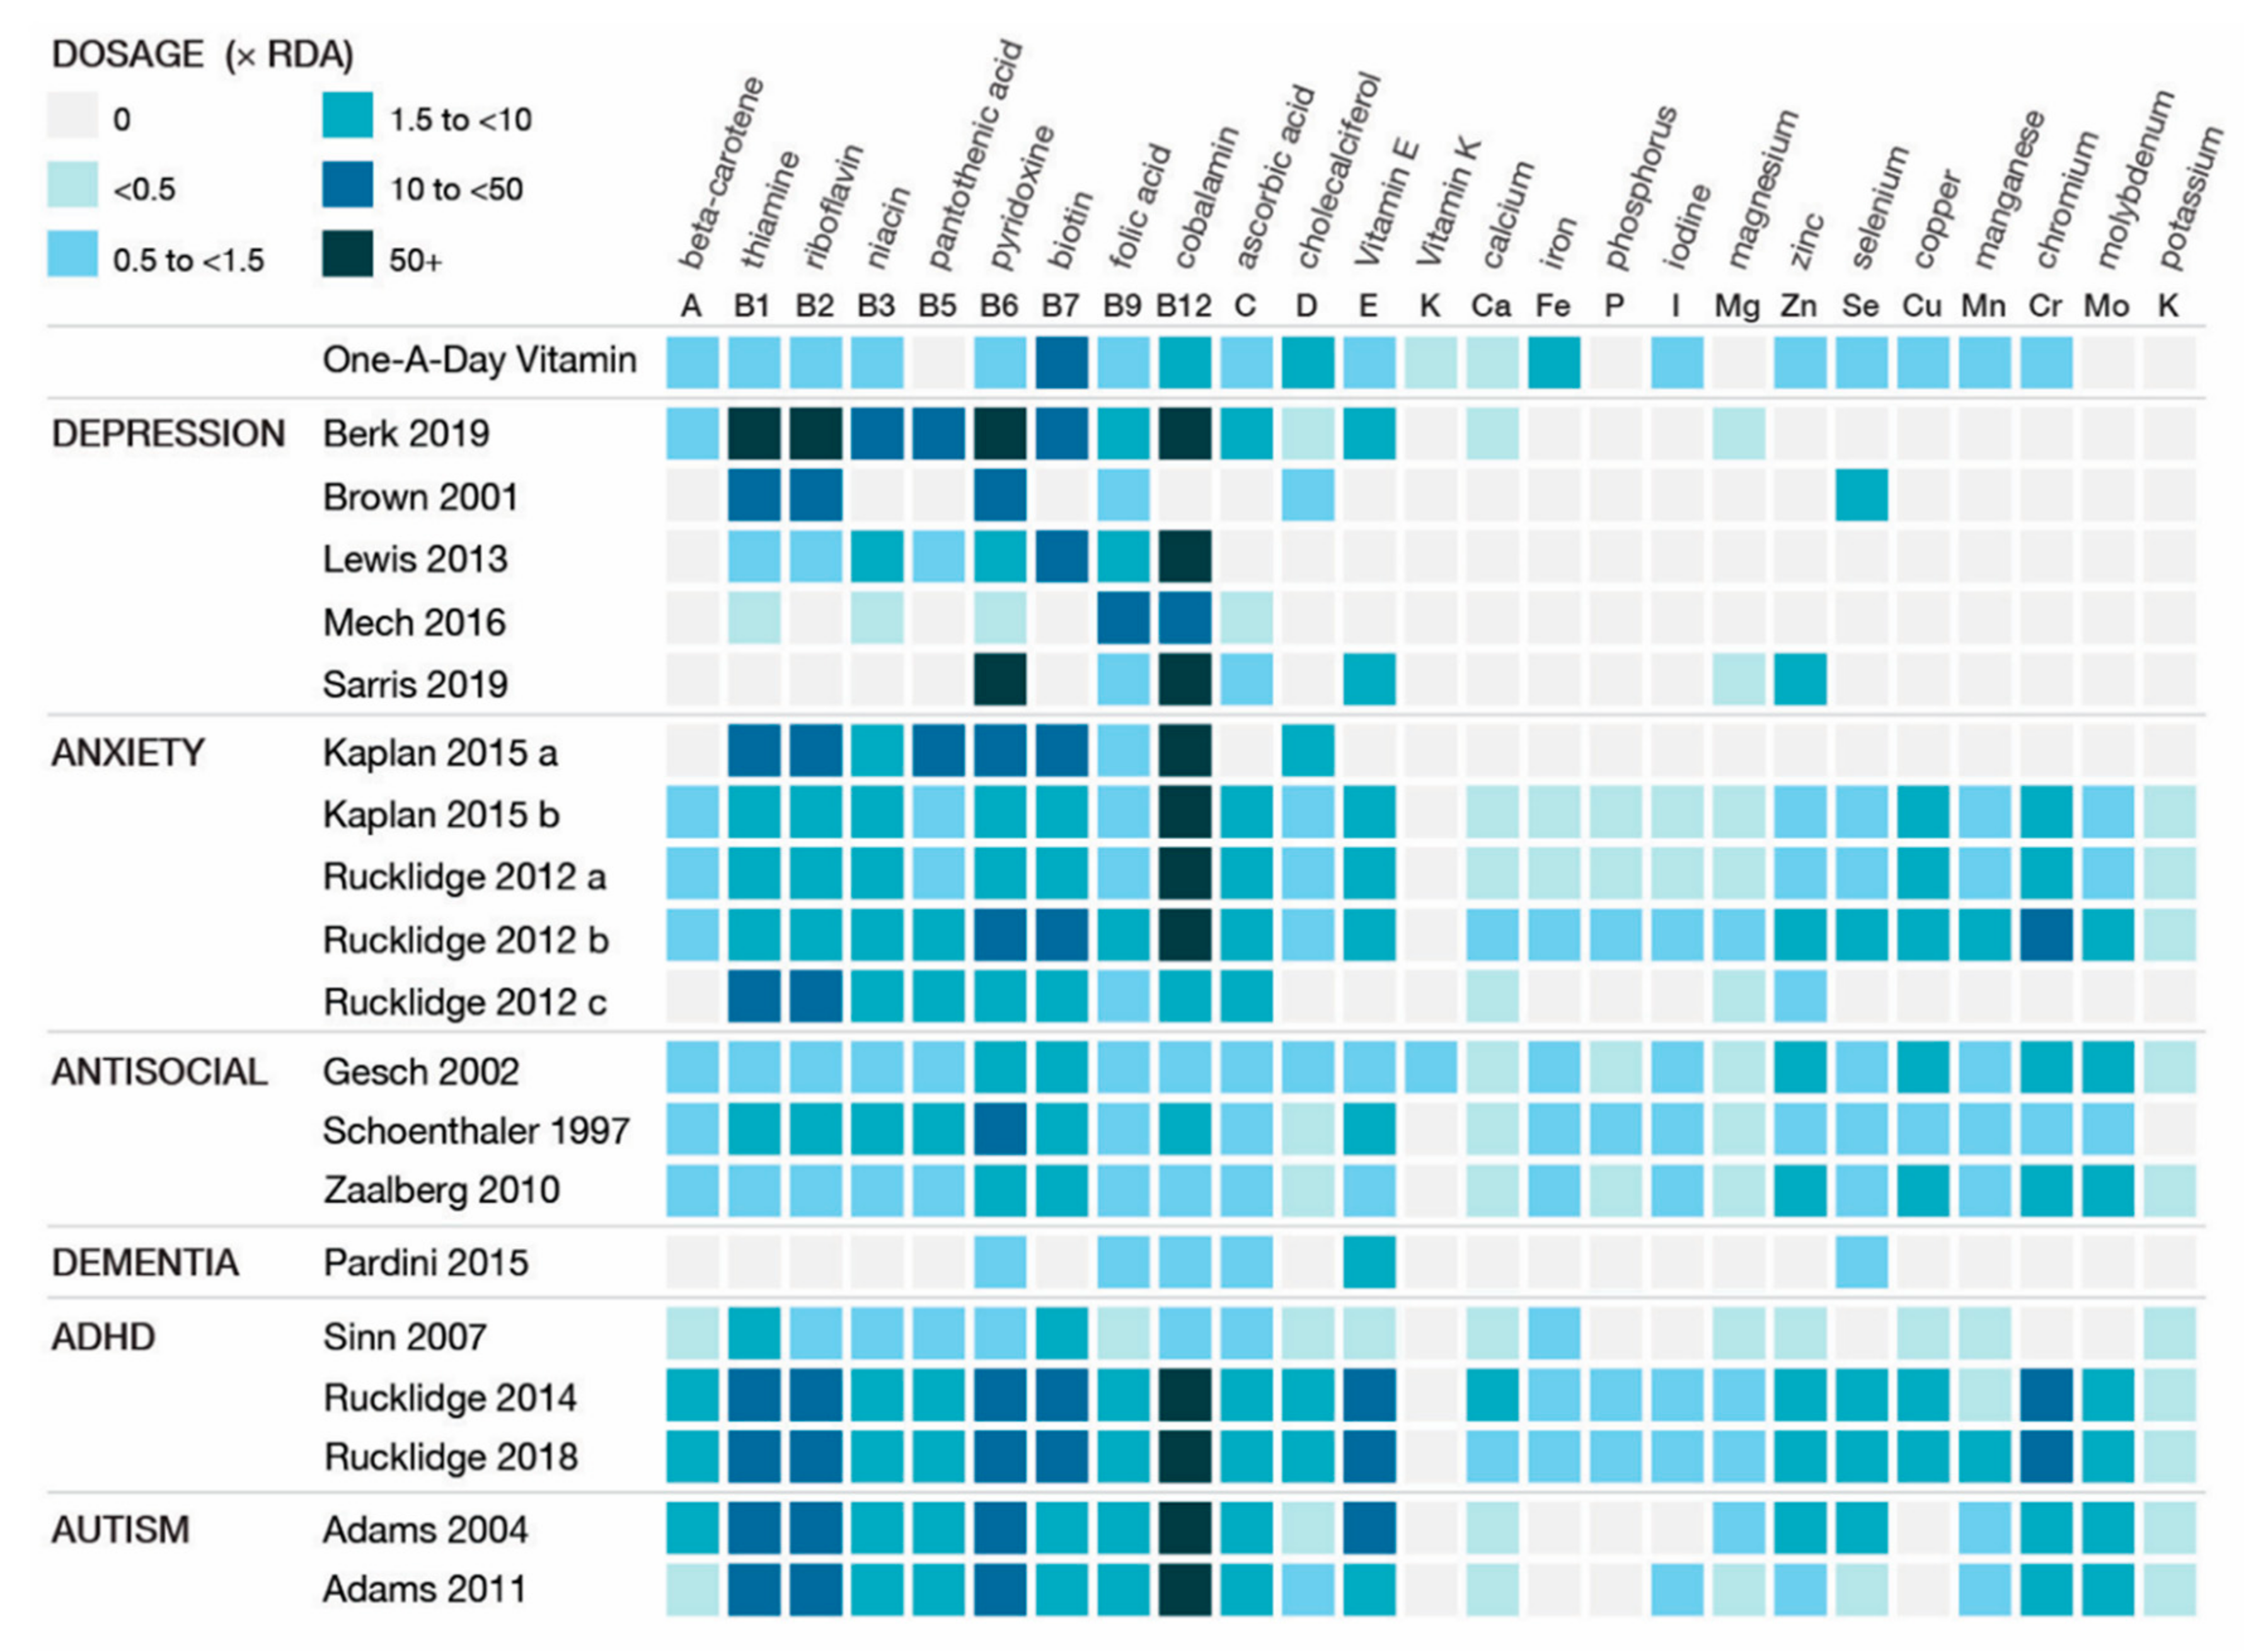
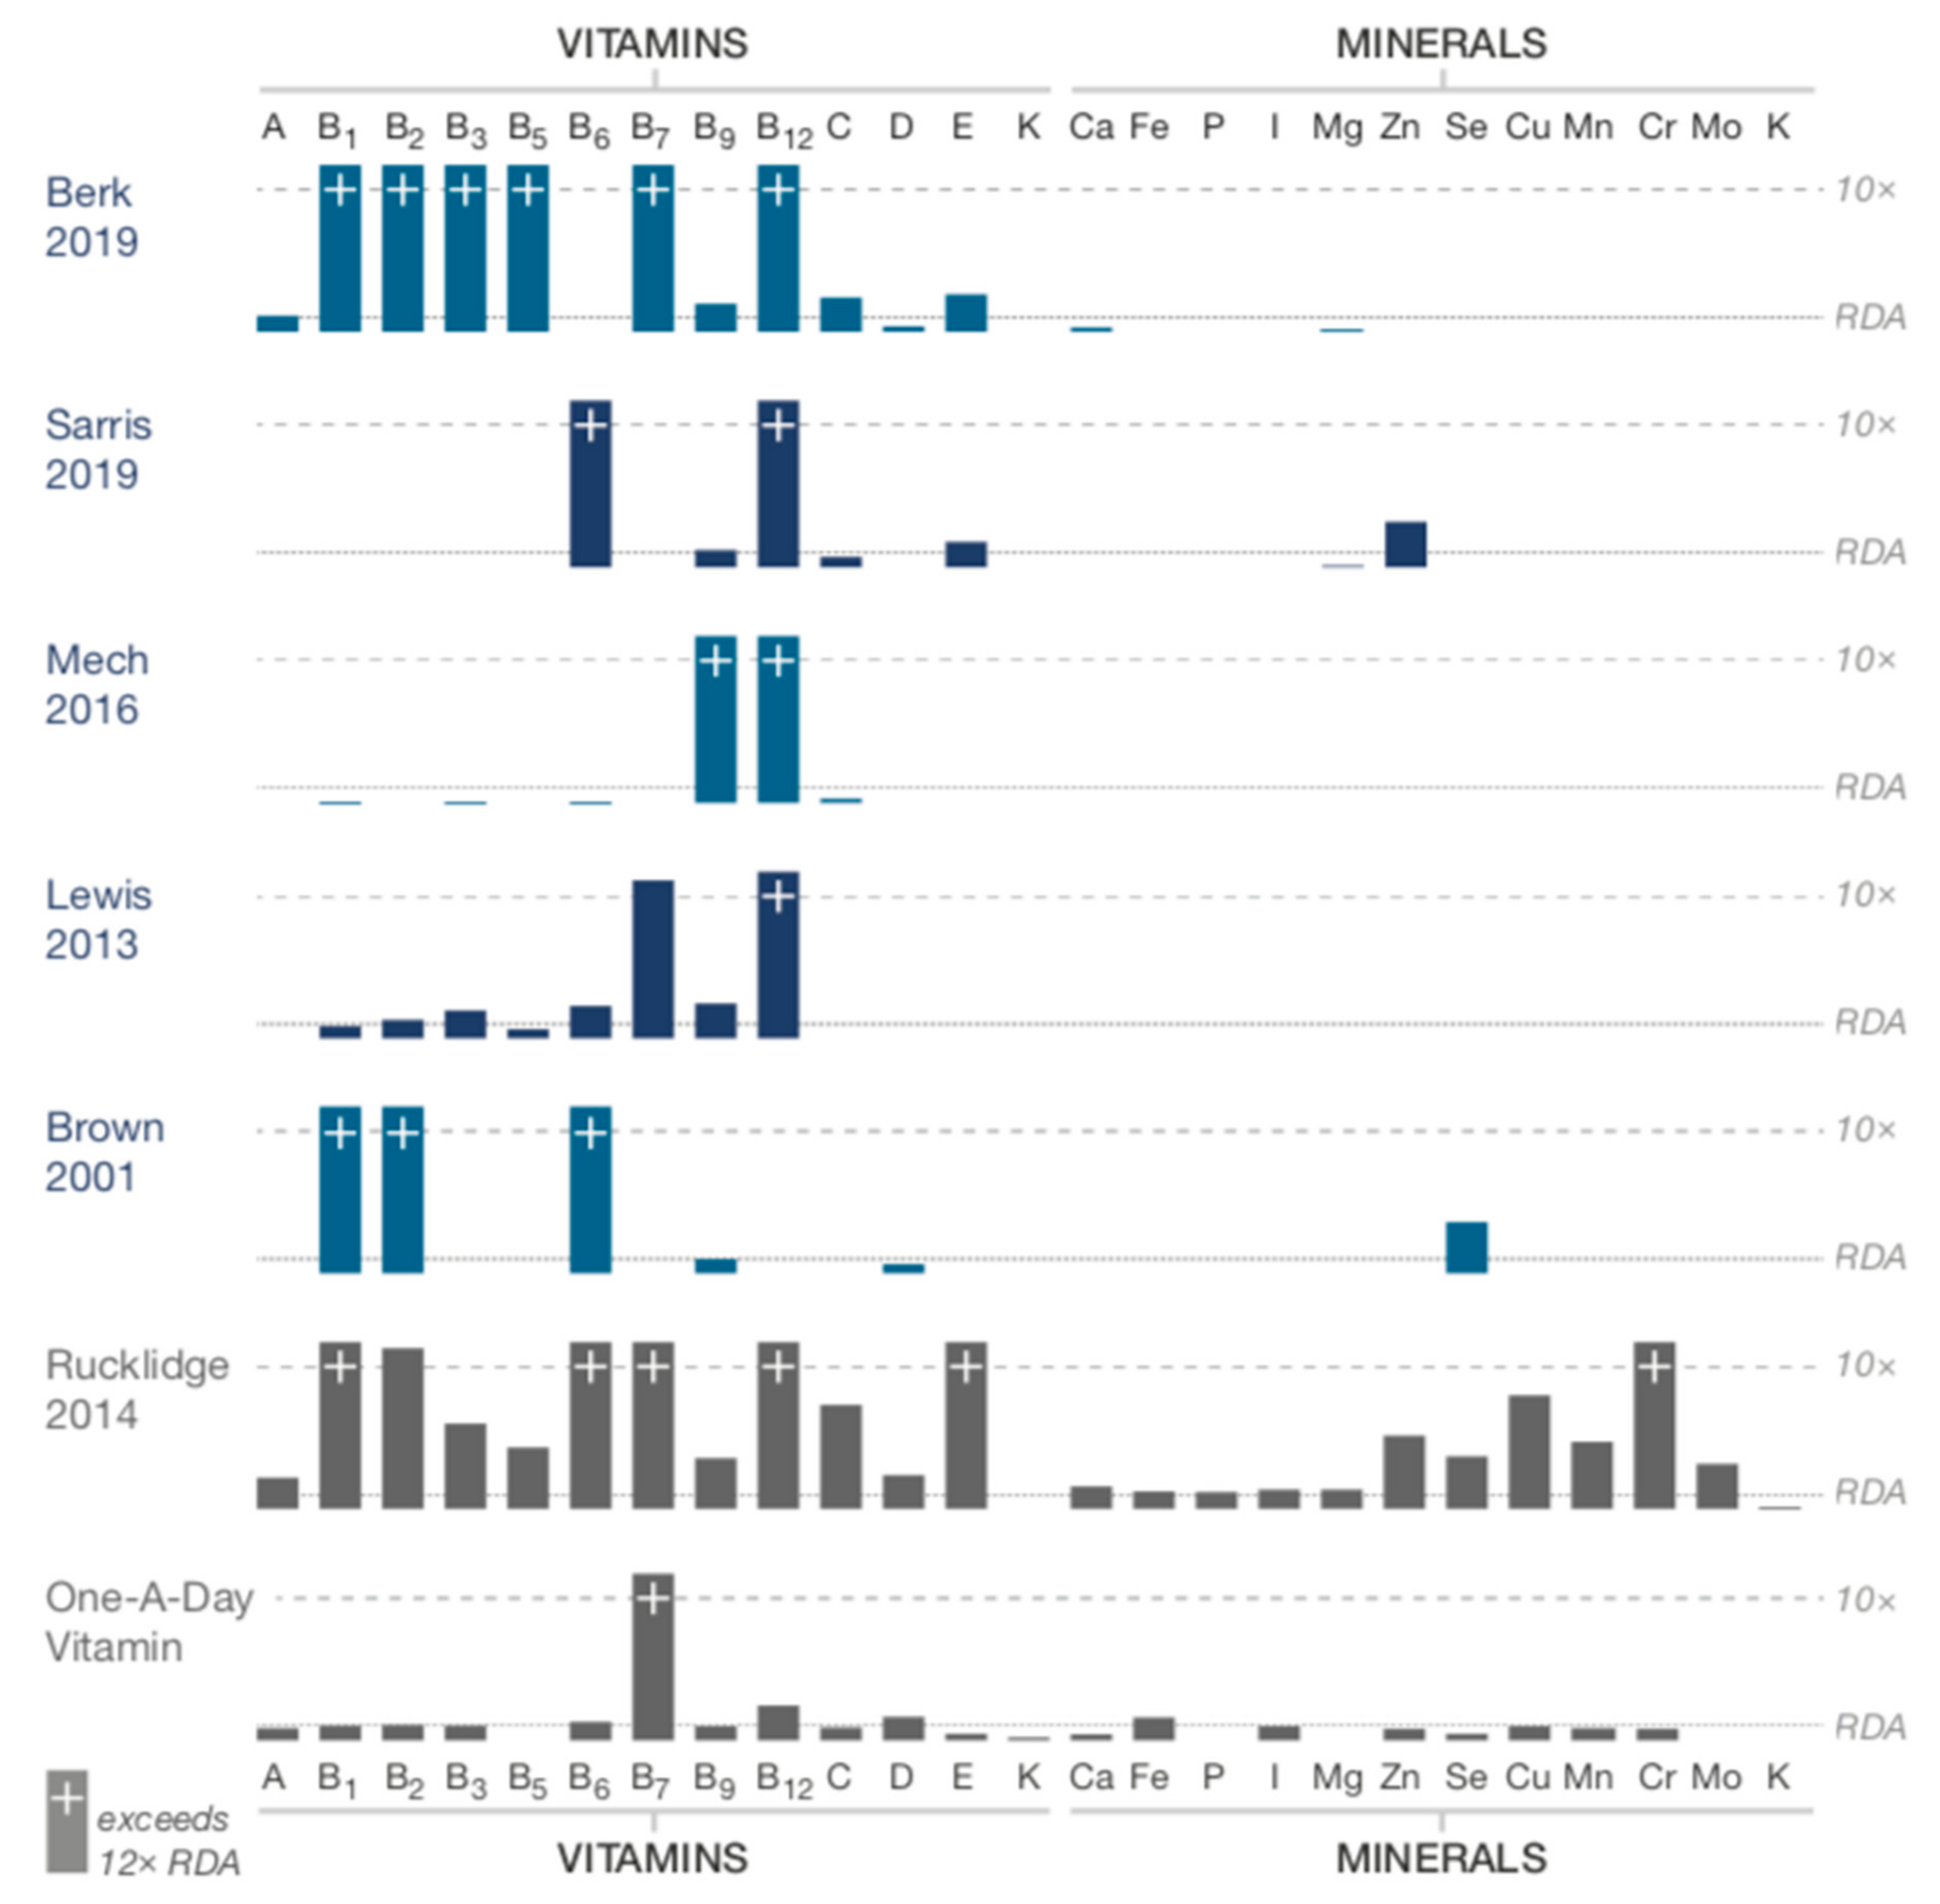
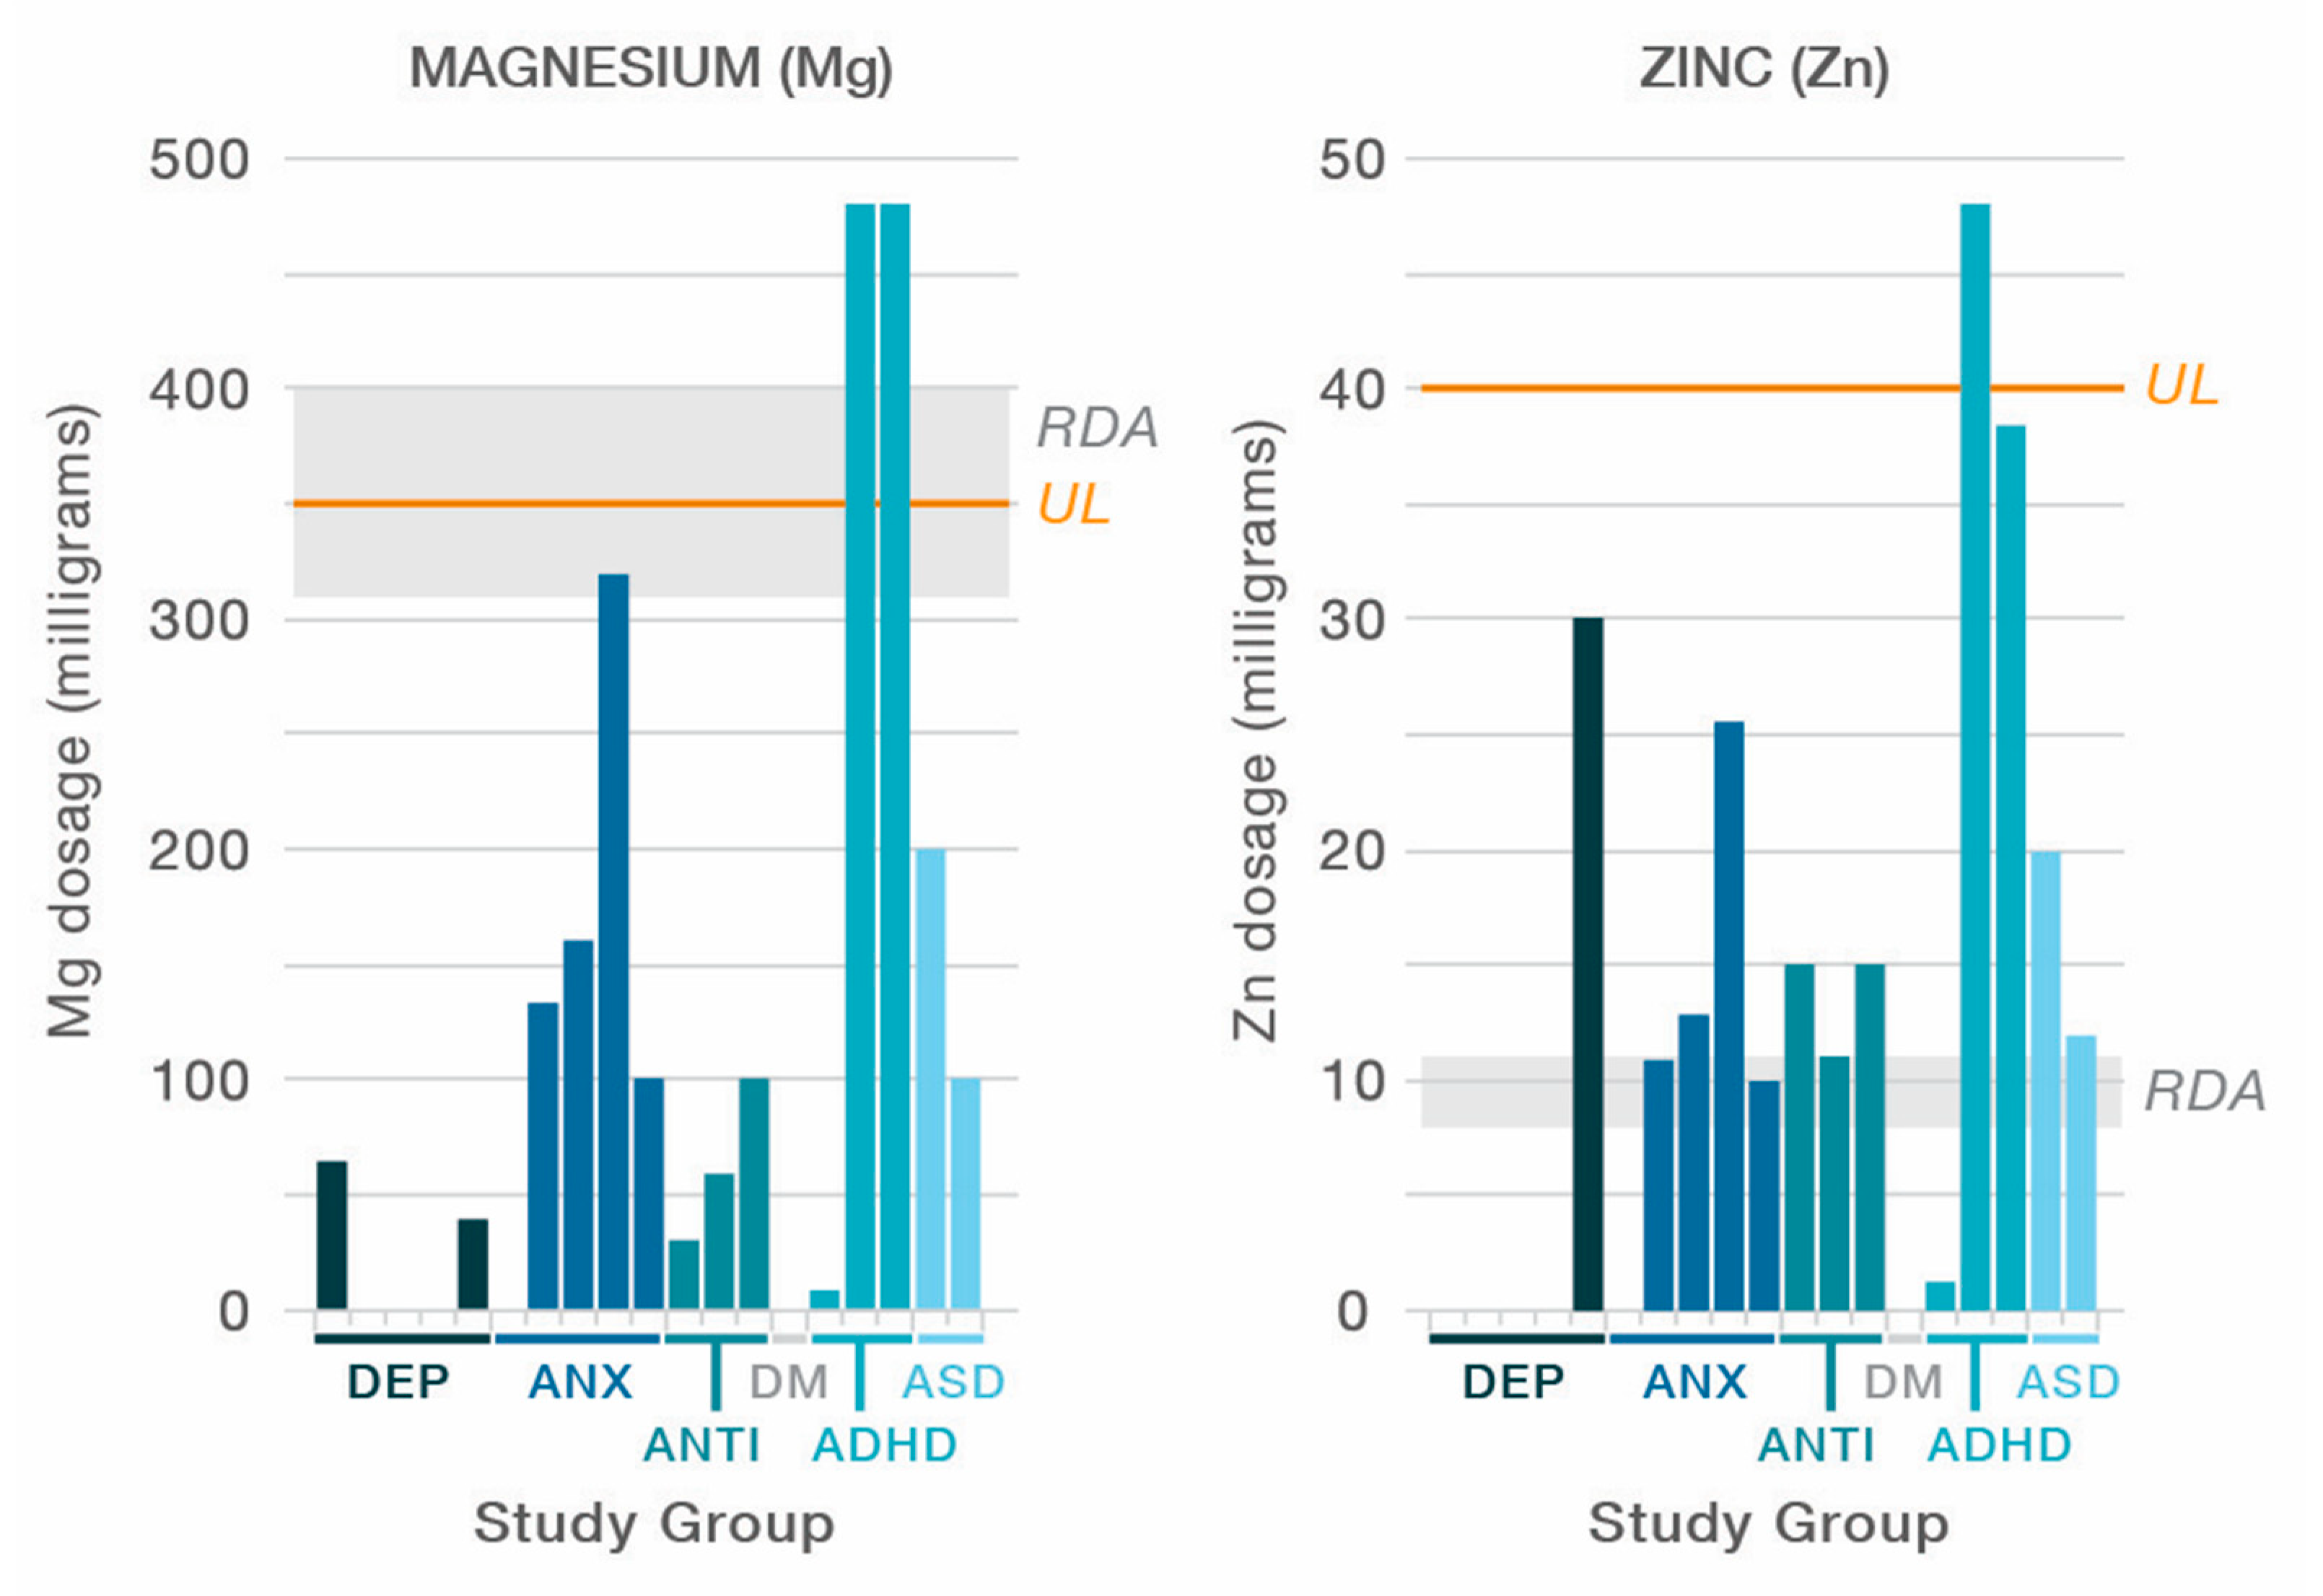
4.2. Dose and Range of the Ingredients

In this paper, we used two terms to refer to the formulas: “multinutrient” for those that met the inclusion criteria of a combination of at least four vitamins and minerals, typically at or below the RDA (n = 7) [38,41,44,45,46,47,51]; and the term “broad-spectrum multinutrients” (n = 9) [26,27,39,40,42,43,48,49,50] to refer to formulas that contained all or most vitamins, plus a range of minerals, at doses typically at or higher than the RDA. Of the seven studies classified as using a “multinutrient” formula (Berk [44], Brown [38], Lewis [46], Mech [45], Sarris [47], Pardini [51], and Sinn [41]), one showed clinically and statistically significant benefit over placebo on the CGI-S [50], based on data provided in the original papers. In contrast, of the nine studies classified as “broad-spectrum multinutrients” (Kaplan, Rucklidge [26,27,48,49], Gesch [50], Schoenthaler [40], Zaalberg [39], and Adams [42,43]), eight reported between-group differences favoring active treatment [26,27,39,40,43,48,49,50] across a range of psychiatric symptoms. Figure 2 and Figure 3 illustrate the widely varying range of ingredients, and their doses, between the formulas.
Two large, well-designed studies for depression [44,47] that reported full data both showed negative results for depression symptoms, and used targeted nutrients, mainly vitamins. Among the five depression studies, only four minerals (calcium, zinc, magnesium, selenium) were included in three of the studies, with levels at or just above the RDA, see Figure 3. The authors concluded that the “shot gun approach” did not show benefit, and the nutrient combination “may not have been the best” in terms of the “dose/ratio studied” [47], a sentiment shared by authors of one of the ADHD studies regarding the multinutrients’ lack of improvement beyond what was shown with PUFA alone [41]. To illustrate the nutrient combinations in depression studies, Figure 4 compares the ingredients and dosages of the six studies, plus the Rucklidge 2014 study [26] that enrolled adults with ADHD, of which 21 met the criteria for moderate to severe depression based on a MADRS score ≥ 20 at baseline [66]. For ingredient and dose comparison with over-the-counter formulas, the One-A-Day® multivitamin was shown as well. In comparison to the multinutrient formulas, the broad-spectrum formulas contain 15 essential minerals with doses at or above the RDA. These formulas also include amino acids and antioxidants. In considering ingredient dosages, it is prudent to remember that the RDA has not been established for mental health, and higher dosages, though below ULs, may be needed for individuals experiencing mental health symptoms [29,67].
The doses of two important minerals: magnesium and zinc are compared between formulas to highlight the dose differences, as illustrated in Figure 6. Magnesium is needed for more than 300 biochemical reactions in the body. It helps maintain normal muscle and nerve function, keeps heart rhythm regular [68], contributes to bone strength, and assists with oxidative phosphorylation in the mitochondria [69]. Magnesium is also involved in energy metabolism and protein synthesis [70] and has been found to reduce central nervous system hyperexcitability in children [71,72].
Equally important, Zinc plays a role in more than 300 enzymatic processes, with many diverse biochemical roles identified including nucleic acid metabolism, neurotransmitter production, antioxidant activity, cell signaling, and brain and immune function [73,74]. Mechanisms for improved mood through zinc supplementation are extensive, including increasing brain-derived neurotrophic factor [75], gamma amino butyric acid (GABA) [76], and other neurotransmitters, and improving the integrity of the gastrointestinal tract and epithelial junctures [77]. Zinc also acts as an antioxidant and plays anti-inflammatory roles [78,79].

4.3. The Use of Medications

Two of the depression studies, neither of which showed benefit on the primary outcome, included participants currently taking medications. Both studies were hampered by a large placebo effect [44,47]. Drug–drug interactions can occur when one drug impacts the absorption, transportation, metabolism, or excretion of another drug (pharmacokinetics). A drug–drug interaction may also occur when one drug affects how the body responds to another drug (pharmacodynamics), potentially without changing the second drug’s pharmacokinetics. Constituents in food and dietary supplements can also significantly change the pharmacokinetics or pharmacodynamics of drugs (e.g., St. John’s Wort and grapefruit juice inhibiting and inducing cytochrome P450 3A4 (CYP3A4), respectively) [80].
It is unknown whether a specific multinutrient dietary supplement can impact the pharmacokinetics of drugs. In theory, a multinutrient supplement could affect the absorption of a drug, thereby decreasing or increasing its bioavailability. By increasing bioavailability, there is an increase in total drug exposure that could lead to symptom development. Inversely, by reducing bioavailability, a previously therapeutic dose may become subtherapeutic due to the decrease in drug absorbed. Another possible multinutrient-drug interaction could occur at the pharmacodynamic level, particularly with psychiatric medications.
A multinutrient supplement may ensure that adequate quantities of essential cofactors are available to synthesize neurotransmitters in the brain, gut, or both. In theory, supplementation may lead to an increase in neurotransmitter synthesis when adequate quantities of these cofactors, based on a specific individual’s needs, are not obtained from the diet. An increase in neurotransmitter synthesis may change how an individual responds to a medication whose mechanism targets the same neurotransmitter. A meta-analysis of several individual micronutrient supplements, used in combination with antidepressants, showed improved response to antidepressants, supporting the potential of pharmacodynamic interactions [19]. A study of adjunctive treatment for psychosis with multinutrients demonstrated benefit at one-month, continuing up to two years, compared to patients who took antipsychotics alone [81]. Studies examining the symptom profiles of individuals taking multinutrient supplements with medications have observed benefit when reducing medication dosages after taking a therapeutic dose of the supplement [82]. While several gaps exist in the mechanistic understanding of combining multinutrient supplements with drugs, observational data support the need for careful monitoring of therapeutic responses when combining any nutraceutical with a pharmaceutical to ensure adequate patient response. Supplementation with a multinutrient formula may require a dose reduction to avoid symptoms due to pharmacodynamic interactions. The long-term safety of multinutrient use has been observationally studied (n = 35) for up to 12 years of use (average = 3.75 years (SD = 3.63), with a range of 0.83–12 years), as demonstrated by blood work and participant responses [83].

4.4. Robustness and Breadth of Methodology

Finally, the quality of the studies, as well as the quality of the results reported, bears comment. A number of the studies in this review reported results in a format that was not conducive to meta-analytic analyses. Some studies excluded key between-group comparisons such that clear determination of a significant group difference was not possible. Many studies included per-protocol data only, rather than intention to treat. Means and standard deviations, effect sizes, and confidence intervals were inconsistently reported. These data deficiencies led to unclear and imprecise reporting of outcomes and resulted in down rating the confidence in the effect estimates. Without these data, several studies that could have been meta-analyzed, were unable to be compared, leaving a narrative summary. In some cases, authors reported active intervention benefit without presenting data to support their finding.
Moving forward, in order to optimize the opportunity to enhance the operation of all metabolic pathways to improve mental health, study formulas are needed that use the full array of vitamins and minerals. To allow for possible replication of the global improvement in psychological functioning observed in several studies, including a measure of global functioning is important. A cost-effectiveness study would enable the evaluation of a multinutrient approach relative to other treatment methods. Consideration of optimal study length is also necessary in order to capture treatment effects, if they do exist. A placebo run-in prior to study initiation may reduce placebo response.
Given the increasing number of people experiencing psychological distress [84], and the substantial number not benefitting from current treatment approaches, or not utilizing talk therapies, [85] rigorously exploring alternatives, such as the potential of multinutrients, is important. Well-powered, well-designed, and well-reported trials are needed to confidently determine whether a broad-spectrum multinutrient approach is a viable alternative, or complement, to the current psychiatric treatment regimes.

5. Conclusions

Compared to multinutrient formulas with fewer ingredients delivered at lower doses, broad-spectrum multinutrients demonstrated more consistent benefits for a range of mental health issues. Complex B vitamins with minerals showed benefit for symptoms of acute anxiety and stress post-natural disaster. In order to accurately understand the role of multinutrients for psychiatric symptoms, studies need to be conducted in populations with mental health issues, using the DSM criteria, looking at global outcomes. Future studies may build upon these nascent meta-analyses by reporting full data (between-group effects, confidence intervals, and effect sizes), studying similar populations, using similar formulas that contain a full range of vitamins and minerals at therapeutic doses, and the same or related global outcome measures. In studies that include participants using psychiatric medication, consideration of cross-tapering may improve outcomes.

Author Contributions

Conceptualization, J.M.J., A.R.R. and J.J.R.; methodology, all authors.; software, J.M.J., A.H., A.R.R. and J.Z.G.; validation, all authors.; formal analysis, A.H. and J.Z.G.; data curation, all authors; writing-original draft preparation, review and editing, all authors; visualization, J.M.J. and J.J.R.; funding acquisition, J.M.J. and J.J.R. All authors have read and agreed to the published version of the manuscript.

Funding

We gratefully acknowledge that this work was supported by the National Institutes of Health (NIH) NCCIH under grants 5R90AT00892403 and T32 AT002688 (Johnstone); the Foundation for Excellence in Mental Health Care, including individual philanthropic support; and The Gratis Foundation; School of Psychology, Speech and Hearing, University of Canterbury (Rucklidge).

Acknowledgments

The authors also thank Andrew S. Hamilton for assistance with the literature search; Jessica Heaton for assistance with formatting tables; Yeechi Chen, for creation of the figures; and Brice D. Thomson and Yvonne Lim, for guidance regarding the pharmacodynamics and pharmacokinetics of medication interaction.

Conflicts of Interest

Three of the authors of this paper (J.M.J., A.R.R. and J.J.R.) are authors on one or more of the included studies. All authors of this paper took steps to ensure the authenticity of the results presented by ensuring that authors of included studies did not influence interpretation or rating of their studies. Otherwise, authors do not have any disclosures or conflicts of interest to report. The funders had no role in the design of this study; in the collection, analyses, or interpretation of data; in the writing of the manuscript, or in the decision to publish the results.

Appendix A. Details Regarding Search Terms Used

The MeSH terms searched were “micronutri-” or “Micro-nutri-” or “vitamin” or “mineral” and “Mental disorders” or “Mental processes”. For comprehensiveness, the search was expanded to include the MeSH terms “Nutritional Physiological Phenomena” and “Mental processes” or “mental disorders”. To include studies of micronutrient deficiencies, the MeSH term “Deficiency diseases” was also included. Where MeSH terms were not able to be used, combinations of relevant search terms were used, with truncation (indicated with an asterisk) used to cover several variations of search terms (e.g., micronutrient * covers micronutrient and micronutrients). The search terms for interventions included the most commonly used terms that describe micronutrient interventions. Terms covering the most common psychiatric illnesses were used and, in line with the broad nature of the inclusion criteria of this review, the search was broadened to cover affective states and psychological outcomes. Search terms were “vitamin*” or “mineral*” or “micronutrient*” or “nutrient*” or “nutrient supplement” and “randomi*” or “trial” or “controlled study” and “mood” or “depression” or “bipolar*” or “stress” or “anxiety” or “antisocial” or “ADHD” or “autism” or “PDD” or “Asperger *” or “schizophrenia” or “psychosis” or “alcohol” or “substance use” or “smoking” or “cannabis” or “bulimia” or “eating disorder” or “anorexia”. Searches were limited to human studies and papers written or available in English. For example, CENTRAL was searched for (nutr * OR vitamin OR mineral OR micronutrient) AND (randomi * OR RCT OR placebo * OR double-blind) AND (psych * OR depressi * OR anxiety OR autism OR bipolar OR ADHD OR schizophrenia OR eating disorders OR anorexia OR bulimia OR mood OR stress OR antisocial OR aggression OR PDD OR Asperger * OR psychosis OR alcohol OR dependence OR addiction OR cannabis), with results limited to human trials.

References

  1. Jacka, F.N.; Reavley, N.J.; Jorm, A.F.; Toumbourou, J.W.; Lewis, A.J.; Berk, M. Prevention of common mental disorders: What can we learn from those who have gone before and where do we go next? Aust. N. Z. J. Psychiatry 2013, 47, 920–929. [Google Scholar] [CrossRef]
  2. Jacka, F.N.; Kremer, P.J.; Berk, M.; De Silva-Sanigorski, A.M.; Moodie, M.; Leslie, E.R.; Pasco, J.A.; Swinburn, B.A. A prospective study of diet quality and mental health in adolescents. PLoS ONE 2011, 6, e24805. [Google Scholar] [CrossRef]
  3. Jacka, F.N.; Pasco, J.; Mykletun, A.; Williams, L.J.; Hodge, A.M.; O’Reilly, S.L.; Nicholson, G.C.; Kotowicz, M.A.; Berk, M. Association of Western and traditional diets with depression and anxiety in women. Am. J. Psychiatry 2010, 167, 305–311. [Google Scholar] [CrossRef] [PubMed] [Green Version]
  4. Jacka, F.N.; O’Neil, A.; Opie, R.; Itsiopoulos, C.; Cotton, S.; Mohebbi, M.; Castle, D.; Dash, S.; Mihalopoulos, C.; Chatterton, M.L.; et al. A randomised controlled trial of dietary improvement for adults with major depression (the ’SMILES’ trial). BMC Med. 2017, 15, 23. [Google Scholar] [CrossRef] [PubMed] [Green Version]
  5. Parletta, N.; Zarnowiecki, D.; Cho, J.; Wilson, A.; Bogomolova, S.; Villani, A.; Itsiopoulos, C.; Niyonsenga, T.; Blunden, S.; Meyer, B.; et al. A Mediterranean-style dietary intervention supplemented with fish oil improves diet quality and mental health in people with depression: A randomized controlled trial (HELFIMED). Nutr. Neurosci. 2017, 1–14. [Google Scholar] [CrossRef] [Green Version]
  6. White, P.J.; Broadley, M.R. Historical variation in the mineral composition of edible horticultural products. J. Hortic. Sci. Biotechnol. 2005, 80, 660–667. [Google Scholar] [CrossRef]
  7. Bellaloui, N.; Reddy, K.N.; Zablotowicz, R.M.; Abbas, H.K.; Abel, C.A. Effects of glyphosate application on seed iron and root ferric (III) reductase in soybean cultivars. J. Agric. Food Chem. 2009, 57, 9569–9574. [Google Scholar] [CrossRef]
  8. Marles, R.J. Mineral nutrient composition of vegetables, fruits and grains: The context of reports of apparent historical declines. J. Food Compost. Anal. 2017, 56, 93–103. [Google Scholar] [CrossRef]
  9. Myers, S.S.; Zanobetti, A.; Kloog, I.; Huybers, P.; Leakey, A.D.B.; Bloom, A.J.; Carlisle, E.; Dietterich, L.H.; Fitzgerald, G.; Hasegawa, T.; et al. Increasing CO2 threatens human nutrition. Nature 2014, 510, 139–142. [Google Scholar] [CrossRef]
  10. Loladze, I. Hidden shift of the ionome of plants exposed to elevated CO(2) depletes minerals at the base of human nutrition. eLife 2014, 3, e02245. [Google Scholar] [CrossRef]
  11. Dinan, T.G.; Cryan, J.F. The Microbiome-Gut-Brain Axis in Health and Disease. Gastroenterol. Clin. N. Am. 2017, 46, 77–89. [Google Scholar] [CrossRef] [Green Version]
  12. Dinan, T.G.; Cryan, J.F.; Stanton, C. Gut Microbes and Brain Development Have Black Box Connectivity. Biol. Psychiatry 2018, 83, 97–99. [Google Scholar] [CrossRef]
  13. McNally, L.; Bhagwagar, Z.; Hannestad, J. Inflammation, glutamate, and glia in depression: A literature review. CNS Spectr. 2008, 13, 501–510. [Google Scholar] [CrossRef]
  14. Oddy, W.H.; Allen, K.L.; Trapp, G.S.A.; Ambrosini, G.L.; Black, L.J.; Huang, R.C.; Rzehak, P.; Runions, K.C.; Pan, F.; Beilin, L.J.; et al. Dietary patterns, body mass index and inflammation: Pathways to depression and mental health problems in adolescents. Brain Behav. Immun. 2018. [Google Scholar] [CrossRef] [Green Version]
  15. Ames, B.N.; Elson-Schwab, I.; Silver, E. High-dose vitamin therapy stimulates variant enzymes with decreased coenzyme binding affinity (increased Km): Relevance to genetic disease and polymorphisms. Am. J. Clin. Nutr. 2002, 75, 616–658. [Google Scholar] [CrossRef] [Green Version]
  16. Toker, L.; Agam, G. Mitochondrial dysfunction in psychiatric morbidity: Current evidence and therapeutic prospects. Neuropsychiatr. Dis. Treat. 2015, 11, 2441–2447. [Google Scholar] [CrossRef] [Green Version]
  17. Kaplan, B.J.; Rucklidge, J.J.; McLeod, K.; Romijn, A. The emerging field of nutritional mental health: Inflammation, the microbiome, oxidative stress, and mitochondrial function. Clin. Psychol. Sci. 2015, 3, 964–980. [Google Scholar] [CrossRef] [Green Version]
  18. Rucklidge, J.J.; Johnstone, J.; Kaplan, B.J. Magic bullet thinking-why do we continue to perpetuate this fallacy? Br. J. Psychiatry 2013, 203, 154. [Google Scholar] [CrossRef] [Green Version]
  19. Sarris, J.; Mischoulon, D.; Schweitzer, I. Adjunctive nutraceuticals with standard pharmacotherapies in bipolar disorder: A systematic review of clinical trials. Bipolar Disord. 2011, 13, 454–465. [Google Scholar] [CrossRef]
  20. Sarris, J.; Murphy, J.; Mischoulon, D.; Papakostas, G.I.; Fava, M.; Berk, M. Adjunctive nutraceuticals for depression: A systematic review and meta-analyses. Am. J. Psychiatry 2016, 173. [Google Scholar] [CrossRef] [PubMed] [Green Version]
  21. Kaplan, B.J.; Crawford, S.G.; Field, C.J.; Simpson, J.S. Vitamins, minerals, and mood. Psychol. Bull. 2007, 133, 747–760. [Google Scholar] [CrossRef]
  22. Firth, J.; Stubbs, B.; Sarris, J.; Rosenbaum, S.; Teasdale, S.; Berk, M.; Yung, A.R. The effects of vitamin and mineral supplementation on symptoms of schizophrenia: A systematic review and meta-analysis. Psychol. Med. 2017, 1–13. [Google Scholar] [CrossRef] [PubMed] [Green Version]
  23. Rucklidge, J.J.; Johnstone, J.; Kaplan, B.J. Nutrient supplementation approaches in the treatment of ADHD. Expert Rev. Neurother. 2009, 9, 461–476. [Google Scholar] [CrossRef]
  24. Benton, D. The impact of diet on anti-social, violent and criminal behaviour. Neurosci. Biobehav. Rev. 2007, 31, 752–774. [Google Scholar] [CrossRef]
  25. Mertz, W. A balanced approach to nutrition for health: The need for biologically essential minerals and vitamins. J. Am. Diet. Assoc. 1994, 94, 1259–1262. [Google Scholar] [CrossRef]
  26. Rucklidge, J.J.; Frampton, C.M.; Gorman, B.; Boggis, A. Vitamin-mineral treatment of attention-deficit hyperactivity disorder in adults: Double-blind randomised placebo-controlled trial. Br. J. Psychiatry 2014, 204, 306–315. [Google Scholar] [CrossRef] [PubMed] [Green Version]
  27. Rucklidge, J.J.; Eggleston, M.J.; Johnstone, J.M.; Darling, K.; Frampton, C.M. Vitamin-mineral treatment improves aggression and emotional regulation in children with ADHD: A fully blinded, randomized, placebo-controlled trial. J. Child Psychol. Psychiatry 2018, 59, 232–246. [Google Scholar] [CrossRef] [PubMed]
  28. Pike, V.; Zlotkin, S. Excess micronutrient intake: Defining toxic effects and upper limits in vulnerable populations. Ann. N. Y. Acad. Sci. 2019, 1446, 21–43. [Google Scholar] [CrossRef] [Green Version]
  29. Benton, D. To establish the parameters of optimal nutrition do we need to consider psychological in addition to physiological parameters? Mol. Nutr. Food Res. 2013, 57, 6–19. [Google Scholar] [CrossRef] [PubMed]
  30. Kennedy, D.O. B vitamins and the brain: Mechanisms, dose and efficacy—A review. Nutrients 2016, 8, 68. [Google Scholar] [CrossRef] [Green Version]
  31. Katz, M.; Adar Levine, A.; Kol-Degani, H.; Kav-Venaki, L. A compound herbal preparation (CHP) in the treatment of children with ADHD: A randomized controlled trial. J. Atten. Disord. 2010, 14, 281–291. [Google Scholar] [CrossRef]
  32. Gagnier, J.J.; Morgenstern, H.; Altman, D.G.; Berlin, J.; Chang, S.; McCulloch, P.; Sun, X.; Moher, D. Consensus-based recommendations for investigating clinical heterogeneity in systematic reviews. BMC Med. Res. Methodol. 2013, 13, 106. [Google Scholar] [CrossRef] [PubMed] [Green Version]
  33. Higgins, J.P.; Altman, D.G. Assessing risk of bias in included studies. In Cochrane Handbook for Systematic Reviews of Interventions: Cochrane Book Series; Higgins, J.P.T., Green, S., Eds.; John Wiley and Sons: Hoboken, NJ, USA, 2008; pp. 187–241. [Google Scholar]
  34. Norman, G.R.; Sloan, J.A.; Wyrwich, K.W. Interpretation of changes in health-related quality of life: The remarkable universality of half a standard deviation. Med. Care 2003, 41, 582–592. [Google Scholar] [CrossRef]
  35. Schunemann, H.; Brozek, J.; Guyatt, G.; Oxman, A.; GRADE Handbook. Handbook for Grading the Quality of Evidence and the Strength of Recommendations Using the GRADE Approach. [Updated October 2013]. 2013. Available online: http://gdt.guidelinedevelopment.org/app/handbook/handbook.html (accessed on 5 February 2019).
  36. Ryan, R.; Synnot, A.; Hill, S. Describing results. In Cochrane Consumers and Communication Group; Cochrane Consumers and Communication: London, UK, 2016. [Google Scholar]
  37. Moher, D.; Liberati, A.; Tetzlaff, J.; Altman, D.G.; The PRISMA Group. Preferred reporting items for systematic reviews and meta-analyses: The PRISMA statement. PLoS Med. 2009, 6, e1000097. [Google Scholar] [CrossRef] [Green Version]
  38. Brown, M.-A.; Goldstein-Shirley, J.; Robinson, J.; Casey, S. The effects of a multi-modal intervention trial of light, exercise, and vitamins on women’s mood. Women Health 2001, 34, 93–112. [Google Scholar] [CrossRef]
  39. Zaalberg, A.; Nijman, H.; Bulten, E.; Stroosma, L.; Staak, C. Effects of nutritional supplements on aggression, rule-breaking, and psychopathology among young adult prisoners. Aggress Behav. 2010, 36. [Google Scholar] [CrossRef]
  40. Schoenthaler, S.J.; Amos, S.; Doraz, W.; Kelly, M.A.; Muedeking, G.D.; Wakefield, J.A. The effect of randomized vitamin-mineral supplementation on violent and non-violent antisocial behavior among incarcerated juveniles. J. Nutr. Environ. Med. 1997, 7. [Google Scholar] [CrossRef]
  41. Sinn, N.; Bryan, J. Effect of supplementation with polyunsaturated fatty acids and micronutrients on learning and behavior problems associated with child ADHD. J. Dev. Behav. Pediatr. 2007, 28, 82–91. [Google Scholar] [CrossRef]
  42. Adams, J.B.; Holloway, C. Pilot study of a moderate dose multivitamin/mineral supplement for children with autistic spectrum disorder. J. Altern. Complement. Med. 2004, 10, 1033–1039. [Google Scholar] [CrossRef]
  43. Adams, J.B.; Audhya, T.; McDonough-Means, S.; Rubin, R.A.; Quig, D.; Geis, E.; Gehn, E.; Loresto, M.; Mitchell, J.; Atwood, S. Effect of a vitamin/mineral supplement on children and adults with autism. BMC Pediatr. 2011, 11, 111. [Google Scholar] [CrossRef]
  44. Berk, M.; Turner, A.; Malhi, G.S.; Ng, C.H.; Cotton, S.M.; Dodd, S.; Samuni, Y.; Tanious, M.; McAulay, C.; Dowling, N. A randomised controlled trial of a mitochondrial therapeutic target for bipolar depression: Mitochondrial agents, N-acetylcysteine, and placebo. BMC Med. 2019, 17, 18. [Google Scholar]
  45. Mech, A.W.; Farah, A. Correlation of clinical response with homocysteine reduction during therapy with reduced B vitamins in patients with MDD who are positive for MTHFR C677T or A1298C polymorphism: A randomized, double-blind, placebo-controlled study. J. Clin. Psychiatry 2016, 77, 668–671. [Google Scholar] [CrossRef] [PubMed] [Green Version]
  46. Lewis, J.E.; Tiozzo, E.; Melillo, A.B.; Leonard, S.; Chen, L.; Mendez, A.; Woolger, J.M.; Konefal, J. The effect of methylated vitamin B complex on depressive and anxiety symptoms and quality of life in adults with depression. ISRN Psychiatry 2013, 2013, 1–7. [Google Scholar] [CrossRef]
  47. Sarris, J.; Byrne, G.J.; Stough, C.; Bousman, C.; Mischoulon, D.; Murphy, J.; Macdonald, P.; Adams, L.; Nazareth, S.; Oliver, G. Nutraceuticals for major depressive disorder-more is not merrier: An 8-week double-blind, randomised, controlled trial. J. Affect. Disord. 2019, 245, 1007–1015. [Google Scholar] [CrossRef] [PubMed] [Green Version]
  48. Kaplan, B.J.; Rucklidge, J.J.; Romijn, A.R.; Dolph, M. A randomised trial of nutrient supplements to minimise psychiatric illness after a natural disaster. Psychiatry Res. 2015, 228. [Google Scholar] [CrossRef]
  49. Rucklidge, J.J.; Andridge, R.; Gorman, B.; Blampied, N.; Gordon, H.; Boggis, A. Shaken but unstirred? Effects of micronutrients on stress and trauma after an earthquake: RCT evidence comparing formulas and doses. Hum. Psychopharmacol. Clin. Exp. 2012, 27. [Google Scholar] [CrossRef]
  50. Gesch, C.B.; Hammond, S.M.; Hampson, S.E.; Eves, A.; Crowder, M.J. Influence of supplementary vitamins, minerals and essential fatty acids on the antisocial behaviour of young adult prisoners Randomised, placebo-controlled trial. Br. J. Psychiatry 2002, 181, 22–28. [Google Scholar] [CrossRef] [Green Version]
  51. Pardini, M.; Serrati, C.; Guida, S.; Mattei, C.; Abate, L.; Massucco, D.; Sassos, D.; Amore, M.; Krueger, F.; Cocito, L. Souvenaid reduces behavioral deficits and improves social cognition skills in frontotemporal dementia: A proof-of-concept study. Neurodegener. Dis. 2015, 15, 58–62. [Google Scholar] [CrossRef] [PubMed]
  52. Montgomery, S.A.; Åsberg, M.A. A new depression scale designed to be sensitive to change. Br. J. Psychiatry 1979, 134, 382–389. [Google Scholar] [CrossRef]
  53. Beck, A.T.; Steer, R.A.; Brown, G.K. Beck depression inventory-II. Psychol. Assess. 1996. [Google Scholar] [CrossRef]
  54. Locke, B.; Putman, P. Center for epidemiological studies depression scale. 1971. [Google Scholar]
  55. Duru, G.; Fantino, B. The clinical relevance of changes in the Montgomery–Asberg Depression Rating Scale using the minimum clinically important difference approach. Curr. Med. Res. Opin. 2008, 24, 1329–1335. [Google Scholar] [CrossRef]
  56. Lovibond, P.F.; Lovibond, S.H. The structure of negative emotional states: Comparison of the Depression Anxiety Stress Scales (DASS) with the Beck Depression and Anxiety Inventories. Behav. Res. Ther. 1995, 33, 335–343. [Google Scholar] [CrossRef]
  57. Howard, R.; Phillips, P.; Johnson, T.; O’Brien, J.; Sheehan, B.; Lindesay, J.; Bentham, P.; Burns, A.; Ballard, C.; Holmes, C. Determining the minimum clinically important differences for outcomes in the DOMINO trial. Int. J. Geriatr. Psychiatry 2011, 26, 812–817. [Google Scholar] [CrossRef]
  58. Hall, R.C. Global assessment of functioning: A modified scale. Psychosomatics 1995, 36, 267–275. [Google Scholar] [CrossRef]
  59. Shaffer, D.; Gould, M.; Brasic, J.; Ambrosini, P.; Fisher, P.; Bird, H.; Aluwahlia, S. A children’s global assessment scale (CGAS). Arch. Gen. Psychiatry 1983, 40, 1228–1231. [Google Scholar] [CrossRef]
  60. Rucklidge, J.J.; Kaplan, B.J. Broad-spectrum micronutrient formulas for the treatment of psychiatric symptoms: A systematic review. Expert Rev. Neurother. 2013, 13, 49–73. [Google Scholar] [CrossRef] [PubMed]
  61. Blampied, M.; Bell, C.; Gilbert, C.; Rucklidge, J.J. Broad spectrum micronutrient formulas for the treatment of symptoms of depression, stress, and/or anxiety: A systematic review. Expert Rev. Neurother. 2020, 20, 351–371. [Google Scholar] [CrossRef]
  62. Wurtman, R.J.; Fernstrom, J.D. Control of brain neurotransmitter synthesis by precursor availability and nutritional state. Biochem. Pharmacol. 1976, 25, 1691–1696. [Google Scholar] [CrossRef]
  63. Marriage, B.; Clandinin, M.T.; Glerum, D.M. Nutritional cofactor treatment in mitochondrial disorders. J. Am. Diet. Assoc. 2003, 103, 1029–1038. [Google Scholar] [CrossRef]
  64. Stevens, A.J.; Purcell, R.V.; Darling, K.A.; Eggleston, M.J.; Kennedy, M.A.; Rucklidge, J.J. Human gut microbiome changes during a 10 week randomised control trial for micronutrient supplementation in children with attention deficit hyperactivity disorder. Sci. Rep. 2019, 9, 10128. [Google Scholar] [CrossRef]
  65. Ames, B.N. A role for supplements in optimizing health: The metabolic tune-up. Arch. Biochem. Biophys. 2004, 423, 227–234. [Google Scholar] [CrossRef]
  66. Snaith, R.; Harrop, F.; Newby, T.D.; Teale, C. Grade scores of the Montgomery—Åsberg depression and the clinical anxiety scales. Br. J. Psychiatry 1986, 148, 599–601. [Google Scholar] [CrossRef] [PubMed]
  67. Pauling, L. Orthomolecular psychiatry: Varying the concentrations of substances normally present in the human body may control mental disease. J. Nutr. Environ. Med. 1995, 5, 187–198. [Google Scholar] [CrossRef]
  68. Chang, J.J.; Mack, W.J.; Saver, J.L.; Sanossian, N. Magnesium: Potential roles in neurovascular disease. Front. Neurol. 2014, 5, 52. [Google Scholar] [CrossRef] [Green Version]
  69. Welch, K.; Ramadan, N.M. Mitochondria, magnesium and migraine. J. Neurol. Sci. 1995, 134, 9–14. [Google Scholar] [CrossRef]
  70. Ahsan, S.K. Magnesium in health and disease. J. Pak. Med. Assoc. 1998, 48, 246–249. [Google Scholar]
  71. Mousain-Bosc, M.; Roche, M.; Rapin, J.; Bali, J.-P. Magnesium VitB6 intake reduces central nervous system hyperexcitability in children. J. Am. Coll. Nutr. 2004, 23, 545S–548S. [Google Scholar] [CrossRef]
  72. Mousain-Bosc, M.; Roche, M.; Polge, A.; Pradal-Prat, D.; Rapin, J.; Bali, J. Improvement of neurobehavioral disorders in children supplemented with magnesium-vitamin B6. I. Attention deficit hyperactivity disorders. Magnes. Res. 2006, 19, 46–52. [Google Scholar]
  73. Kelishadi, R.; Hashemipour, M.; Adeli, K.; Tavakoli, N.; Movahedian-Attar, A.; Shapouri, J.; Poursafa, P.; Rouzbahani, A. Effect of zinc supplementation on markers of insulin resistance, oxidative stress, and inflammation among prepubescent children with metabolic syndrome. Metab. Syndr. Relat. Disord. 2010, 8, 505–510. [Google Scholar] [CrossRef] [PubMed]
  74. Russo, A. Decreased zinc and increased copper in individuals with anxiety. Nutr. Metab. Insights 2011, 4, 1–5. [Google Scholar] [CrossRef]
  75. Solati, Z.; Jazayeri, S.; Tehrani-Doost, M.; Mahmoodianfard, S.; Gohari, M.R. Zinc monotherapy increases serum brain-derived neurotrophic factor (BDNF) levels and decreases depressive symptoms in overweight or obese subjects: A double-blind, randomized, placebo-controlled trial. Nutr. Neurosci. 2015, 18, 162–168. [Google Scholar] [CrossRef] [PubMed]
  76. Takeda, A.; Hirate, M.; Tamano, H.; Oku, N. Release of glutamate and GABA in the hippocampus under zinc deficiency. J. Neurosci. Res. 2003, 72, 537–542. [Google Scholar] [CrossRef]
  77. Wang, X.; Valenzano, M.C.; Mercado, J.M.; Zurbach, E.P.; Mullin, J.M. Zinc supplementation modifies tight junctions and alters barrier function of CACO-2 human intestinal epithelial layers. Dig. Dis. Sci. 2013, 58, 77–87. [Google Scholar] [CrossRef]
  78. Kaplan, B.J.; Simpson, J.S.A.; Ferre, R.C.; Gorman, C.P.; McMullen, D.M.; Crawford, S.G. Effective mood stabilization with a chelated mineral supplement: An open-label trial in bipolar disorder. J. Clin. Psychiatry 2001, 62, 936–944. [Google Scholar] [CrossRef]
  79. Haase, H.; Overbeck, S.; Rink, L. Zinc supplementation for the treatment or prevention of disease: Current status and future perspectives. Exp. Gerontol. 2008, 43, 394–408. [Google Scholar] [CrossRef]
  80. Tanaka, E. Clinically important pharmacokinetic drug–drug interactions: Role of cytochrome P450 enzymes. J. Clin. Pharm. Ther. 1998, 23, 403–416. [Google Scholar] [CrossRef]
  81. Mehl-Madrona, L.; Mainguy, B. Adjunctive treatment of psychotic disorders with micronutrients. The J. Altern. Complement. Med. 2017, 23, 526–533. [Google Scholar] [CrossRef]
  82. Gately, D.; Kaplan, B.J. Database analysis of adults with bipolar disorder consuming a micronutrient formula. Clin. Med. Insights Psychiatry 2009, 2, 3–16. [Google Scholar] [CrossRef]
  83. Rucklidge, J.J.; Eggleston, M.J.; Ealam, B.; Beaglehole, B.; Mulder, R.T. An observational preliminary study on the safety of long-term consumption of micronutrients for the treatment of psychiatric symptoms. The J. Altern. Complement. Med. 2019, 25, 613–622. [Google Scholar] [CrossRef] [Green Version]
  84. Kazdin, A.E. Addressing the treatment gap: A key challenge for extending evidence-based psychosocial interventions. Behav. Res. Ther. 2017, 88, 7–18. [Google Scholar] [CrossRef]
  85. Wise, J. Only half of patients referred for talking therapies enter treatment. BMJ 2014, 348, g295. [Google Scholar] [CrossRef]
Figure 1. Systematic review and meta-analysis of multinutrients for psychiatric symptoms. PRISMA (The Preferred Reporting Items for Systematic Reviews and Meta-Analyses) flow diagram.
Nutrients 12 03394 g001
Figure 2. Comparing formula ingredients across studies including One-A-Day®, an over-the-counter formula, for comparison. AminoFerr™ contains nutritive minerals to prevent iron deficiency (specific product info. not found); intrinsic factor is a glycoprotein secreted by the stomach to aid in the absorption of vitamin B12.
Nutrients 12 03394 g002
Figure 3. Comparing formula ingredient dosages of vitamins and minerals based on the Recommended Dietary Allowance (RDA). Kaplan, 2015 a = complex B vitamin; Kaplan, 2015 b = EMP+, 4 capsules; Rucklidge, 2012 a = EMP+, 4 capsules; Rucklidge, 2012 b = EMP+, 8 capsules; Rucklidge, 2012 c = complex B vitamins with minerals.
Nutrients 12 03394 g003
Figure 4. Comparing ingredient dosages in studies of participants with depression, including One-A-Day®, an over-the-counter formula for comparison.
Nutrients 12 03394 g004
Figure 5. Forest plots of meta-analysis of ADHD symptoms.
Nutrients 12 03394 g005aNutrients 12 03394 g005b
Figure 6. Comparing magnesium and zinc levels across studies. RDA = Recommended Dietary Allowance; UL = upper limit; DEP = depression; ANX = anxiety; ANTI = antisocial; DM = dementia behaviors; ADHD = attention-deficit/hyperactivity disorder; ASD = autism spectrum disorder.
Nutrients 12 03394 g006
Table 1. Depression Studies (n = 707).
ReferenceIntervention-Daily DoseSample
Size
Sample CharacteristicsStudy LengthOutcomesResults
Berk et al., 2019 [44]
ACTRN12612000830897
Combined Treatment (CT):
N-acetylcysteine (NAC) 2000 mg, Acetyl L-carnitine (ALC) 1000 mg, Ubiquinone (Co Q10) 200 mg, magnesium 64 mg (as orotate 500 mg), calcium ascorbate dehydrate 242 mg (equiv ascorbic acid 200 mg), cholecalciferol 12.5μg (equiv Vit D3 250 IU), α-tocopherol 60 IU (equiv natural Vit E 50 IU), alpha lipoic acid 150 mg, Retinyl palmitate 900 μg (equiv Vit A 3000 IU), Vit H 600 μg, thiamine hydrochloride 100 mg, riboflavin 100 mg, nicotinamide 200 mg, calcium pantothenate 100 mg, pyridoxine hydrochloride 100 mg, folic acid 800 μg, and cyanocobalamin (Vit B12) 800 μg

or: NAC 2000 mg

Plus: usual medication
n = 148
47 CT
52 NAC
49 placebo
based on analysis
Adults with bipolar disorder (Diagnostic and Statistical Manual (DSM)-IV-TR) with current depressive episode based on Montgomery-Asberg Depression Rating Scale (MADRS) >/= 20; intervention was adjunctive to usual medication;
multisite study
16 weeksPrimary: Montgomery-Asberg Depression Rating Scale (MADRS)
Secondary: Beck Depression Rating Scale (BDRS); Young Mania Rating Scale (YMRS), Clinical Global Impression-Improvement (CGI-I) and CGI-Severity (CGI-S) subscales; Social and Occupational Functioning Assessment Scale (SOFAS), Longitudinal Interval Follow-Up Evaluation - Range of Impaired Functioning Tool (LIFE-RIFT), and Quality of Life Enjoyment, and Satisfaction Questionnaire Short Form (Q-LES-Q)
Negative: no between group differences at study end (week 16)
Positive: at 4 weeks post-continuation (week 20; n = 32 for CT; n = 37 for placebo) improvements were significantly greater in the CT group compared to placebo on the MADRS (d = 0.53), BDRS (d = 0.50), CGI-I (d = −0.43), SOFAS (d = −0.55), LIFE-RIFT (d = 0.53). Authors unclear on whether improvement reflects delayed benefit or upon withdrawal from intervention.
Brown et al., 2001 [38]B1 50 mg, B6 50 mg, B2 50 mg, B9 400 µg, Se 200 µg, Vit D 400 IU

Plus: 20 min walk outside, 5 days/week, with 60% target heart rate increase; and increased exposure to light
n = 104
53 intervention
51 placebo
Adult women, with mild to moderate depressive symptoms >/= 16 based on the Center for Epidemiology Studies Depression Scale8 weeksPrimary: Center for Epidemiology Studies Depression Scale
(CESD-D)
Secondary:
Profile of Mood States (POMS), Depression-Happiness Scale (DHS), Rosenberg Self-Esteem Scale (RSE), General Well-Being Schedule (GWB)
Positive: intervention group improved significantly more than placebo group in mood
CESD-D (d = −0.32*);
DHS (d = 0.33); self-esteem, RSE: (d = −0.38*); and general sense of well-being, GWB (d = 0.23).

*lower score = improvement
Lewis et al., 2013 [46]Max Stress B: B1 1 mg, B2 1.6 mg, B3 30 mg, B5 3.3 mg, B6 3 mg, B9 1000 μg, B12 263 µg, B7 334 µg, PABA, Biotin, Inositoln = 60
30 intervention
30 placebo
Adults with major depressive disorder (MDD) or a related depressive disorder (DSM-IV-TR definition) and elevated level of homocysteine (>10 μmol/L)8 weeksPrimary: Beck Depression Inventory-II (BDI)
Secondary: Beck Anxiety Index (BAI); Quality of life from the Medical Outcomes Study Short Form 36 (SF-36)
Unclear: improvements are reported by the authors for the intervention group compared to placebo in depression on the BDI, anxiety on the BAI, and overall mental health on the SF-36; however, authors also report, “effect for time by randomization was nonsignificant,” suggesting no between-group differences
Mech et al., 2016 [45]
NCT02709668
EnLyte®: B9 citrated folic acid 1 mg, folinic acid 2.5mg,
l-methylfolate magnesium 7 mg, B1 25 μg, Flavin adenine dinucleotide 25 μg, Pyridoxal 5′-phosphate 25 μg, B12 50 μg, Nicotinamide adenine dinucleotide (NADH) 25 μg, Trimethyl glycine 500 μg, AminoFerr TM: 1.5 mg, Vit C 25 mg, l-threonic acid 1 mg, Sharp PS® Gold: phosphatidylserine-omega-3 conjugated 20 mg
n = 282
159 intervention
123 placebo
Adults with MDD (DSM-5 definition) and positive for either methylenetetra-hydrofolate (MTHFR) C677T or A1298C polymorphism8 weeksPrimary: MADRSUnclear: improvements are reported by authors for depression on the MADRS (d = −0.81) in intervention group compared to placebo, however, between-group comparisons and M(SD) are not included in the paper; lower homocysteine in intervention group (d = −0.88).
Sarris et al., 2019 [47]
ACTRN12613001300763 and 12613001299796
S-adenosyl methionine (SAMe) 800 mg, folinic acid 500 μg, Vit B12 200 μg, Omega-3 fatty acid concentrate (EPA-esters 1000 mg, DHA-esters 656 mg), 5-HTP 200 mg, zinc picolinate elemental 30 mg, Vit B6 100 mg, Vit C 60 mg, magnesium amino acid chelate, elemental 40 mg, Vit E 40 IU
Plus: current SSRI
n = 113
56 intervention
57 placebo
Adults with MDD who are inadequately responsive to current MDD medication and >/=18 on MADRS or >/=14 if not medicated; multisite study8 weeksPrimary: MADRS
Secondary: Beck Depression Inventory-II (BDI-II), Hamilton Anxiety Rating Scale (HAMA), Short Form Survey-12 (SF-12), Leeds Sleep Evaluation Questionnaire (LSEQ), CGI-I & CGI-S
Negative: placebo superior to nutraceutical combination in reducing MADRS scores (d = 0.21); response rates: 51% for the placebo and 40% for the active intervention; remission rates: 43% and 34% for placebo and active groups, respectively; no differences on other measures
ACTRN = Australian New Zealand Clinical Trials Registry Number; NCT = National Clinical Trial (US) number; Sample size n refers to the number who were included in analyses; IU = international unit, RDA = recommended dietary allowance; Cr = chromium; P = phosphorus; Se = selenium; Mn = manganese; Cu = copper; Zn= zinc; Mg = magnesium; I = iodine; Ca = calcium; Fe = iron; Si = silicon, silica; Cl = chloride; K = potassium; Vit A = beta-carotene, retinyl palmitate; Vit C = ascorbate, ascorbic acid; Vit D, D3 = cholecalciferol; Vit E = d-alpha tocopheryl succinate; B1 = thiamine, B2 = riboflavin; B3 = niacin, nicotinamide; B5 = pantothenic acid, B6 = pyridoxine; B9 = folic acid, folate; Vit H = biotin; EFA = essential fatty acids; EPA = eicosapentaenoic acid; DHA = docosahexaenoic acid; d = Cohen’s d; Primary = measure used in study for participant inclusion criteria.
Table 2. GRADE-summary of results.
OutcomesResults№ of Participants
(Studies)
Certainty of the Evidence
(GRADE)
Depression: Clinical Improvement (Depression)
Assessed with: MADRS, CES-D, BDI
Follow up: range 8–20 weeks
Five studies investigated the impact of multinutrients on depressive symptoms [38,44,45,46,47]. In two studies the benefit is unclear: one study [45] showed what appears to be a clinically significant effect in a population with both depression and an MTHFR genetic variant (MD = −10.7, MID = 1.6–1.9) but provided no between-group p-value; the second study [46] included a population with elevated homocysteine and reported benefit on the BDI, but statistical data did not suggest between-group differences. Another study [38] reported a statistically, but not clinically significant effect (MD = 3.1, p = 0.004, MID = 4). Two studies [44,47] did not show a clinically or statistically significant effect at the primary outcome endpoint.707
(5 RCTs)
⨁⨁◯◯
LOW a, b
Post-Natural Disaster Depression, Anxiety, Stress,
Assessed with: DASS
Follow up: range 4–6 weeks
Two studies investigated the effect of multinutrients on post-natural disaster (flood, earthquake) symptoms of depression, anxiety, and stress [48,49]. Both studies compared similar multinutrient formulations to active controls. Within group improvements were observed in both studies across all treatment groups. The flood study observed greater improvement over time with multinutrients compared to vitamin D on measures of anxiety (d = 1.08) and stress (d = 0.88), but not for depression. While there were no significant between group differences between two different doses of multinutrients and the B-complex with minerals in the earthquake study, with all three groups improving, more participants were rated as treatment responders with the multinutrient intervention.147
(2 RCTs)
⨁⨁◯◯
LOW b, g, h
Antisocial Behavior (Antisocial)
Assessed with: Number of disciplinary incidents per 1000 person/days, reports of serious offenses, violent rule infarctions reported by prison staff, SDAS, GHQ 28
Follow up: range 2 weeks to 9 months
Three studies measured the effect of multinutrients on antisocial or offending behavior measured as disciplinary incidents in incarcerated populations [39,40,50]. Two studies that were sufficiently homogeneous to meta-analyze [39,50], reported greater improvements in the multinutrient group vs placebo, but provided insufficient data to perform between group comparisons. The third study [40] investigated the effect of multinutrient supplementation on the number of violent rule infarctions in a population of incarcerated individuals aged 13–17. Multinutrients demonstrated a decrease in mean rule violations per subject of 2.85, compared to 1.63 in the placebo arm, a difference which was statistically significant (p = 0.005). MID is unclear.455
(3 RCTs)
⨁⨁◯◯
LOW d, f, g
Behavioral issues in Dementia (Dementia)
Assessed with: NPI,
CGI-S
Follow up: 12 weeks
For the outcome of behavioral issues in the context of dementia, one study measured the effect of a multinutrient vs placebo using the CGI-S and NPI [51]. Using the CGI-S, this study suggests a statistically and clinically significant effect of multinutrient supplementation in this population (MD = −1.15, p < 0.01, MID = −1.1). However, using the NPI instrument, the study suggests a statistically, but not clinically significant effect (MD = −4.70. p < 0.01, MID = −8.2).26
(1 RCT)
⨁⨁◯◯
LOW e
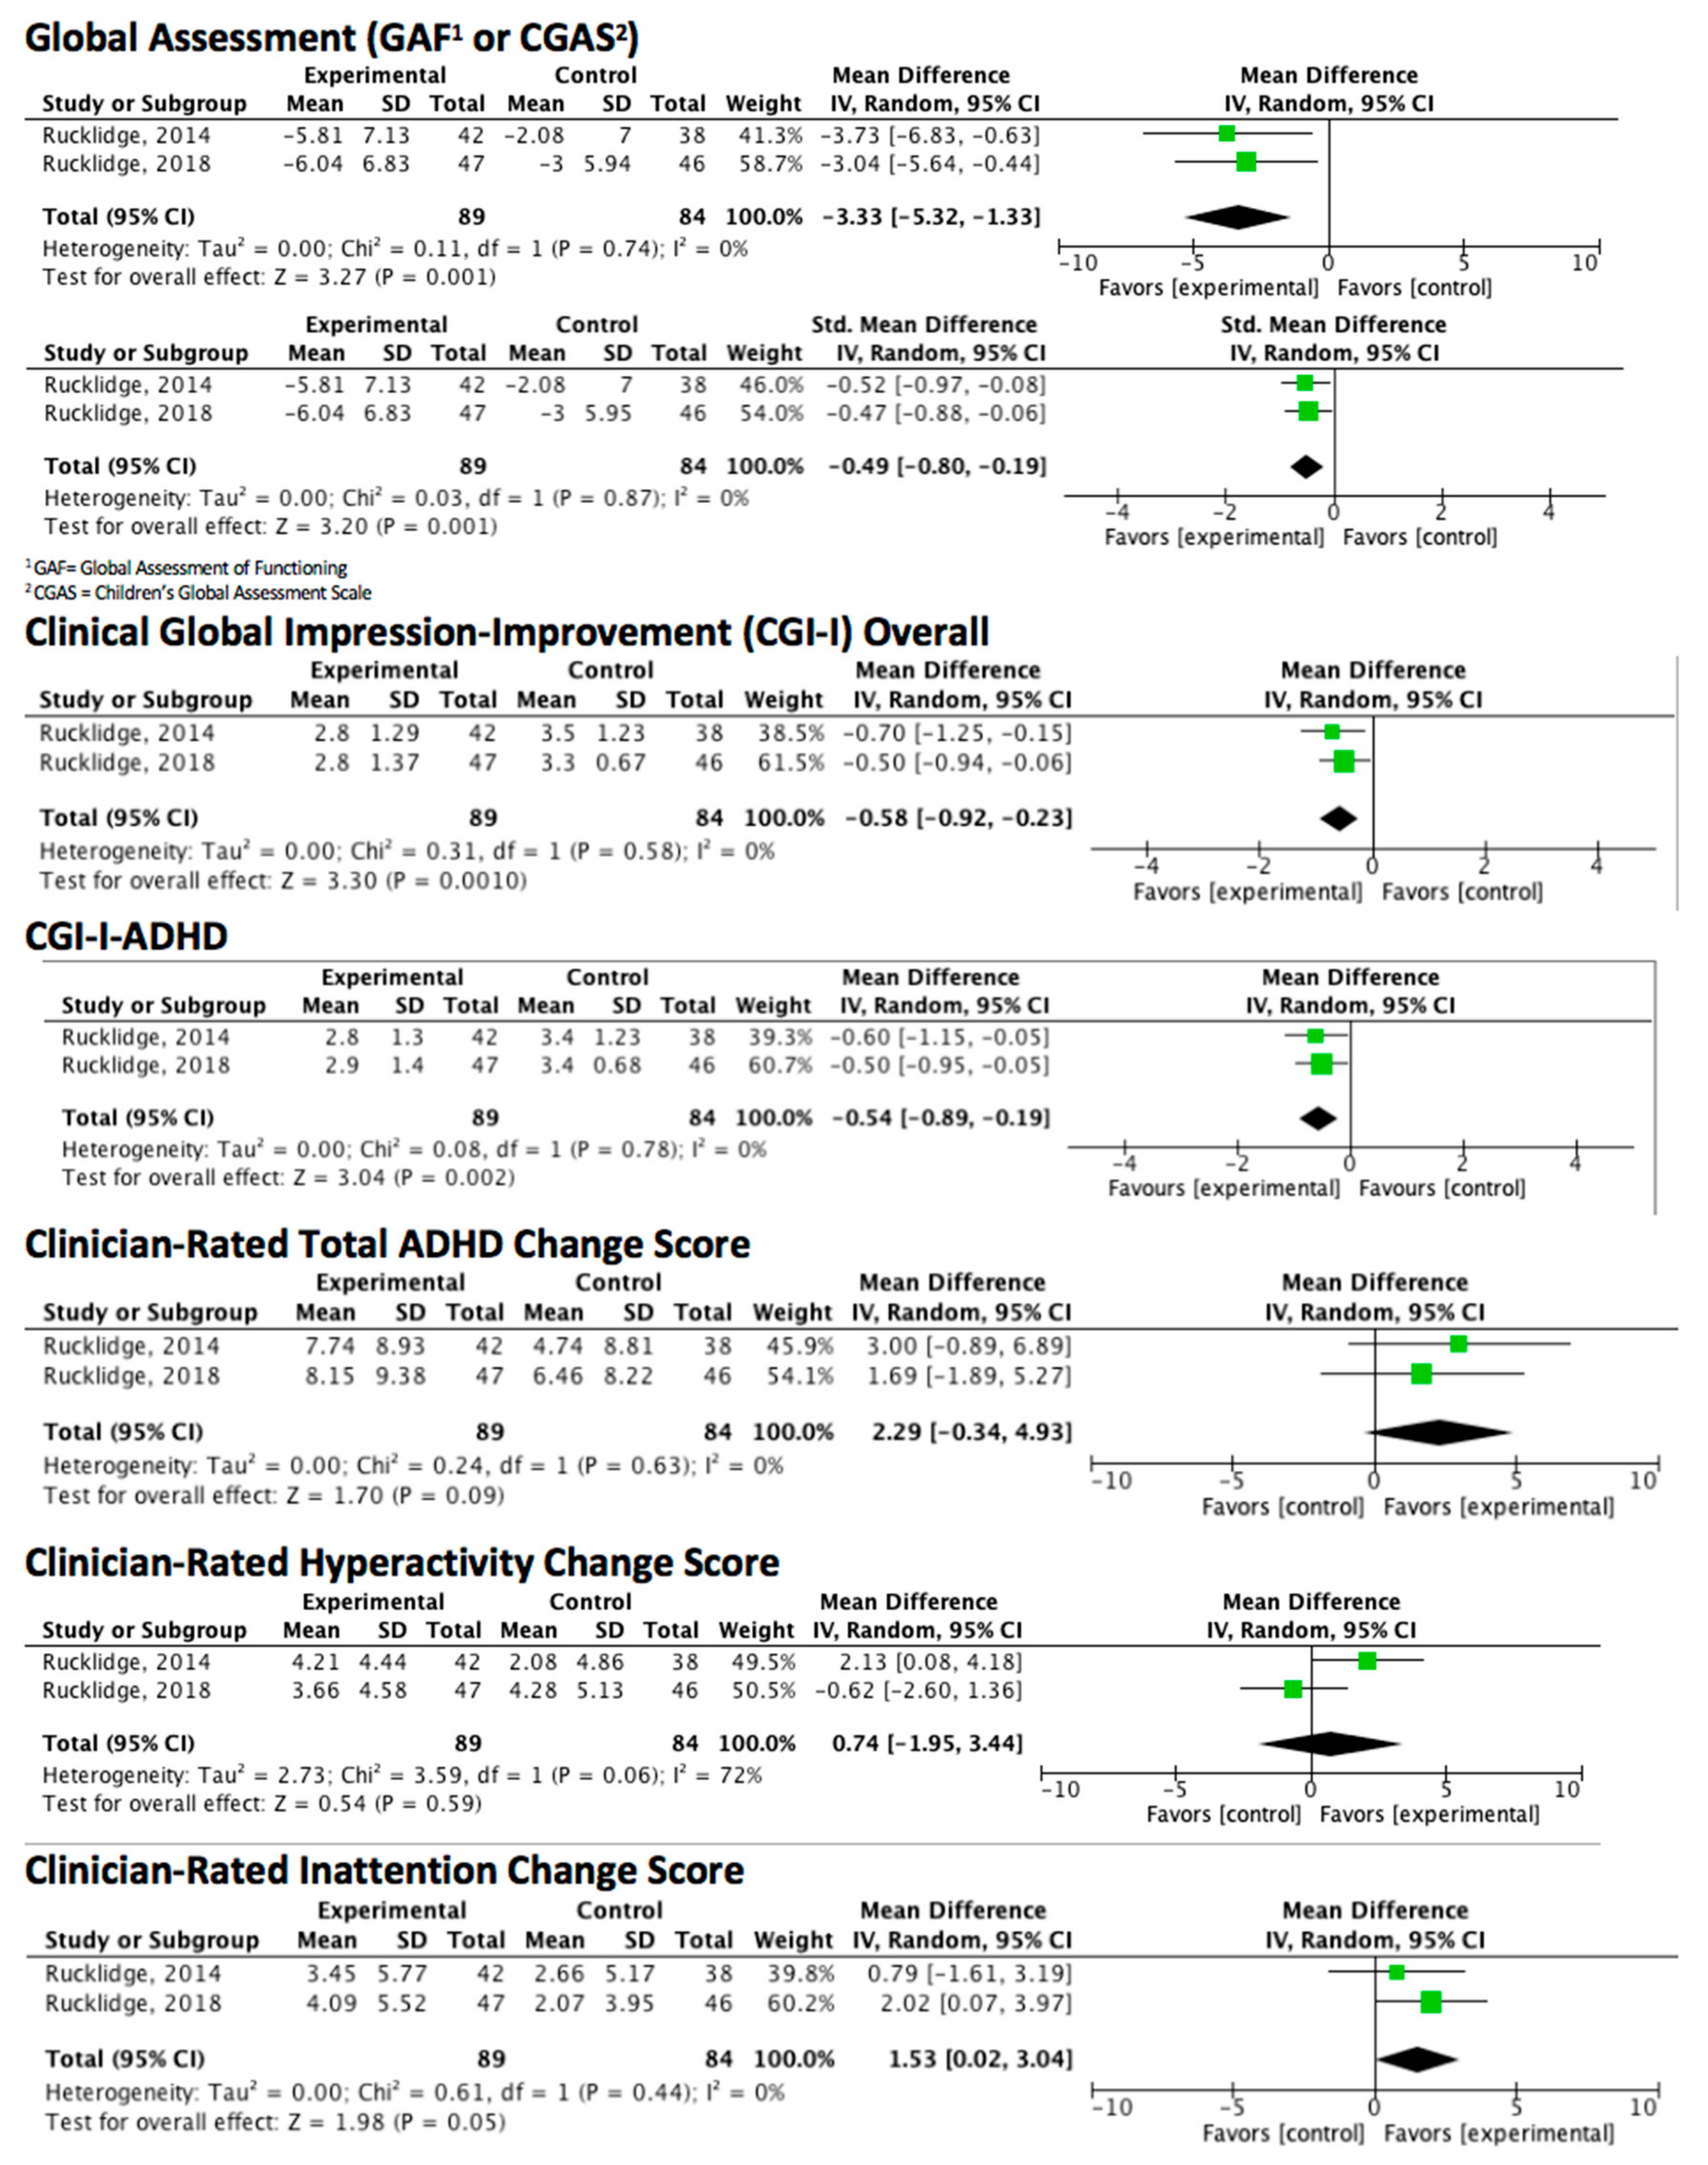
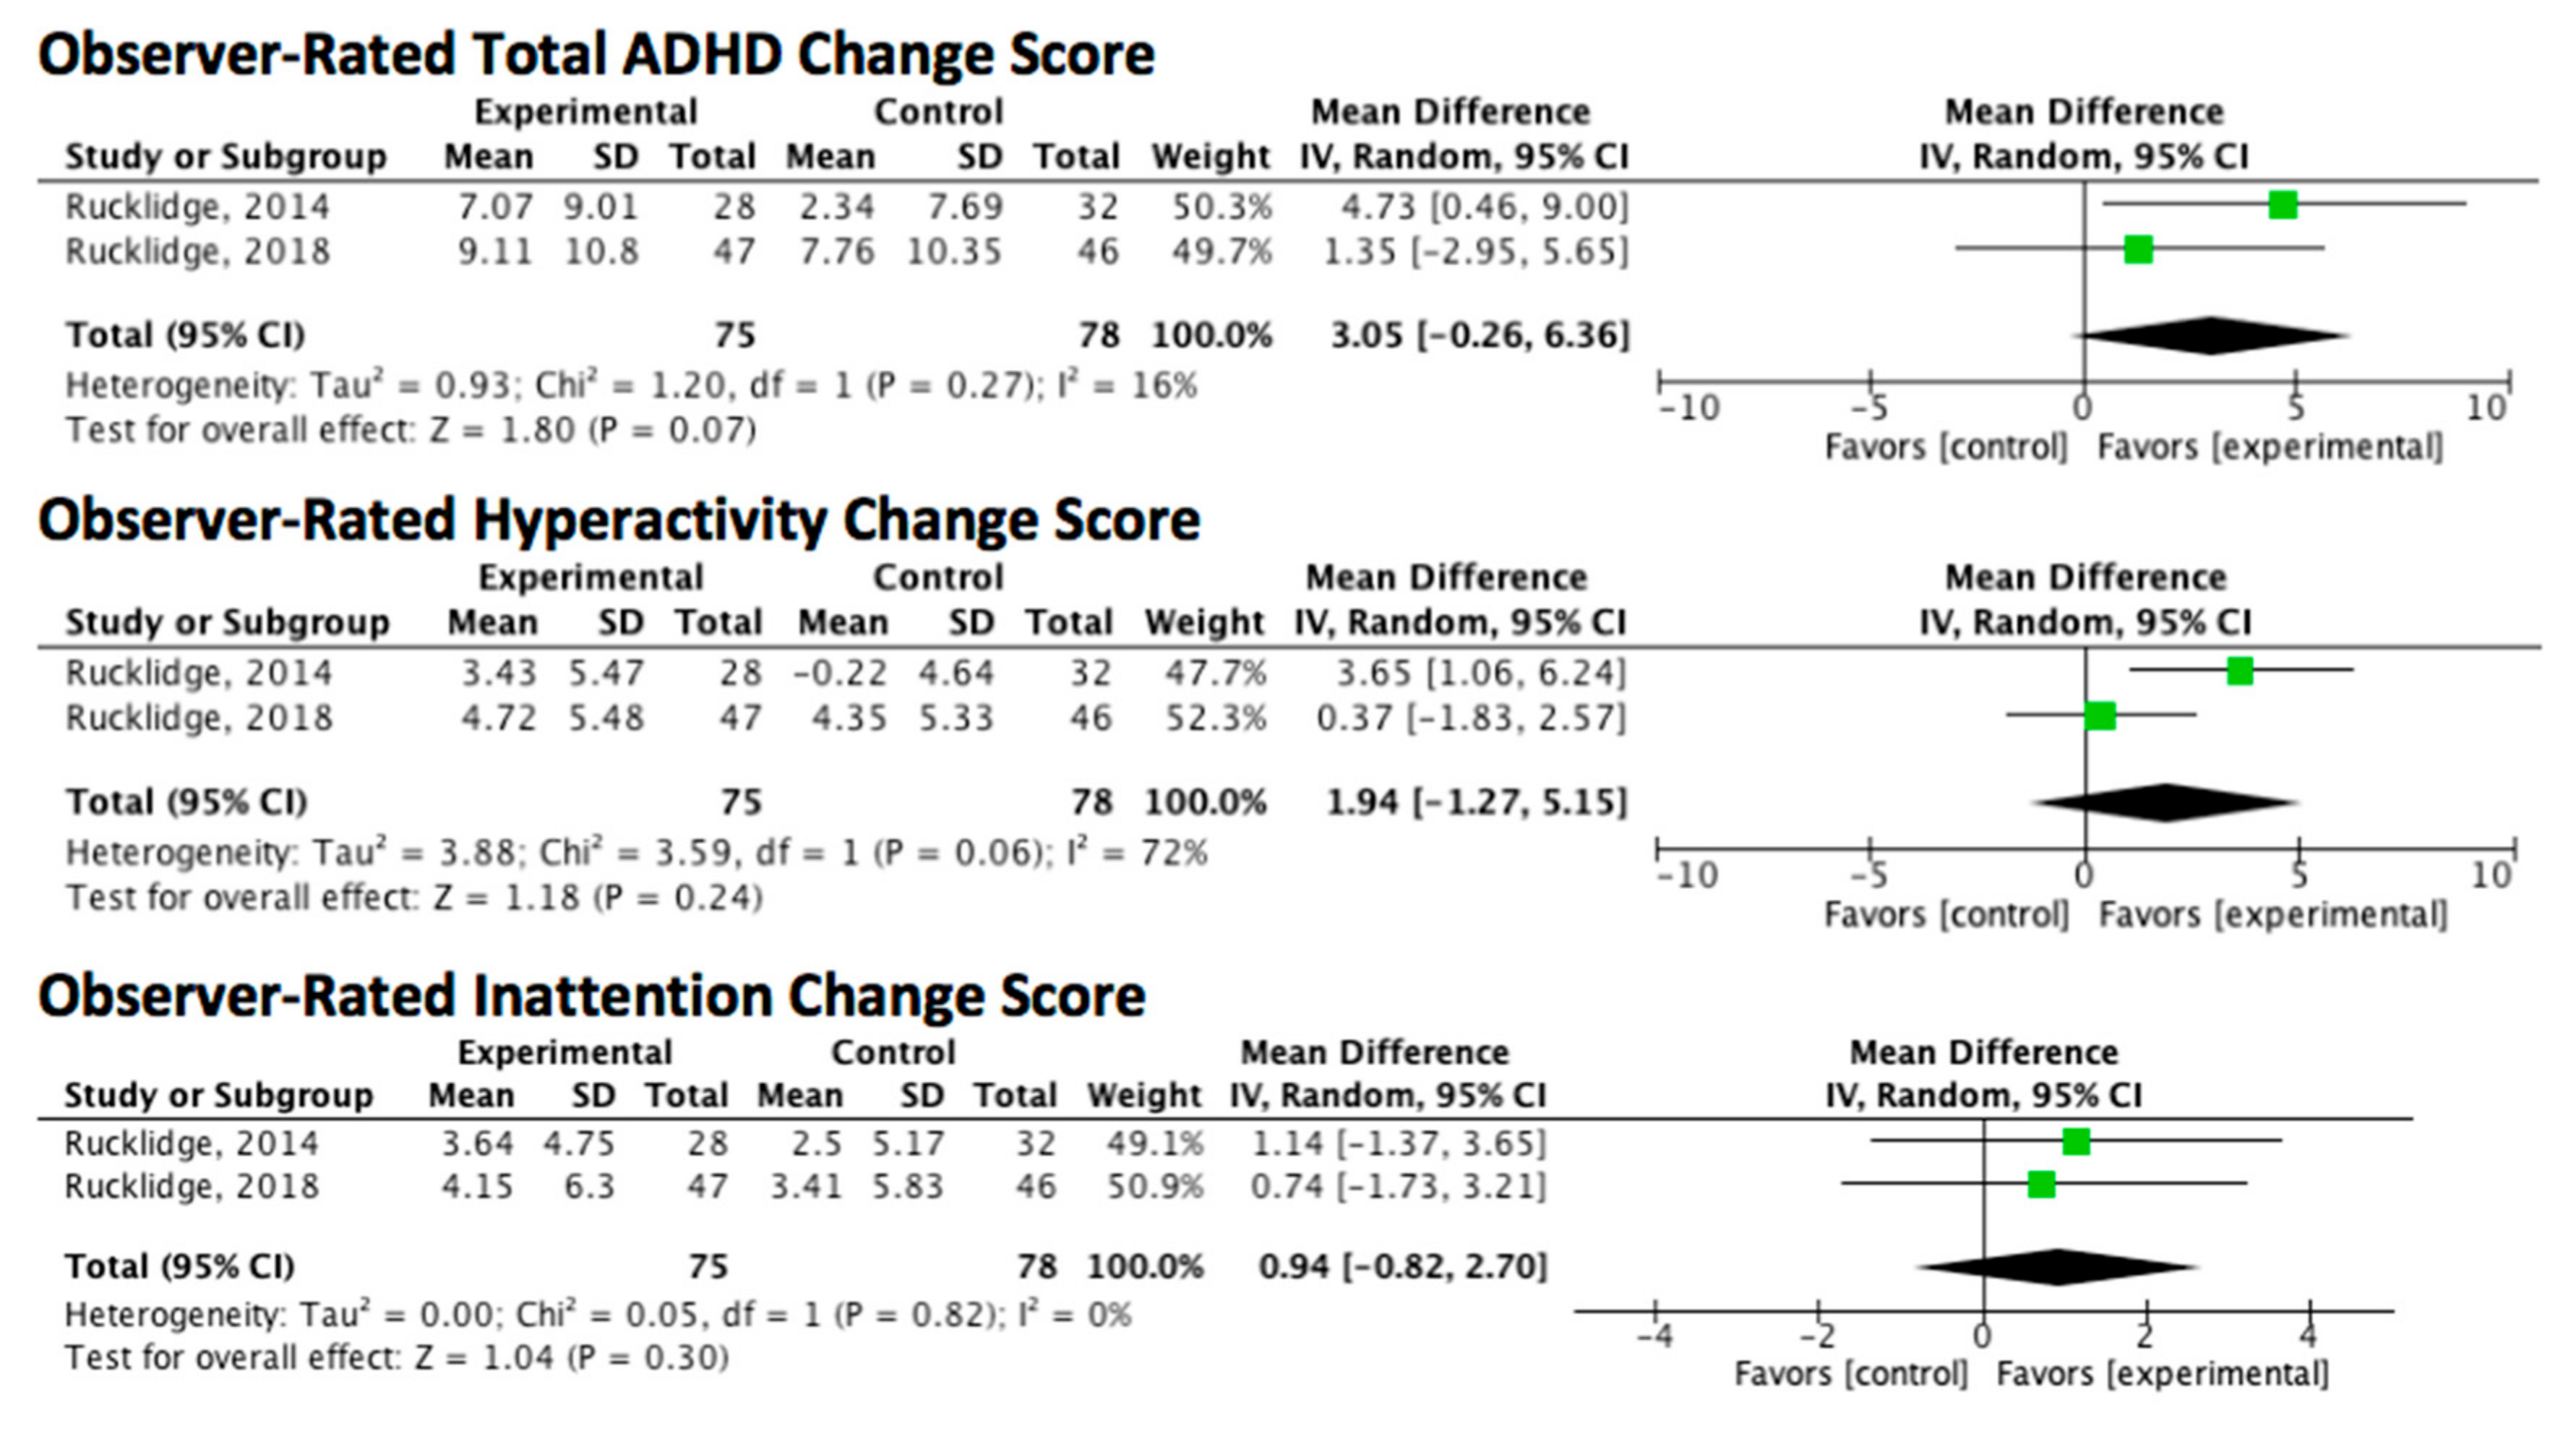
ADHD: Global/Symptomatic Improvement (ADHD)
Assessed with: CGI-I, CGI-ADHD, CPRS, CAARS
Follow up: range 8–15 weeks
Three studies investigated the impact of multinutrients on global and symptom improvement in patients with ADHD [26,27,41]. One study showed benefit for two pooled groups (multinutrients plus PUFA and PUFA-alone) compared to placebo, but did not find group differences between the multinutrients plus PUFA group compared to the PUFA alone group [41]. Two studies were sufficiently homogenous and were combined in meta-analyses [26,27]. The results showed clinically and statistically significant improvements on global functioning SMD = −0.49, p = 0.001, clinically and statistically significant improvements on clinician-rated global scores (MD = −0.58, p = 0.001, MID = −0.5) and ADHD scores (MD = −0.54, p = 0.002, MID = −0.5). Pooled analysis of clinician-rated symptom scores showed a statistically significant improvement for inattention (MD = 1.53, p = 0.05), but not for hyperactivity or total scores. No effect was observed for pooled observer-rated ADHD scores. ADHD symptom improvement was statistically and clinically significant in the adult study when outcome was measured by participant-report (MD = 6.71, p = 0.009, MID = 5.9).260
(3 RCTs)
⨁⨁◯◯
LOW c, d
Autism
Assessed with: Parent Global Impression
Follow up: 12 weeks
Two studies investigated clinical improvement in autism [42,43], both used the Parent Global Impression (PGI) scale. In children with autism, multinutrients demonstrated a statistically and clinically significant difference compared to placebo on the PGI sleep subscale (MD = 1.1, p = 0.03, MID = 0.5). In children and adults with autism, multinutrients demonstrated a statistically, but not clinically, significant difference in PGI ratings (MD = 0.33, p < 0.01, MID = 0.5). While the studies were adequately homogenous for pooling, confidence intervals were not consistently reported, which precluded meta-analysis.124
(2 RCTs)
⨁⨁◯◯
LOW b, d
a. Inconsistent results between varying populations studied; b. Narrative synthesis was conducted, estimates are not precise; c. Considerable variation in the estimated effect between the different study instruments and raters; d. Total population does not meet optimal information size thresholds; e. Only a single study with very few participants; f. Blinding was broken in Zaalberg et al., 2010; g. Confidence interval is wide and includes significant improvement, no effect, and worsening of effect; h. Both studies were unblinded and had a high risk of bias; MD = Mean Difference; MID = Minimal Clinically Important Difference; SMD = standardized mean difference; d = Cohen’s d; RCT = randomized controlled trial; MTHFR = methylenetetrahydrofolate; MADRS = Montgomery-Asberg Depression Rating Scale; CES-D=Center for Epidemiologic Studies-Depression Scale; BDI = Beck Depression Inventory; DASS = Depression Anxiety and Stress Scale; SDAS = Social Dysfunction and Aggression Scale; GHQ 28 = General Health Questionnaire-28; NPI = Neuropsychiatric Inventory; CGI-S = Clinical Global Impression-Severity; CGI-I = Clinical Global Impression-Improvement; CGI-ADHD = Clinical Global Impression-ADHD; CPRS = Conners Parent Rating Scale; CAARS = Conners Adult ADHD Rating Scale.
Table 3. Post-natural disaster stress studies (n = 147).
ReferenceIntervention
Daily Dose
Sample
Size
Sample
Characteristics
Study
Length
OutcomesResults
Kaplan et al., 2015 [48]
ANZCTR 12613001051730
EMPowerplus (EMP+)TM: 4 capsules containing Vit A 384 μg, Vit C 133.2 mg, Vit D 320 IU, Vit E 53.6 mg, B1 4 mg, B2 3.2 mg, B3 20 mg, B5 4.8 mg, B6 8 mg, B9 320 µg, B12 293.2 µg, Biotin 240 µg, Ca 293.2 mg, Fe 3.2 mg, P 186.8 mg, I 45.2 µg, Mg 133.2 mg, Zn 10.8 mg, Se 45.2 µg, Cu 1.6 mg, Mn 2.0 mg, Cr 138.8 µg, Mo 32.0 µg, K 53.2 mg, plus a proprietary blend of Phenylalanine, L-methionine, Citrus bioflavonoids,
Germanium sesquioxide, Nickel, Vanadium, Grape seed, L-glutamine, Inositol, Choline bitartrate and Ginkgo biloba
or
B-complex: B1 50 mg, B2 20 mg, B3 50 mg, B5 50 mg, B6 20 mg, B7 300 µg, Folate 400 µg, B12 500 µg, Intrinsic factor 20 mg,
or
Vit D 1000 IU
n = 56
All active:
18 Micronutrient
17 Vit D
21 B-Complex
Adults with elevated symptoms of depression, anxiety or stress whose homes were damaged by a flood6 weeksPrimary: Depression Anxiety and Stress Scale (DASS): Total
Secondary:
DASS Depression, Anxiety and Stress subscales;
Modified Clinical Global Impression- Improvement (CGI-I): Mood, Anxiety, Stress subscales completed by the participants
Positive: The micronutrient and B-complex groups experienced significant declines in psychological symptoms compared with vitamin D alone.

Micronutrient vs
vitamin D:
DASS: total (d = 0.94); depression (d = 0.64); anxiety (d = 1.08), stress (d = 0.88), as reported by authors.

B-complex vs vitamin D:DASS: total (d = 0.81); depression (d = 0.58); anxiety (d = 0.89), stress (d = 0.76), as reported by authors.

No significant differences between micronutrient and B-complex.
Rucklidge et al., 2012 [49]

ANZCTR12611000460909
CNETM (equivalent to EMP+TM as above) as a “low dose” (4 capsules)
or
a “high dose” (8 capsules)
or
1 tablet of BeroccaTM containing Vit A 100 IU,
Vit C 1000 mg, B1 15 mg,
B2 15 mg, B3 50 mg, B6 10 mg, B9 400 µg,
B12 10 µg, B7 150 µg, B5 23 mg, Ca 50 mg, Mg 50 mg, Zn 10 mg, Na 260 mg, Vit K 5 mg
n = 91
All active:
30 Berocca
31 CNE 4 capsules daily
30 CNE 8 capsules daily
Adults experiencing heightened anxiety or stress 2–3 months post-earthquake4 weeksPrimary: DASS: Total
Secondary: DASS subscales; Impact of Events Scale (IES); Perceived Stress Scale (PSS); Traumatic Exposure Severity Scale (TESS), modified CGI-I: Mood, Anxiety, Stress subscales completed by the participants
Positive: All three active treatment groups experienced significant reduction in psychological symptoms.
ANZCTR = Australia New Zealand Clinical Trial Registry; n refer to the number who were included in analyses; DBRCT = double-blind randomized controlled trial; IU = international unit; RDA = recommended dietary allowance; Cr = chromium; P = phosphorus; Se = selenium; Mn = manganese; Cu = copper; Zn = zinc; Mg = magnesium; I = iodine; Ca = calcium; Fe = iron; Si = silicon, silica; Cl = chloride; Mo = molybdenum; K = potassium; B = boron; V = vanadium; Na=sodium; Ni = nickel; Vit A = beta-carotene, retinyl palmitate; Vit C = ascorbate, ascorbic acid; Vit D, D3 = cholecalciferol; Vit E = d-alpha tocopheryl succinate; B1 = thiamine; B2 = riboflavin; B3 = niacin, nicotinamide; B5 = pantothenic acid; B6 = pyridoxine; B7 = biotin; B9 = folic acid, folate; Vit H = biotin; Vit K = Phytomenadione or phylloquinone; Primary = measure used in study for participant inclusion criteria.
Table 4. Antisocial behavior studies (n = 455).
ReferenceIntervention
Daily Dose
Sample
Size
Sample
Characteristics
Study
Length
OutcomesResults
Gesch et al., 2002 [50]ForcevalTM Vit A 750 µg, Vit D 10 µg, B1 1.2 mg, B2 1.6 mg, B3 18 mg, B5 4 mg, B6 2 mg, B9 400 µg, B12 3 µg, Vit C 60 mg, Vit E 10 mg, Vit K 120 µg, Vit H 100 µg, Ca 100 mg, Fe 12 mg, Cu 2 mg, Mg 30 mg, Zn 15 mg, I 140 µg, Mn 3 mg, K 4 mg, P 44 mg, Se 50 µg, Cr 200 µg, Mo 250 µg; ALA 1260 mg, GLA 160 mg, EPA 80 mg, DHA 44 mgn = 172
82 active
90 placebo
adult prisoners (>18 years)2 weeks
to
9 months 142 days average
Primary: Number of disciplinary incidents per 1000 prison days; Secondary: Reports of serious offensesPositive: Authors report the average reduction in disciplinary incidents was 35.1% for the active group compared to 6.7% for placebo group; data were insufficient in the paper to calculate effect sizes; authors also report reduction in serious offenses in active group, but not placebo group
Schoenthaler et al., 1997 [40]Vit A 900 μg, B1 3.6 mg, B2 3.9 mg, B3 48 mg; B5 15 mg, B6 30 mg, B7 90 μg, B9 400 μg, B12 7.2 μg, Vit C 120 mg, Vit D 5 μg, Vit E 45 mg, Ca 122 mg, Fe 8 mg, K 700 mg, Iodine 0.150 mg, Mg 59 mg, Zn 11 mg, Se 55 μg, Cu 0.9 mg, Mn 2.3 mg, Chromium 35 μg, Mo 45 μg, Inositol 40 mg, Choline 40 mg, Guarana 87.78 mg, Caffeine 44 mg, p-amino benzoic acid 50 mgn = 62
32 active
30 placebo
incarcerated youth (13–17 years)12 weeksPrimary: Violent rule infractions reported by prison staffPositive: 28% fewer rule infractions: both violent (d = 0.52), and non-violent (d = 0.70) in those who received the supplement than those who received placebo
Zaalberg et al., 2010 [39]Vit A 875 µg, B1 1.2 mg, B2 1.6 mg, B3 18 mg, B5 4 mg, B6 2 mg, B9 400 µg, B12 3 µg, Vit H 100 µg, Vit C 60 mg, Vit D3 5 µg, Vit E 10 mg, Ca 100 mg, Mg 100 mg, P 52 mg, Zn 15 mg, Fe 12 mg, Mn 3 mg, Cu 2 mg, K 4 mg, I 140 µg, Se 50 µg, Cr 200 µg, Mo 250 µg; DHA 400 mg, EPA 400 mg, GLA 100 mg, and 2 capsules primrose oiln = 221
115 active 106 placebo
adult male prisoners
(18–25 years) across 8 Dutch prisons
1–3
months
Primary: Number of disciplinary incidents per 1000 prison days; Secondary: Social Dysfunction and Aggression Scale, General Health Questionnaire-28Positive: Authors report 34% fewer aggressive and rule-breaking incidents vs 14% increase in the placebo group. Data were insufficient to calculate effect sizes.
Negative: No group differences on self-reports of aggression or psychological well-being
Sample size n refers to the number who were included in analyses; Cr = chromium; P = phosphorus; Se = selenium; Mn = manganese; Cu = copper; Zn= zinc; Mg = magnesium; I = iodine; Ca = calcium; Fe = iron; Si = silicon, silica; Cl = chloride; Mo = molybdenum; K = potassium; B = boron; V = vanadium; Ni = nickel; Vit A = beta-carotene, retinyl palmitate; Vit C = ascorbate, ascorbic acid; Vit D, D3 = cholecalciferol; vit E = d-alpha tocopheryl succinate; B1 = thiamine, B2 = riboflavin; B3 = niacin, nicotinamide; B5 = pantothenic acid, B6 = pyridoxine; B9 = folic acid, folate; vit H = biotin; Vit K = Phytomenadione or phylloquinone; EFA = essential fatty acids; ALA = alpha linolenic acid, GLA = gamma linolenic acid; EPA = eicosapentaenoic acid; DHA = docosahexaenoic acid; Primary = measure used in study for participant inclusion criteria.
Table 5. Behavioral issues in dementia study (n = 26).
ReferenceIntervention
Daily Dose
Sample
Size
Sample
Characteristics
Study
Length
OutcomesResults
Pardini et al., 2015 [51]SouvenaidTM: EPA 300 mg, DHA 1200 mg, Phospholipids 106 mg, Choline 400 mg, uridine-mono-phosphate 625 mg, Vit E 40 mg, Vit C 80 mg, Se 60 µg, B12 3 µg, B6 1 mg, B9 400 µgn = 26
13 active
13 placebo, crossover design
adults (50–65 years) with diagnosis of behavioral variant of frontotemporal dementia12 weeksPrimary: Neuropsychiatric Inventory (NPI); Secondary: Frontal Assessment Battery (FAB), Clinical Global Impression-Severity (CGI-S), the Reading the Mind in the Eyes Test (RMET)Positive: authors report reduced agitation, apathy, disinhibition, and irritability on the NPI; improvement on the CGI-S; an increase in Theory of Mind skills for those on active treatment; reversal of improvement when taken off active; insufficient data provided to calculate effect sizes
Negative: no impact on executive functioning on the FAB
Se = selenium; Vit C = ascorbate, ascorbic acid; vit E = d-alpha tocopheryl succinate; B6 = pyridoxine; B9 = folic acid, folate; EFA = essential fatty acids; EPA = eicosapentaenoic acid; DHA = docosahexaenoic acid; Primary = measure used in study for participant inclusion criteria.
Table 6. ADHD studies (n = 260).
ReferenceIntervention
Daily Dose
Sample
Size
Sample
Characteristics
Study
Length
OutcomesResults
Rucklidge et al., 2018 [27]
ANZCTRN12613000896774
Daily Essential Nutrients:
Vit A 384 IU, Vit C 40 mg, Vit D 200 IU, Vit E 24 IU, Vit K 8 µg, B1 4 mg, B2 1.2 mg, B3 6 mg, B6 4.67 mg, B9 50 μg, B12 60 μg, B7 72 μg, B5 2 mg, Ca 88 mg, Fe 0.92 mg, P 56 mg, I 13.6 μg, Mg 40 mg, Zn 3.2 mg, Se 13.6 μg, Cu 0.48 mg, Mn 0.64 mg, Cr 41.6 μg, Mo 9.6 μg, P 16 mg. Proprietary blend: Choline bitartrate, Alpha-lipoic acid, Inositol, Acetylcarnitine (as acetyl-L-carnitine hydrochloride), Grape seed extract, Ginkgo biloba leaf extract, Methionine (as L-methionine hydrochloride), Cysteine (as N-acetyl-L-cysteine), Germanium sesquioxide (as chelate), Boron, Vanadium, Lithium orotate, Nickel. Other ingredients: Cellulose glycine 45 mg, Citric acid 26.814 mg, Magnesium stearate 24 mg, Silicon dioxide 20 mg
n = 93
47 active
46 placebo
Children (7–12 years) with ADHD10 weeksPrimary: Conners Parent/Teacher Rating Scale-Revised (CPRS) Diagnostic and Statistical Manual (DSM)-IV Attention Deficit Hyperactivity Disorder (ADHD) Symptoms Total

Secondary: Clinical Global Impression-Improvement (CGI-I); CGI-I-ADHD; CGI-I-Mood; Children’s-Global Assessment Scale-(C-GAS); Clinician ADHD-Rating Scale (RS)-IV Symptoms Total; Child Mania Rating Scale-Parent (CMRS-P); Clinician ADHD-RS-IV; Parent Strengths and Difficulties Questionnaire (SDQ)-Total Problem Score;
Parent SDQ-Conduct Problem Score; Teacher SDQ-Total Problem score; Teacher SDQ-Conduct Problem Score
Teacher Behavior Rating Inventory of Executive Function (BRIEF), Behavioural Regulation; Index Teacher BRIEF-Emotional Control subscale
Positive: CGI-I overall (d = 0.46)
CGI-I-ADHD (d = 0.53); CGI-I-Mood (d = 0.51); C-GAS (d = 0.48); Parent SDQ-Conduct Problem Score (d = 0.52); Teacher BRIEF-Emotional Control Subscale (d = 0.66)

Negative: Clinician ADHD-RS-IV Symptoms Total, CPRS DSM-IV ADHD Symptoms Total; CMRS-P; Clinician ADHD-RS-IV
Conners Teacher Rating Scale-DSM-IV Total; Parent SDQ-Total Problem Score; Teacher SDQ-Total Problem Score; Teacher SDQ-Conduct Problem Score
Teacher BRIEF-Behavioural Regulation Index
Rucklidge et al., 2014 [26]
ANZCTR12609000308291
EMP+: Vit A 5760 IU, Vit C 600 mg, Vit D 1440 IU, Vit E 360 IU, B1 18 mg, B2 13.5 mg, B3 90 mg, B5 21.6 mg, B6 36 mg, B9 1440 µg, B12 900 µg, Biotin 1080 µg, Pantothenic acid 21.6 mg, Ca 1320 mg, Fe 13.74 mg, P 840mg, I 204 µg, Mg 600 mg, Zn 48 mg, Se 204 µg, Cu 7.2 mg, Mn 9.6 mg, Cr 624 µg, Mo 144 µg, K 240 mg, Germanium sesquioxide 20.7 mg, B 2400 µg, V 1194 µg, Ni 29.4 µg, Choline bitartrate 540 mg, DL-phenylalanine 360 mg, Citrus bioflavonoids 240 mg, Inositol 180 mg, Glutamine 180 mg, L-methionine 60 mg, Gingko biloba 36 mg, grape seed extract 45 mgn = 80
42 active
38 placebo
Adults with ADHD8
weeks
Primary: Conners Adult ADHD Rating Scale (CAARS), self or observer version

Secondary: CGI-I-Overall Impression; CGI-I-ADHD; Global Assessment of Functioning (GAF); MADRS;
Self-report: CAARS, DSM-IV ADHD symptoms total; CAARS inattention, hyperactivity/impulsivity;
Observer: CAARS DSM-IV ADHD symptoms total; CAARS, inattention, hyp/imp;
Clinician: CAARS DSM-IV ADHD symptoms total; inattention, hyperactivity/impulsivity
Positive: CAARS DSM-IV ADHD symptoms, self-report (d = 0.61); CAARS ADHD symptoms, Observer (d = 0.59); CGI-I-ADHD (d = 0.53); CGI-I-Overall (d = 0.57); CAARS, self-report inattention (d = 0.62), hyperactivity/impulsivity (d = 0.47); CAARS, observer, hyperactivity/impulsivity (d = 0.67); GAF (d = 0.46)

Negative: CAARS DSM-IV ADHD symptoms, clinician; MADRS; CAARS, observer, inattention; CAARS, clinician inattention, hyperactivity/impulsivity
Sinn & Bryan, 2007 [41] Blackmores Chewable Multivitamins & Minerals for Kids (Nutrients): Vit 175 IU, B1 700 µg, B2 1.1 mg, B3 12 mg, B5 2.7 mg, B6 1.3 mg, B9 100 µg, B12 1.5 µg, Vit C 60 mg, D3 100 IU, Vit E 6 IU, Vit H 50 µg, Ca 33.9 mg, Fe 7.5 mg, Mg 8.32 mg, Mn 77 µg, Cu 178.6 µg, K 118 µg
Plus: Polyunsaturated fatty acid (PUFA): eye q™: EPA 93 mg, DHA 29 mg, GLA 10 mg, Vit E 1.8 mg
or
eye q™ alone
n = 87
36 active: (nutrients + PUFA)
29 PUFA
22 placebo
Children with ADHD15 weeksPrimary: Conners Parent and Teacher Rating Scales (CPRS), ADHD Index

Secondary: CPRS subscales:
cognitive problems/inattention, hyperactivity; Global scales for restless/impulsive, emotional liability, total; DSM-IV inattentive; hyperactive/impulsive, total; Oppositional; Anxious/Shy; Perfectionism; Social Problems; Psychosomatic
Negative: At 15 weeks, the PUFA group combined with the PUFA + nutrients group showed significant improvements over placebo for parent ratings of inattention, hyperactivity, and global ADHD indices on the CPRS. PUFA + nutrients compared to PUFA alone showed no group differences; authors concluded PUFA was the primary mechanism of improvement. However, the PUFA + nutrients group was not compared to placebo. No changes reported on the teachers rating scales.
ANZCTR = Australian New Zealand Clinical Trials Registry number; n refers to the number who were included in the analyses; IU = international unit, RDA = recommended dietary allowance; Cr = chromium; P = phosphorus; Se = selenium; Mn = manganese; Cu = copper; Zn= zinc; Mg = magnesium; Li = lithium; I = iodine; Ca = calcium; Fe = iron; Si = silicon, silica; Cl = chloride; Mo = molybdenum; K = potassium; B = boron; V = vanadium; Ni = nickel; Vit A = beta-carotene, retinyl palmitate; Vit C = ascorbate, ascorbic acid; Vit D, D3 = cholecalciferol; Vit E = d-alpha tocopheryl succinate; B1 = thiamine, B2 = riboflavin; B3 = niacin, nicotinamide; B5 = pantothenic acid, B6 = pyridoxine; B7 = biotin, B9 = folic acid, folate; Vit H = biotin; EFA = essential fatty acids; ALA = alpha linolenic acid, GLA = gamma linolenic acid; EPA = eicosapentaenoic acid; DHA = docosahexaenoic acid; Primary = measure used in study for participant inclusion criteria, Primary = measure used in study for participant inclusion criteria.
Table 7. Autism studies (n = 124).
ReferenceIntervention
Daily Dose
Sample
Size
Sample
Characteristics
Study
Length
OutcomesResults
Adams et al., 2011 [41]
NCT01225198
Vit A 1000 IU, Vit C 600 mg, Vit D3 300 IU, Vit E 150 IU, B1 20 mg, B2 20 mg, B3 25 mg, B5 15 mg, B6 40 mg, B9 100 µg, B12 500 µg, Folinic acid 550 µg, Vit H 150 µg, Choline 250 mg, Inositol 100 mg, Mixed carotenoids 3.6 mg, Coenzyme Q10 50 mg, n-acetyl cysteine 50 mg, Ca 100 mg, Cr 70 µg, I 100 µg, Li 500 µg, Mg 100 mg, Mn 3 mg, Mo 150 µg, K 50 mg, Se 22 µg, S 500 mg, Zn 12 mgn = 104
53 active
51 placebo
children and adults (3–58 years) with autism spectrum disorder12 weeksParent Global Impressions (PGI)-Revised and subscales:
Expressive Language
Receptive language
Play
Cognition
Sleep
Sociability
Eye Contact
Hyperactivity
Tantrumming
Positive:
PGI-Revised
subscales:
Overall (d = 0.46)
Tantrumming (d = 0.51); Receptive language (d = 0.40)
Hyperactivity (d = 0.37)

Negative: Expressive language, play, cognition, sleep, sociability, eye contact
Adams and Holloway, 2004 [42]Vit A (7560, 10,584 IU), B1 (20, 30 mg), B2 (25, 25 mg), B3 (25, 35 mg), B5 (45, 25 mg), B6 (30, 30 mg), B9 (800, 800 µg), B12 (1200, 1600 µg), B7 (100, 150 µg), Choline (50, 60 mg), Inositol (50, 60 mg), Vit C (650, 800 mg), Mixed bioflavonoids (200, 400 mg), Vit D3 (150, 150 IU), Vit E (175, 250 IU), Ca (175, 200 mg), Ca D-glucarate (0, 75 mg), Cr (75, 100 µg), Mg (175, 200 mg), Mn (3, 3 mg), Mo (0, 75 µg), K (75, 75 mg), Se (70, 85 µg), Si (0, 3 mg), S (175, 300 mg), Zn (15, 20 mg), N-acetyl cysteine (25, 50 mg), Alpha lipoic acid (0, 25 mg)n = 20
11 active
9 placebo
children (3–8 years) with autism
spectrum disorder
12 weeks(PGI) subscales:
Sleep
Gastrointestinal symptoms
Expressive Language
Receptive language
Play
Cognition
Sleep
Sociability
Eye Contact
Hyperactivity
Positive: PGI-Revised subscales: sleep and gastrointestinal problems; insufficient data to calculate effect sizes

Negative: Expressive and receptive language, play, cognition, sociability, eye contact, hyperactivity
NCT = National Clinical Trials registry; n refers to the number who completed the study; IU = international unit; Cr = chromium; P = phosphorus; Se = selenium; Mn = manganese; Cu = copper; Zn= zinc; Mg = magnesium; Li = lithium; I = iodine; Ca = calcium; Fe = iron; Si = silicon, silica; Cl = chloride; Mo = molybdenum; K = potassium; B = boron; V = vanadium; Ni = nickel; Vit A = beta-carotene, retinyl palmitate; Vit C = ascorbate, ascorbic acid; Vit D, D3 = cholecalciferol; Vit E = d-alpha tocopheryl succinate; B1 = thiamine, B2 = riboflavin; B3 = niacin, nicotinamide; B5 = pantothenic acid, B6 = pyridoxine; B7 = biotin, B9 = folic acid, folate; Vit H = biotin; EFA = essential fatty acids; ALA = alpha linolenic acid, GLA = gamma linolenic acid; EPA = eicosapentaenoic acid; DHA = docosahexaenoic acid.
Publisher’s Note: MDPI stays neutral with regard to jurisdictional claims in published maps and institutional affiliations.

