Orders of Healthier Adult Menu Items in a Full-Service Restaurant Chain with a Healthier Children’s Menu

 , ,
, ,
Abstract
1. Introduction
2. Materials and Methods
2.1. Study Design
2.2. Analysis
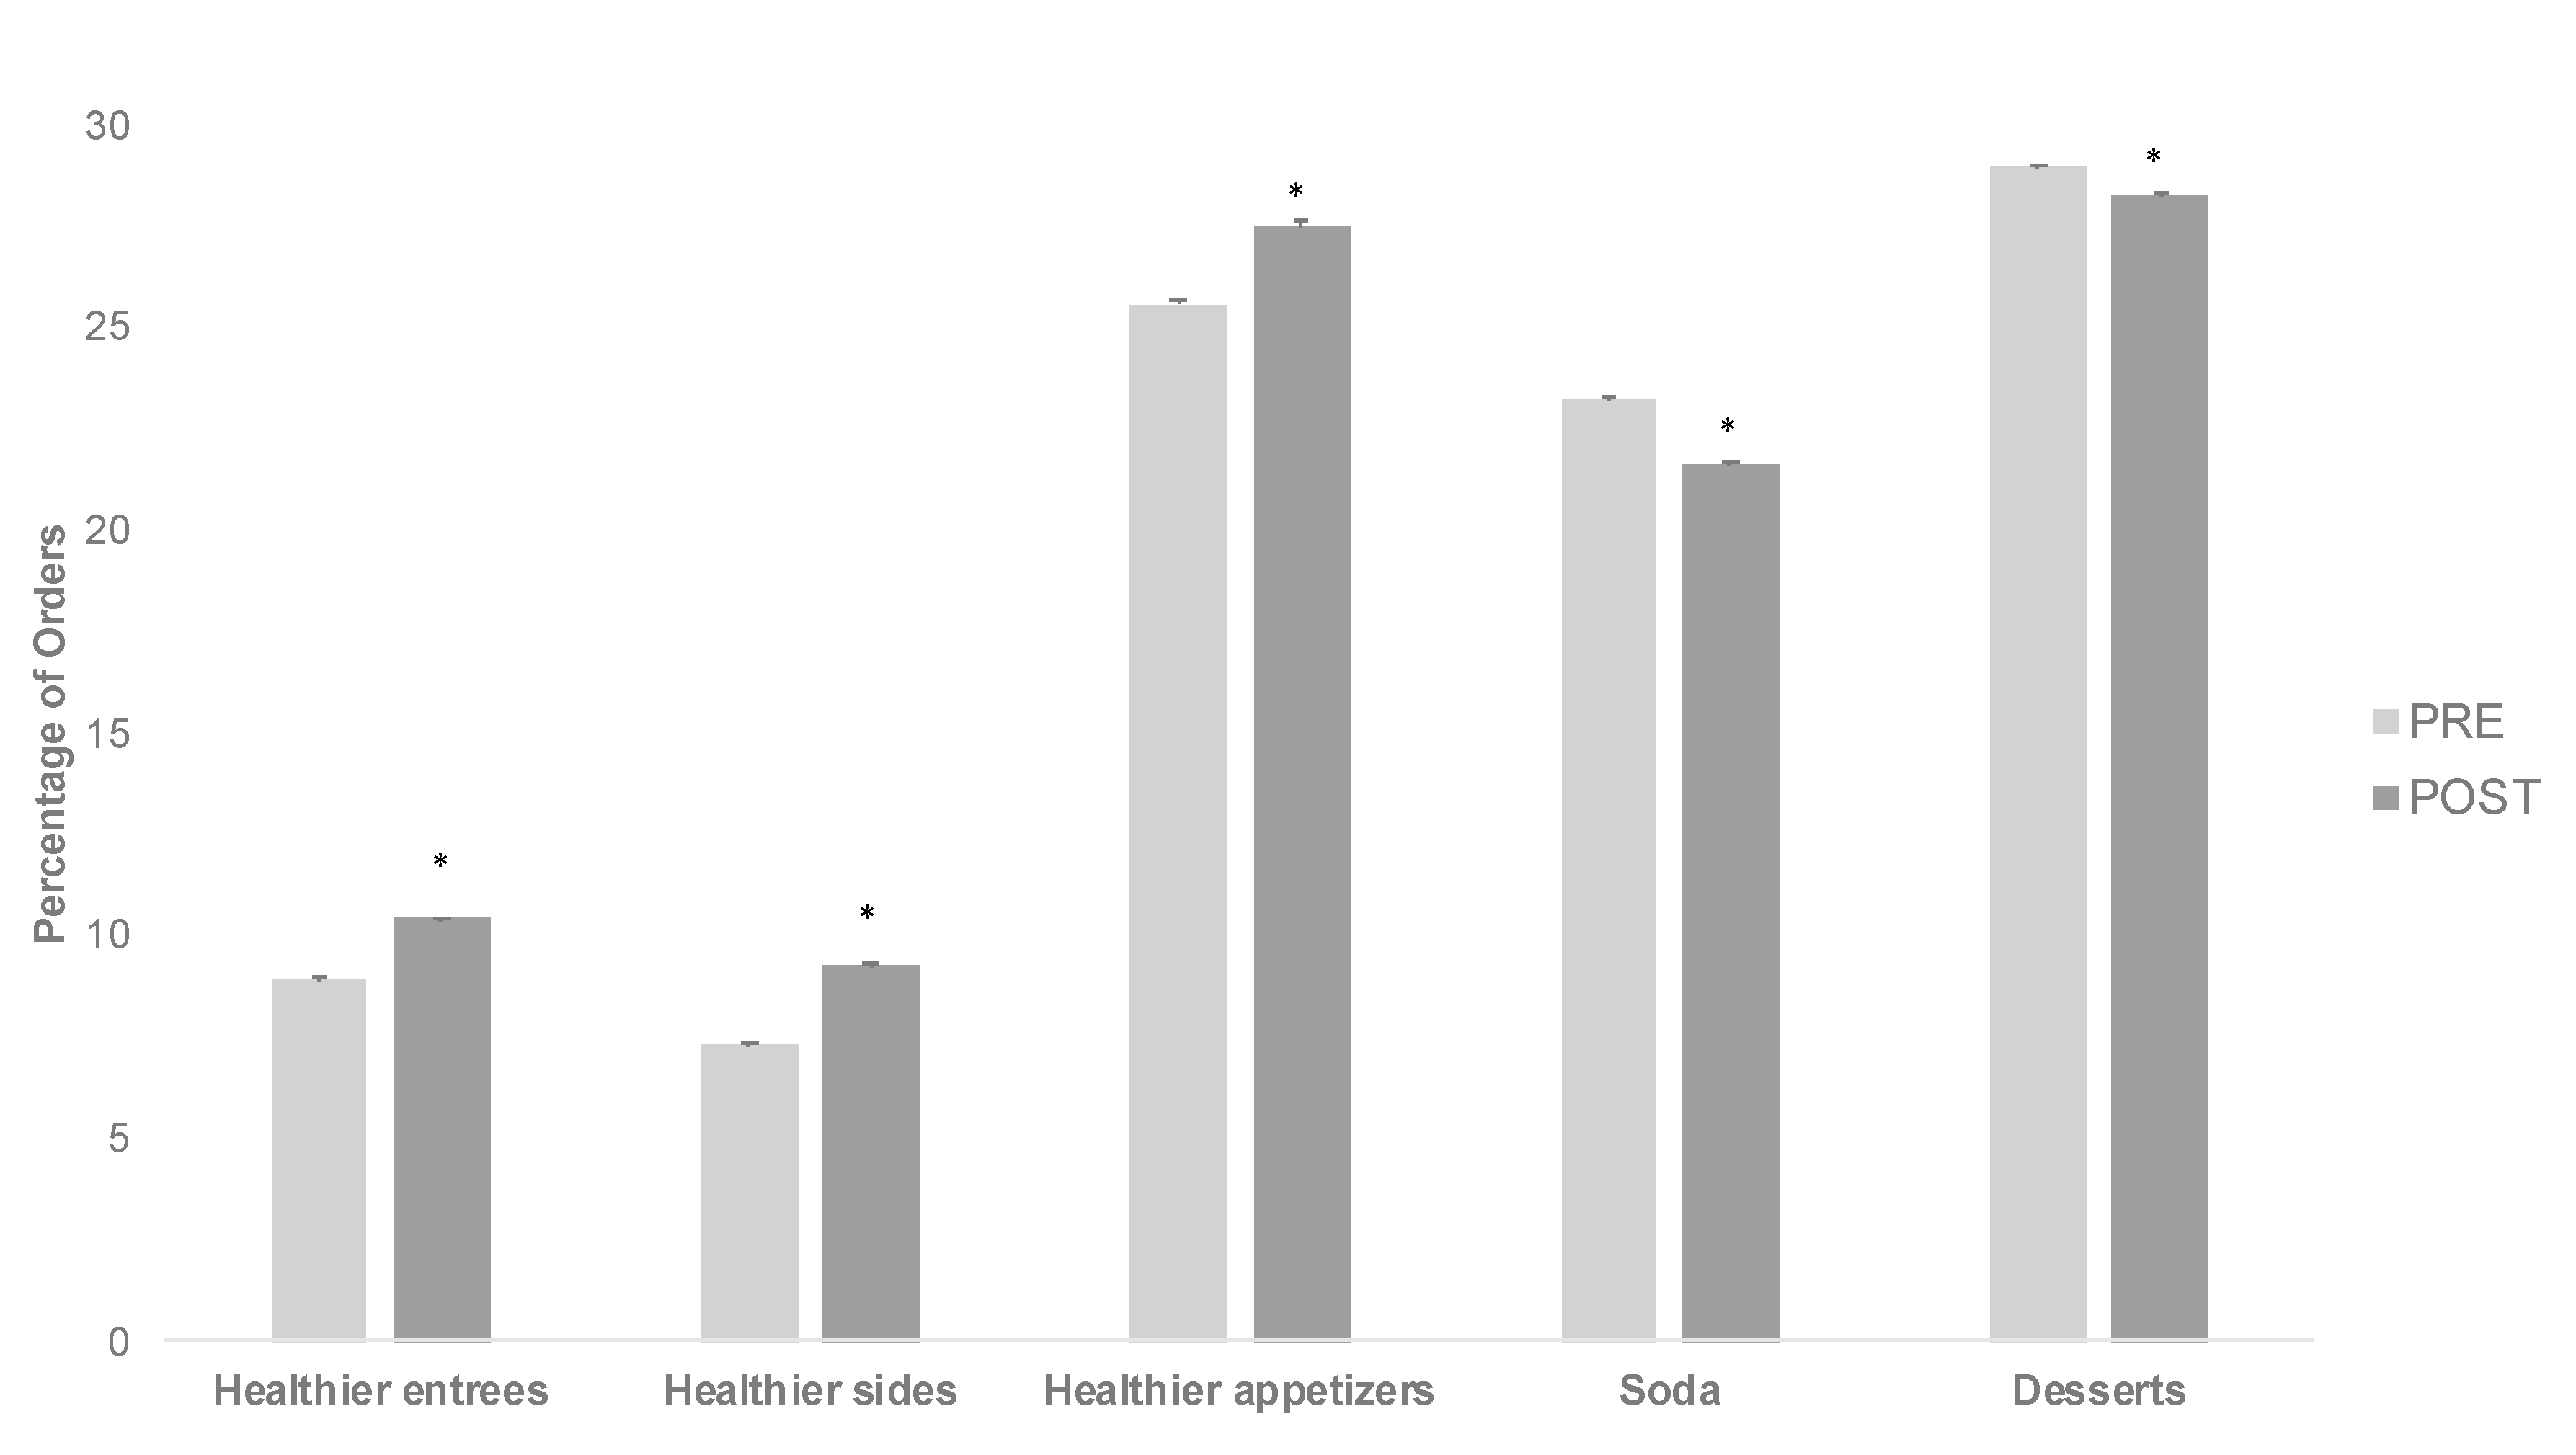
3. Results
4. Discussion
5. Conclusions
Author Contributions
Funding
Acknowledgments
Conflicts of Interest
References
- An, R. Fast-food and full-service restaurant consumption and daily energy and nutrient intakes in US adults. Eur. J. Clin. Nutr. 2016, 70, 97–103. [Google Scholar] [CrossRef] [PubMed]
- Nguyen, B.T.; Powell, L.M. The impact of restaurant consumption among US adults: Effects on energy and nutrient intakes. Public Health Nutr. 2014, 17, 2445–2452. [Google Scholar] [CrossRef] [PubMed]
- Stewart, H.; Blisard, N.; Bhuyan, S.; Nayga, R.M. The Demand for Food Away from Home: Full-Service or Fast Food? Technical Report No. 829; Economic Research Service: Wasington, DC, USA, 2004; pp. 1–20.
- National Restaurant Association. Kids Live Well Program. n.d. Available online: http://www.restaurant.org/Industry-Impact/Food-Healthy-Living/Kids-LiveWell (accessed on 18 January 2015).
- Anzman-Frasca, S.; Mueller, M.P.; Sliwa, S.; Dolan, P.R.; Harelick, L.; Roberts, S.B.; Washburn, K.; Economos, C.D. Changes in children’s meal orders following healthy menu modifications at a regional US restaurant chain. Obesity 2015, 23, 1055–1062. [Google Scholar] [CrossRef] [PubMed]
- Mueller, M.; Anzman-Frasca, S.; Blakeley, C.E.; Folta, S.C.; Wilde, P.; Economos, C.D. Ordering patterns following the implementation of a healthier children’s restaurant menu: A latent class analysis. Obesity 2016, 25, 192–199. [Google Scholar] [CrossRef] [PubMed]
- Anzman-Frasca, S.; Mueller, M.; Lynskey, V.M.; Harelick, L.; Economos, C.D. Orders of healthier children’s items remain high more than two years after menu changes at a regional restaurant chain. Health Aff. 2015, 34, 1885–1892. [Google Scholar] [CrossRef]
- Ayala, G.X.; Castro, I.A.; Pickrel, J.L.; Lin, S.-F.; Williams, C.B.; Madanat, H.; Jun, H.-J.; Zive, M. A cluster randomized trial to promote healthy menu items for children: The kids’ choice restaurant program. Int. J. Environ. Res. Public Health 2017, 14, 1494. [Google Scholar] [CrossRef]
- Peters, J.; Beck, J.; Lande, J.; Pan, Z.; Cardel, M.; Ayoob, K.; Hill, J.O. Using healthy defaults in walt disney world restaurants to improve nutritional choices. J. Assoc. Consum. Res. 2016, 1, 92–103. [Google Scholar] [CrossRef]
- Wansink, B.; Hanks, A.S. Calorie reductions and within-meal calorie compensation in children’s meal combos. Obesity 2013, 22, 630–632. [Google Scholar] [CrossRef] [PubMed]
- Espino, J.N.V.; Guerrero, N.; Rhoads, N.; Simon, N.-J.; Escaron, A.L.; Meinen, A.; Nieto, F.J.; Martinez-Donate, A. Community-based restaurant interventions to promote healthy eating: A systematic review. Prev. Chronic Dis. 2015, 12, E78. [Google Scholar] [CrossRef]
- Fulkerson, J.A.; Neumark-Sztainer, D.; Story, M. Adolescent and parent views of family meals. J. Am. Diet. Assoc. 2006, 106, 526–532. [Google Scholar] [CrossRef]
- McIntosh, A.; Kubena, K.S.; Tolle, G.; Dean, W.; Kim, M.-J.; Jan, J.-S.; Anding, J. Determinants of children’s use of and time spent in fast-food and full-service restaurants. J. Nutr. Educ. Behav. 2011, 43, 142–149. [Google Scholar] [CrossRef] [PubMed]
- Lopez, N.V.; Ayala, G.X.; Corder, K.; Eisenberg, C.M.; Zive, M.M.; Wood, C.; Elder, J.P. Parent support and parent-mediated behaviors are associated with children’s sugary beverage consumption. J. Acad. Nutr. Diet. 2012, 112, 541–547. [Google Scholar] [CrossRef] [PubMed]
- Erinosho, T.O.; Dixon, L.B.; Young, C.; Brotman, L.M.; Hayman, L.L. Caregiver food behaviours are associated with dietary intakes of children outside the child-care setting. Public Health Nutr. 2012, 16, 1263–1272. [Google Scholar] [CrossRef][Green Version]
- Castro, I.A.; Williams, C.B.; Madanat, H.; Pickrel, J.L.; Jun, H.-J.; Zive, M.; Gahagan, S.; Ayala, G.X. Food ordering for children in restaurants: Multiple sources of influence on decision making. Public Health Nutr. 2016, 19, 2404–2409. [Google Scholar] [CrossRef]
- Sleddens, E.F.C.; Kremers, S.P.J.; Stafleu, A.; Dagnelie, P.C.; De Vries, N.K.; Thijs, C. Food parenting practices and child dietary behavior. Prospective relations and the moderating role of general parenting. Appetite 2014, 79, 42–50. [Google Scholar] [CrossRef]
- Pereira, M.A.; I Kartashov, A.; Ebbeling, C.B.; Van Horn, L.; Slattery, M.L.; Jacobs, D.R.; Ludwig, D.S. Fast-food habits, weight gain, and insulin resistance (the CARDIA study): 15-year prospective analysis. Lancet 2005, 365, 36–42. [Google Scholar] [CrossRef]
- Wilcox, S.; Sharpe, P.A.; Turner-McGrievy, G.M.; Granner, M.; Baruth, M. Frequency of consumption at fast-food restaurants is associated with dietary intake in overweight and obese women recruited from financially disadvantaged neighborhoods. Nutr. Res. 2013, 33, 636–646. [Google Scholar] [CrossRef][Green Version]
- Paeratakul, S.; Ferdinand, D.P.; Champagne, C.M.; Ryan, D.H.; Bray, G.A. Fast-food consumption among US adults and children: Dietary and nutrient intake profile. J. Am. Diet. Assoc. 2003, 103, 1332–1338. [Google Scholar] [CrossRef]
- Chandon, P.; Wansink, B. The biasing health halos of fast-food restaurant health claims: Lower calorie estimates and higher side-dish consumption intentions. J. Consum. Res. 2007, 34, 301–314. [Google Scholar] [CrossRef]
- United States Department of Agriculture, Department of Health and Human Services. Dietary Guidelines for Americans, 7th ed.; U.S. Government Printing Office: Washington, DC, USA, 2010.
- Bernabé, E.; Vehkalahti, M.M.; Sheiham, A.; Aromaa, A.; Suominen, A.L. Sugar-sweetened beverages and dental caries in adults: A 4-year prospective study. J. Dent. 2014, 42, 952–958. [Google Scholar] [CrossRef]
- Malik, V.S.; Pan, A.; Willett, W.C.; Hu, F.B. Sugar-sweetened beverages and weight gain in children and adults: A systematic review and meta-analysis. Am. J. Clin. Nutr. 2013, 98, 1084–1102. [Google Scholar] [CrossRef] [PubMed]
- Malik, V.S.; Popkin, B.M.; Bray, G.A.; Després, J.-P.; Willett, W.C.; Hu, F.B. Sugar-sweetened beverages and risk of metabolic syndrome and type 2 diabetes: A meta-analysis. Diabetes Care 2010, 33, 2477–2483. [Google Scholar] [CrossRef] [PubMed]
- Poti, J.M.; Slining, M.M.; Popkin, B.M. Where are kids getting their empty calories? Stores, schools, and fast-food restaurants each played an important role in empty calorie intake among us children during 2009–2010. J. Acad. Nutr. Diet. 2014, 114, 908–917. [Google Scholar] [CrossRef] [PubMed]
- Anzman-Frasca, S.; Folta, S.C.; Glenn, M.E.; Jones-Mueller, A.; Lynskey, V.M.; Patel, A.A.; Tse, L.L.; Lopez, N.V. Healthier children’s meals in restaurants: An exploratory study to inform approaches that are acceptable across stakeholders. J. Nutr. Educ. Behav. 2017, 49, 285–295.e1. [Google Scholar] [CrossRef]
- Liu, J.; Rehm, C.D.; Micha, R.; Mozaffarian, D. Quality of meals consumed by US adults at full-service and fast-food restaurants, 2003–2016: Persistent low quality and widening disparities. J. Nutr. 2020, 15, 873–883. [Google Scholar] [CrossRef] [PubMed]
- Kelso, A. Fad Diets Come and Go, But Restaurants Are Finding Plenty of Success Catering to Health-Conscious Consumers. Forbes Magazine. Available online: https://www.forbes.com/sites/aliciakelso/2019/06/04/restaurants-are-having-some-luck-chasing-health-conscious-consumers/#488f4332132b (accessed on 10 March 2020).
- Ganev, D. Fast Food in the Media-The Rise of the Health-Conscious Consumer. Available online: https://commetric.com/2019/01/04/fast-food-in-the-media-the-rise-of-the-health-conscious-consumer/ (accessed on 10 March 2020).
- Jin, N.; Line, N.D.; Lee, S.-M. The health-conscious restaurant consumer. Int. J. Contemp. Hosp. Manag. 2017, 29, 2103–2120. [Google Scholar] [CrossRef]
- Bleich, S.N.; Soto, M.J.; Dunn, C.G.; Moran, A.J.; Block, J.P. Calorie and nutrient trends in large U.S. chain restaurants, 2012–2018. PLoS ONE 2020, 15, e0228891. [Google Scholar] [CrossRef]
- Bleich, S.N.; Wolfson, J.A.; Jarlenski, M.P. Calorie changes in chain restaurant menu items. Am. J. Prev. Med. 2015, 48, 70–75. [Google Scholar] [CrossRef]
- Bleich, S.N.; Vercammen, K.A.; Koma, J.W.; Li, Z. Trends in beverage consumption among children and adults, 2003–2014. Obesity 2017, 26, 432–441. [Google Scholar] [CrossRef] [PubMed]
- Marriott, B.P.; Hunt, K.J.; Malek, A.M.; Newman, J.C. Trends in intake of energy and total sugar from sugar-sweetened beverages in the US among children and adults, NHANES 2003–2016. Nutrients 2019, 11, 2004. [Google Scholar] [CrossRef]
- Rydell, S.A.; Harnack, L.J.; Oakes, J.M.; Story, M.; Jeffery, R.W.; French, S.A. Why eat at fast-food restaurants: Reported reasons among frequent consumers. J. Am. Diet. Assoc. 2008, 108, 2066–2070. [Google Scholar] [CrossRef] [PubMed]
- Sobal, J.; Bisogni, C.A. Constructing food choice decisions. Ann. Behav. Med. 2009, 38, 37–46. [Google Scholar] [CrossRef] [PubMed]
- Cohen, D.A.; Babey, S. Contextual influences on eating behaviours: Heuristic processing and dietary choices. Obes. Rev. 2012, 13, 766–779. [Google Scholar] [CrossRef]
- Cohen, J.F.; Rimm, E.B.; Davison, K.K.; Cash, S.B.; McInnis, K.; Economos, C.D. The role of parents and children in meal selection and consumption in quick service restaurants. Nutrients 2020, 12, 735. [Google Scholar] [CrossRef]
- Cohen, J.F.W.; Roberts, S.B.; Anzman-Frasca, S.; Gamache, M.M.G.; Lynskey, V.M.; Matthews, E.; Mueller, M.P.; Sharma, S.; Economos, C.D. A pilot and feasibility study to assess children’s consumption in quick-service restaurants using plate waste methodology. BMC Public Health 2017, 17, 259. [Google Scholar] [CrossRef]
- Shonkoff, E.T.; Anzman-Frasca, S.; Lynskey, V.M.; Chan, G.; Glenn, M.E.; Economos, C.D. Child and parent perspectives on healthier side dishes and beverages in restaurant kids’ meals: Results from a national survey in the US. BMC Public Health 2017, 18, 56. [Google Scholar] [CrossRef] [PubMed]
- Anzman-Frasca, S.; Braun, A.; Ehrenberg, S.; Epstein, L.H.; Gampp, A.; Leone, L.A.; Singh, A.; Tauriello, S. Effects of a randomized intervention promoting healthy children’s meals on children’s ordering and dietary intake in a quick-service restaurant. Physiol. Behav. 2018, 192, 109–117. [Google Scholar] [CrossRef]
- Noormohamed, A.; Lee, S.H.; Batorsky, B.; Jackson, A.; Newman, S.; Gittelsohn, J. Factors influencing ordering practices at Baltimore city carryouts: Qualitative research to inform an obesity prevention intervention. Ecol. Food Nutr. 2012, 51, 481–491. [Google Scholar] [CrossRef]
- Schindler-Ruwisch, J.; Kiszko, K.; Abrams, C.; Islam, N.S.; Elbel, B. Environmental and individual factors affecting menu labeling utilization: A qualitative research study. J. Acad. Nutr. Diet. 2013, 113, 667–672. [Google Scholar] [CrossRef]
- Van’t Riet, J.; Sijtsema, S.J.; Dagevos, H.; De Bruijn, G.J. The importance of habits in eating behaviour. An overview and recommendations for future research. Appetite 2011, 57, 585–596. [Google Scholar] [CrossRef]
- Loeb, K.L.; Radnitz, C.; Keller, K.; Schwartz, M.B.; Marcus, S.; Pierson, R.N.; Shannon, M.; DeLaurentis, D. The application of defaults to optimize parents’ health-based choices for children. Appetite 2017, 113, 368–375. [Google Scholar] [CrossRef]
- McCluskey, J.J.; Mittelhammer, R.C.; Asiseh, F. From default to choice: Adding healthy options to kids’ menus. Am. J. Agric. Econ. 2011, 94, 338–343. [Google Scholar] [CrossRef]
- Schwartz, M.B.; Radnitz, C.; Loeb, K.L.; DiMatteo, J.; Keller, K.L.; Zucker, N. Optimal defaults in the prevention of pediatric obesity: From platform to practice. J. Food Nutr. Disord. 2013, 2, 1. [Google Scholar] [CrossRef] [PubMed]
- Mueller, M.; Wilde, P.; Folta, S.C.; Anzman-Frasca, S.; Economos, C.D. Availability of healthier children’s menu items in the top selling quick service restaurant chains (2004–2015). Am. J. Public Health 2019, 109, 267–269. [Google Scholar] [CrossRef] [PubMed]
- Ferrante, M.J.; Johnson, S.; Miller, J.; Moding, K.J.; Bellows, L.L. Does a vegetable-first, optimal default strategy improve children’s vegetable intake? A restaurant-based study. Food Qual. Prefer. 2019, 74, 112–117. [Google Scholar] [CrossRef]
- Roberto, C.A.; Kawachi, I. Use of psychology and behavioral economics to promote healthy eating. Am. J. Prev. Med. 2014, 47, 832–837. [Google Scholar] [CrossRef] [PubMed]
- Henry, H.K.; Borzekowski, D.L. Well, that’s what came with it. A qualitative study of U.S. mothers’ perceptions of healthier default options for children’s meals at fast-food restaurants. Appetite 2015, 87, 108–115. [Google Scholar] [CrossRef] [PubMed]
- Schwartz, M.B.; Just, D.R.; Chriqui, J.F.; Ammerman, A.S. Appetite self-regulation: Environmental and policy influences on eating behaviors. Obesity 2017, 25, S26–S38. [Google Scholar] [CrossRef]
- Ball, K.; Jeffery, R.W.; Abbott, G.; A McNaughton, S.; Crawford, D. Is healthy behavior contagious: Associations of social norms with physical activity and healthy eating. Int. J. Behav. Nutr. Phys. Act. 2010, 7, 86. [Google Scholar] [CrossRef]


| Nutrient | Mean ± SD | % of Entrées Meeting Cut Point |
|---|---|---|
| Calories | 503.60 ± 127.4 | 100 |
| Fat (g) | 17.9 ± 8.5 | 80.0 |
| Cholesterol (mg) | 50.0 ± 40.2 | 92.9 |
| Saturated Fat (g) | 3.1 ± 2.3 | 92.9 |
| Fiber (g) | 7.5 ± 3.6 | 33.3 |
| Item | PRE | POST |
|---|---|---|
| Entrées available on the adult menu | ||
| Total entrées offered (n) | 91 | 89 |
| Entrées offered that were designated as healthier (%) | 12.1 | 12.4 |
| Sides available on the adult menu | ||
| Total sides offered (n) | 30 | 30 |
| Sides offered that were designated as healthier (%) | 16.7 | 16.7 |
| Appetizers available on the adult menu | ||
| Total appetizers offered (n) | 8 | 7 |
| Appetizers offered that were designated as healthier (%) | 25.0 | 28.6 |
| Entrées, sides, and appetizers offered that were designated as healthier options (%) | 14.0 | 14.3 |
| Beverages available on the adult menu | ||
| Total beverages offered (n) | 13 | 14 |
| Desserts available on the adult menu | ||
| Total adult dessert orders (n) | 26 | 27 |
| Item | PRE | POST |
|---|---|---|
| Food items sold (children’s and adults) | 9,515,446 | 9,634,257 |
| Adult entrée orders | ||
| Total adult entrée orders | 1,801,647 | 1,793,582 |
| Total healthier adult entrée orders | 160,948 | 187,229 |
| Breakfast adult entrée orders (%) | 50.5 | 52.3 |
| Most ordered adult entrée items (overall) | ||
| Build your own burger (%) | 7.0 | 6.4 |
| Buttermilk pancake and eggs (%) | 4.6 | 4.9 |
| The American favorite (%) | 4.5 | 4.6 |
| Belgian waffle and eggs (%) | 3.0 | 2.9 |
| Caramel French toast and eggs (%) | 2.4 | 2.5 |
| Most ordered healthier adult entrée items * | ||
| California omelet (%) a | 1.5 | 1.3 |
| Power breakfast (%) a | - | 1.3 |
| Baja fish tacos (%) a | 1.2 | 1.2 |
| Low fat vegetarian omelet (%) a | 1.1 | 1.1 |
| 600 calorie grilled salmon (%) a | 1.1 | 1.0 |
| 600 calorie mango vegetarian stir fry (%) a | 0.9 | - |
| Adult side orders | ||
| Total adult side orders | 2,119,791 | 2,292,409 |
| Total healthier adult side orders | 154,984 | 213,437 |
| Most ordered adult side items (overall) | ||
| Eggs (%) | 15.5 | 19.7 |
| Bacon (%) | 11.2 | 12.1 |
| Toast (%) | 8.2 | 7.5 |
| Sausage (%) | 6.8 | 7.1 |
| Burger (%) | 5.0 | 5.3 |
| French Fries (%) | 4.6 | 6.2 |
| Most ordered healthier adult side items * | ||
| Strawberries (%) a | 1.9 | 5.5 |
| Summer citrus salad (%) a | 0.9 | 0.9 |
| Cholesterol egg free substitutes or egg whites (%) a | 0.2 | 1.7 |
| SD veggie chili (%) a | 0.3 | 0.3 |
| Adult appetizer orders | ||
| Total adult appetizer orders | 83,101 | 68,889 |
| Total healthier adult appetizer orders | 21,229 | 18,934 |
| Most ordered adult appetizer items (overall) * | ||
| Buffalo wings (%) | 16.2 | 17.9 |
| Cheese fries (%) | 16.1 | 18.4 |
| Chicken tenders (%) | 9.6 | 11.6 |
| Most ordered healthier adult appetizer items * | ||
| Black bean quesadilla (%) a | 14.8 | 15.2 |
| Goat cheese bruschetta (%) a | 10.7 | 12.2 |
| Adult beverage orders | ||
| Total adult beverage orders | 1,394,021 | 1,351,398 |
| Most ordered adult beverage items (overall) * | ||
| Coffee (%) b | 31.9 | 33.3 |
| Juice (%) b | 23.6 | 20.3 |
| Soda (%) | 20.1 | 18.5 |
| Tea (%) b | 19.8 | 19.7 |
| Hot chocolate (%) b | 1.9 | 2.1 |
| Adult dessert orders | ||
| Total adult dessert orders | 521,585 | 507,531 |
| Percentage of entrée orders accompanied by a dessert | 29.0 | 28.3 |
Publisher’s Note: MDPI stays neutral with regard to jurisdictional claims in published maps and institutional affiliations. |
© 2020 by the authors. Licensee MDPI, Basel, Switzerland. This article is an open access article distributed under the terms and conditions of the Creative Commons Attribution (CC BY) license (http://creativecommons.org/licenses/by/4.0/).
Share and Cite
Mueller, M.P.; Shonkoff, E.T.; Folta, S.C.; Anzman-Frasca, S.; Economos, C.D. Orders of Healthier Adult Menu Items in a Full-Service Restaurant Chain with a Healthier Children’s Menu. Nutrients 2020, 12, 3253. https://doi.org/10.3390/nu12113253
Mueller MP, Shonkoff ET, Folta SC, Anzman-Frasca S, Economos CD. Orders of Healthier Adult Menu Items in a Full-Service Restaurant Chain with a Healthier Children’s Menu. Nutrients. 2020; 12(11):3253. https://doi.org/10.3390/nu12113253
Chicago/Turabian StyleMueller, Megan P., Eleanor T. Shonkoff, Sara C. Folta, Stephanie Anzman-Frasca, and Christina D. Economos. 2020. "Orders of Healthier Adult Menu Items in a Full-Service Restaurant Chain with a Healthier Children’s Menu" Nutrients 12, no. 11: 3253. https://doi.org/10.3390/nu12113253
APA StyleMueller, M. P., Shonkoff, E. T., Folta, S. C., Anzman-Frasca, S., & Economos, C. D. (2020). Orders of Healthier Adult Menu Items in a Full-Service Restaurant Chain with a Healthier Children’s Menu. Nutrients, 12(11), 3253. https://doi.org/10.3390/nu12113253