Abstract
The objective of this study was to evaluate leptin, ghrelin, and leptin/ghrelin ratio in critically ill patients and association of leptin/ghrelin ratio with outcomes. This is a sub-study of the PermiT trial (ISRCTN68144998). A subset of 72 patients who were expected to stay >14 days in the Intensive care unit were enrolled. Blood samples were collected on days 1, 3, 5, 7, and 14. Samples were analyzed for leptin and active ghrelin in addition to other hormones. Baseline leptin/ghrelin ratio was calculated, and patients were stratified into low and high leptin/ghrelin ratio based on the median value of 236. There was a considerable variation in baseline leptin level: Median 5.22 ng/mL (Q1, Q3: 1.26, 17.60). Ghrelin level was generally low: 10.61 pg/mL (Q1, Q3: 8.62, 25.36). Patients with high leptin/ghrelin ratio compared to patients with low leptin/ghrelin ratio were older, had higher body mass index and more likely to be diabetic. There were no differences in leptin/ghrelin ratio between patients who received permissive underfeeding and standard feeding. Multivariable logistic regression analysis showed that age and body mass index were significant independent predictors of high leptin–ghrelin ratio. Leptin–ghrelin ratio was not associated with 90-day mortality or other outcomes. Age and body mass index are predictors of high leptin/ghrelin ratio. Leptin/ghrelin ratio is not affected by permissive underfeeding and is not associated with mortality.
1. Introduction
Leptin and ghrelin are two orexitropic hormones with opposite effects on energy homeostasis. Leptin is an adipokine that is released by the adipose tissue. It regulates food intake and energy expenditure and suppresses appetite (satiety hormone) by sending signals about the peripheral obesity to the central nervous system [1]. Leptin has other effects on glucose homeostasis, immune response, growth and differentiation and angiogenesis and have been implicated in the pathogenesis of hypertension, atherosclerosis and cancer. During critical illness, leptin levels are high initially and then decrease over time [2,3,4], suggesting that it may play a role in the pathogenesis and/or outcome of disease [5]. On the other hand, ghrelin is secreted in the stomach [6], and is a potent appetite stimulator (hunger hormone). Ghrelin increases during fasting in normal subjects [7], helps in short-term and long-term weight regulation and usually promotes weight gain and adiposity [8]. It has been shown to have cardiovascular and anti-inflammatory effects [9,10,11]. Ghrelin was found to mediate improvement of tissue perfusion in severe sepsis [12], and down-regulation of proinflammatory cytokines in sepsis through activation of the vagus nerve [13]. A study showed that ghrelin levels are reduced in intensive care unit (ICU) patients which seemed to be responsible for suppression of appetite and nutritional intake and gastrointestinal dysfunction including delayed gastric emptying [14].
Feeding dose and composition affects leptin and ghrelin inversely [15]. Energy deficit causes a rapid initial decrease in circulating leptin levels that becomes more marked with progressive loss of body fat [16], and a marked increase in ghrelin. High protein meals increase circulating concentrations of the gut hormones PYY and GLP-1 and decrease ghrelin concentration [17]. An increase in dietary protein from 15% to 30% of energy at a constant carbohydrate intake produces a sustained decrease in ad libitum caloric intake that is probably mediated by increased central nervous system leptin sensitivity and results in significant weight loss [18]. This anorexic effect of protein may contribute to the weight loss produced by low-carbohydrate diets [18]. As there is no consistent relation between both leptin and ghrelin and weight loss and then subsequent weight regain [19], the leptin/ghrelin ratio has been suggested to be a better marker and a predictor of energy restriction treatment success or failure [19]. In one study, higher baseline (week 0) and after treatment (week 8) leptin/ghrelin ratio was associated with an increased risk for weight regain in an 8-week hypocaloric diet program [20]. In a recent study which evaluated the leptin/ghrelin ratio in a fasting state and after the intake of meals with varying macronutrient contents, there was a significant difference in postprandial leptin/ghrelin ratio in normal body weight and overweight/obese men [21].
There is limited information about leptin, ghrelin, and the leptin/ghrelin ratio in critically ill patients and in association with feeding. The objective of this study was to evaluate leptin, ghrelin, and the leptin/ghrelin ratio in critically ill patients and the association of leptin/ghrelin ratio with outcomes.
2. Methods
This is a sub-study of the PermiT (Permissive Underfeeding versus Target Enteral Feeding in Adult Critically Ill Patients, Current Controlled Trials number, ISRCTN68144998) trial in which the critically ill patients were randomized to permissive underfeeding (40–60% of calculated caloric requirements) or standard feeding (70–100%) for up to 14 days while maintaining similar protein intake in both groups [22]. Caloric intake was calculated using the Penn State equation for mechanically ventilated patients with body mass index (BMI) ≤30 and Ireton-Jones equation for those with BMI ≥30. Protein target was maintained uniformly at 1.2 to 1.5 g per kg of body weight per day with additional protein (Resource Beneprotein, Nestle Healthcare, Lausanne, Switzerland) provided as needed. The trial found no difference between the two groups in the primary endpoint of 90-day mortality (relative risk 0.94, 95% confidence interval 0.76, 1.16, p = 0.58). In this sub-study, we enrolled a subset of patients who were expected to stay >14 days in the ICU at King Abdulaziz Medical City-Riyadh and consented for blood sample collection. The sub-study was approved by Institutional Board Review of the Ministry of the National Guard Health Affairs, Riyadh, Saudi Arabia. Blood samples were collected on days 1, 3, 5, 7, and 14. Samples were centrifuged for 20 min and stored at −80°C.
2.1. Laboratory Measurements
Samples were analyzed using Millipore (Merck Mellipore, Darmstadt, Germany) with Luminex 3D platform (Luminex, Austin, TX, USA) for leptin, active ghrelin as well as the following adipokines (adiponectin, monocyte chemotactic protein-1 (MCP-1), resistin, adipsin, and plasminogen activator inhibitor-1 (PAI-1)), pancreatic hormones (amylin, C-peptide, glucagon, pancreatic polypeptide (PP)), gut hormones (gastric inhibitory polypeptide (GIP), glucagon-like peptide (GLP), polypeptide YY), glycoproteins (neutrophil gelatinase associated lipocalin or NGAL (lipocalin-2 NGAL) and selected inflammatory markers (interleukin-1B, interleukin-6, and tumor necrosis factor-α). We did not add serine protease inhibitor to blood samples after collection.
Reported normal leptin levels are median 4.0 (Q1, Q3: 1.7, 7.2) ng/mL [23]. Reported active ghrelin in lean subjects mean 411.8 pg/mL (SD 57.4) and 180.4 pg/mL (SD 18.5) in obese subjects [24]. Baseline leptin and active ghrelin levels were evaluated and the leptin/ghrelin ratio was calculated as leptin in ng/mL multiplied by 103 and divided by ghrelin in pg/mL [20]. The median leptin/ghrelin ratio for this study cohort was 236, which was used as a cut off and the patients with leptin/ghrelin ratio ≤236 were considered to have low leptin/ghrelin ratio and the patients with ratio >236 were considered to have high leptin/ghrelin ratio.
2.2. Data Collection
We collected the baseline data which included demographics, physiological parameters (Acute Physiology and Chronic Health Evaluation Scores (APACHE) II, Sequential Organ Failure Assessment (SOFA) score, the ratio of partial pressure of arterial oxygen to the fraction of inspired oxygen (PaO2:FiO2), Glasgow coma scale and laboratory parameters. The nutritional data were collected for the period of intervention which was 14 days and included the average caloric intake and average protein intake. In addition, data about cointerventions including insulin dose, daily blood glucose and other medications were collected. Mortality outcome at 28, 90, and 180 days was collected. Other outcomes included hospital and ICU mortality, new renal replacement therapy, ICU-associated infections, ICU and hospital length of stay (LOS) and mechanical ventilation duration.
2.3. Statistical Analysis
Categorical variables were reported as frequencies with percentages and continuous variables as medians with quartiles 1 and 3 (Q1, Q3). Categorical variables were compared using chi-square or Fisher’s exact test and continuous variables using Mann–Whitney U test based on non-normality assumption and small sample size. Multivariate regression analysis was carried out to assess the predictors of high leptin/ghrelin ratio adjusting for selected baseline variables of clinical interest (age, BMI, sex, diabetes, sepsis and APACHE II). We also carried out logistic regression models to examine the association between leptin/ghrelin ratio and 90-day mortality adjusting for the same variables. The results were presented as adjusted odds ratio (OR) with 95% confidence interval (CI). To assess whether low leptin/ghrelin ratio compared to high leptin/ghrelin ratio was associated with levels of different hormones and other inflammatory markers over time, we constructed repeated measure mixed linear model. p value of ≤0.05 was considered significant. All statistical analyses were performed using SAS version 9.2 (SAS Institute, Cary, NC, USA).
3. Results
Seventy-two patients were included in this study and their characteristics were described in Table 1 according to the leptin/ghrelin ratio. There was a considerable variation in baseline leptin level; median 5.22 ng/mL (Q1, Q3: 1.26, 17.60), while active ghrelin level was generally low: 10.61 pg/mL (Q1, Q3: 8.62, 25.36). Patients with high leptin/ghrelin ratio were older, obese and more likely to be diabetic. The total daily caloric intake and protein intake was similar in the two groups. However, more patients in the high leptin–ghrelin ratio group were more likely to be on aspirin and statins in comparison to the low leptin–ghrelin ratio group (16 (44.4%) vs. 7 (19.4%), p = 0.02 and 19 (52.8%) vs. 8 (22.2%), p = 0.007), respectively (Table 2).

Table 1.
Baseline characteristics of patients low and high leptin–ghrelin ratio.
Table 2.
Daily caloric intake, protein intake, insulin and glucose data in patients with low and high leptin–ghrelin ratio.
Figure S1 also shows no differences in the serial leptin/ghrelin ratio between the permissive underfeeding and standard feeding groups during the intervention period.
Relationship between Leptin–Ghrelin Ratio and Other Hormones
Figure 1, Figure S2 and Figure S3 describe the results of repeat measure analysis using the mixed linear model of the differences in hormones between the high and low leptin/ghrelin ratio groups. With the exception of glucagon levels, which were lower in the high leptin/ghrelin ratio group over time (p = 0.007), other hormones were not different.
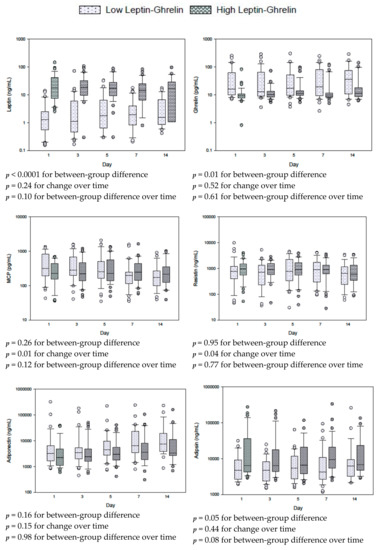
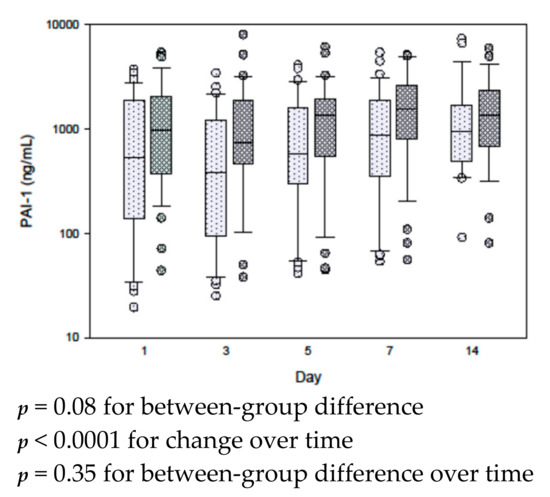
Figure 1.
Serial measurements for leptin, ghrelin and other adipokines in patients with low and high leptin/ghrelin ratio at baseline. The differences between groups, with time and between groups with time (group × time) were tested by repeated measures mixed linear models. Box plots are displayed with medians and quartiles 1 and 3. The error bars refer to 10th and 90th percentiles.
4. Outcomes
There was no significant difference in all-cause 90-day mortality between the two groups. There was also no significant difference in other outcomes including length of stay in the ICU or in the hospital, ventilation duration, ICU-associated infections and new renal replacement therapy between the two groups except ventilator associated pneumonia which was more common in patients with low leptin/ghrelin ratio group in comparison to the high leptin/ghrelin ratio group (14 (38.9%) vs. 8 (22.2%), p = 0.04). Multivariable logistic regression analysis showed no significant association between high leptin/ghrelin ratio and 90-day mortality (adjusted OR: 0.78, 95% CI: 0.18, 3.35; p = 0.73) or any other study outcomes (Table 3).
Table 3.
Outcome data of patients with low and high leptin–ghrelin ratio.
Stepwise multivariable logistic regression analysis showed that age and BMI were independent predictors of high leptin–ghrelin ratio (Age: aOR for each 1-year increase, 1.03 95% CI 1.002, 1.06; p value= 0.04); BMI: aOR for each 1-unit increase 1.22 95% CI, 1.09, 1.37; p = 0.0004) (Table 4).
Table 4.
Predictors of high leptin–ghrelin ratio using stepwise multivariable logistic regression analysis. The following variables were entered in the model: Age, BMI, sex, diabetes, sepsis, and APACHE II.
5. Discussion
In this cohort of critically ill patients, we found large variations in leptin levels while active ghrelin levels were low. The low active ghrelin level in critically ill patients is in line with other previous studies and probably contributes the suppressed appetite and gastroparesis [14,15,16,17,18,19,20,21,22,23,24,25].
In the current study, BMI was the only predictor of the leptin/ghrelin ratio. This finding is consistent with the fact that leptin, which is anorexigenic, is secreted by the adipose tissue and that more leptin is excreted by the obese. Most obese individuals and subjects with a predisposition to regain weight after losing it have higher leptin concentrations than lean individuals [26]. However, appetite is not effectively suppressed in these individuals suggesting leptin resistance [26].
Fasting in healthy subjects usually suppresses leptin and increases ghrelin secretion. Using sensitive radio-immunoassays, a study found that plasma ghrelin and leptin were secreted in pulsatile fashion in rats consuming ad libitum food [27]. Fasting augmented all parameters of ghrelin pulsatile secretion and diminished leptin secretion by selectively attenuating the pulse amplitude [27]. In the TICASOS trial, in which ICU patients were randomized to receive nutrition with an energy target determined either by repeated indirect calorimetry measurements (study group, n = 47) or a weight-based formula (25 Kcal/kg/day; control group, n = 44), there were no significant between-group differences in serum leptin, ghrelin and other adipokines (resistin and adiponectin) on day 1 or day 7 [28]. In the control group, serum ghrelin increased significantly over time (p < 0.05) [28]. For the whole group, a more positive cumulative energy balance and a lower maximal negative energy balance were associated with a significantly smaller increase in serum ghrelin levels (p = 0.008 and p = 0.035, respectively) [28]. Caloric restriction in healthy individuals is expected to be associated with lower leptin/ghrelin ratio. However, in the current study, we found that in critically ill patients the leptin/ghrelin ratio over time was not affected by moderate caloric restriction.
Leptin and ghrelin may have important roles in critical illness. High leptin levels have been observed upon ICU admission, with levels subsequently decreasing [2,3]. In mouse endotoxemia and cecal ligation puncture models of sepsis, elevated levels of leptin and soluble leptin receptor have been observed [5]. Additionally, exogenously administered leptin was associated with increased expression of adhesion and coagulation molecules, macrophage infiltration into the liver and kidney, and endothelial barrier dysfunction increased and with increased mortality [5]. However, in critically ill patients, ghrelin levels are reduced despite low nutritional intake. Plasma ghrelin levels are associated with systemic inflammation, and ghrelin has potent inhibitory effects on proinflammatory cytokines including IL-1β, IL-6, and TNF-α. Intraperitoneal administration of ghrelin (23 μg/kg/d) or saline after a colonic anastomosis was associated with beneficial anti-inflammatory and antioxidant effects [10]. In rats with hemorrhagic shock-induced ALI, exogenous ghrelin was associated with less lung injury and attenuated the inflammatory response [29]. Another study found that exogenous ghrelin attenuated the inflammatory response and mortality after whole body irradiation in rats [30]. In critically ill patients, we did not find mortality difference between the low and high leptin/ghrelin groups. On multivariable logistic regression analysis, leptin/ghrelin ratio was also not associated with 90-day mortality or other outcomes.
The study results should be interpreted in the light of its strengths and limitations. A strength is that data came from a randomized controlled trial and that we measured the levels of a large number of adipokines at multiple time intervals. The limitations include the relatively small sample size, which makes the study underpowered to detect a mortality difference and that the study included patients who were expected to stay in the ICU for ≥14 days, which may affect the generalizability of study results. We did not add serine protease inhibitor to blood samples after collection, which may have resulted in underestimation of ghrelin levels. Because of the sample size, we were unable to perform subgroup analyses.
In conclusion, there is a considerable variation in baseline leptin level in critically ill patients, while active ghrelin level is generally low. Age and BMI are predictors of high leptin/ghrelin ratio. Leptin/ghrelin ratio is not affected by permissive underfeeding and is not associated with mortality.
Supplementary Materials
The following are available online at https://www.mdpi.com/2072-6643/12/1/36/s1, Figure S1: Serial leptin/ghrelin ratio in the permissive underfeeding and standard feeding groups, Figure S2: Serial measurements for gut hormones, pancreatic hormones and glycoprotein- lipocalin-2-NGAL in patients with low and high leptin/ghrelin ratio, Figure S3: Serial measurements for inflammatory markers in patients with low and high leptin/hrelin ratio.
Author Contributions
Y.M.A.: conception, acquisition of data, design, analytical plan, drafting of the manuscript and critical revision of the manuscript for important intellectual content, approval of the final version to be published. D.J.; H.M.A.-D.; W.T.; A.B.; M.S. (Musharaf Sadat); L.A.; M.L.A.; W.M.; M.S. (Maram Sakhija) and A.A.-D.: acquisition of data, and critical revision of the manuscript for important intellectual content, approval of the final version to be published. H.T.: statistical analysis and critical revision of the manuscript for important intellectual content, approval of the final version to be published. All authors have read and agreed to the published version of the manuscript.
Funding
This study is supported by King Abdulaziz City for Science and Technology (KACST), Riyadh, Saudi Arabia under Grant Number—AT 32-25 KACST. In addition, we wish to thank the following those who made valuable suggestions or who have otherwise contributed to the preparation of the manuscript: Adila ElObeid, Turki Almoammar and Muhammad Rafique Sohail.
Conflicts of Interest
The authors declare no conflict of interest.
References
- Davis, J.F.; Choi, D.L.; Benoit, S.C. Insulin, leptin and reward. Trends Endocrinol. Metab. 2010, 21, 68–74. [Google Scholar] [CrossRef]
- Tzanela, M.; Orfanos, S.; Tsirantonaki, M.; Kotanidou, A.; Sotiropoulou, C.H.; Christophoraki, M.; Vassiliadi, D.; Thalassions, N.C.; Roussos, C.H. Leptin alterations in the course of sepsis in humans. In Vivo 2006, 20, 565–570. [Google Scholar] [PubMed]
- Bornstein, S.; Licinio, J.; Tauchnitz, R.; Engelmann, L.; Negrao, A.B.; Gold, P.; Chrousos, G.P. Plasma leptin levels are increased in survivors of acute sepsis: Associated loss of diurnal rhythm in cortisol and leptin secretion. J. Clin. Endocrinol. Metab. 1998, 83, 280–283. [Google Scholar] [CrossRef] [PubMed]
- Nguyen, N.Q.; Fraser, R.J.; Chapman, M.; Bryant, L.K.; Wishart, J.; Holloway, R.H.; Horowitz, M. Fasting and nutrient-stimulated plasma peptide-YY levels are elevated in critical illness and associated with feed intolerance: An observational, controlled study. Crit. Care 2006, 10, R175. [Google Scholar] [CrossRef] [PubMed]
- Shapiro, N.I.; Khankin, E.V.; Van Meurs, M.; Shih, S.C.; Lu, S.; Yano, M.; Castro, P.R.; Maratos-Flier, E.; Parikh, S.M.; Karumanchi, S.A. Leptin exacerbates sepsis-mediated morbidity and mortality. J. Immunol. 2010, 185, 517–524. [Google Scholar] [CrossRef] [PubMed]
- Hall, J.; Roberts, R.; Vora, N. Energy homoeostasis: The roles of adipose tissue-derived hormones, peptide YY and Ghrelin. OBES Facts 2009, 2, 117–125. [Google Scholar] [CrossRef]
- Toshinai, K.; Mondal, M.S.; Nakazato, M.; Date, Y.; Murakami, N.; Kojima, M.; Kangawa, K.; Matsukura, S. Upregulation of ghrelin expression in the stomach upon fasting, insulin-induced hypoglycemia, and leptin administration. Biochem. Biophys. Res. Commun. 2001, 281, 1220–1225. [Google Scholar] [CrossRef]
- Figlewicz, D.P.; Evans, S.B.; Murphy, J.; Hoen, M.; Baskin, D.G. Expression of receptors for insulin and leptin in the ventral tegmental area/substantia nigra (VTA/SN) of the rat. Brain Res. 2003, 964, 107–115. [Google Scholar] [CrossRef]
- Fulton, S.; Pissios, P.; Manchon, R.P.; Stiles, L.; Frank, L.; Pothos, E.N.; Maratos-Flier, E.; Flier, J.S. Leptin regulation of the mesoaccumbens dopamine pathway. Neuron 2006, 51, 811–822. [Google Scholar] [CrossRef]
- Junior, H.F.L.; de Lucca Schiavon, L.; Rodrigues, I.K.; Vieira, D.S.C.; de Paula Martins, R.; Turnes, B.L.; Latini, A.S.; D’Acâmpora, A.J. Effects of Ghrelin on the Oxidative Stress and Healing of the Colonic Anastomosis in Rats. J. Surg. Res. 2019, 234, 167–177. [Google Scholar] [CrossRef]
- Soeki, T.; Kishimoto, I.; Schwenke, D.O.; Tokudome, T.; Horio, T.; Yoshida, M.; Hosoda, H.; Kangawa, K. Ghrelin suppresses cardiac sympathetic activity and prevents early left ventricular remodeling in rats with myocardial infarction. Am. J. Physiol. Heart Circ. Physiol. 2008, 294, H426-32. [Google Scholar] [CrossRef] [PubMed]
- Wu, R.; Dong, W.; Zhou, M.; Cui, X.; Hank Simms, H.; Wang, P. Ghrelin improves tissue perfusion in severe sepsis via downregulation of endothelin-1. Cardiovasc. Res. 2005, 68, 318–326. [Google Scholar] [CrossRef] [PubMed]
- Wu, R.; Dong, W.; Cui, X.; Zhou, M.; Simms, H.H.; Ravikumar, T.S.; Wang, P. Ghrelin down-regulates proinflammatory cytokines in sepsis through activation of the vagus nerve. Ann. Surg. 2007, 245, 480–486. [Google Scholar] [CrossRef] [PubMed]
- Nematy, M.; O’Flynn, J.E.; Wandrag, L.; Brynes, A.E.; Brett, S.J.; Patterson, M.; Ghatei, M.A.; Bloom, S.R.; Frost, G.S. Changes in appetite related gut hormones in intensive care unit patients: A pilot cohort study. Crit. Care 2006, 10, R10. [Google Scholar] [CrossRef]
- Gil-Campos, M.; Aguilera, C.M.; Canete, R.; Gil, A. Ghrelin: A hormone regulating food intake and energy homeostasis. Br. J. Nutr. 2006, 96, 201–226. [Google Scholar] [CrossRef]
- Weigle, D.S.; Duell, P.B.; Connor, W.E.; Steiner, R.A.; Soules, M.R.; Kuijper, J.L. Effect of fasting, refeeding, and dietary fat restriction on plasma leptin levels. J. Clin. Endocrinol. Metab. 1997, 82, 561–565. [Google Scholar] [CrossRef]
- van der Klaauw, A.A.; Keogh, J.M.; Henning, E.; Trowse, V.M.; Dhillo, W.S.; Ghatei, M.A.; Farooqi, I.S. High protein intake stimulates postprandial GLP1 and PYY release. Obesity 2013, 21, 1602–1607. [Google Scholar] [CrossRef]
- Weigle, D.S.; Breen, P.A.; Matthys, C.C.; Callahan, H.S.; Meeuws, K.E.; Burden, V.R.; Purnell, J.Q. A high-protein diet induces sustained reductions in appetite, ad libitum caloric intake, and body weight despite compensatory changes in diurnal plasma leptin and ghrelin concentrations. Am. J. Clin. Nutr 2005, 82, 41–48. [Google Scholar] [CrossRef]
- Labayen, I.; Ortega, F.B.; Ruiz, J.R.; Lasa, A.; Simón, E.; Margareto, J. Role of baseline leptin and ghrelin levels on body weight and fat mass changes after an energy-restricted diet intervention in obese women: Effects on energy metabolism. J. Clin. Endocrinol. Metab. 2011, 96, E996–E1000. [Google Scholar] [CrossRef]
- Crujeiras, A.; Diaz-Lagares, A.; Abete, I.; Goyenechea, E.; Amil, M.; Martínez, J.A.; Casanueva, F.F. Pre-treatment circulating leptin/ghrelin ratio as a non-invasive marker to identify patients likely to regain the lost weight after an energy restriction treatment. J. Endocrinol. Investig. 2014, 37, 119–126. [Google Scholar] [CrossRef]
- Adamska-Patruno, E.; Ostrowska, L.; Goscik, J.; Pietraszewska, B.; Kretowski, A.; Gorska, M. The relationship between the leptin/ghrelin ratio and meals with various macronutrient contents in men with different nutritional status: A randomized crossover study. Nutr. J. 2018, 17, 118. [Google Scholar] [CrossRef] [PubMed]
- Arabi, Y.M.; Aldawood, A.S.; Haddad, S.H.; Al-Dorzi, H.M.; Tamim, H.M.; Jones, G.; Mehta, S.; McIntyre, L.; Solaiman, O.; Sakkijha, M.H.; et al. Permissive Underfeeding or Standard Enteral Feeding in Critically Ill Adults. N. Engl. J. Med. 2015, 372, 2398–2408. [Google Scholar] [CrossRef] [PubMed]
- Roper, J.; Francois, F.; Shue, P.L.; Mourad, M.S.; Pei, Z.; Olivares de Perez, A.Z.; Perez-Perez, G.I.; Tseng, C.-H.; Blaser, M.J. Leptin and ghrelin in relation to Helicobacter pylori status in adult males. J. Clin. Endocrinol. Metab. 2008, 93, 2350–2357. [Google Scholar] [CrossRef] [PubMed]
- Marzullo, P.; Verti, B.; Savia, G.; Walker, G.E.; Guzzaloni, G.; Tagliaferri, M.; Di Blasio, A.; Liuzzi, A. The relationship between active ghrelin levels and human obesity involves alterations in resting energy expenditure. J. Clin. Endocrinol. Metab. 2004, 89, 936–939. [Google Scholar] [CrossRef]
- Santacruz, C.A.; Quintairos, A.; Righy, C.; Crippa, I.A.; Couto, L.; Imbault, V.; Wasineeart, M.; De Ryckere, M.; Preiser, J.C. Is There a Role for Enterohormones in the Gastroparesis of Critically Ill Patients? Crit. Care Med. 2017, 45, 1696–1701. [Google Scholar] [CrossRef]
- Crujeiras, A.B.; Carreira, M.C.; Cabia, B.; Andrade, S.; Amil, M.; Casanueva, F.F. Leptin resistance in obesity: An epigenetic landscape. Life Sci. 2015, 140, 57–63. [Google Scholar] [CrossRef]
- Bagnasco, M.; Kalra, P.S.; Kalra, S.P. Ghrelin and leptin pulse discharge in fed and fasted rats. Endocrinology 2002, 143, 726–729. [Google Scholar] [CrossRef]
- Singer, P.; Anbar, R.; Cohen, J.; Silva, V.; Singer, J. The effect of continuous nutritional support on adipokine and ghrelin levels in critically ill patients. Nut. Ther. Metab. 2014, 32, 24. [Google Scholar] [CrossRef]
- Zhang, L.-N.; Gong, W.-D.; Luo, J.; Yu, Y.J.; Qi, S.H.; Yue, Z.Y. Exogenous ghrelin ameliorates acute lung injury by modulating the nuclear factor κB inhibitor kinase/nuclear factor κB inhibitor/nuclear factor κB pathway after hemorrhagic shock. Int. Immunopharmacol. 2019, 69, 95–102. [Google Scholar] [CrossRef]
- Wang, Z.; Yang, W.L.; Jacob, A.; Aziz, M.; Wang, P. Human ghrelin mitigates intestinal injury and mortality after whole body irradiation in rats. PLoS ONE 2015, 10, e0118213. [Google Scholar] [CrossRef]
© 2019 by the authors. Licensee MDPI, Basel, Switzerland. This article is an open access article distributed under the terms and conditions of the Creative Commons Attribution (CC BY) license (http://creativecommons.org/licenses/by/4.0/).