Lipids, Lipoprotein Distribution and Nutritional Parameters over the Ramadan Period in Hemodialysis Patients

 ,
,  , ,
, , 
Abstract
1. Introduction
2. Methods
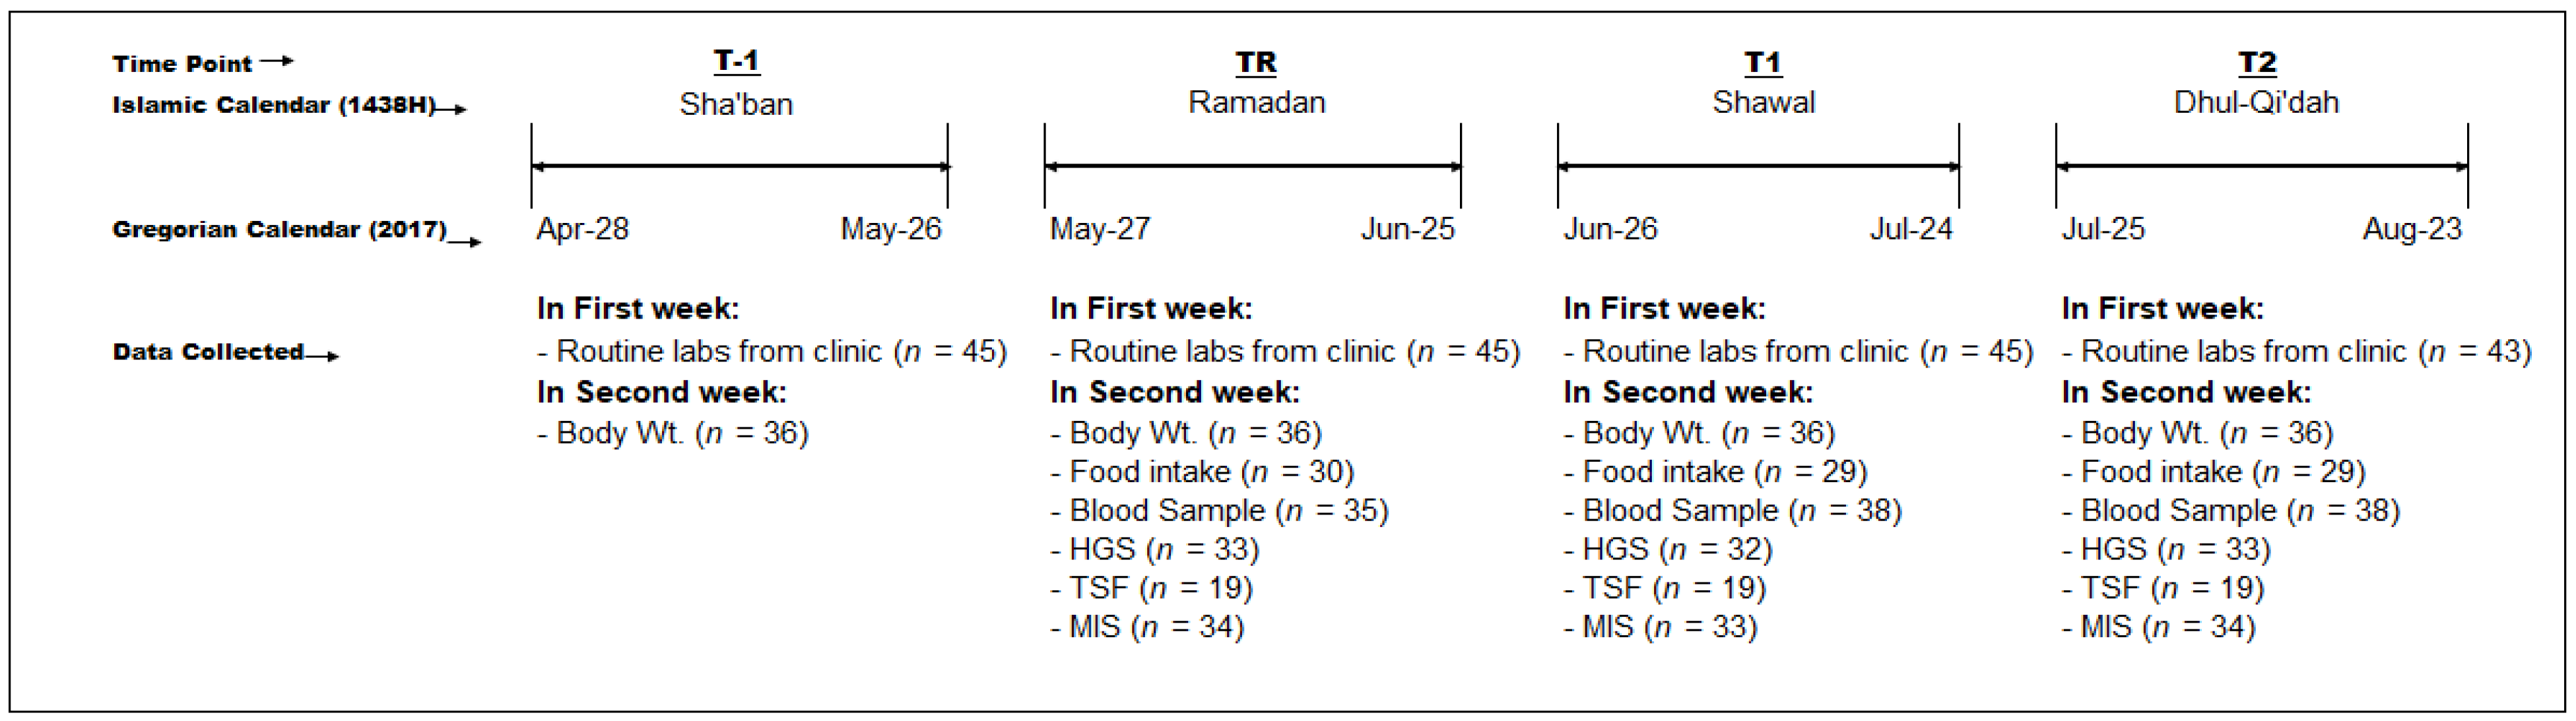
2.1. Study Design and Subjects
2.2. Sociodemographic and Health Data
2.3. Anthropometric Assessment
2.4. Nutritional Assessment
2.5. Malnutrition-Inflammation Score
2.6. Blood Sampling and Lipid Measurements
2.7. Statistical Analyses
3. Results
4. Discussion
5. Limitation of Our Study
Supplementary Materials
Author Contributions
Funding
Acknowledgments
Conflicts of Interest
References
- Al-Khader, A.A.; Al-Hasani, M.K.; Dhar, J.M.; Al-Sulaiman, M. Effect of diet during Ramadan on patients on chronic haemodialysis. Saudi Med. J. 1991, 12, 30–31. [Google Scholar]
- Angel, J.F.; Schwartz, N.E. Metabolic changes resulting from decreased meal frequency in adult male Muslims during the Ramadan fast. Nutr. Rep. Int. 1975. [Google Scholar]
- Azizi, F. Research in Islamic fasting and health. Ann. Saudi Med. 2002, 22, 186–191. [Google Scholar] [CrossRef] [PubMed]
- Bakhotmah, B.A. The puzzle of self-reported weight gain in a month of fasting (Ramadan) among a cohort of Saudi families in Jeddah, Western Saudi Arabia. Nutr. J. 2011, 10, 84. [Google Scholar] [CrossRef] [PubMed]
- Lessan, N.; Saadane, I.; Alkaf, B.; Hambly, C.; Buckley, A.J.; Finer, N.; Speakman, J.R.; Barakat, M.T. The effects of Ramadan fasting on activity and energy expenditure. Am. J. Clin. Nutr. 2018, 107, 54–61. [Google Scholar] [CrossRef] [PubMed]
- Reiches, M.W.; Moore, S.E.; Prentice, A.M.; Ellison, P.T. Endocrine responses, weight change, and energy sparing mechanisms during Ramadan among Gambian adolescent women. Am. J. Hum. Biol. 2014, 26, 395–400. [Google Scholar] [CrossRef]
- Imtiaz, S.; Salman, B.; Dhrolia, M.F.; Nasir, K.; Abbas, H.N.; Ahmadl, A. Clinical and Biochemical Parameters of Hemodialysis Patients Before and During Islamic Month of Ramadan. Iran. J. Kidney Dis. 2016, 10, 75–78. [Google Scholar] [PubMed]
- Al Wakeel, J.S. Kidney function and metabolic profile of chronic kidney disease and hemodialysis patients during Ramadan fasting. Iran. J. Kidney Dis. 2014, 8, 321–328. [Google Scholar]
- Bakhit, A.A.; Kurdi, A.M.; Wadera, J.J.; Alsuwaida, A.O. Effects of Ramadan fasting on moderate to severe chronic kidney disease. A prospective observational study. Saudi Med. J. 2017, 38, 48–52. [Google Scholar] [CrossRef]
- El-Wakil, H.S.; Desoky, I.; Lotfy, N.; Adam, A.G. Fasting the month of Ramadan by Muslims: Could it be injurious to their kidneys? Saudi J. Kidney Dis. Transplant. 2007, 18, 349. [Google Scholar]
- Bernieh, B.; Al Hakim, M.R.; Boobes, Y.; Abu Zidan, F.M. Fasting Ramadan in chronic kidney disease patients: Clinical and biochemical effects. Saudi J. Kidney Dis. Transpl. 2010, 21, 898–902. [Google Scholar] [PubMed]
- Trepanowski, J.F.; Bloomer, R.J. The impact of religious fasting on human health. Nutr. J. 2010, 9, 57. [Google Scholar] [CrossRef] [PubMed]
- Cheah, S.H.; Ch’ng, S.L.; Husain, R.; Duncan, M.T. Effects of fasting during Ramadan on urinary excretion in Malaysian Muslims. Br. J. Nutr. 1990, 63, 329–337. [Google Scholar] [CrossRef] [PubMed]
- Fakhrzadeh, H.; Larijani, B.; Sanjari, M.; Baradar-Jalili, R.; Amini, M.R. Effect of Ramadan fasting on clinical and biochemical parameters in healthy adults. Ann. Saudi Med. 2003, 23, 223–226. [Google Scholar] [CrossRef] [PubMed]
- Nachvak, S.M.; Pasdar, Y.; Pirsaheb, S.; Darbandi, M.; Niazi, P.; Mostafai, R.; Speakman, J.R. Effects of Ramadan on food intake, glucose homeostasis, lipid profiles and body composition composition. Eur. J. Clin. Nutr. 2019, 73, 594–600. [Google Scholar] [CrossRef] [PubMed]
- Kul, S.; Savaş, E.; Öztürk, Z.; Karadağ, G. Does Ramadan fasting alter body weight and blood lipids and fasting blood glucose in a healthy population? A meta-analysis. J. Relig. Health 2014, 53, 929–942. [Google Scholar] [CrossRef]
- Boobes, Y.; Bernieh, B.; Al Hakim, M.R. Fasting Ramadan in kidney transplant patients is safe. Saudi J. Kidney Dis. Transpl. 2009, 20, 198–200. [Google Scholar] [PubMed]
- Qurashi, S.; Tamimi, A.; Jaradat, M.; Al Sayyari, A. Effect of fasting for Ramadan on kidney graft function during the hottest month of the year (August) in Riyadh, Saudi Arabia. Exp. Clin. Transplant. 2012, 10, 551–553. [Google Scholar] [CrossRef]
- Qureshi, A.R.; Alvestrand, A.; Divino, J.C.; Gutierrez, A.; Heimburger, O.; Lindholm, B.; Bergstrom, J. Inflammation, malnutrition, and cardiac disease as predictors of mortality in hemodialysis patients. J. Am. Soc. Nephrol. 2002, 13, S28–S36. [Google Scholar]
- Block, G.A.; Klassen, P.S.; Lazarus, J.M.; Ofsthun, N.; Lowrie, E.G.; Chertow, G.M. Mineral metabolism, mortality, and morbidity in maintenance hemodialysis. J. Am. Soc. Nephrol. 2004, 15, 2208–2218. [Google Scholar] [CrossRef]
- Zimmermann, J.; Herrlinger, S.; Pruy, A.; Metzger, T.; Wanner, C. Inflammation enhances cardiovascular risk and mortality in hemodialysis patients. Kidney Int. 1999, 55, 648–658. [Google Scholar] [CrossRef] [PubMed]
- Wanner, C.; Tonelli, M. KDIGO Clinical Practice Guideline for Lipid Management in CKD: Summary of recommendation statements and clinical approach to the patient. Kidney Int. 2014, 85, 1303–1309. [Google Scholar] [CrossRef] [PubMed]
- Alharbi, K.; Enrione, E.B. Malnutrition is prevalent among hemodialysis patients in Jeddah, Saudi Arabia. Saudi J. Kidney Dis. Transplant. 2012, 23, 598. [Google Scholar]
- Daud, Z.A.; Tubie, B.; Sheyman, M.; Osia, R.; Adams, J.; Tubie, S.; Khosla, P. Vitamin E tocotrienol supplementation improves lipid profiles in chronic hemodialysis patients. Vasc. Health Risk Manag. 2013, 9, 747–761. [Google Scholar] [PubMed]
- Bessell, E.; Jose, M.D.; McKercher, C. Associations of fish oil and vitamin B and E supplementation with cardiovascular outcomes and mortality in people receiving haemodialysis: A review. BMC Nephrol. 2015, 16, 143. [Google Scholar] [CrossRef] [PubMed]
- El-Soadaa, S.S.; Abdelhafez, A.M.; Zahran, S.S. Nutritional Assessment of Patients under Hemodialysis in King Faisal Hospital in Makkah, Saudi Arabia. J. Am. 2013, 6, 9. [Google Scholar]
- Al-Saran, K.A.; Elsayed, S.A.; Molhem, A.J.; AlDrees, A.S.; AlZara, H.M. Nutritional assessment of patients in a large Saudi dialysis center. Saudi Med. J. 2009, 30, 1054–1059. [Google Scholar] [PubMed]
- Alshamsi, S.; Binsaleh, F.; Hejaili, F.; Karkar, A.; Moussa, D.; Raza, H.; Parbat, P.; Al Suwida, A.; Alobaili, S.; AlSehli, R.; et al. Changes in biochemical, hemodynamic, and dialysis adherence parameters in hemodialysis patients during Ramadan. Hemodial. Int. 2016, 20, 270–276. [Google Scholar] [CrossRef]
- Adanan, N.I.H.; Ali, M.S.M.; Lim, J.H.; Zakaria, N.F.; Thiam, C.S.L.; Yahya, R.; Gafor, A.H.A.; Karupaih, T.; Daud, Z.A. Investigating Physical and Nutritional changes during Prolonged Intermittent Fasting in Hemodialysis Patients: A Prospective Cohort Study. J. Renal. Nutr. 2019, 29. [Google Scholar] [CrossRef]
- Wan Md Adnan, W.A.; Zaharan, N.L.; Wong, M.H.; Lim, S.K. The effects of intermittent fasting during the month of Ramadan in chronic haemodialysis patients in a tropical climate country. PLoS ONE 2014, 9, e114262. [Google Scholar] [CrossRef]
- Ongsara, S.; Boonpol, S.; Prompalad, N.; Jeenduang, N. The Effect of Ramadan Fasting on Biochemical Parameters in Healthy Thai Subjects. J. Clin. Diagn Res. 2017, 11, BC14–BC18. [Google Scholar] [CrossRef] [PubMed]
- Dikensoy, E.; Balat, O.; Cebesoy, B.; Ozkur, A.; Cicek, H.; Can, G. The effect of Ramadan fasting on maternal serum lipids, cortisol levels and fetal development. Arch. Gynecol. Obstet. 2009, 279, 119–123. [Google Scholar] [CrossRef] [PubMed]
- Garrow, J.S.; Webster, J. Quetelet’s index (W/H2) as a measure of fatness. Int. J. Obes. 1985, 9, 147–153. [Google Scholar] [PubMed]
- Heymsfield, S.B.; McManus, C.; Smith, J.; Stevens, V.; Nixon, D.W. Anthropometric measurement of muscle mass: Revised equations for calculating bone-free arm muscle area. Am. J. Clin. Nutr. 1982, 36, 680–690. [Google Scholar] [CrossRef] [PubMed]
- Delanaye, P.; Quinonez, K.; Buckinx, F.; Krzesinski, J.; Bruyère, O. Hand grip strength measurement in haemodialysis patients: Before or after the session? Clin. Kidney J. 2017, 11, 555–558. [Google Scholar] [CrossRef] [PubMed]
- Black, A.E. The sensitivity and specificity of the Goldberg cut-off for EI:BMR for identifying diet reports of poor validity. Eur. J. Clin. Nutr. 2000, 54, 395–404. [Google Scholar] [CrossRef]
- Lamine, F.; Bouguerra, R.; Jabrane, J.; Marrakchi, Z.; Ben Rayana, M.C.; Ben Slama, C.; Gaigi, S. Food intake and high density lipoprotein cholesterol levels changes during ramadan fasting in healthy young subjects. Tunis Med. 2006, 84, 647–650. [Google Scholar]
- Harris, J.A.; Benedict, F.G. A Biometric Study of Basal Metabolism in Man; Carnegie institution of Washington: Washington, DC, USA, 1919. [Google Scholar]
- Goldberg, G.R.; Black, A.E. Assessment of the validity of reported energy intakes-review and recent developments. Näringsforskning 1998, 42, 6–9. [Google Scholar] [CrossRef]
- National Kidney Foundation Kidney Disease Outcomes Quality Initiative: Clinical practice guidelines for nutrition in chronic renal failure. Am. J. Kidney Dis. 2000, 35, S1–S140.
- Kalantar-Zadeh, K.; Kleiner, M.; Dunne, E.; Lee, G.H.; Luft, F.C. A modified quantitative subjective global assessment of nutrition for dialysis patients. Nephrol. Dial. Transplant. 1999, 14, 1732–1738. [Google Scholar] [CrossRef]
- Nordestgaard, B.G.; Langsted, A.; Mora, S.; Kolovou, G.; Baum, H.; Bruckert, E.; Watts, G.F.; Sypniewska, G.; Wiklund, O.; Borén, J. Fasting is not routinely required for determination of a lipid profile: Clinical and laboratory implications including flagging at desirable concentration cut-points—A joint consensus statement from the European Atherosclerosis Society and European Federation of Clinical Chemistry and Laboratory Medicine. Eur. Heart J. 2016, 37, 1944–1958. [Google Scholar] [PubMed]
- BaHammam, A. Assessment of sleep patterns, daytime sleepiness, and chronotype during Ramadan in fasting and nonfasting individuals. Saudi Med. J. 2005, 26, 616–622. [Google Scholar] [PubMed]
- Rambod, M.; Bross, R.; Zitterkoph, J.; Benner, D.; Pithia, J.; Colman, S.; Kovesdy, C.P.; Kopple, J.D.; Kalantar-Zadeh, K. Association of Malnutrition-Inflammation Score with quality of life and mortality in hemodialysis patients: A 5-year prospective cohort study. Am. J. Kidney Dis. 2009, 53, 298–309. [Google Scholar] [CrossRef] [PubMed]
- Alabed, H.; Abuzayan, K.; Waterhouse, J. Changes in Subjective and Objective Measures of Performance in Ramadan. Int. Sci. Index 2013, 7, 412–421. [Google Scholar]
- Hwang, S.H.; Lee, D.H.; Min, J.; Jeon, J.Y. Handgrip Strength as a Predictor of All-Cause Mortality in Patients With Chronic Kidney Disease Undergoing Dialysis: A Meta-Analysis of Prospective Cohort Studies. J. Ren. Nutr. 2019. [Google Scholar] [CrossRef] [PubMed]
- Gharbi, M.; Akrout, M.; Zouari, B. Food intake during and outside Ramadan. East. Mediterr. Health J. 2003, 9, 131–140. [Google Scholar] [PubMed]
- Morilla, R.G.; Rodrigo, J.R.; Caravaca, A.S.; Gutierrez, C.V.; Villaverde, G.R.; Moreno, B.A.P. Dietary Modifications, Engaged in Young Muslims of Ramadan Fasting. Nutr. Hosp. 2009, 24, 738–743. [Google Scholar]
- Varady, K.A.; Bhutani, S.; Klempel, M.C.; Kroeger, C.M. Comparison of effects of diet versus exercise weight loss regimens on LDL and HDL particle size in obese adults. Lipids Health Dis. 2011, 10, 119. [Google Scholar]
- Varady, K.A.; Bhutani, S.; Klempel, M.C.; Lamarche, B. Improvements in LDL particle size and distribution by short-term alternate day modified fasting in obese adults. Br. J. Nutr. 2011, 105, 580–583. [Google Scholar] [CrossRef]
- Varady, K.A.; Bhutani, S.; Klempel, M.C.; Kroeger, C.M.; Trepanowski, J.F.; Haus, J.M.; Hoddy, K.K.; Calvo, Y. Alternate day fasting for weight loss in normal weight and overweight subjects: A randomized controlled trial. Nutr. J. 2013, 12, 146. [Google Scholar] [CrossRef]
- Bhutani, S.; Klempel, M.C.; Kroeger, C.M.; Trepanowski, J.F.; Varady, K.A. Alternate day fasting and endurance exercise combine to reduce body weight and favorably alter plasma lipids in obese humans. Obesity (Silver Spring) 2013, 21, 1370–1379. [Google Scholar] [CrossRef] [PubMed]
- Hoddy, K.; Kroeger, C.; Trepanowski, J.; Barnosky, A.; Bhutani, S.; Varady, K.A. Meal timing during alternate day fasting: Impact on body weight and cardiovascular disease risk in obese adults. Obesity 2014, 22, 2524–2531. [Google Scholar]
- Moradi, H.; Streja, E.; Kashyap, M.L.; Vaziri, N.D.; Fonarow, G.C.; Kalantar-Zadeh, K. Elevated high-density lipoprotein cholesterol and cardiovascular mortality in maintenance hemodialysis patients. Nephrol. Dial. Transplant. 2014, 29, 1554–1562. [Google Scholar] [CrossRef] [PubMed]
- Chang, T.I.; Streja, E.; Soohoo, M.; Kim, T.W.; Rhee, C.M.; Kovesdy, C.P.; Kashyap, M.L.; Vaziri, N.D.; Kalantar-Zadeh, K.; Moradi, H. Association of Serum Triglyceride to HDL Cholesterol Ratio with All-Cause and Cardiovascular Mortality in Incident Hemodialysis Patients. Clin. J. Am. Soc. Nephrol. 2017, 12, 591–602. [Google Scholar] [CrossRef] [PubMed]
- Chang, T.I.; Streja, E.; Ko, G.J.; Naderi, N.; Rhee, C.M.; Kovesdy, C.P.; Kashyap, M.L.; Vaziri, N.D.; Kalantar-Zadeh, K.; Moradi, H. Inverse Association Between Serum Non–High-Density Lipoprotein Cholesterol Levels and Mortality in Patients Undergoing Incident Hemodialysis. J. Am. Heart Assoc. 2018, 7, e009096. [Google Scholar] [CrossRef]


| Demographic Characteristics | |
| Age (years) | 50 ± 17 |
| Gender (males, %) | 22 (49%) |
| Nationality (Saudis, %) | 18 (40%) |
| Marital Status | |
| Single/Married/Divorced | 29%/69%/2% |
| Education | |
| Elementary/Middle/High schools | 11%/11%/11% |
| College/None | 35.5%/31.1% |
| Employed (Yes) | 9 (20%) |
| No People in Home | |
| <3; 3–5; >5 | 27%/47%/27% |
| Clinical Characteristics | |
| Dialysis Session Duration (hours) | 3.22 ± 0.12 |
| Dialysis Frequency | |
| 3 days/week | 44/45 (97.8%) |
| Dialysis Vintage (months) | 78 ± 61 |
| Vascular Access | |
| Catheter/Fistula/Graft | 40%/51%/9% |
| Cause | |
| DM/HTN/SLE/Others | 27%/49%/7%/17% |
| Comorbidities | |
| DM/Sec. HPTH/Hep. C/Smokers | 36%/33%/2% |
| Smokers | 5 (11%) |
| Time | Pre-Ramadan (T-1) | Ramadan (TR) | 1 month post -Ramadan (T1) | 2 month post-Ramadan (T2) |
|---|---|---|---|---|
| Albumin (g/dL) | 3.0 ± 0.38 (45)ab | 3.2 ± 0.33 (45)ac | 3.2 ± 0.40 (45)bd | 3.1 ± 0.49 (43)cd |
| Potassium (mEq/L) | 5.0 ± 1.5 (45)a | 4.7 ± 0.91 (45)b | 4.9 ± 90 (45) | 5.0 ± 0.91 (43)ab |
| TIBC (mg/dL) | 219 ± 58 (39)a | 181 ±33 (40)ab | 235 ± 72 (17) | 211 ± 74 (42)b |
| BUN Pre-D (mg/dL) | 47.5 ± 15 (45)a | 51.9 ± 13 (45) | 53.7 ± 13 (45)a | 51.3 ± 15 (43) |
| BUN Post-D (mg/dL) | 15.4 ± 6.3 (40)abc | 18.0 ± 6.4 (41)a | 18.8 ± 7.9 (41)b | 18.9 ± 9.7 (41)c |
| Creatinine (mg/dL) | 9.2 ± 3.0 (44)abc | 9.9 ± 3.0 (44)a | 10.5 ± 3.3 (44)b | 10.1 ± 3.4 (42)c |
| Sodium (mEq/L) | 135.0 ± 3 (45)ab | 133.7 ± 3 (45)ac | 136.1 ± 5 (45) | 136.8 ± 3 (43)bc |
| Time | Ramadan (TR) | 1 month post-Ramadan (T1) | 2 months post-Ramadan (T2) |
|---|---|---|---|
| TAG (mg/dL) | 143 ± 104 (34) | 139 ± 90 (38)a | 162 ± 106 (37)a |
| TC (mg/dL) | 169 ± 55 (35)a | 173 ± 40 (38)b | 184 ± 48 (38)ab |
| HDL-C (mg/dL) | 36 ± 10 (35)ab | 30 ± 10 (38)ac | 40 ± 14 (38)bc |
| LDL-C (mg/dL) | 104 ± 45 (34)a | 115 ± 32 (38) | 114 ± 39 (37)a |
| TC/HDL-C | 5.24 ± 2.70 (35)a | 6.30 ± 2.48 (38)ab | 5.29 ± 2.51 (38)b |
| LDL-C/HDL-C | 3.24 ± 1.98 (34)a | 4.22 ± 1.84 (38)ab | 3.30 ± 1.79 (37)b |
| TAG/HDL-C | 4.84 ± 4.61 (34) | 5.38 ± 4.66 (38) | 5.29 ± 5.09 (37) |
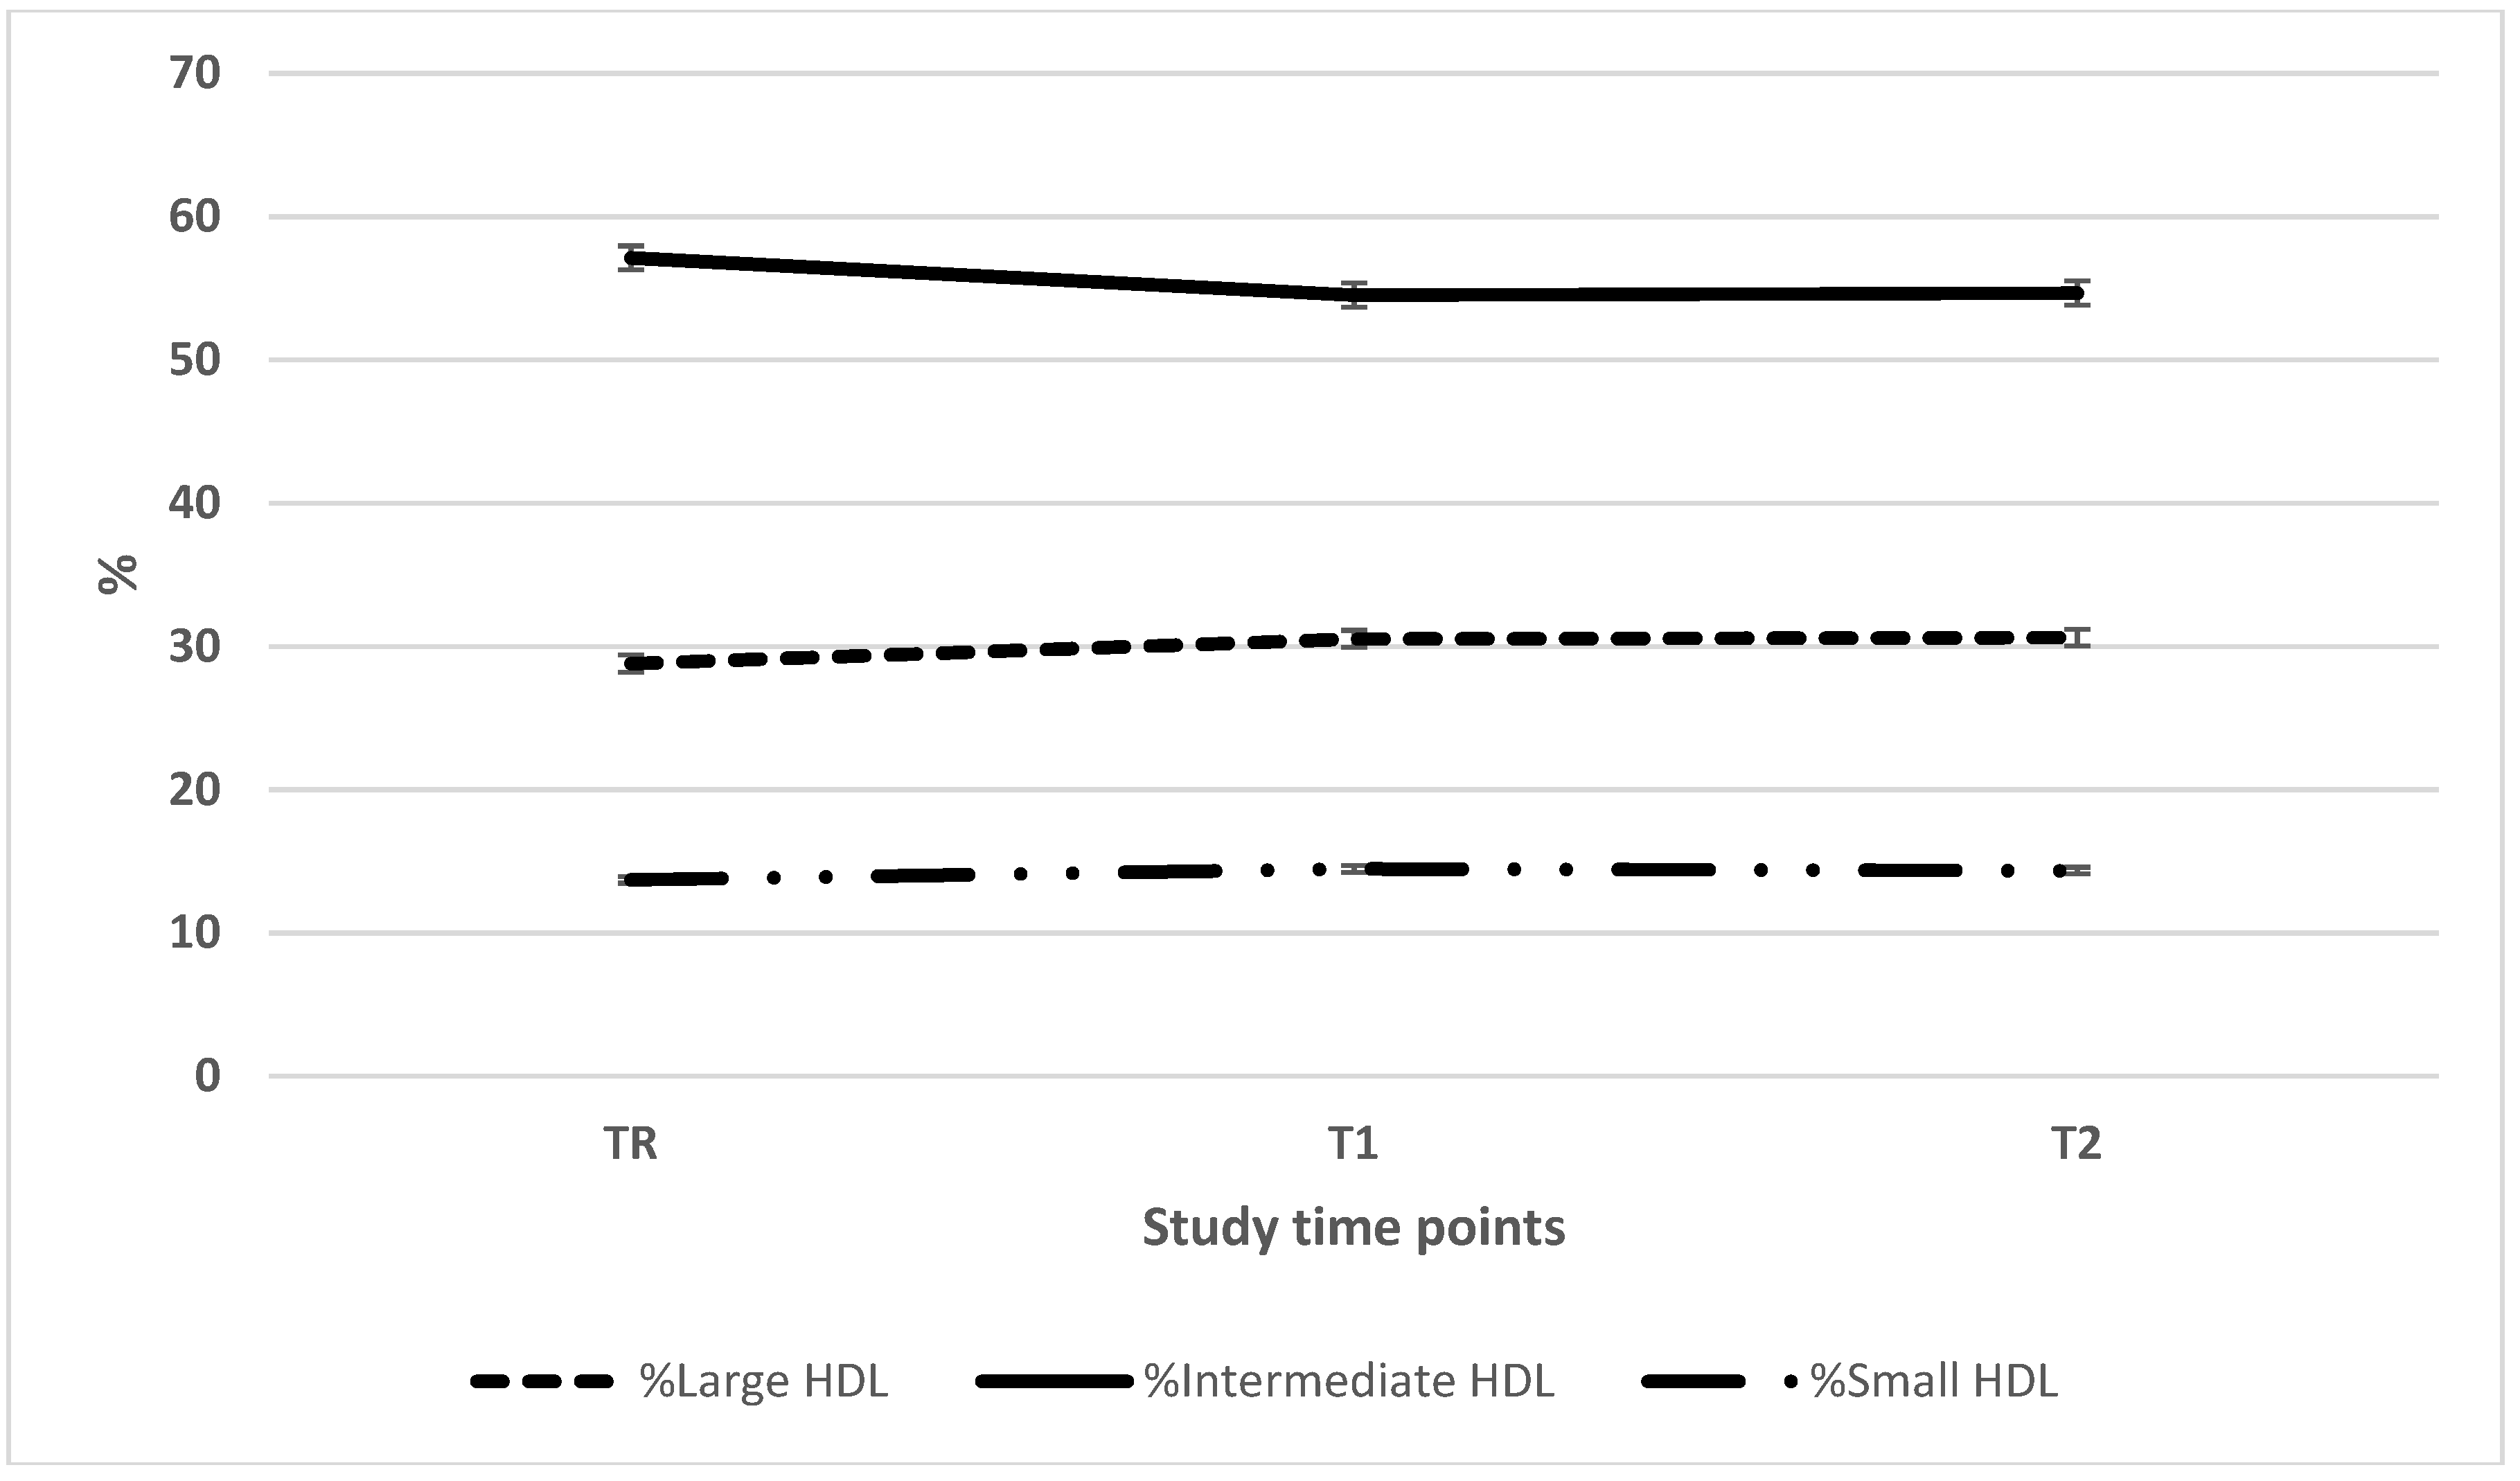
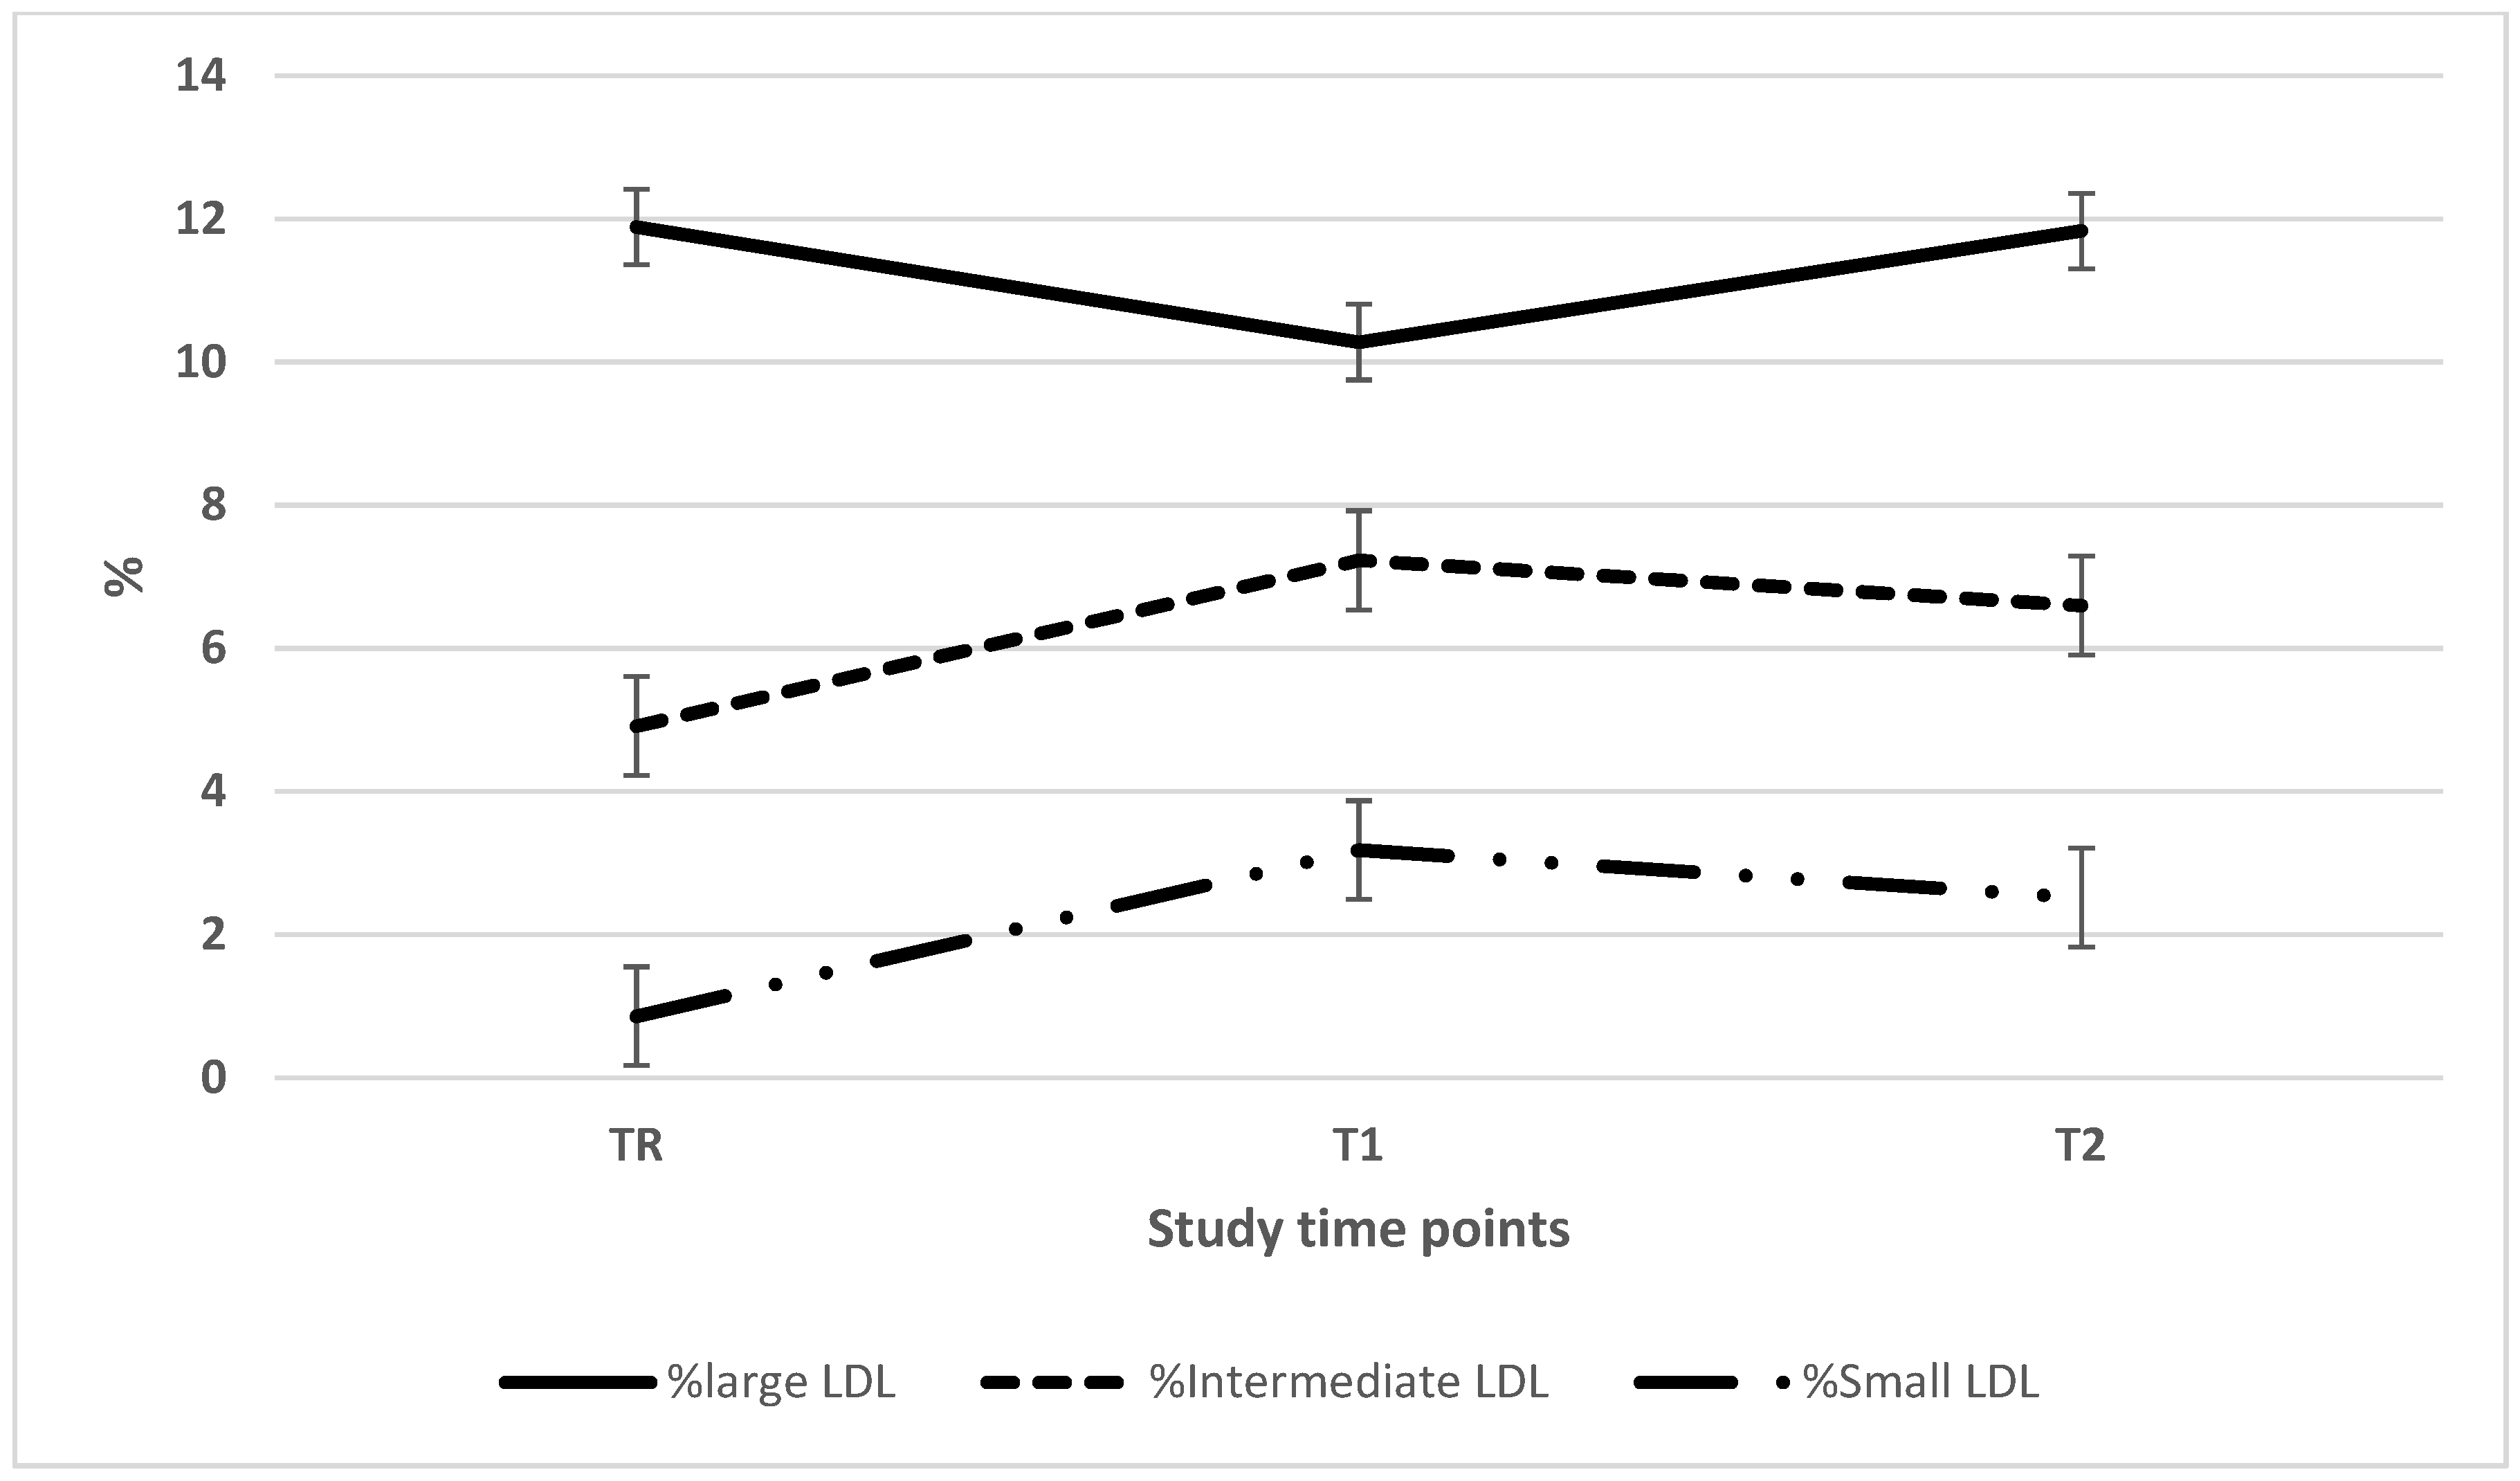
| Time | Ramadan (TR) | 1 month post-Ramadan (T1) | 2 months post-Ramadan (T2) |
|---|---|---|---|
| Large HDL (mg/dL) | 11.2 ± 7.1 (35)a | 10.1 ± 7.0 (38)b | 13.8 ± 9.7 (38)ab |
| Intermediate HDL (mg/dL) | 19.7 ± 4.4 (35)ab | 16.0 ± 4.6 (38)ac | 21.3 ± 6.7 (38)bc |
| Small HDL (mg/dL) | 4.2 ± 2.0 (35)a | 4.0 ± 2.2 (38)b | 4.9 ± 2.4 (38)ab |
| Large LDL (mg/dL) | 21.0 ± 13.3 (35) | 18.3 ± 8.7 (38)a | 23.5 ± 13.0 (37)a |
| Intermediate LDL (mg/dL) | 9.0 ± 8.5 (35)ab | 12.9 ± 9.0 (38)a | 13.6 ± 10.0 (37)b |
| Small LDL (mg/dL) | 1.8 ± 3.0 (35)ab | 6.0 ± 9.3 (38)a | 5.3 ± 9.0 (37)b |
| Mean LDL size (Å) | 272.4 ± 4.2 (35)ab | 268.2 ± 6.7 (38)a | 268.9 ± 7.4 (37)b |
| Time | Pre-Ramadan (T-1) | Ramadan (TR) | 1 month post-Ramadan (T1) | 2 months post-Ramadan (T2) |
|---|---|---|---|---|
| BMI | 24.0 ± 6.16 (35) | 23.9 ± 6.42 (35) | 23.9 ± 6.33 (35) | 23.8 ± 6.36 (35) |
| Pre-D Wt. (kg) | 63.5 ± 17 (36) | 63.1 ± 17 (36) | 63.3 ± 18 (36) | 63.0 ± 17 (36) |
| Post-D Wt. | 61.1 ± 17 (36) | 60.7 ± 17 (36) | 60.8 ± 17 (36) | 60.6 ± 17 (36) |
| HGS (kg) | No data | 19 ± 7.1 (33) | 19 ± 6.8 (32) | 19.0 ± 7.9 (33) |
| Mean TSF (mm) | No data | 16.8 ± 10.8 (19)ab | 20.5 ± 9.9 (19)a | 21.1 ± 10.1 (19)b |
| MAMC (cm) | No data | 21.4 ± 5.6 (19) | 22 ± 5.1 (19) | 22.2 ± 5.2 (19) |
| cAMA | No data | 30.8 ± 22 (19) | 32.8 ± 22 (19) | 33.3 ± 22 (19) |
| MIS total scores£ | No data | 11 ± 4 (34)ab | 10 ± 4 (33)ac | 10 ± 4 (34)bc |
| All Subjects | Acceptable reporters | ||||||
|---|---|---|---|---|---|---|---|
| Ramadan (TR) | 1 month post-Ramadan (T1) | 2 months post-Ramadan (T2) | Ramadan (TR) | 1 month post-Ramadan (T1) | 2 months post-Ramadan (T2) | ||
| Energy | Total kcal | 1805 ± 736(30)ab | 1256 ± 287 (29)a | 1284 ± 421 (29)b | 2139 ± 709 (24)ab | 1767 ± 331 (21)a | 1755 ± 424 (21)b |
| kcal/kg IBW | 32 ± 14 (30)ab | 22 ± 7.6 (29)a | 23 ± 8.9 (29)b | 33 ± 12 (24)ab | 27 ± 6 (21)a | 27 ± 5 (21)b | |
| Protein | Total g | 60 ± 24 (30)ab | 42 ± 10 (29)a | 45 ± 15 (29)b | 69 ± 24 (24)ab | 56 ± 22 (21)a | 60 ± 23 (21)b |
| g/kg IBW | 1.1 ± 0.5 (30)ab | 0.7 ± 0.2 (29)a | 0.8 ± 0.3 (29)b | 1.1 ± 0.4 (24)ab | 0.8 ± 0.3 (21)a | 0.9 ± 0.03 (21)b | |
| Carbohydrate | Total g | 214 ± 86 (30)ab | 170 ± 46 (29)a | 165 ± 55 (29)b | 248 ± 99 (24) | 239 ± 73 (21) | 221 ± 70 (21) |
| Fat | Total g | 79 ± 41 (30)ab | 48 ± 15 (29)a | 52 ± 21 (29)b | 97 ± 38 (24)ab | 68 ± 24 (21)a | 73 ± 25 (21)b |
| Potassium | Total mg | 1405 ± 766 (30)a | 1187 ± 753 (29)b | 953 ± 434 (29)ab | 1552 ± 846 (24)a | 1495 ± 892 (21) | 1088 ± 406 (21)a |
| Phosphate | mg/kg IBW | 9.3 ± 4.6 (30) | 9.05 ± 2.6 (21) | 8.9 ± 4.0 (29) | 10.5 ± 5.9 (24) | 9.3 ± 6.2 (21) | 9.7 ± 6.3 (21) |
© 2019 by the authors. Licensee MDPI, Basel, Switzerland. This article is an open access article distributed under the terms and conditions of the Creative Commons Attribution (CC BY) license (http://creativecommons.org/licenses/by/4.0/).
Share and Cite
Tashkandi, B.; Kaur, D.; Latifi, E.; Tallman, D.A.; Chinna, K.; Daud, Z.A.M.; Karupaiah, T.; Alhozali, H.; Khosla, P. Lipids, Lipoprotein Distribution and Nutritional Parameters over the Ramadan Period in Hemodialysis Patients. Nutrients 2019, 11, 2225. https://doi.org/10.3390/nu11092225
Tashkandi B, Kaur D, Latifi E, Tallman DA, Chinna K, Daud ZAM, Karupaiah T, Alhozali H, Khosla P. Lipids, Lipoprotein Distribution and Nutritional Parameters over the Ramadan Period in Hemodialysis Patients. Nutrients. 2019; 11(9):2225. https://doi.org/10.3390/nu11092225
Chicago/Turabian StyleTashkandi, Bayan, Deepinder Kaur, Eno Latifi, Dina A. Tallman, Karuthan Chinna, Zulfitri Azuan Mat Daud, Tilakavati Karupaiah, Hanadi Alhozali, and Pramod Khosla. 2019. "Lipids, Lipoprotein Distribution and Nutritional Parameters over the Ramadan Period in Hemodialysis Patients" Nutrients 11, no. 9: 2225. https://doi.org/10.3390/nu11092225
APA StyleTashkandi, B., Kaur, D., Latifi, E., Tallman, D. A., Chinna, K., Daud, Z. A. M., Karupaiah, T., Alhozali, H., & Khosla, P. (2019). Lipids, Lipoprotein Distribution and Nutritional Parameters over the Ramadan Period in Hemodialysis Patients. Nutrients, 11(9), 2225. https://doi.org/10.3390/nu11092225