Obesity and Risk of Peptic Ulcer Disease: A Large-Scale Health Check-Up Cohort Study


 ,
,
Abstract
:1. Introduction
2. Materials and Methods
2.1. Study Population and Design
2.2. Assessment of Obesity and MHO
2.3. Assessment of EGD for PUD
2.4. Assessment of Covariates
2.5. Statistical Analysis
3. Results
Baseline Characteristics
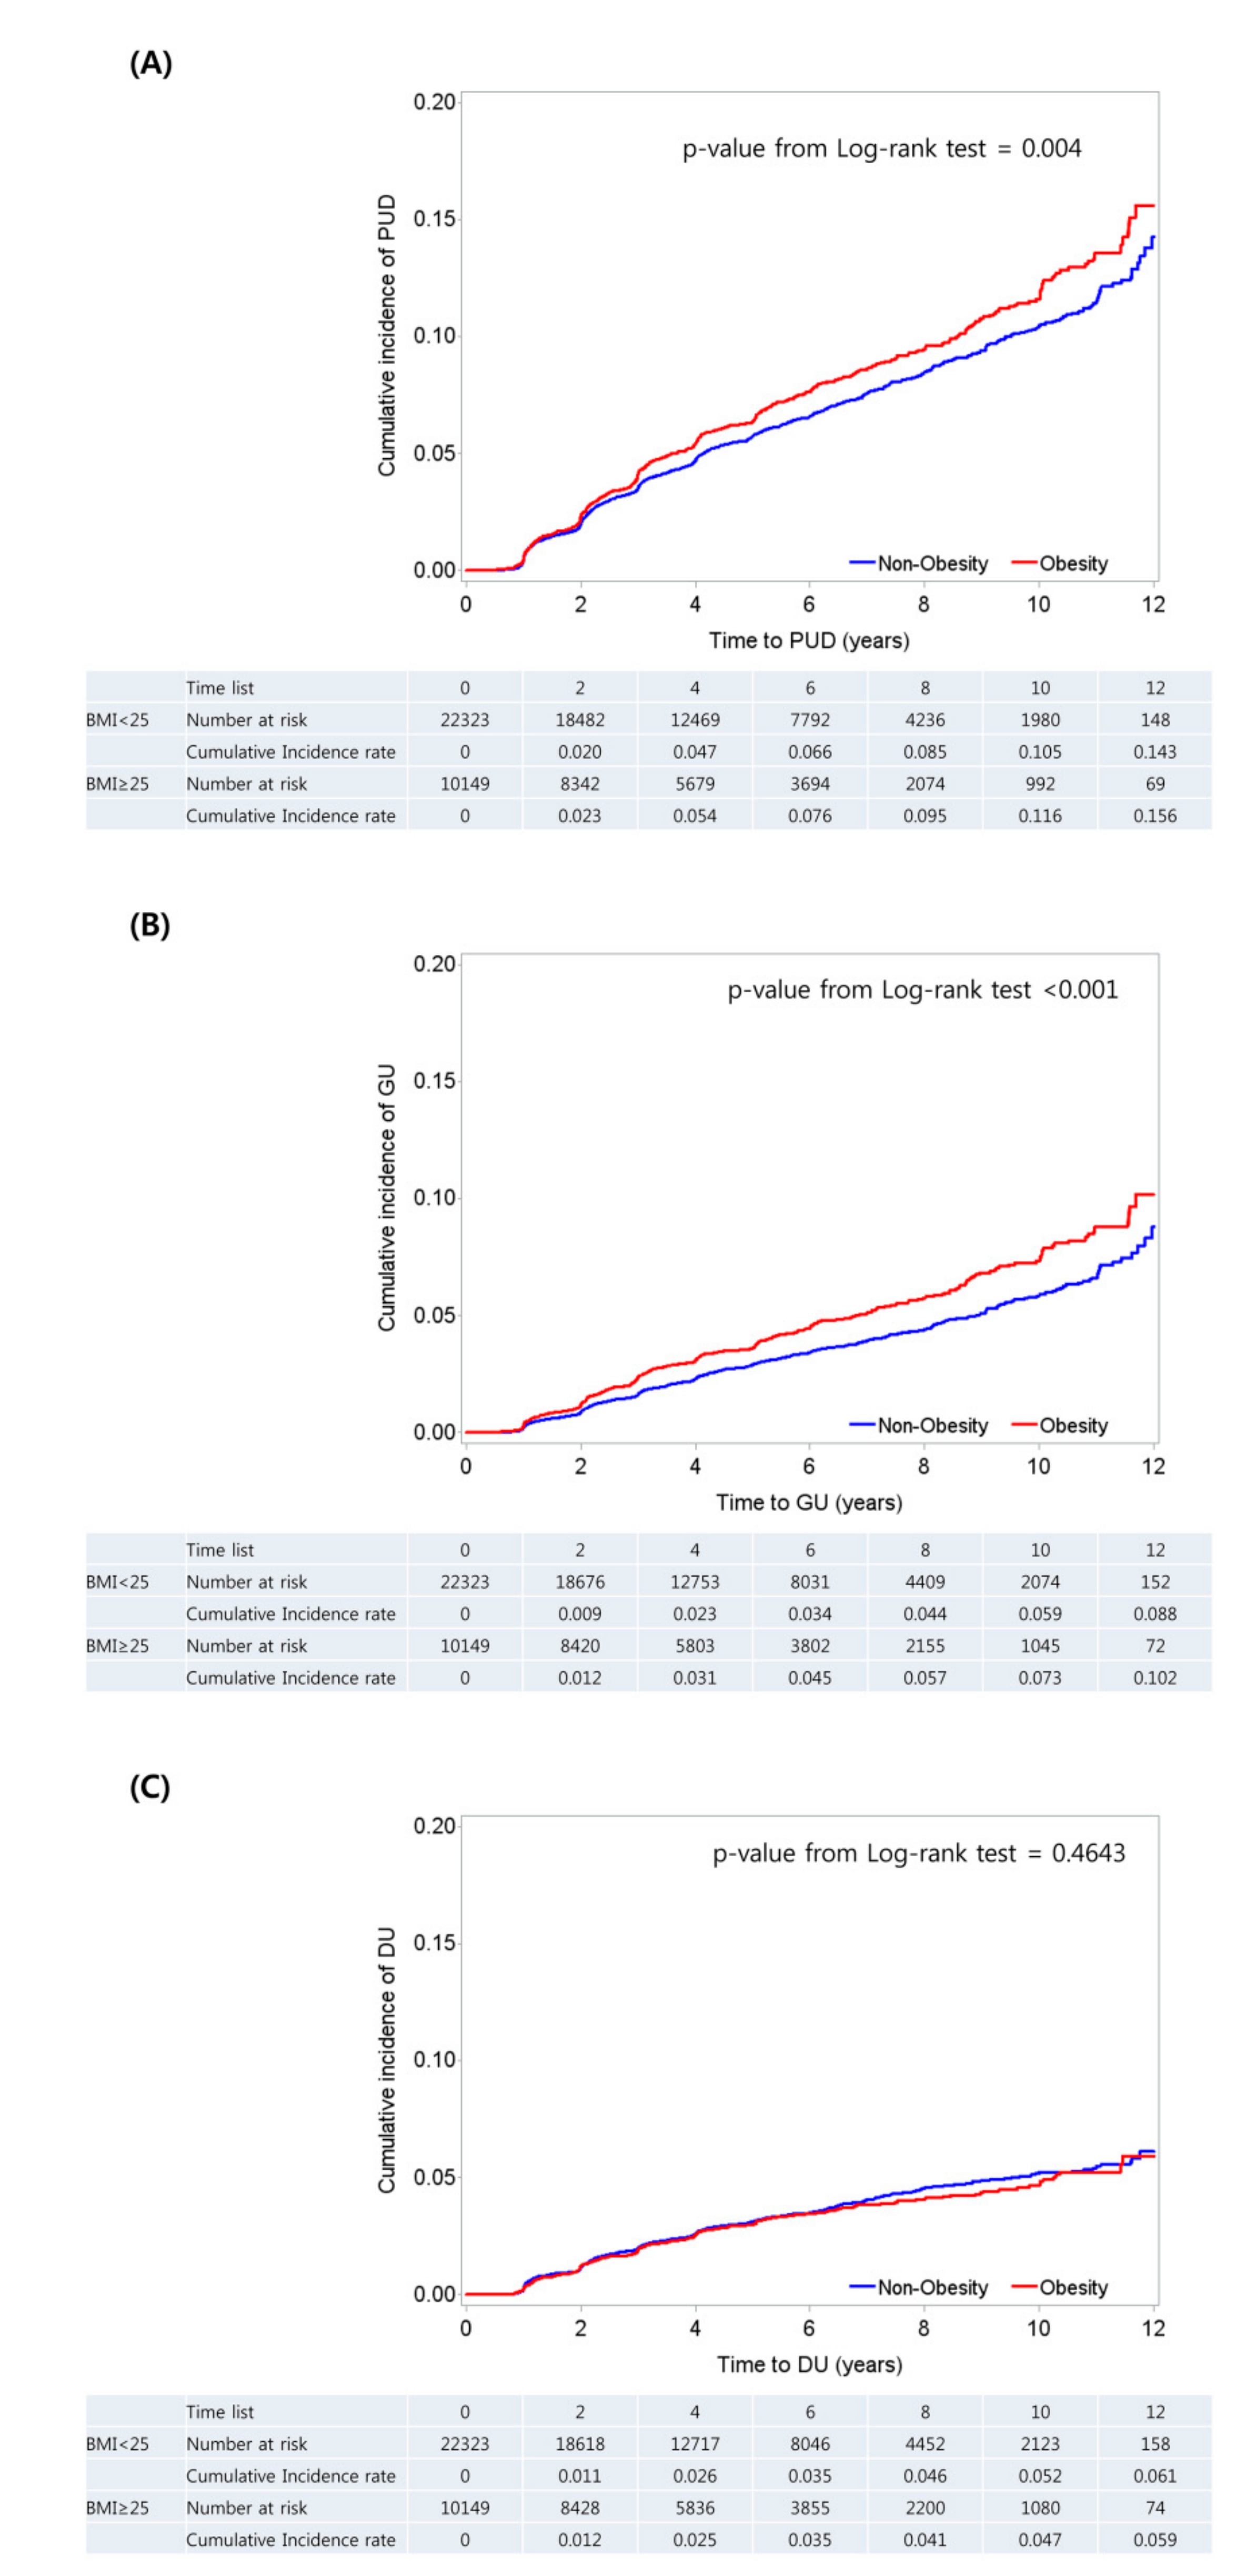
4. Cumulative Incidence of PUD among Subjects
5. Association between Obesity and PUD
6. Association between Metabolic Health, Obesity, and PUD
7. Discussion
Author Contributions
Funding
Conflicts of Interest
References
- Malfertheiner, P.; Chan, F.K.; McColl, K.E. Peptic ulcer disease. Lancet 2009, 374, 1449–1461. [Google Scholar] [CrossRef]
- Yuan, Y.; Padol, I.T.; Hunt, R.H. Peptic ulcer disease today. Nat. Clin. Pract. Gastroenterol. Hepatol. 2006, 3, 80–89. [Google Scholar] [CrossRef] [PubMed]
- Quan, C.; Talley, N.J. Management of peptic ulcer disease not related to helicobacter pylori or nsaids. Am. J. Gastroenterol. 2002, 97, 2950–2961. [Google Scholar] [CrossRef] [PubMed]
- Garrow, D.; Delegge, M.H. Risk factors for gastrointestinal ulcer disease in the us population. Dig. Dis. Sci. 2010, 55, 66–72. [Google Scholar] [CrossRef] [PubMed]
- Aro, P.; Storskrubb, T.; Ronkainen, J.; Bolling-Sternevald, E.; Engstrand, L.; Vieth, M.; Stolte, M.; Talley, N.J.; Agreus, L. Peptic ulcer disease in a general adult population: The kalixanda study: A random population-based study. Am. J. Epidemiol. 2006, 163, 1025–1034. [Google Scholar] [CrossRef] [PubMed]
- Boylan, M.R.; Khalili, H.; Huang, E.S.; Chan, A.T. Measures of adiposity are associated with increased risk of peptic ulcer. Clin. Gastroenterol. Hepatol. 2014, 12, 1688–1694. [Google Scholar] [CrossRef] [PubMed]
- Wang, F.W.; Tu, M.S.; Mar, G.Y.; Chuang, H.Y.; Yu, H.C.; Cheng, L.C.; Hsu, P.I. Prevalence and risk factors of asymptomatic peptic ulcer disease in Taiwan. World J. Gastroenterol. 2011, 17, 1199–1203. [Google Scholar] [CrossRef] [PubMed]
- Lee, B.J.; Kim, J.; Kim, K.H. Association of gastric and duodenal ulcers with anthropometry and nutrients: Korean national health and nutrition examination survey (knhanes ii–iv) 2001–2009. PLoS ONE 2018, 13, e0207373. [Google Scholar] [CrossRef] [PubMed]
- Tsai, W.L.; Yang, C.Y.; Lin, S.F.; Fang, F.M. Impact of obesity on medical problems and quality of life in Taiwan. Am. J. Epidemiol. 2004, 160, 557–565. [Google Scholar] [CrossRef] [PubMed]
- Sims, E.A. Are there persons who are obese, but metabolically healthy? Metab. Clin. Exp. 2001, 50, 1499–1504. [Google Scholar] [CrossRef] [PubMed]
- Munoz-Garach, A.; Cornejo-Pareja, I.; Tinahones, F.J. Does metabolically healthy obesity exist? Nutrients 2016, 8, 320. [Google Scholar] [CrossRef] [PubMed]
- Appropriate body-mass index for asian populations and its implications for policy and intervention strategies. Lancet 2004, 363, 157–163. [CrossRef]
- Wildman, R.P.; Muntner, P.; Reynolds, K.; McGinn, A.P.; Rajpathak, S.; Wylie-Rosett, J.; Sowers, M.R. The obese without cardiometabolic risk factor clustering and the normal weight with cardiometabolic risk factor clustering: Prevalence and correlates of 2 phenotypes among the us population (nhanes 1999–2004). Arch. Int. Med. 2008, 168, 1617–1624. [Google Scholar] [CrossRef] [PubMed]
- Hsu, P.I.; Lai, K.H.; Tseng, H.H.; Lo, G.H.; Lo, C.C.; Lin, C.K.; Cheng, J.S.; Chan, H.H.; Ku, M.K.; Peng, N.J.; et al. Eradication of helicobacter pylori prevents ulcer development in patients with ulcer-like functional dyspepsia. Aliment. Pharmacol. Ther. 2001, 15, 195–201. [Google Scholar] [CrossRef] [PubMed]
- Matthews, D.R.; Hosker, J.P.; Rudenski, A.S.; Naylor, B.A.; Treacher, D.F.; Turner, R.C. Homeostasis model assessment: Insulin resistance and beta-cell function from fasting plasma glucose and insulin concentrations in man. Diabetologia 1985, 28, 412–419. [Google Scholar] [CrossRef] [PubMed]
- Wisse, B.E.; Kim, F.; Schwartz, M.W. Physiology. An integrative view of obesity. Science 2007, 318, 928–929. [Google Scholar] [CrossRef] [PubMed]
- Watanabe, S.; Hojo, M.; Nagahara, A. Metabolic syndrome and gastrointestinal diseases. J. Gastroenterol. 2007, 42, 267–274. [Google Scholar] [CrossRef] [PubMed]

| All | Non-Obese (n = 22,323) | Obese (n = 10,149) | p Value | |
|---|---|---|---|---|
| Age (year) | 50.2 ± 8.0 | 50.0 ± 8.0 | 50.8 ± 7.9 | <0.001 |
| Sex (male, %) | 55.7 | 45.9 | 77.2 | <0.001 |
| Systolic BP (mmHg) | 117.1 ± 15.7 | 114.8 ± 15.4 | 122.1 ± 15.0 | <0.001 |
| Diastolic BP (mmHg) | 73.2 ± 11.2 | 71.5 ± 11.0 | 76.9 ± 10.6 | <0.001 |
| Waist circumference (cm) | 82.8 ± 9.1 | 78.8 ± 7.2 | 91.4 ± 6.7 | <0.001 |
| Current smoker (%) | 20.8 | 17.2 | 28.8 | <0.001 |
| Heavy drinker (%) | 26.0 | 21.3 | 36.4 | <0.001 |
| Regular exercise (%) | 45.4 | 45.1 | 46.1 | <0.001 |
| Hypertension (%) | 17.9 | 13.0 | 28.6 | <0.001 |
| Diabetes (%) | 6.7 | 5.5 | 9.2 | <0.001 |
| Total cholesterol | 196.5 ± 33.9 | 195.1 ± 33.4 | 199.7 ± 35.0 | <0.001 |
| LDL-cholesterol | 125.2 ± 30.3 | 122.9 ± 30.0 | 130.2 ± 30.5 | <0.001 |
| HDL-cholesterol | 56.8 ± 15.0 | 59.8 ± 15.3 | 50.3 ± 12.1 | <0.001 |
| Triglycerides | 122.6 ± 78.4 | 108.4 ± 66.0 | 154.0 ± 93.0 | <0.001 |
| Fasting blood glucose | 94.7 ± 17.6 | 92.5 ± 15.9 | 99.4 ± 20.1 | <0.001 |
| Insulin | 7.7 ± 4.4 | 6.8 ± 3.6 | 9.8 ± 5.1 | <0.001 |
| HOMA-IR | 1.7 ± 1.1 | 1.4 ± 0.8 | 2.2 ± 1.4 | <0.001 |
| hsCRP | 0.1 ± 0.3 | 0.1 ± 0.3 | 0.2 ± 0.4 | <0.001 |
| PUD | 6.0 | 6.0 | 6.6 | 0.001 |
| GU | 3.3 | 3.0 | 4.0 | <0.001 |
| DU | 3.0 | 3.0 | 2.9 | 0.596 |
| Helicobacter pylori status (%, in 1671 subjects) | 41.9 | 42.9 | 40.1 | 0.281 |
| Cases/n (%) | Model 1 | Model 2 | Model 3 | Model 4 | |||||
|---|---|---|---|---|---|---|---|---|---|
| HR (95% CI) | p Value | HR (95% CI) | p Value | HR (95% CI) | p Value | HR (95% CI) | p Value | ||
| PUD | 0.853 | 0.511 | 0.922 | 0.610 | |||||
| Non-Obese | 1270 (5.7) | 1.00 | 1.00 | 1.00 | 1.00 | ||||
| Obese | 670 (6.6) | 0.99 (0.90–1.09) | 0.96 (0.86–1.08) | 1.01 (0.86–1.19) | 0.96 (0.80–1.14) | ||||
| GU | 0.071 | 0.355 | 0.299 | 0.789 | |||||
| Non-Obese | 664 (3.0) | 1.00 | 1.00 | 1.00 | 1.00 | ||||
| Obese | 403 (4.0) | 1.12 (0.99–1.28) | 1.08 (0.92–1.25) | 1.12 (0.91–1.38) | 1.03 (0.83–1.28) | ||||
| DU | 0.011 | 0.020 | 0.280 | 0.199 | |||||
| Non-Obese | 664 (3.0) | 1.00 | 1.00 | 1.00 | 1.00 | ||||
| Obese | 291 (2.9) | 0.83 (0.72–0.96) | 0.83 (0.69–1.00) | 0.87 (0.68–1.12) | 0.83 (0.63–1.10) |
| Cases/n (%) | Model 1 | Model 2 | Model 3 | Model 4 | |||||
|---|---|---|---|---|---|---|---|---|---|
| HR (95% CI) | p Value | HR (95% CI) | p Value | HR (95% CI) | p Value | HR (95% CI) | p Value | ||
| PUD | |||||||||
| metabolically healthy, non-obese | 922 (5.4) | 1.00 | 1.00 | 1.00 | 1.00 | ||||
| metabolically unhealthy, non-obese | 348 (6.5) | 1.02 (0.90–1.16) | 0.777 | 0.98 (0.84–1.14) | 0.752 | 1.02 (0.80–1.28) | 0.895 | 0.90 (0.69–1.18) | 0.443 |
| metabolically healthy, obese | 302 (6.7) | 1.00 (0.88–1.14) | 0.983 | 0.95 (0.81–1.11) | 0.519 | 1.04 (0.83–1.30) | 0.764 | 0.83 (0.65–1.06) | 0.26 |
| metabolically unhealthy, obese | 368 (6.6) | 0.93 (0.99–0.88) | 0.93 | 0.96 (0.82–1.12) | 0.594 | 0.99 (0.77–1.28) | 0.949 | 1.00 (0.76–1.32) | 0.99 |
| GU | |||||||||
| metabolically healthy, non-obese | 470 (2.8) | 1.00 | 1.00 | 1.00 | 1.00 | ||||
| metabolically unhealthy, non-obese | 194 (3.6) | 1.05 (0.89–1.25) | 0.566 | 1.03 (0.84–1.25) | 0.803 | 1.06 (0.78–1.44) | 0.715 | 0.86 (0.62–1.20) | 0.365 |
| metabolically healthy, obese | 168 (3.7) | 1.06 (0.89–1.27) | 0.501 | 1.01 (0.81–1.25) | 0.95 | 1.09 (0.81–1.47) | 0.523 | 0.89 (0.65–1.21) | 0.447 |
| metabolically unhealthy, obese | 235 (4.2) | 1.21 (1.03–1.42) | 0.023 | 1.15 (0.95–1.40) | 0.165 | 1.20 (0.87–1.66) | 0.264 | 1.04 (0.74–1.46) | 0.825 |
| DU | |||||||||
| metabolically healthy, non-obese | 495 (2.9) | 1.00 | 1.00 | 1.00 | 1.00 | ||||
| metabolically unhealthy, non-obese | 169 (3.1) | 1.07 (0.90–1.28) | 0.816 | 0.91 (0.73–1.13) | 0.384 | 0.91 (0.64–1.29) | 0.583 | 0.80 (0.53–1.22) | 0.295 |
| metabolically healthy, obese | 142 (3.1) | 1.03 (0.86–1.25) | 0.249 | 0.85 (0.67–1.07) | 0.164 | 0.95 (0.69–1.32) | 0.771 | 0.83 (0.56–1.21) | 0.324 |
| metabolically unhealthy, obese | 149 (2.7) | 0.91 (0.76–1.09) | 0.007 | 0.74 (0.59–0.94) | 0.012 | 0.73 (0.50–1.07) | 0.109 | 0.69 (0.45–1.08) | 0.102 |
© 2019 by the authors. Licensee MDPI, Basel, Switzerland. This article is an open access article distributed under the terms and conditions of the Creative Commons Attribution (CC BY) license (http://creativecommons.org/licenses/by/4.0/).
Share and Cite
Pyo, J.H.; Lee, H.; Kim, J.E.; Choi, Y.H.; Kim, T.J.; Min, Y.W.; Min, B.H.; Lee, J.H.; Rhee, P.L.; Yoo, H.; et al. Obesity and Risk of Peptic Ulcer Disease: A Large-Scale Health Check-Up Cohort Study. Nutrients 2019, 11, 1288. https://doi.org/10.3390/nu11061288
Pyo JH, Lee H, Kim JE, Choi YH, Kim TJ, Min YW, Min BH, Lee JH, Rhee PL, Yoo H, et al. Obesity and Risk of Peptic Ulcer Disease: A Large-Scale Health Check-Up Cohort Study. Nutrients. 2019; 11(6):1288. https://doi.org/10.3390/nu11061288
Chicago/Turabian StylePyo, Jeung Hui, Hyuk Lee, Jee Eun Kim, Yoon Ho Choi, Tae Jun Kim, Yang Won Min, Byung Hoon Min, Jun Haeng Lee, Poong Lyul Rhee, Heejin Yoo, and et al. 2019. "Obesity and Risk of Peptic Ulcer Disease: A Large-Scale Health Check-Up Cohort Study" Nutrients 11, no. 6: 1288. https://doi.org/10.3390/nu11061288
APA StylePyo, J. H., Lee, H., Kim, J. E., Choi, Y. H., Kim, T. J., Min, Y. W., Min, B. H., Lee, J. H., Rhee, P. L., Yoo, H., Kim, K., & Kim, J. J. (2019). Obesity and Risk of Peptic Ulcer Disease: A Large-Scale Health Check-Up Cohort Study. Nutrients, 11(6), 1288. https://doi.org/10.3390/nu11061288