Hericium erinaceus Improves Recognition Memory and Induces Hippocampal and Cerebellar Neurogenesis in Frail Mice during Aging


 , ,
, ,  ,
, 


Abstract
:1. Introduction
2. Materials and Methods
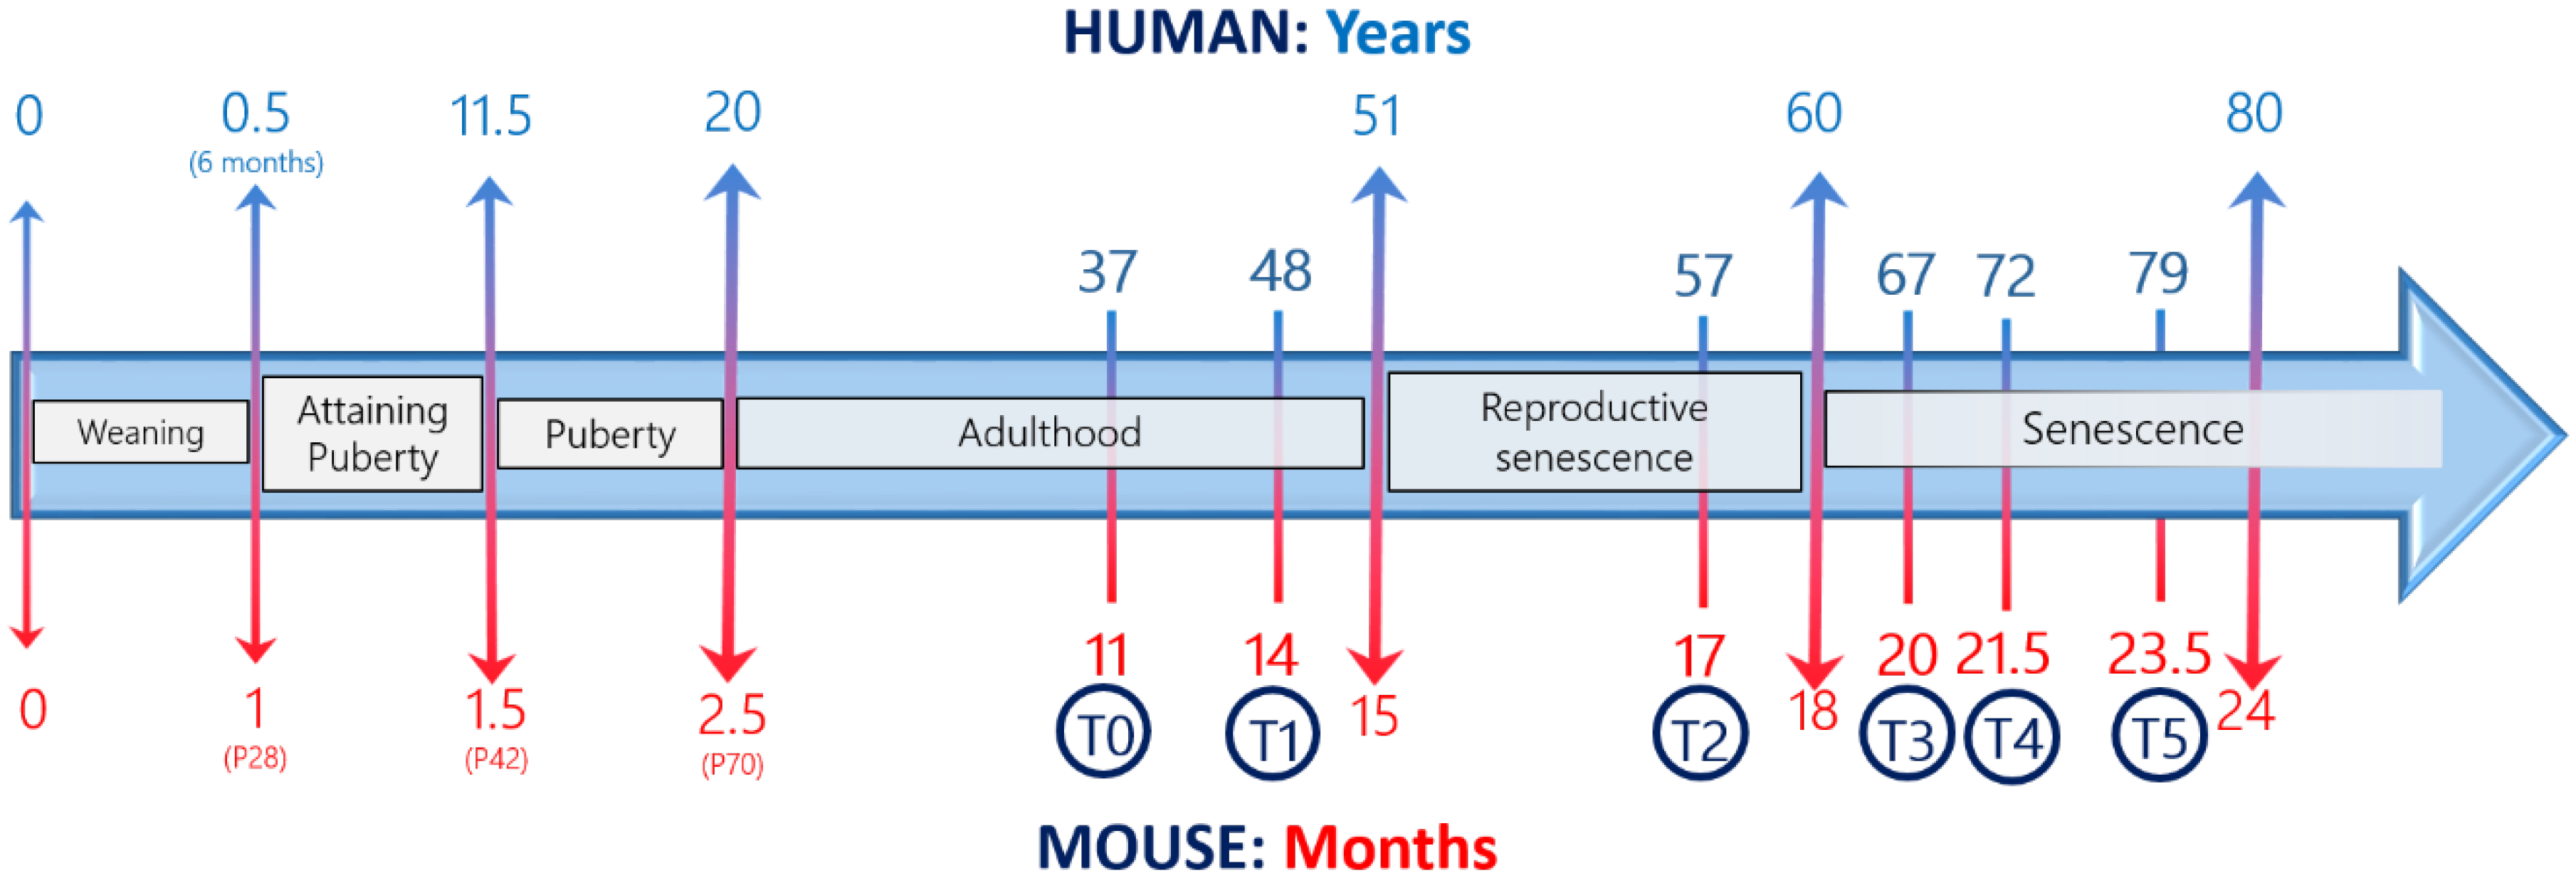
2.1. Animals
2.2. Apparatus and Procedures
2.2.1. Emergence Test
2.2.2. Novel Object Recognition Task
2.3. The Frailty Index
2.4. H. erinaceus
2.4.1. Extraction Procedures
2.4.2. HPLC-UV-ESI/MS Method
2.5. Tissue Sampling: Hippocampal and Cerebellar Specimens Preparation
2.6. Immunohistochemistry: Fluorescence Microscopy Assessment and Quantification of Cell Proliferation and Neurogenesis
2.7. Statistics
3. Results
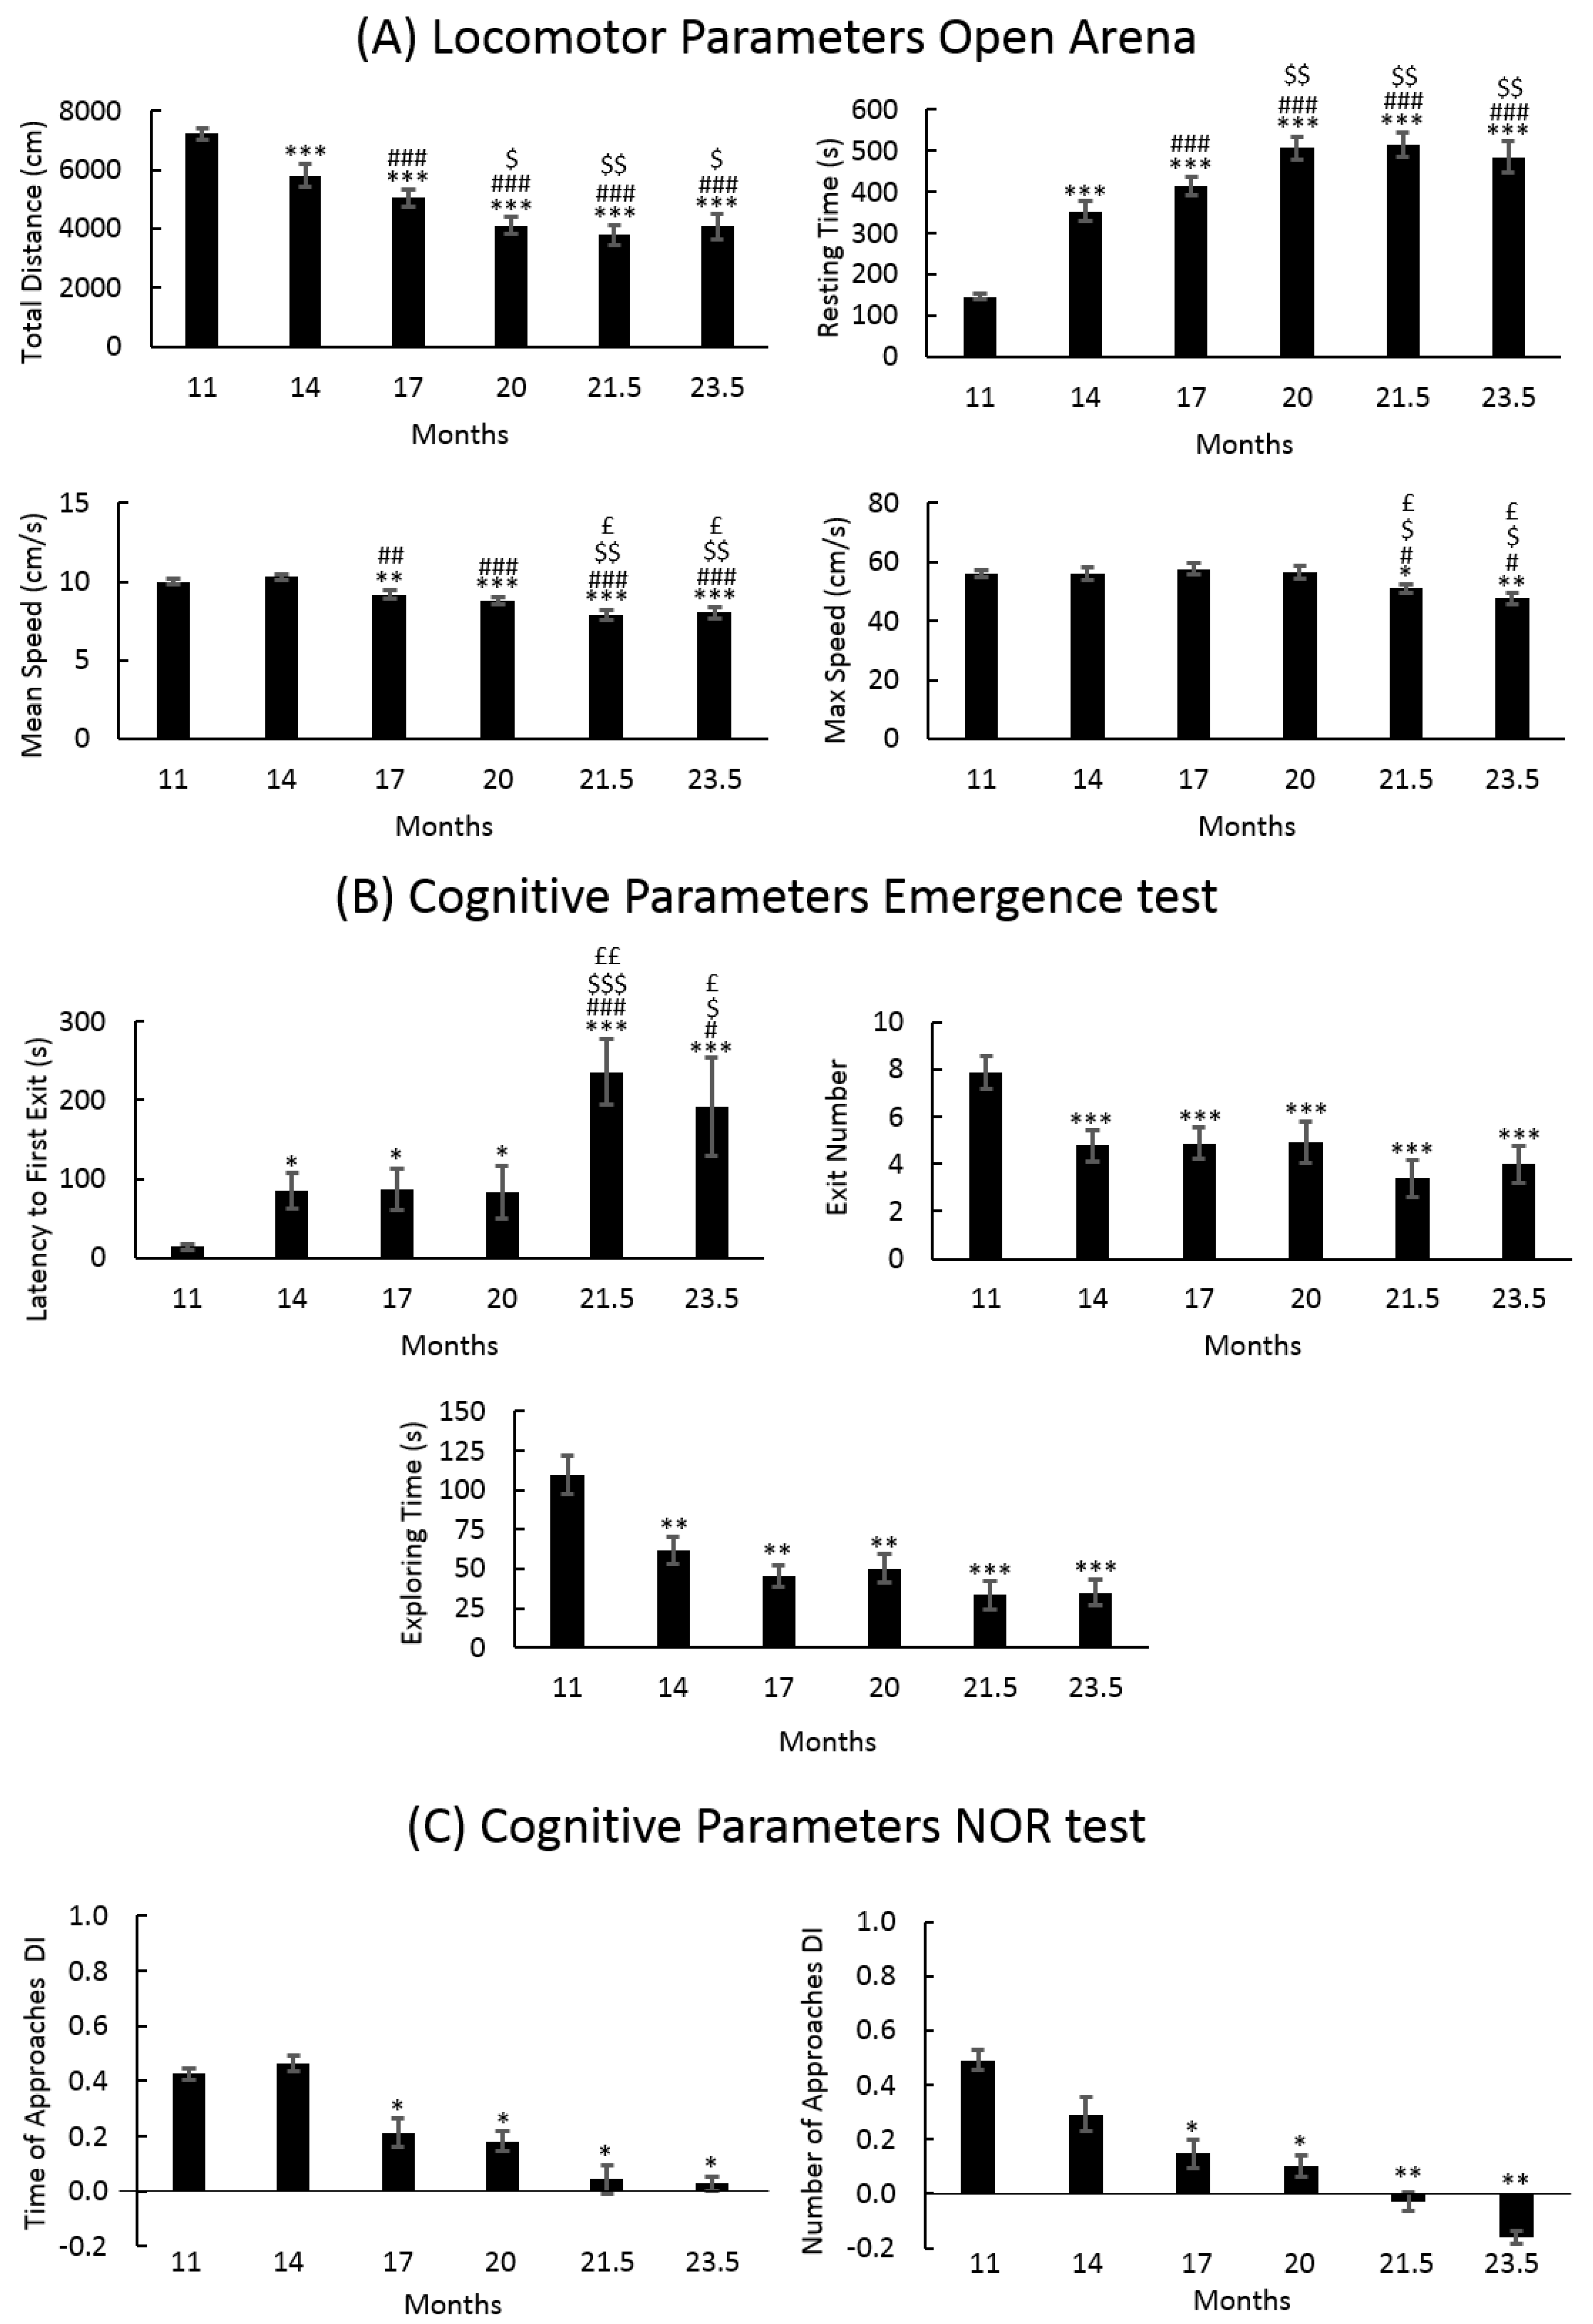
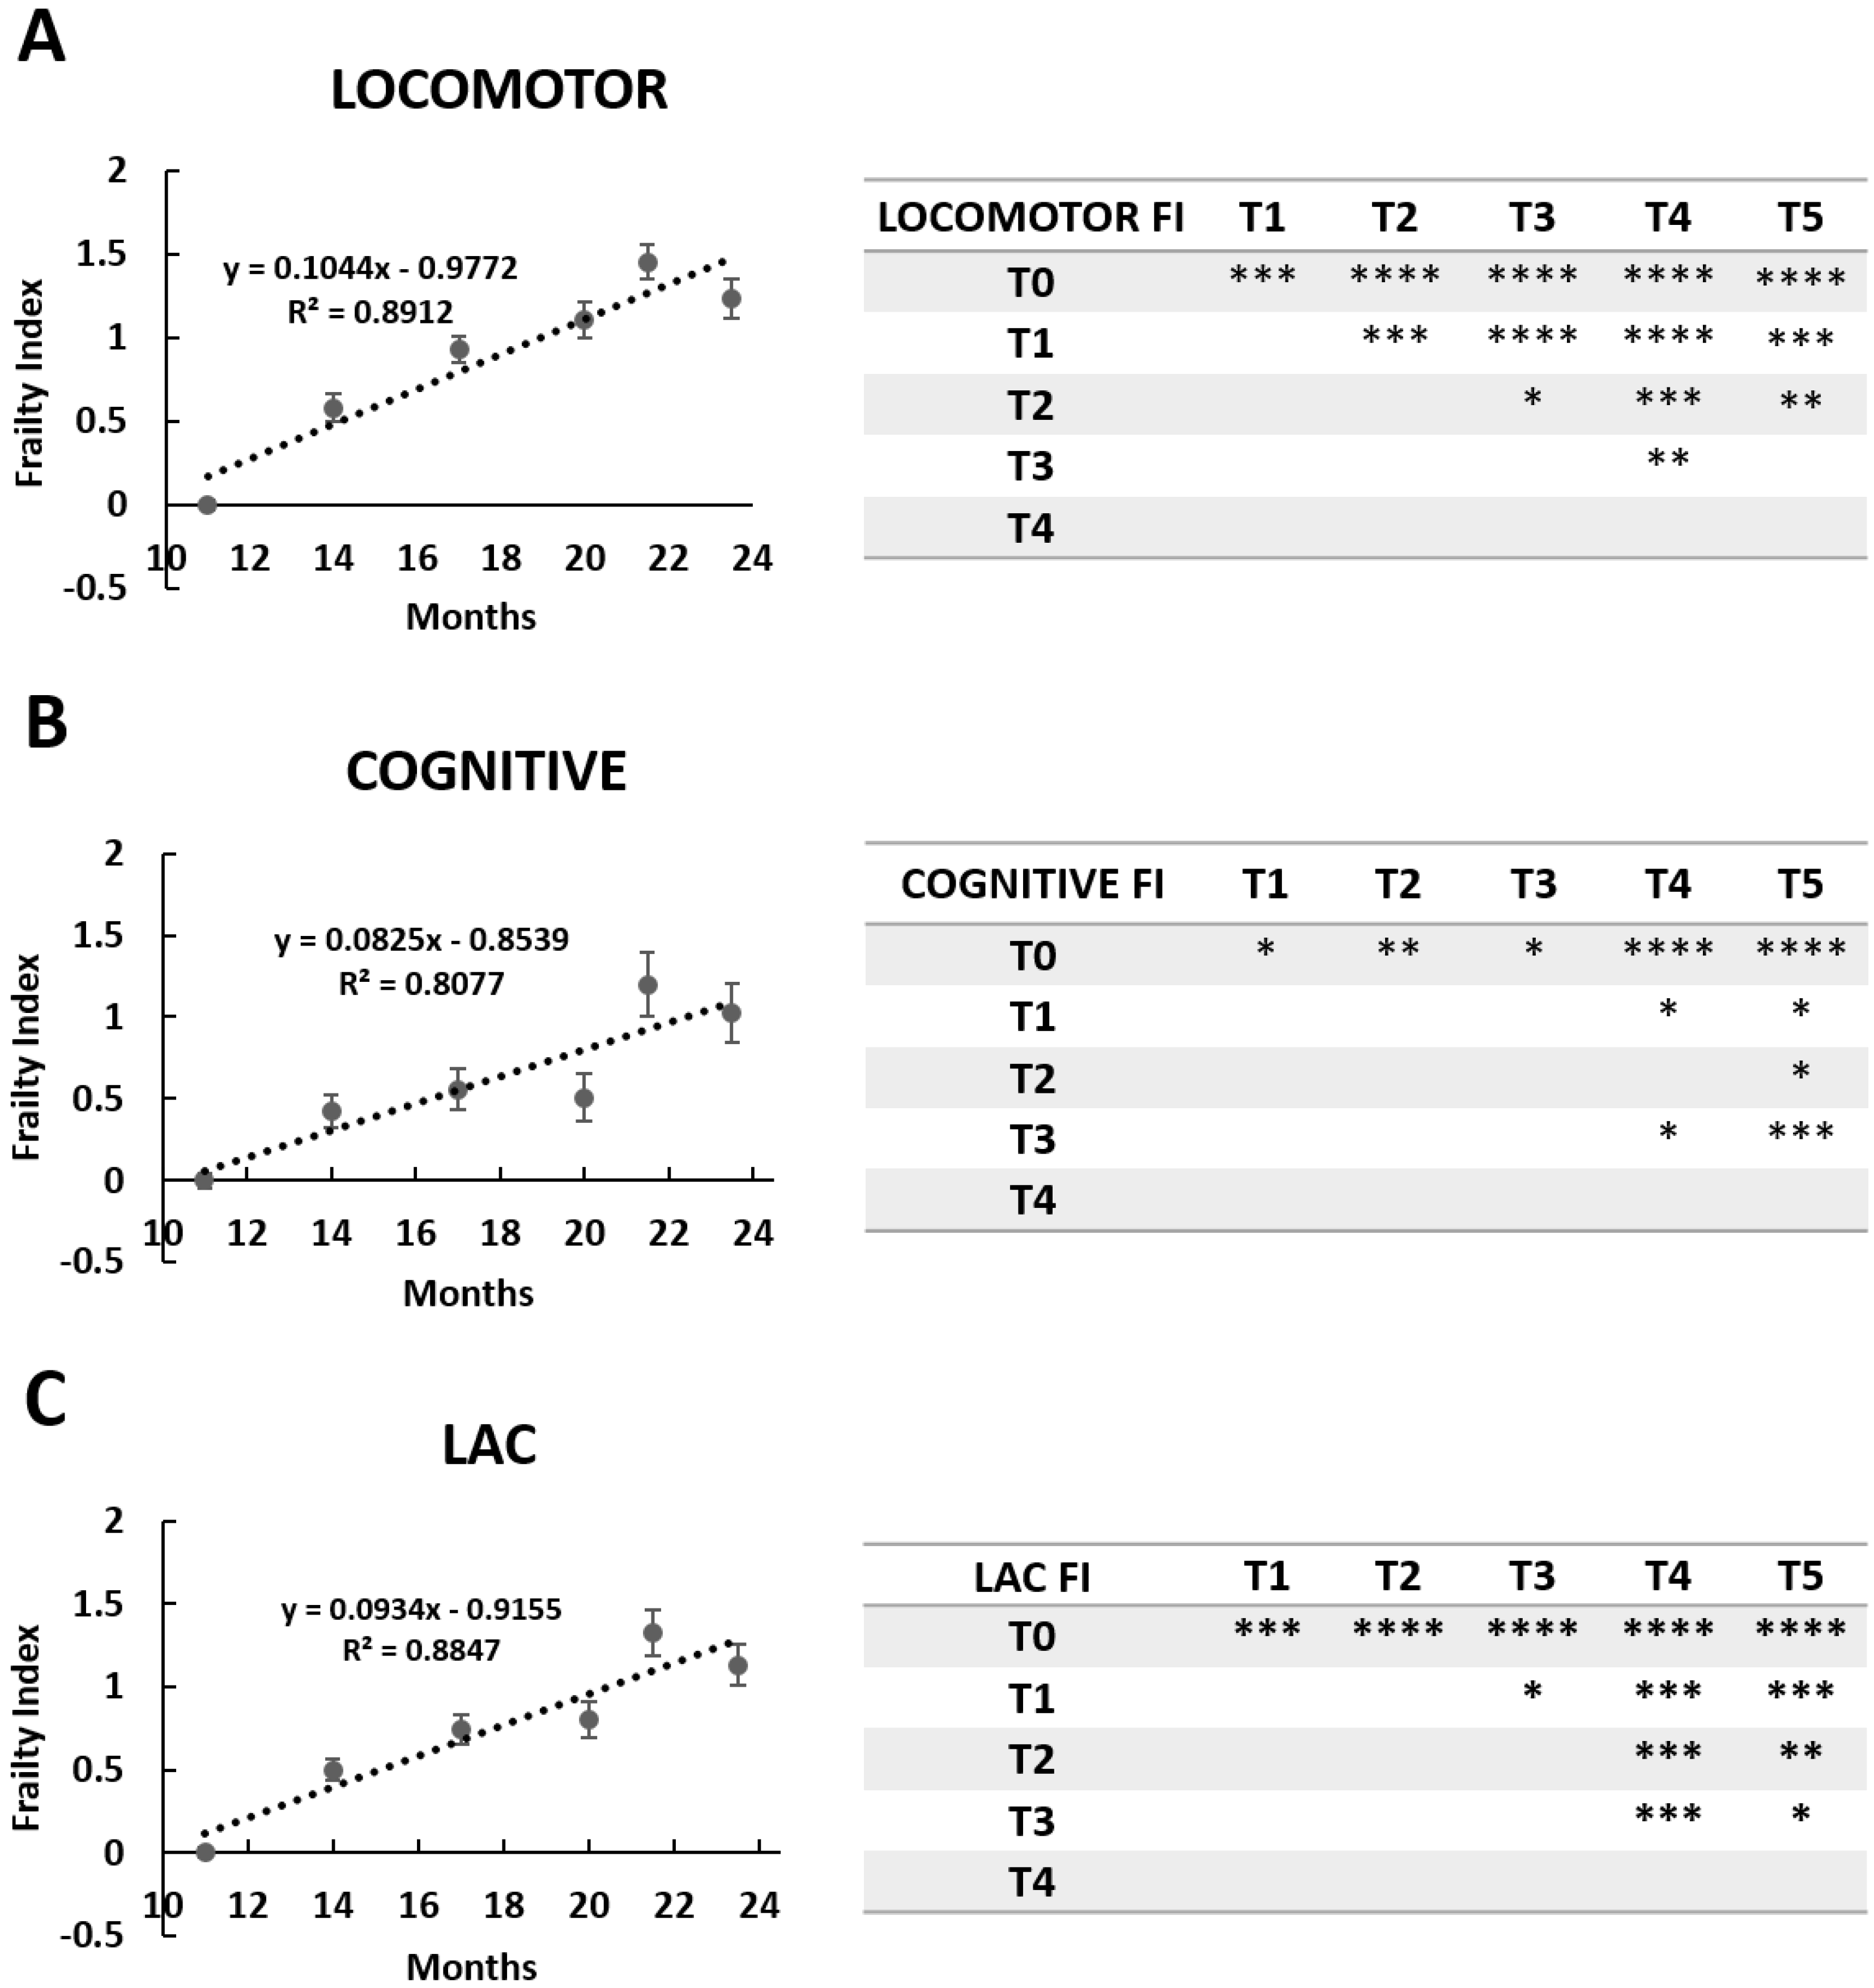
3.1. Locomotor and Recognition Memory during Physiological Aging
3.1.1. Locomotor Frailty Index
3.1.2. Cognitive Frailty Index
3.1.3. Cognitive Frailty Index
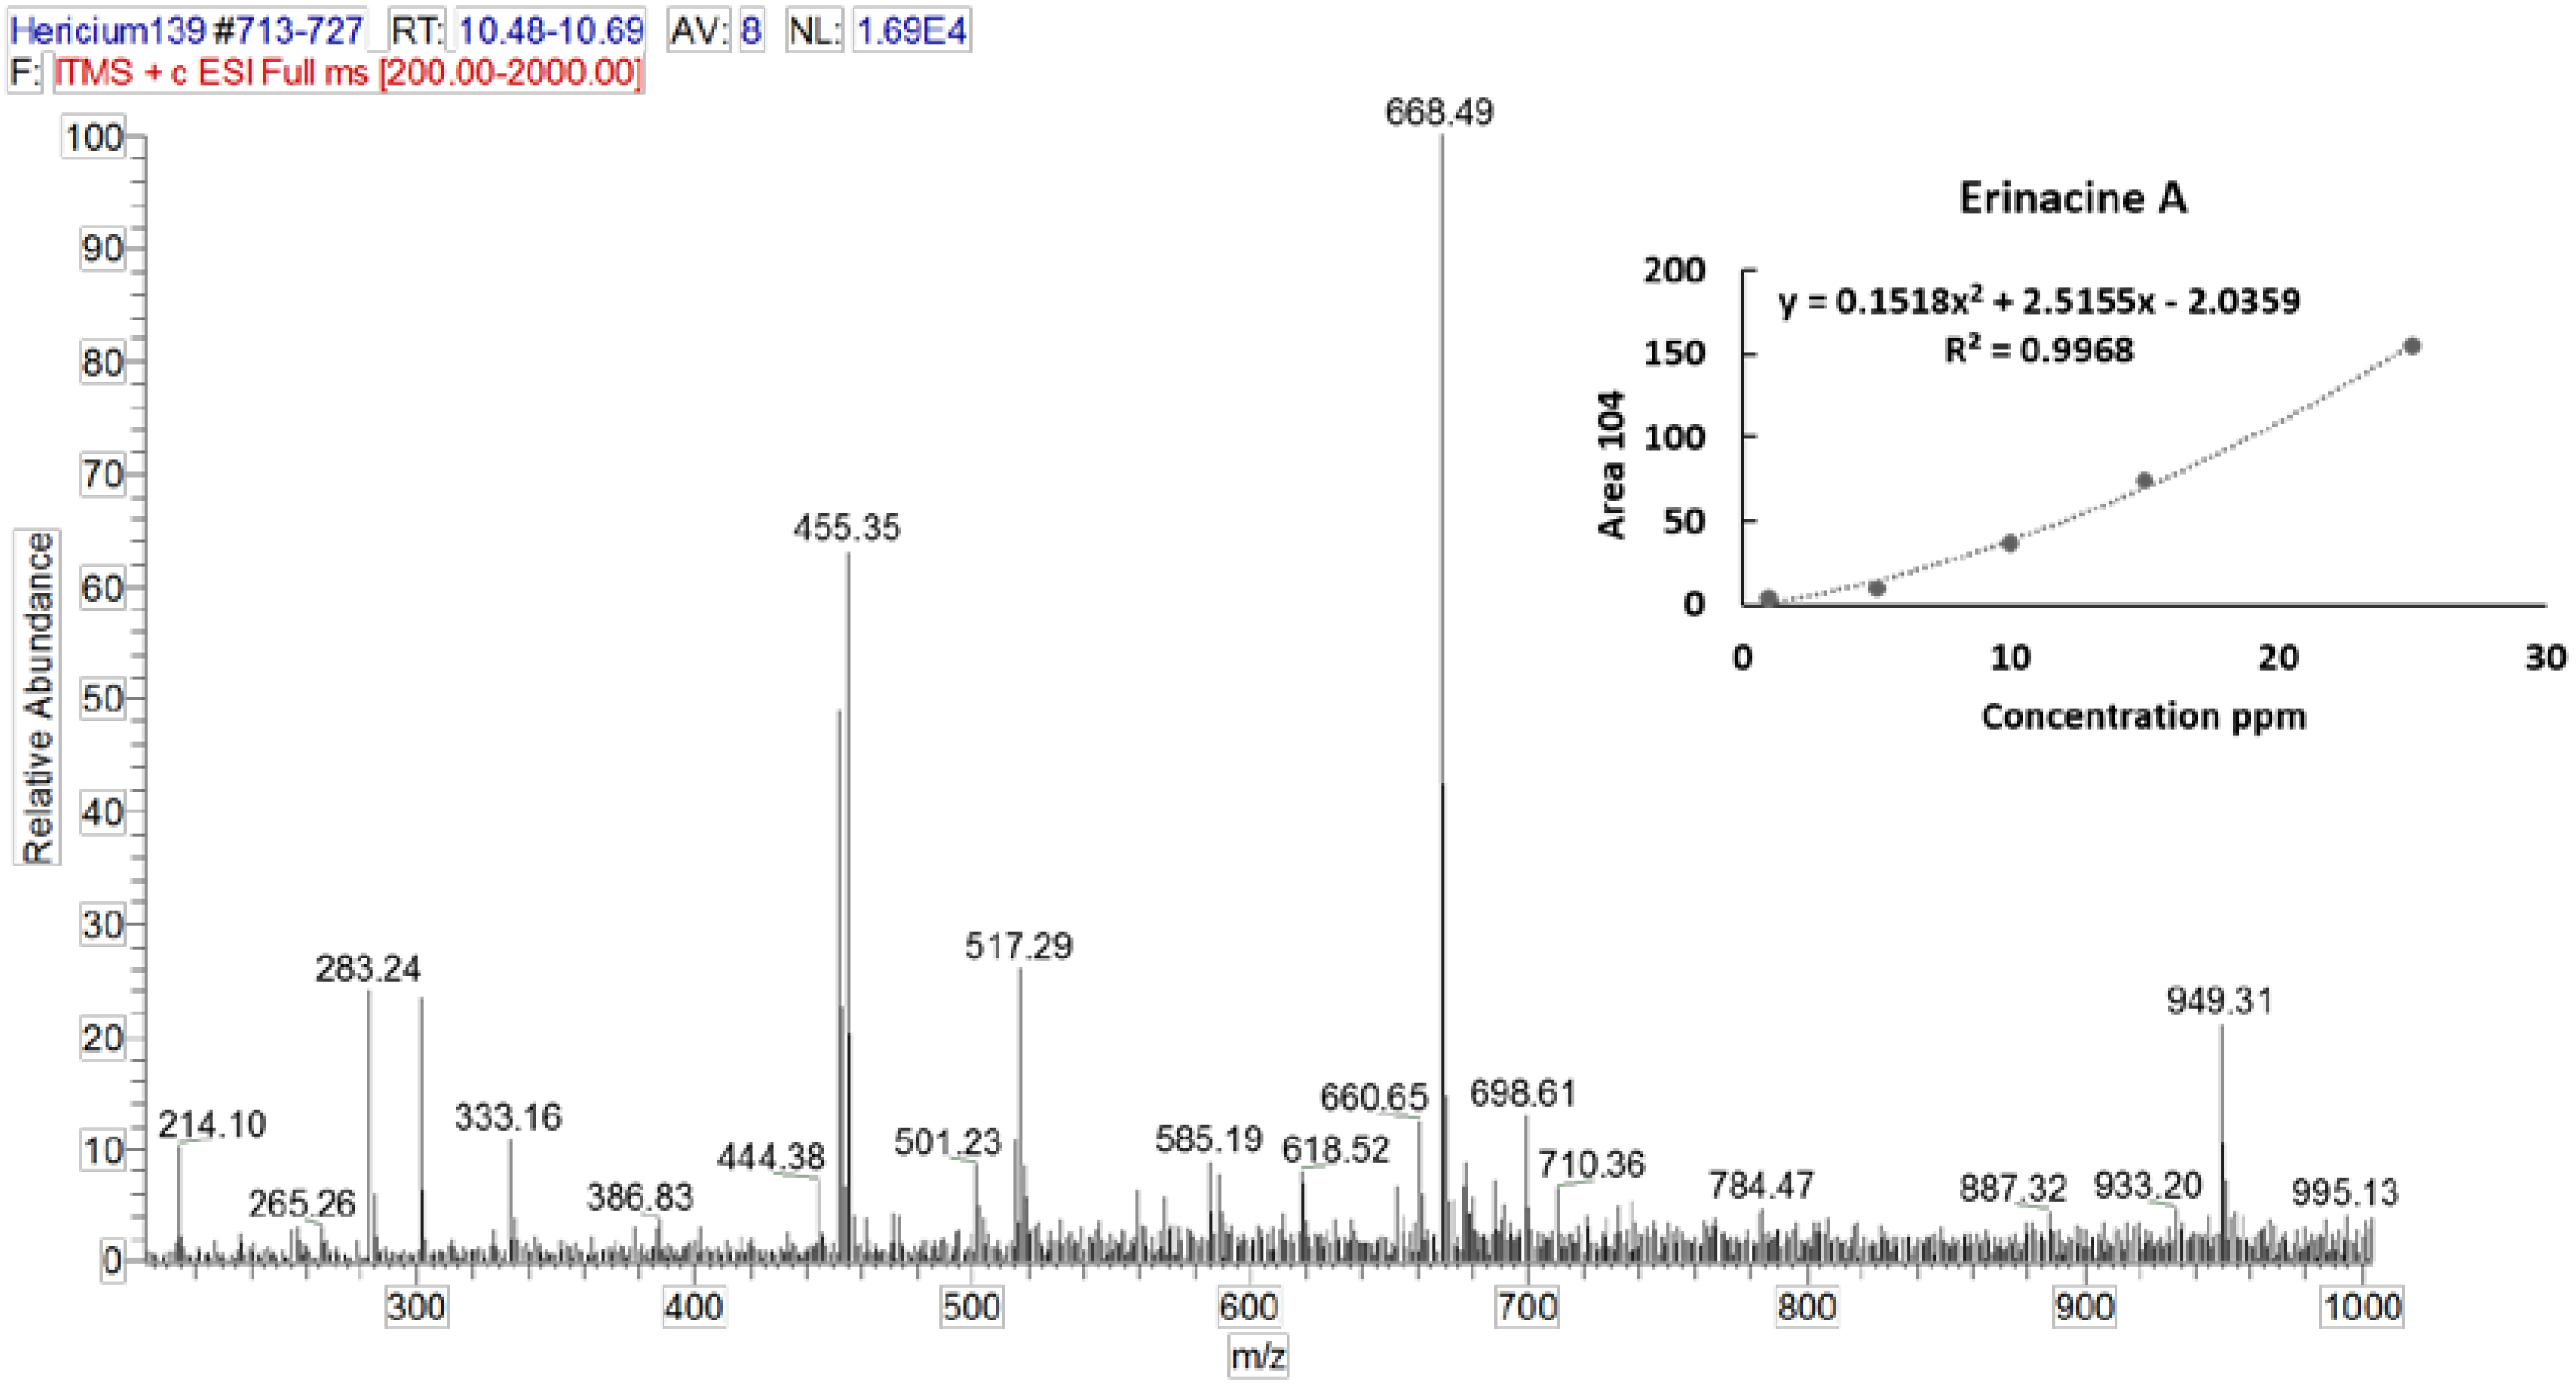
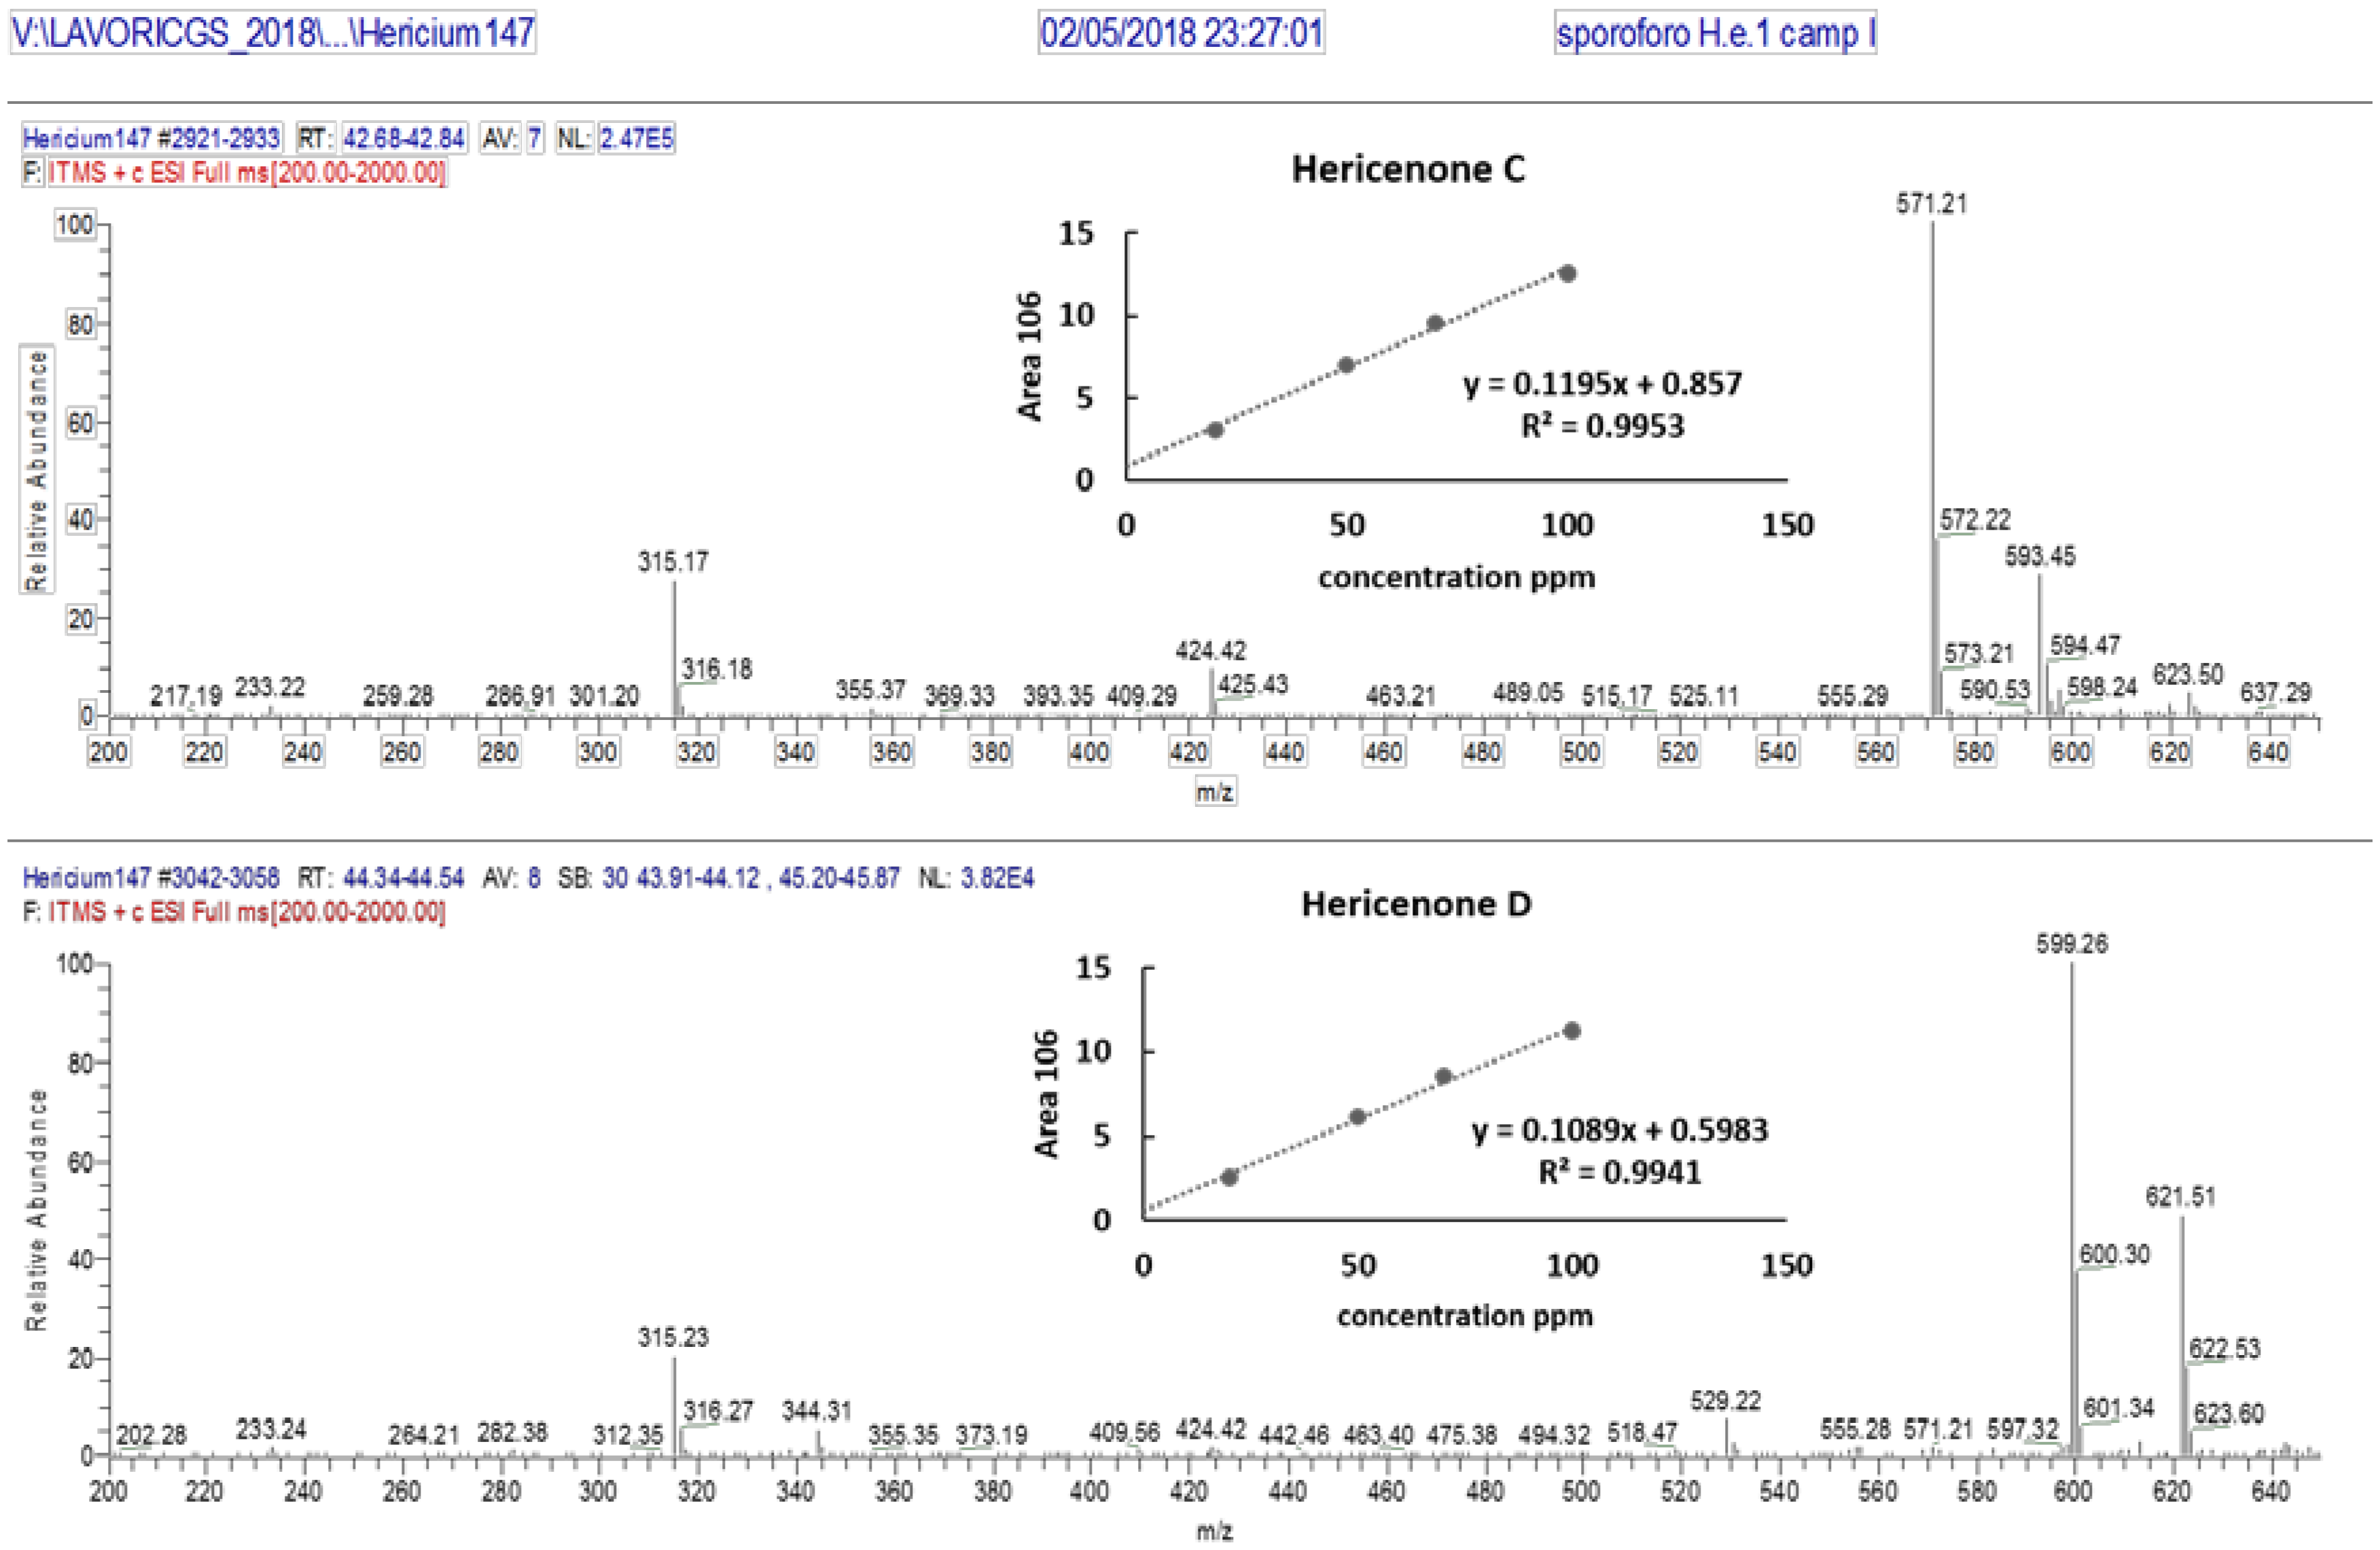
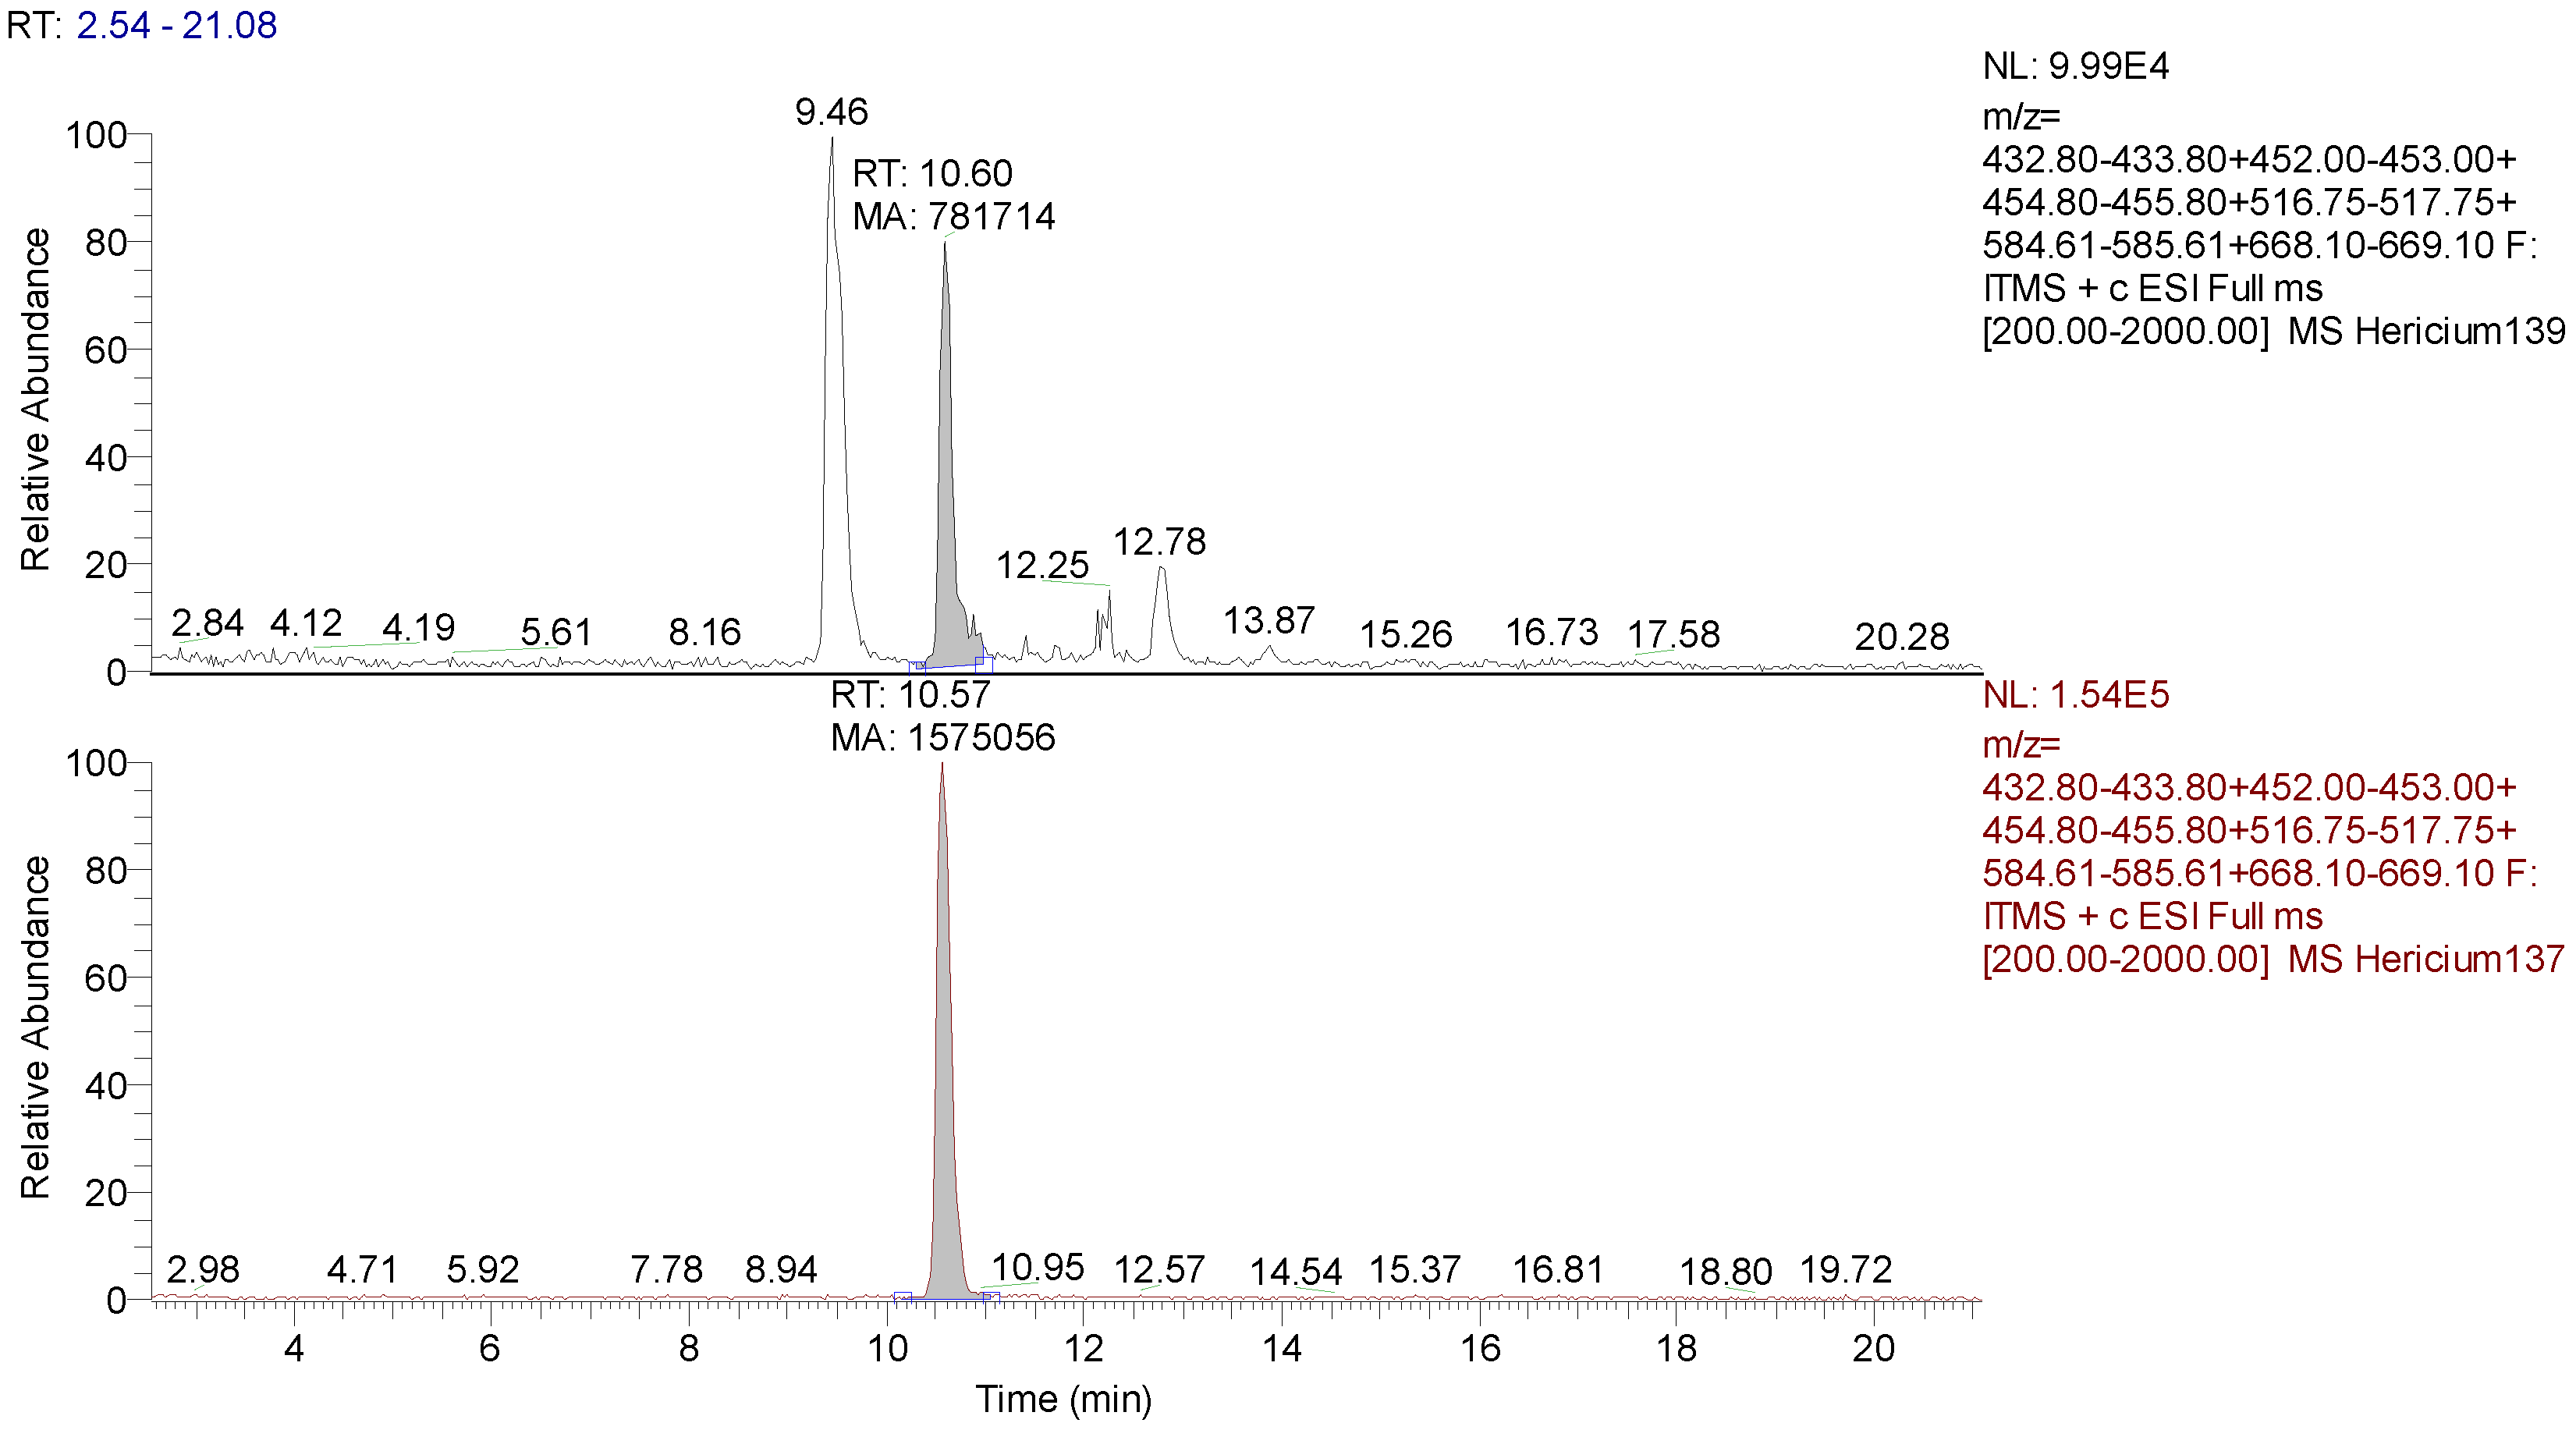
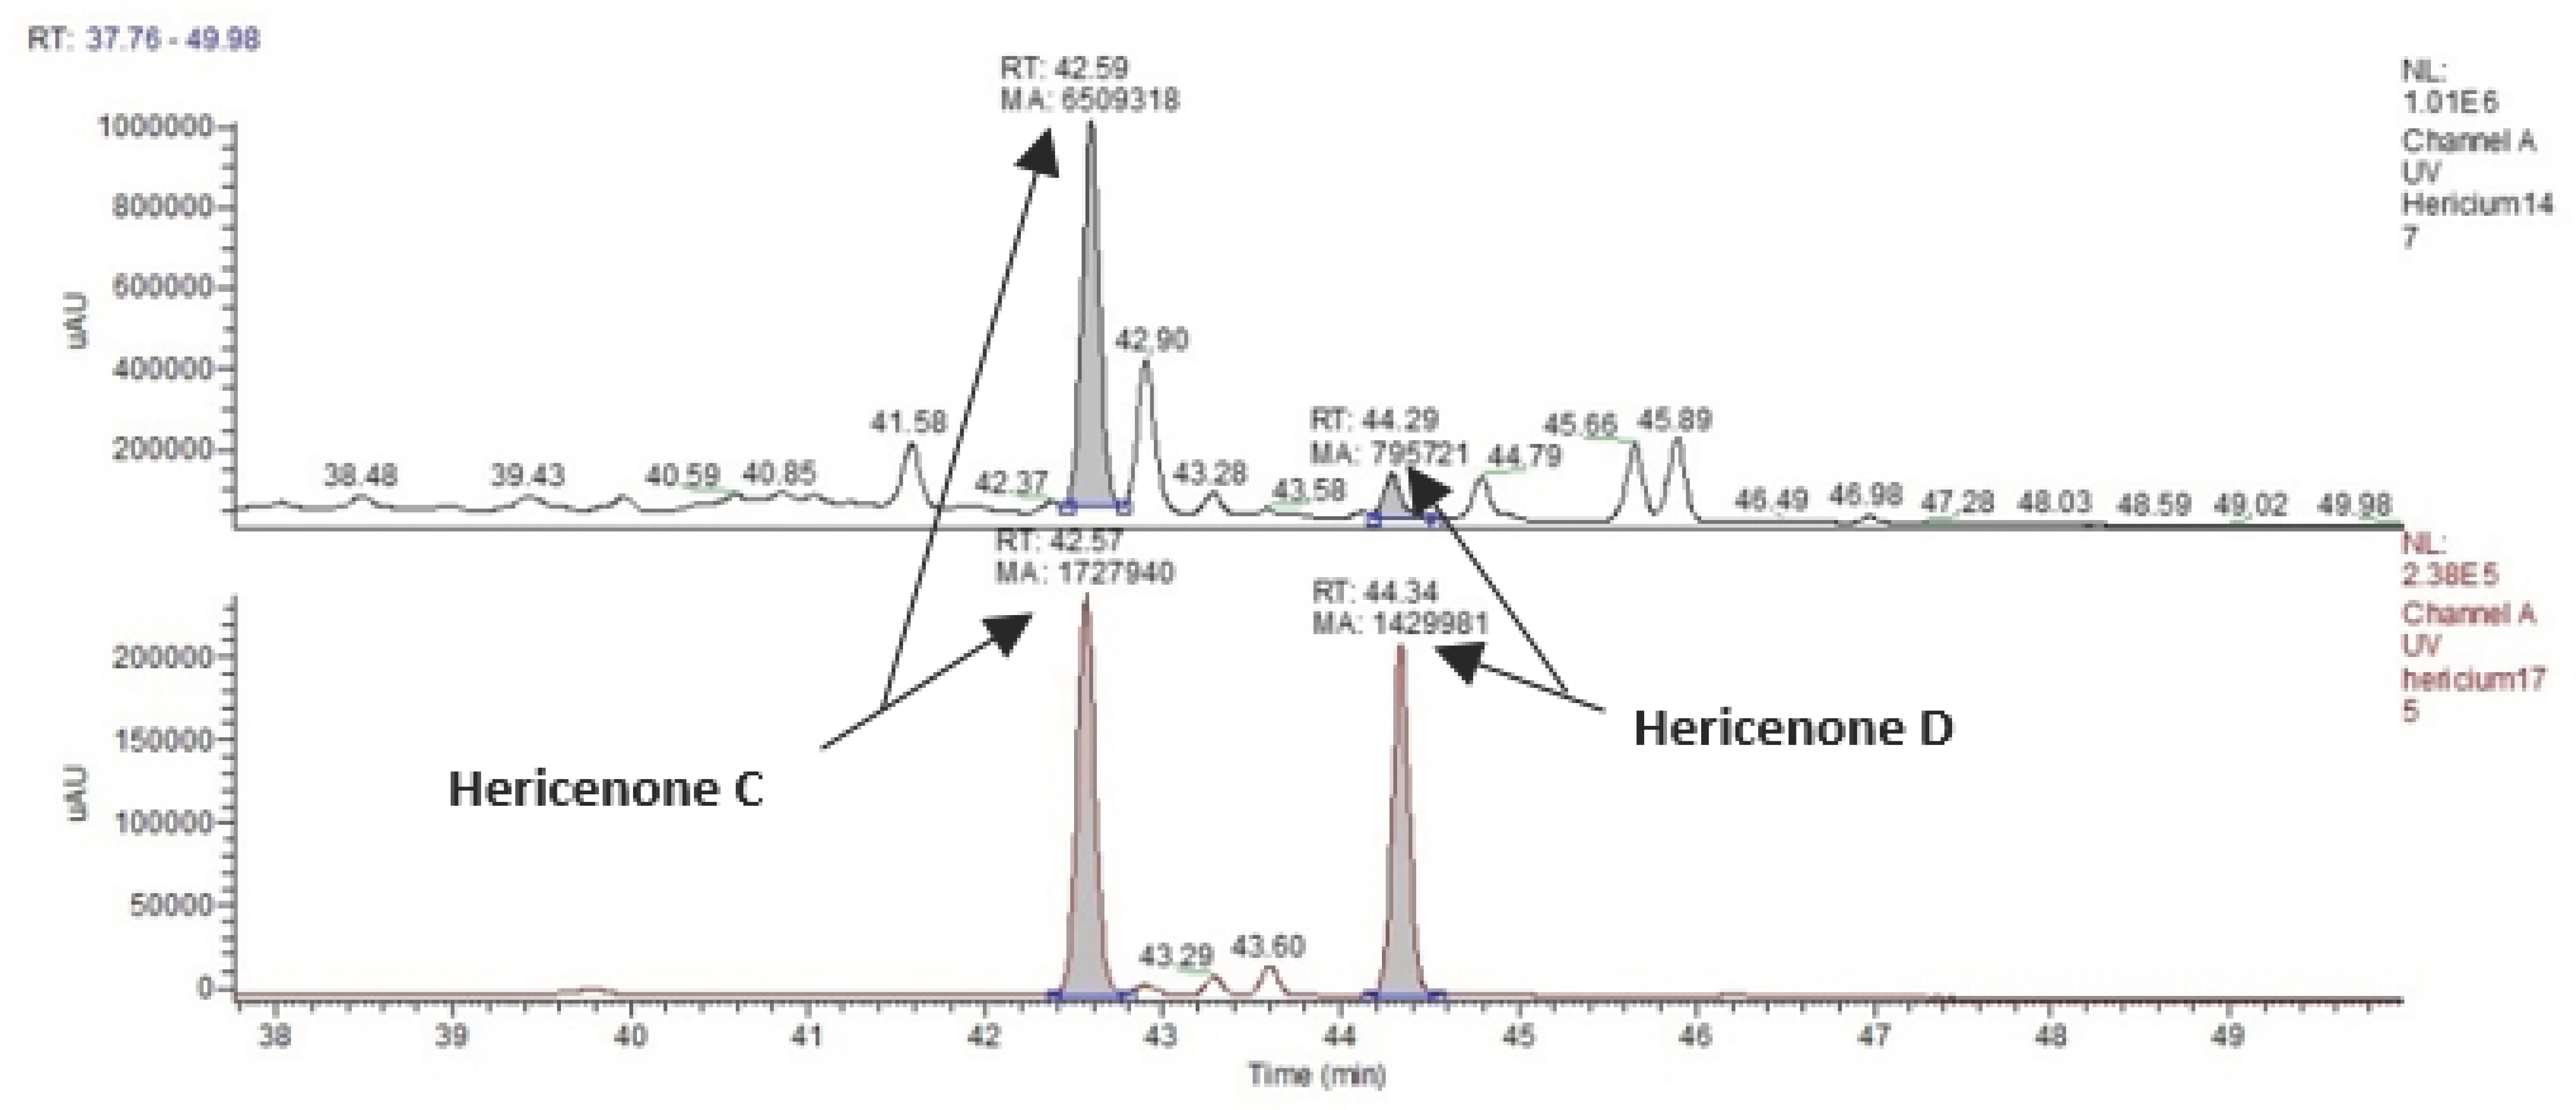
3.2. Identification and Quantification of Erinacine A, Hericenone C, and Hericenone D
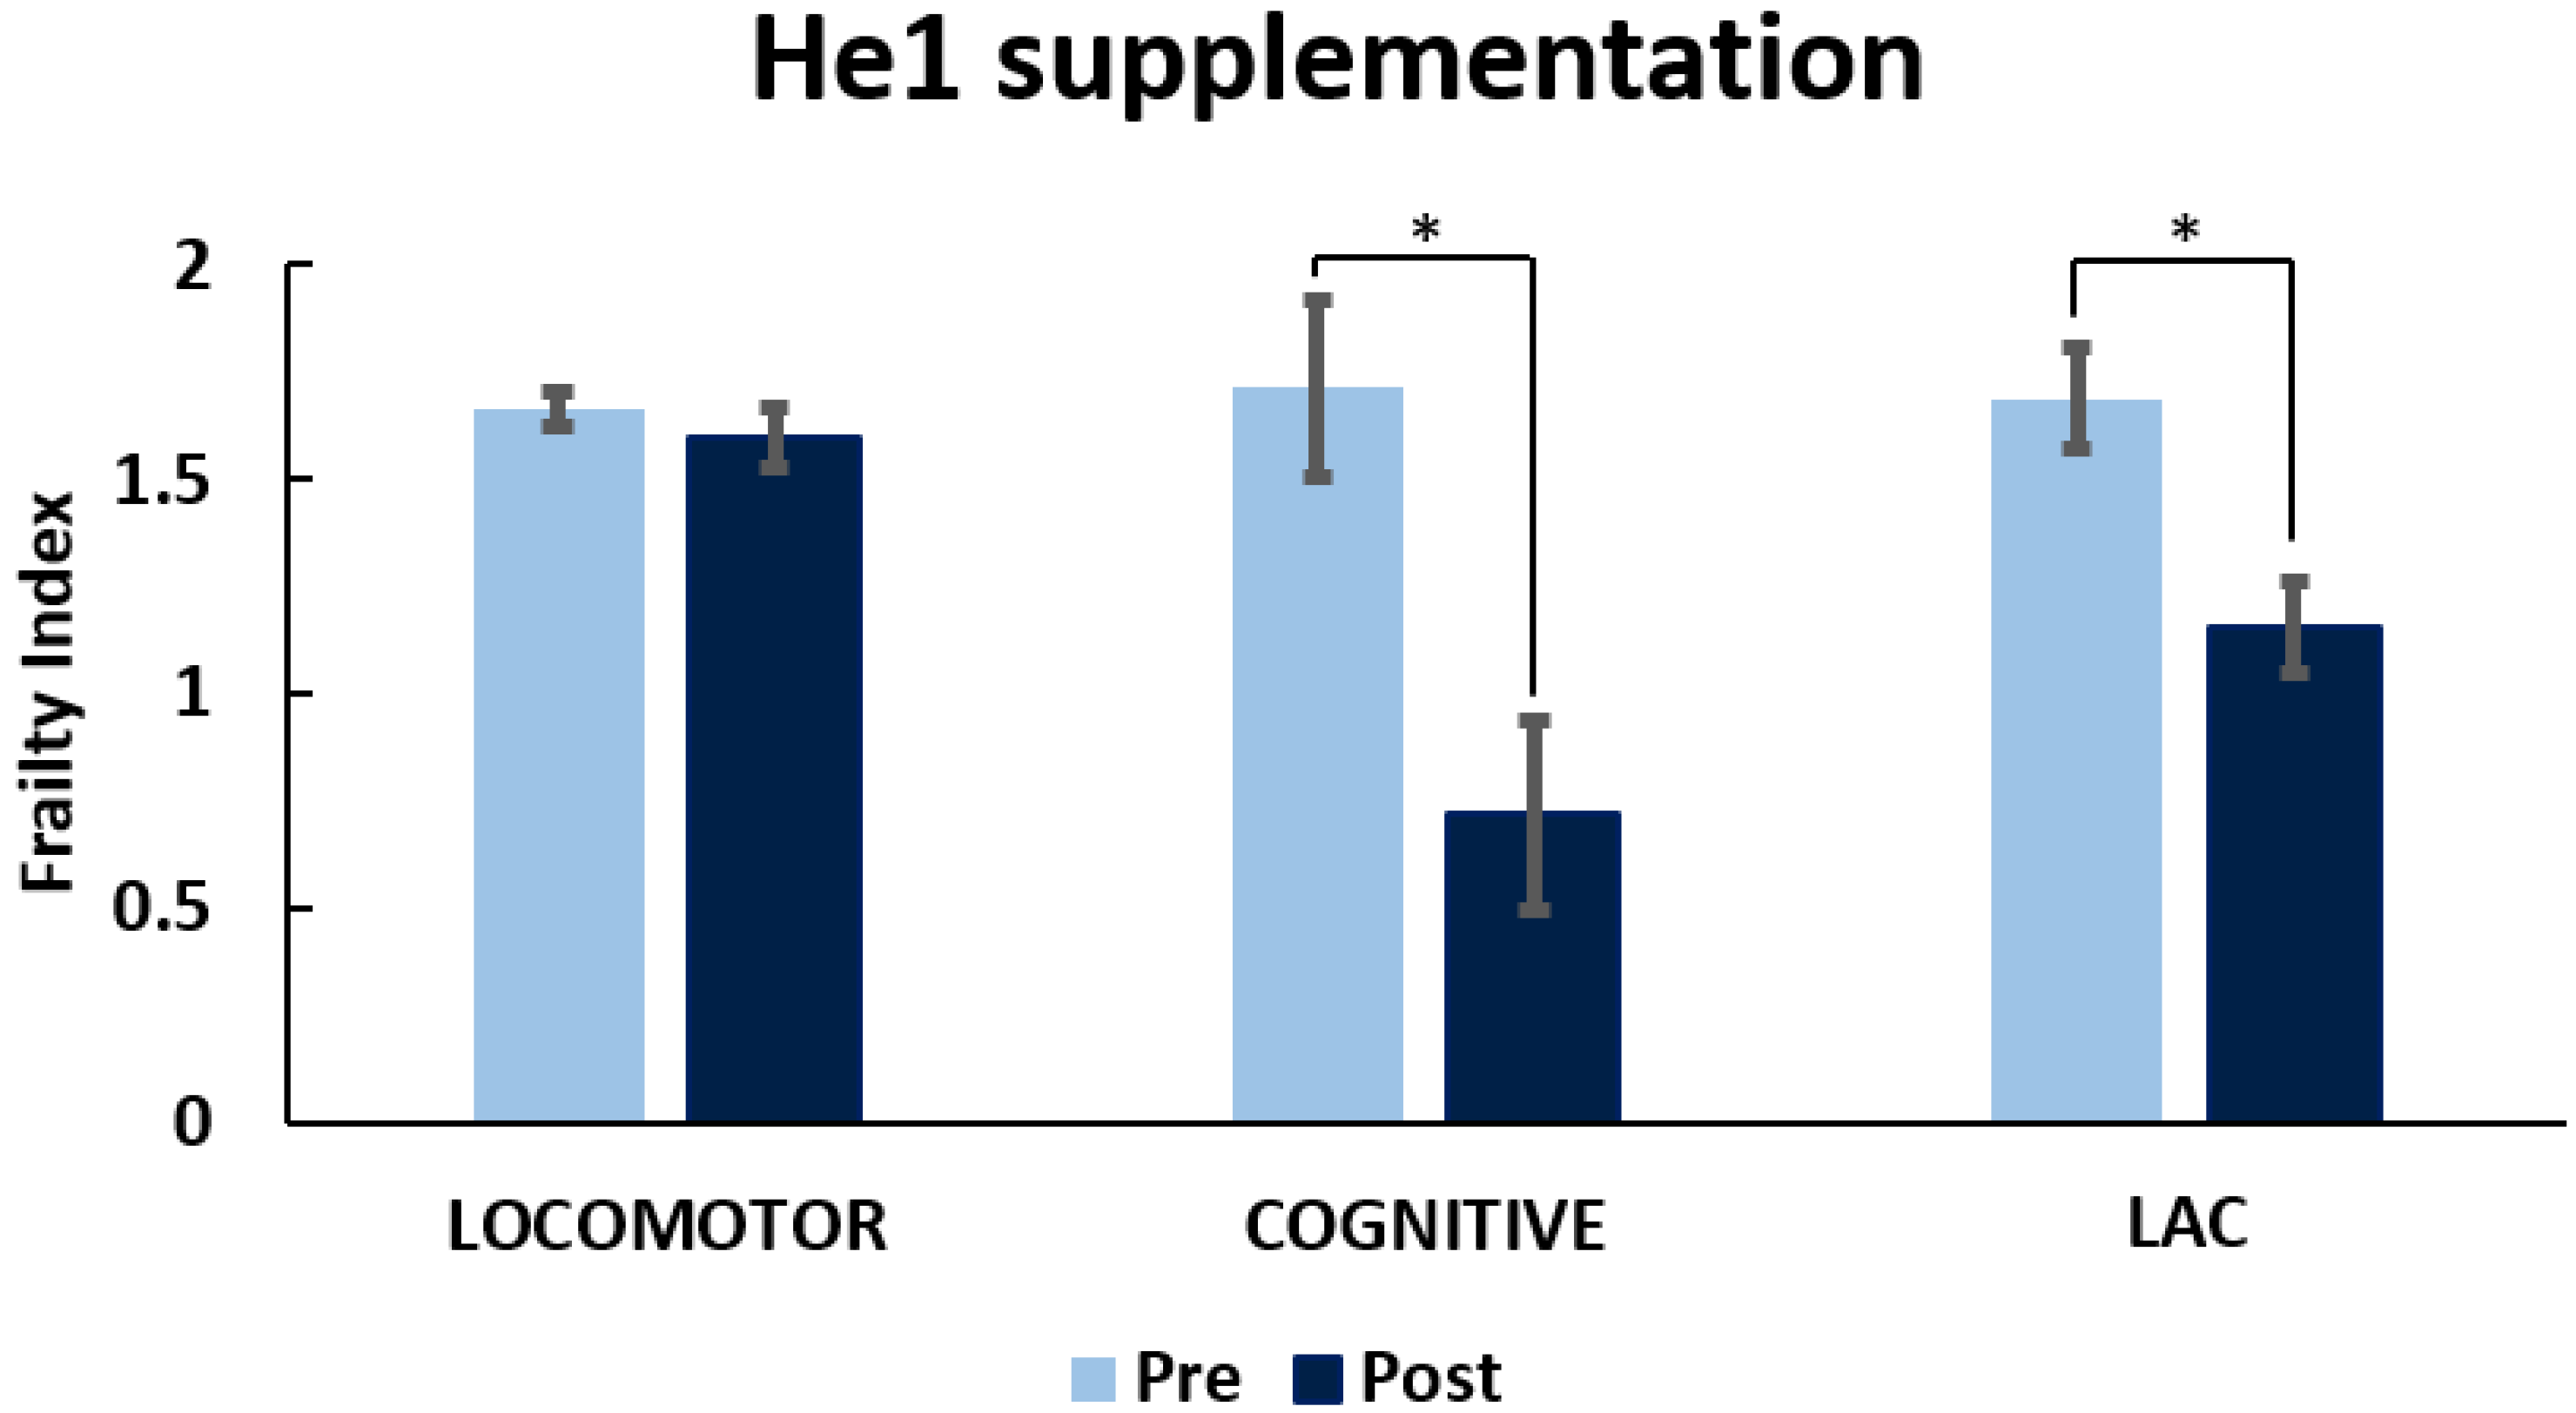
3.3. He1 Supplementation Improved Recognition Memory Performances during Aging
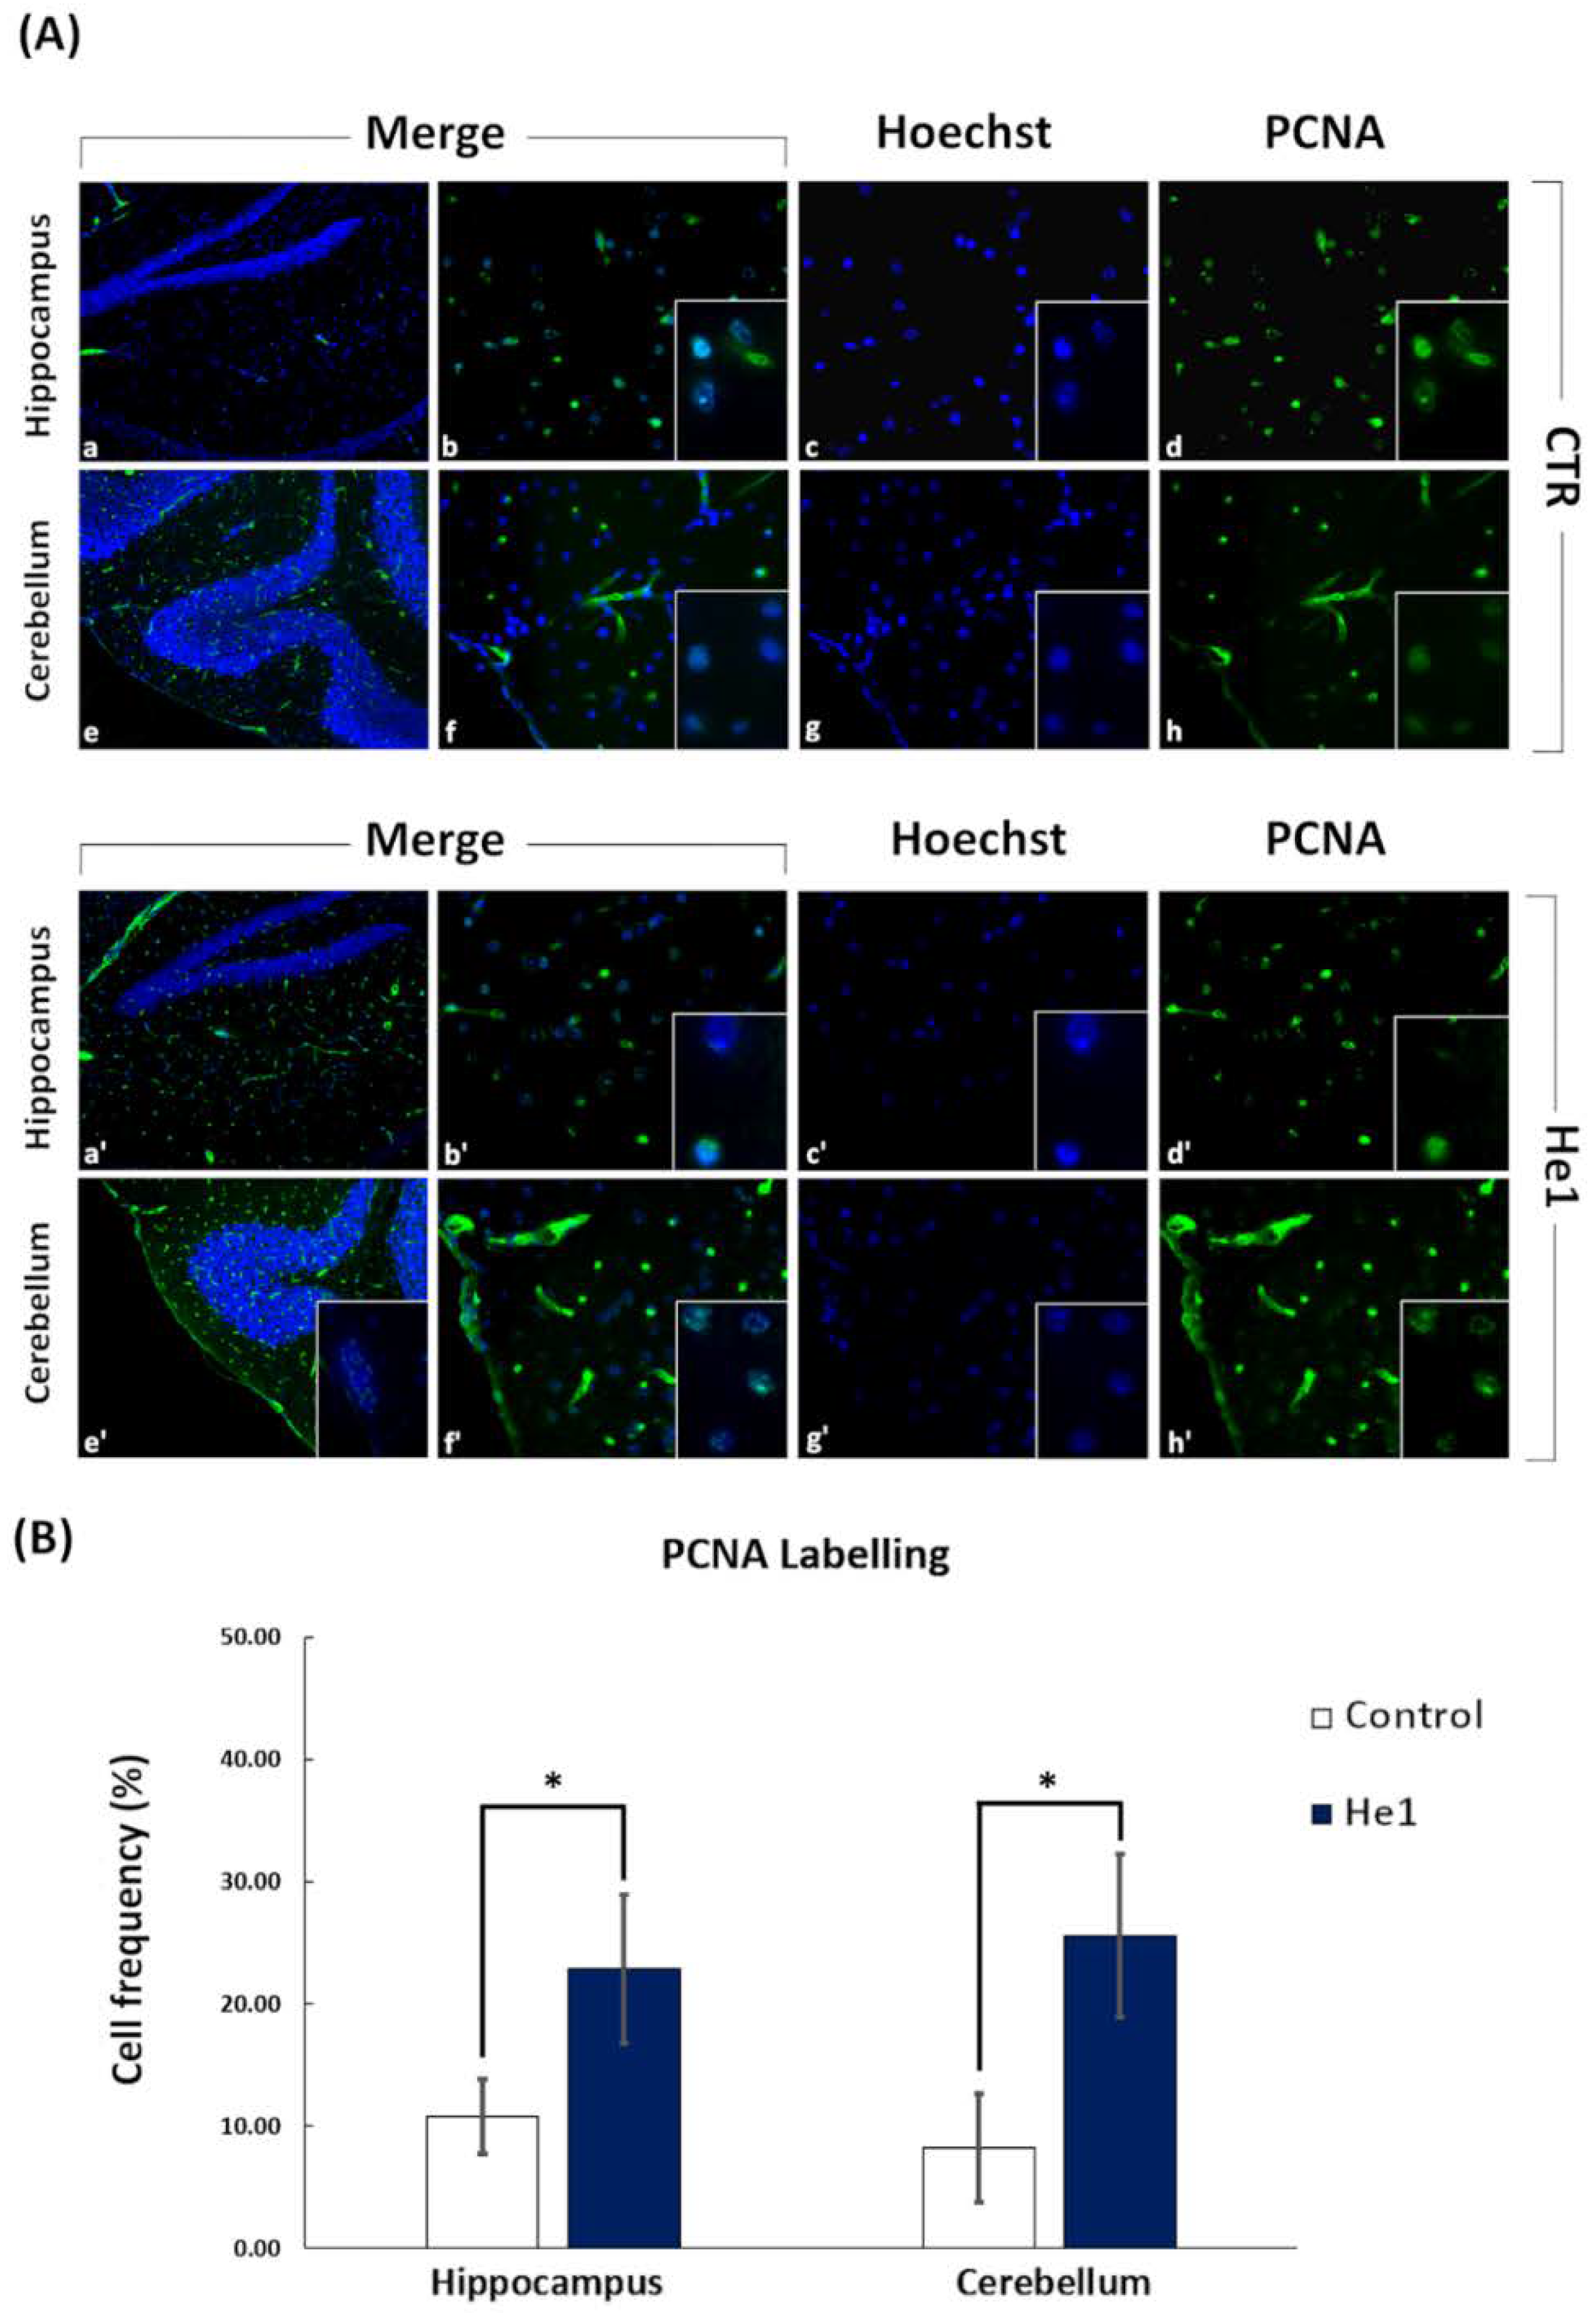
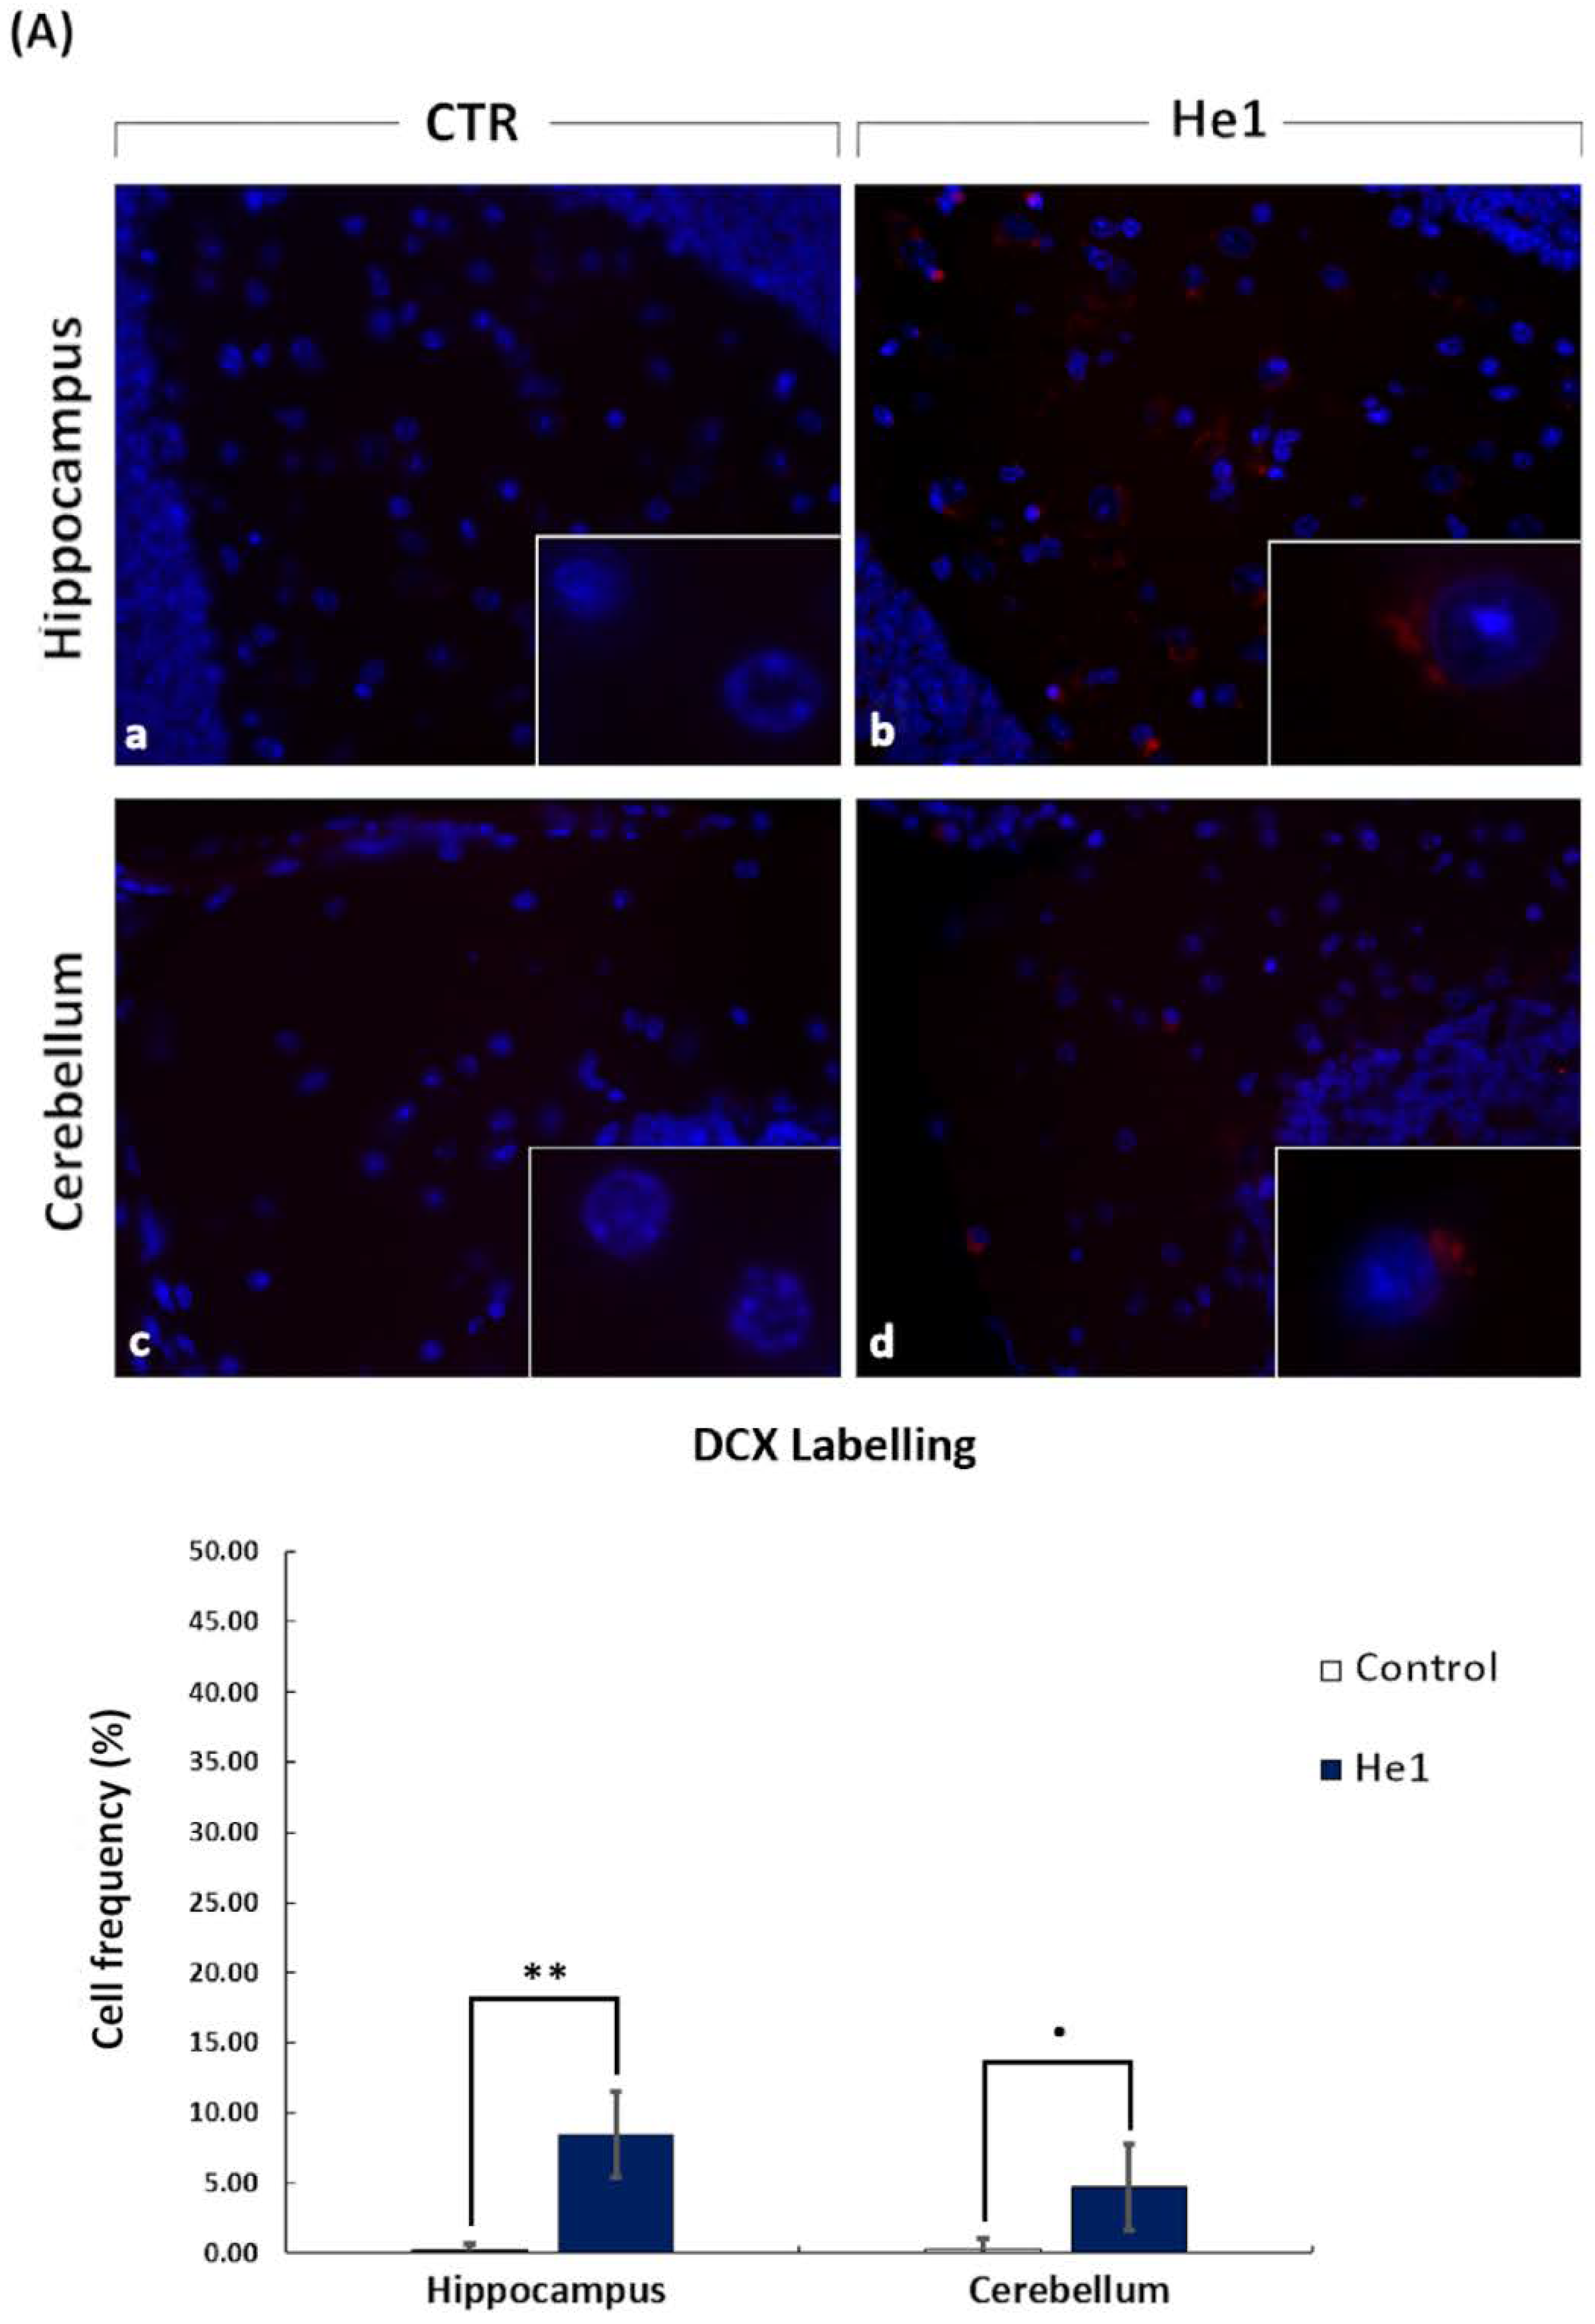
3.4. He1 Supplementation Improved Hippocampal and Cerebellum Proliferation and Neurogenesis
4. Discussion
5. Conclusions
Author Contributions
Funding
Acknowledgments
Conflicts of Interest
References
- Fried, L.P.; Tangen, C.M.; Walston, J.; Newman, A.B.; Hirsch, C.; Gottdiener, J.; Seeman, T.; Tracy, R.; Kop, W.J.; Burke, G.; et al. Frailty in older adults: Evidence for a phenotype. J. Gerontol. A Biol. Sci. Med. Sci. 2001, 56, 46–56. [Google Scholar] [CrossRef]
- Bandeen-Roche, K.; Xue, Q.L.; Ferrucci, L.; Walston, J.; Guralnik, J.M.; Chaves, P.; Zeger, S.L.; Fried, L.P. Phenotype of Frailty: Characterization in the women’s health and aging studies. J. Gerontol. A Biol. Sci. Med. Sci. 2001, 61, 262–266. [Google Scholar] [CrossRef]
- Hogan, D.B.; Mackinght, C.; Bergman, H. Models, definitions, and criteria of Frailty. Aging Clin. Exp. Res. 2003, 15, 1–29. [Google Scholar]
- Ferrucci, L.; Cavazzini, C.; Corsi, A.; Bartali, B.; Russo, C.R.; Lauretani, F.; Ferrucci, L.; Cavazzini, C.; Corsi, A.M.; Bartali, B.; et al. Biomarkers of frailty in older persons. J. Endocrinol. Investig. 2002, 25, 10–15. [Google Scholar] [PubMed]
- Taffet, G.E. Physiology of aging. In Geriatric Medicine; Springer: New York, NY, USA, 2003; pp. 27–35. [Google Scholar]
- Espinoza, S.E.; Jung, I.; Hazuda, H. Frailty transitions in the San Antonio Longitudinal Study of Aging. J. Am. Geriatr. Soc. 2012, 60, 652–660. [Google Scholar] [CrossRef] [PubMed]
- Boyle, P.A.; Buchman, A.S.; Wilson, R.S.; Leurgans, S.E.; Bennett, D.A. Physical frailty is associated with incident mild cognitive impairment in community-based older persons. J. Am. Geriatr. Soc. 2010, 58, 248–255. [Google Scholar] [CrossRef] [PubMed]
- Brodziak, A.; Brewczyński, A.; Bajor, G. Clinical significance of knowledge about the structure, function, and impairments of working memory. Med. Sci. Monit. 2013, 19, 327–338. [Google Scholar] [CrossRef] [PubMed]
- Sternberg, S.A.; Wershof-Schwartz, A.; Karunananthan, S.; Bergman, H.; Mark-Clarfield, A. The identification of frailty: A systematic literature review. J. Am. Geriatr. Soc. 2011, 59, 2129–2138. [Google Scholar] [CrossRef]
- Robertson, D.A.; Savva, G.M.; Kenny, R.A. Frailty and cognitive impairment-a review of the evidence and causal mechanisms. Ageing Res. Rev. 2013, 12, 840–851. [Google Scholar] [CrossRef]
- Auyeung, T.W.; Lee, J.S.W.; Kwok, T.; Woo, J. Physical frailty Predicts future cog-nitive decline a four-year Prospective study in 2737 cognitively normal olderadults. J. Nutr. Health Aging 2011, 15, 690–694. [Google Scholar] [CrossRef] [PubMed]
- Mitnitski, A.; Fallah, N.; Rockwood, K. A multistate model of cognitive dynamics in relation to frailty in older adults. Ann. Epidemiol. 2011, 21, 507–516. [Google Scholar] [CrossRef] [PubMed]
- Samper-Ternent, R.; Al-Snih, S.; Raji, M.A.; Markides, K.S.; Ottenbacher, K.J. Relationship between frailty and cognitive decline in older Mexican Americans. J. Am. Geriatr. Soc. 2008, 56, 1845–1852. [Google Scholar] [CrossRef] [PubMed]
- Aranda, M.P.; Ray, L.A.; Snih, S.A.; Ottenbacher, K.J.; Markides, K.S. The pro-tective effect of neighborhood composition on increasing frailty among older Mexican Americans: A barrio advantage? J. Aging Health 2011, 23, 1189–1217. [Google Scholar] [CrossRef]
- Doba, N.; Tokuda, Y.; Goldstein, N.E.; Kushiro, T.; Hinohara, S. A pilot trial to predict frailty syndrome: The Japanese Health Research Volunteer Study. Exp. Gerontol. 2012, 47, 638–643. [Google Scholar] [CrossRef] [PubMed]
- Raji, M.A.; Al Snih, S.; Ostir, G.V.; Markides, K.S.; Ottenbacher, K.J. Cognitive status and future risk of frailty in older Mexican Americans. J. Gerontol. Biol Sci Med Sci 2010, 65, 1228–1234. [Google Scholar] [CrossRef]
- Kawagishi, H.; Ando, M.; Mizuno, T. Hericenone A and B as cytotoxic principles from the mushroom Hericium erinaceum. Tetrahedron Lett. 1990, 31, 373–376. [Google Scholar] [CrossRef]
- Friedman, M. Chemistry, Nutrition, and Health-Promoting Properties of Hericium erinaceus (Lion’s Mane) Mushroom Fruiting Bodies and Mycelia and Their Bioactive Compounds. J. Agric. Food Chem. 2015, 63, 7108–7123. [Google Scholar] [CrossRef] [PubMed]
- He, X.; Wang, X.; Fang, J.; Chang, Y.; Ning, N.; Guo, H.; Huang, L.; Huang, X.; Zhao, Z. Structures, biological activities, and industrial applications of the polysaccharides from Hericium erinaceus (Lion’s Mane) mushroom: A review. Int. J. Biol. Macromol. 2017, 97, 228–237. [Google Scholar] [CrossRef] [PubMed]
- Cookson, R.; Barrett, T.N.; Barrett, A.G. β-Keto-dioxinones and β,δ-diketo-dioxinones in biomimetic resorcylate total synthesis. Acc. Chem. Res. 2015, 48, 628–642. [Google Scholar] [CrossRef] [PubMed]
- Wasser, S.P. Medicinal mushroom science: Current perspectives, advances, evidences, and challenges. Biomed. J. 2014, 37, 345–356. [Google Scholar] [CrossRef]
- Wasser, S.P. Medicinal Mushrooms in Human Clinical Studies. Part I. Anticancer, Oncoimmunological, and Immunomodulatory Activities: A Review. Int. J. Med. Mushrooms 2017, 19, 279–317. [Google Scholar] [CrossRef]
- Hazekawa, M.; Kataoka, A.; Hayakawa, K.; Uchimasu, T.; Furuta, R.; Irie, K.; Yoshida, M.; Fujioka, T.; Egashira, N.; Oishi, R.; et al. Neuroprotective effect of repeated treatment with Hericium erinaceum in mice subjected to middle cerebral artery occlusion. J. Health Sci. 2010, 56, 296–303. [Google Scholar] [CrossRef]
- Mori, K.; Inatomi, S.; Ouchi, K.; Azumi, Y.; Tuchida, T. Improving effects of the mushroom Yamabushitake (Hericium erinaceus) on mild cognitive impairment: A double-blind placebo-controlled clinical trial. Phytother. Res. 2009, 23, 367–372. [Google Scholar] [CrossRef] [PubMed]
- Kawagishi, H.; Zhuang, C. Compounds for dementia from Hericium erinaceum. Drug Future 2008, 33, 149–155. [Google Scholar] [CrossRef]
- Tsai-Teng, T.; Chin-Chu, C.; Li-Ya, L.; Wan-Ping, C.; Chung-Kuang, L.; Chien-Chang, S.; Chi-Ying, H.F.; Chien-Chih, C.; Shiao, Y.J. Erinacine A-enriched Hericium erinaceus mycelium ameliorates Alzheimer’s disease-related pathologies in APPswe/PS1dE9 transgenic mice. J. Biomed. Sci. 2016, 23, 49. [Google Scholar] [CrossRef] [PubMed]
- Mori, K.; Obara, Y.; Hirota, M.; Azumi, Y.; Kinugasa, S.; Inatomi, S.; Nakahata, N. Nerve growth factor-inducing activity of Hericium erinaceus in 1321N1 human astrocytoma cells. Biol. Pharm. Bull. 2008, 31, 1727–1732. [Google Scholar] [CrossRef]
- Kawagishi, H.; Shimada, A.; Hosokawa, S.; Mori, H.; Sakamoto, H.; Ishiguro, Y.; Sakemi, S.; Bordner, J.; Kojima, N.; Furukawa, S. Erinacines E, F, and G, stimulators of nerve growth factor (NGF)-synthesis, from the mycelia of Hericium erinaceum. Tetrahedron Lett. 1996, 37, 7399–7402. [Google Scholar] [CrossRef]
- Chiu, C.H.; Chyau, C.C.; Chen, C.C.; Lee, L.Y.; Chen, W.P.; Liu, J.L.; Lin, W.H.; Mong, M.C. Erinacine A-Enriched Hericium erinaceus Mycelium Produces Antidepressant-Like Effects through Modulating BDNF/PI3K/Akt/GSK-3β Signaling in Mice. Int. J. Mol. Sci. 2018, 19, 341. [Google Scholar] [CrossRef] [PubMed]
- Rupcic, Z.; Rascher, M.; Kanaki, S.; Köster, R.W.; Stadler, M.; Wittstein, K. Two New Cyathane Diterpenoids from Mycelial Cultures of the Medicinal Mushroom Hericium erinaceus and the Rare Species, Hericium flagellum. Int. J. Mol. Sci. 2018, 19, 740. [Google Scholar] [CrossRef]
- Wong, K.H.; Naidu, M.; David, P.; Abdulla, M.A.; Abdullah, N.; Kuppusamy, U.R.; Sabaratnam, V. Peripheral Nerve Regeneration Following Crush Injury to Rat Peroneal Nerve by Aqueous Extract of Medicinal Mushroom Hericium erinaceus (Bull.: Fr) Pers. (Aphyllophoromycetideae). Evid. Based Complement. Alternat. Med. 2011, 580752. [Google Scholar] [CrossRef]
- Brandalise, F.; Cesaroni, V.; Gregori, A.; Repetti, M.; Romano, C.; Orrù, G.; Botta, L.; Girometta, C.; Guglielminetti, M.L.; Savino, E.; et al. Dietary Supplementation of Hericium erinaceus Increases Mossy Fiber-CA3 Hippocampal Neurotransmission and Recognition Memory in Wild-Type Mice. Evid. Based Complement. Alternat. Med. 2017, 3864340. [Google Scholar] [CrossRef]
- Rossi, P.; Cesaroni, V.; Brandalise, F.; Occhinegro, A.; Ratto, D.; Perrucci, F.; Lanaia, V.; Girometta, C.; Orrù, G.; Savino, E. Dietary Supplementation of Lion’s Mane Medicinal Mushroom, Hericium erinaceus (Agaricomycetes), and Spatial Memory in Wild-Type Mice. Int. J. Med. Mushrooms 2018, 20, 485–494. [Google Scholar] [CrossRef]
- Kempermann, G.; Song, H.; Gage, F.H. Neurogenesis in the adult hippocampus. Cold Spring Harb. Perspect. Biol. 2015, 7. [Google Scholar] [CrossRef]
- Silvers, J.M.; Harrod, S.B.; Mactutus, C.F.; Booze, R.M. Automation of the novel object recognition task for use in adolescent rats. J. Neurosci. Methods 2007, 166, 99–103. [Google Scholar] [CrossRef] [PubMed]
- Parks, R.J.; Fares, E.; Macdonald, J.K.; Ernst, M.C.; Sinal, C.J.; Rockwood, K.; Howlett, S.E. A Procedure for Creating a Frailty Index Based on Deficit Accumulation in Aging Mice. J. Gerontol. Biol. Sci. Med. Sci. 2012, 67, 217–227. [Google Scholar] [CrossRef]
- Whitehead, J.C.; Hildebrand, B.A.; Sun, M.; Rockwood, M.R.; Rose, R.A.; Rockwood, K.; Howlett, S.E. A clinical frailty index in aging mice: Comparisons with frailty index data in humans. J. Gerontol. Biol. Sci. Med. Sci. 2014, 69, 621–632. [Google Scholar] [CrossRef] [PubMed]
- Cesaroni, V.; Brusoni, M.; Cusaro, C.M.; Girometta, C.; Perini, C.; Picco, A.M.; Rossi, P.; Salerni, E.; Savino, E. Phylogenetic comparison between Italian and worldwide Hericium species. IJMM 2019. submitted. [Google Scholar]
- Gerbec, B.; Tavčar, E.; Gregori, A.; Kreft, S.; Berovic, M. Solid State Cultivation of Hericium erinaceus Biomass and Erinacine: A Production. J. Bioproces. Biotech. 2015, 5, 1–5. [Google Scholar] [CrossRef]
- Kawagishi, H.; Ando, M.; Sakamoto, H.; Yoshida, S.; Ojima, F.; Ishiguro, Y.; Ukai, N.; Furukawa, S. Hericenones C, D and E, stimulators of nerve growth factor (NGF)-synthesis, from the mushroom Hericium erinaceum. Tetrahedron Lett. 1991, 32, 4561–4564. [Google Scholar] [CrossRef]
- Kawagishi, H.; Ando, M.; Sakamoto, H.; Yoshida, S.; Ojima, F.; Ishiguro, Y.; Ukai, N.; Furukawa, S. Erinacines A, B and C, strong stimulators of nerve growth factor (NGF)-synthesis, from the mycelia of Hericium erinaceum. Tetrahedron Lett. 1994, 35, 1569–1572. [Google Scholar] [CrossRef]
- D’Angelo, E.; Rossi, P.; DeFilippi, G.; Magistretti, J.; Taglietti, V. The relationship between synaptogenesis and expression of voltage-dependent currents in cerebellar granule cells in situ. J. Physiol. Paris 1994, 88, 197–207. [Google Scholar]
- Shi, J.; Zhong, X.; Song, Y.; Wu, Z.; Gao, P.; Zhao, J.; Sun, J.; Wang, J.; Liu, J.; Wang, Z. Long non-coding RNA RUNX1-IT1 plays a tumour-suppressive role in colorectal cancer by inhibiting cell proliferation and migration. Cell Biochem. Funct. 2019, 37, 11–20. [Google Scholar] [CrossRef] [PubMed]
- Ayanlaja, A.A.; Xiong, Y.; Gao, Y.; Ji, G.; Tang, C.; Abdikani Abdullah, Z.; Gao, D. Distinct Features of Doublecortin as a Marker of Neuronal Migration and Its Implications in Cancer Cell Mobility. Front. Mol. Neurosci. 2017, 10, 199. [Google Scholar] [CrossRef]
- Dutta, S.; Sengupta, P. Men and mice: Relating their ages. Life Sci. 2016, 152, 244–248. [Google Scholar] [CrossRef] [PubMed]
- Sternberg Task. Dual Mechanisms of Cognitive Control, Washington University in St. Louis. Available online: http://pages.wustl.edu/dualmechanisms/sternberg-task#sbergdesc (accessed on 26 March 2019).
- Nosofsky, R.M.; Little, D.R.; Donkin, C.; Fific, M. Short-term memory scanning viewed as exemplar-based categorization. Psychol. Rev. 2011, 118, 280–315. [Google Scholar] [CrossRef] [PubMed]
- Brodziak, A.; Kołat, E.; Różyk-Myrta, A. In Search of Memory Tests Equivalent for Experiments on Animals and Humans. Med. Sci. Monit. 2014, 20, 2733–2739. [Google Scholar] [CrossRef]
- Ennaceur, A.L.; Michalikova, S.; Bradford, A.; Ahmed, S. Detailed analysis of the behavior of Lister and Wistar rats in anxiety, object recognition and object location tasks. Behav. Brain. Res. 2005, 159, 247–266. [Google Scholar] [CrossRef] [PubMed]
- Krzyczkowski, W.; Malinowska, E.; Herold, F. Erinacine A biosynthesis in submerged cultivation of Hericium erinaceum: Quantification and improved cultivation. Eng. Life Sci. 2010, 10, 446–457. [Google Scholar] [CrossRef]
- Chen, C.C.; Tzeng, T.T.; Chen, C.C.; Ni, C.L.; Lee, L.Y.; Chen, W.P.; Shiao, Y.J.; Shen, C.C. Erinacine S, a rare sesterterpene from the mycelia of Hericium erinaceus. J. Nat. Prod. 2016, 79, 438–441. [Google Scholar] [CrossRef] [PubMed]
- Lee, D.G.; Kang, H.W.; Park, C.G.; Ahn, Y.S.; Shin, Y. Isolation and identification of phytochemicals and biological activities of Hericium ernaceus and their contents in Hericium strains using HPLC/UV analysis. J. Ethnopharmacol. 2016, 184, 219–225. [Google Scholar] [CrossRef] [PubMed]
- Kawagishi, H.; Mori, H.; Uno, A.; Kimura, A.; Chiba, S. A sialic acid-binding lectin from the mushroom Hericium erinaceum. FEBS Lett. 1994, 340, 56–58. [Google Scholar] [CrossRef]
- Tzeng, T.T.; Chen, C.C.; Chen, C.C.; Tsay, H.J.; Lee, L.Y.; Chen, W.P.; Shen, C.C.; Shiao, Y.J. The cyanthin diterpenoid and sesterterpene constituents of Hericium erinaceus mycelium ameliorate Alzheimer’s disease-related pathologies in APP/PS1 transgenic mice. Int. J. Mol. Sci. 2018, 19, 598. [Google Scholar] [CrossRef]
- Li, I.C.; Lee, L.Y.; Tzeng, T.T.; Chen, W.P.; Chen, Y.P.; Shiao, Y.J.; Chen, C.C. Neurohealth Properties of Hericium erinaceus Mycelia Enriched with Erinacines. Behav. Neurol. 2018, 1–10. [Google Scholar] [CrossRef] [PubMed]
- Ryu, S.; Kim, H.G.; Kim, J.Y.; Kim, S.Y.; Cho, K.O. Hericium erinaceus Extract Reduces Anxiety and Depressive Behaviors by Promoting Hippocampal Neurogenesis in the Adult Mouse Brain. J. Med. Food. 2018, 21, 174–180. [Google Scholar] [CrossRef] [PubMed]
- Kolotushkina, E.V.; Moldavan, M.G.; Voronin, K.Y.; Skibo, G.G. The influence of Hericium erinaceus extract on myelination process in vitro. Fiziol. Zhurnal 2003, 49, 38–45. [Google Scholar]
- Trovato, R.; Siracusa, R.; Di Paola, M.; Scuto, M.L.; Ontario, O.; Bua, P.; Di Mauro, M.A.; Toscano, C.C.T.; Petralia, L.; Maiolino, A.; et al. Redox modulation of cellular stress response and lipoxin A4 expression by Hericium Erinaceus in rat brain: Relevance to Alzheimer’s disease pathogenesis. Immun. Ageing 2016, 13, 23. [Google Scholar] [CrossRef] [PubMed]
- Ahlfeld, J.; Filser, S.; Schmidt, F.; Wefers, A.K.; Merk, D.J.; Glaß8, R.; Herms, J.; Schüller, U. Neurogenesis from Sox2 expressing cells in the adult cerebellar cortex. Sci. Rep. 2017, 7, 6137. [Google Scholar] [CrossRef] [PubMed]
- Lauretani, F.; Meschi, T.; Ticinesi, A.; Maggio, M. “Brain-muscle loop” in the fragility of older persons: From pathophysiology to new organizing models. Aging Clin. Exp. Res. 2017, 6, 1305–1311. [Google Scholar] [CrossRef]


| Test | Locomotor Parameters | Cognitive Parameters |
|---|---|---|
| Emergence | Resting Time In (s) Total Distance In (cm) | Exit Number (n) Latency of First Exit (s) Time of Exploration (s) |
| NOR | (Open Arena) Resting Time (s) Total Distance (cm) Max Speed (cm/s) Mean Speed (cm/s) | Number of Approaches: DI Time of Approaches: DI |
| Molecular Formula | Molecular Weight (g/moL) | Chemical Structure | Characteristic Ions (m/z) | Content (µg/g) | |
|---|---|---|---|---|---|
| Erinacine A | C25H36O6 | 432.56 |  | 455 [M+Na]+ 452 [2M+K+H]2+ 668 [3M+K+H]2+ 949 [2M+HCOOH+K]+ | 150 in mycelium |
| Hericenone C | C35H54O6 | 570.81 |  R = Palmitoyl | 571 [M+H]+ 593 [M+Na]+ | 500 in basidioma |
| Hericenone D | C37H58O6 | 598.87 | 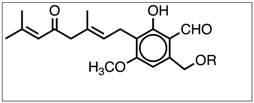 R = Stearoyl | 599 [M+H]+ 621 [M+Na]+ | <20 in basidioma |
© 2019 by the authors. Licensee MDPI, Basel, Switzerland. This article is an open access article distributed under the terms and conditions of the Creative Commons Attribution (CC BY) license (http://creativecommons.org/licenses/by/4.0/).
Share and Cite
Ratto, D.; Corana, F.; Mannucci, B.; Priori, E.C.; Cobelli, F.; Roda, E.; Ferrari, B.; Occhinegro, A.; Di Iorio, C.; De Luca, F.; et al. Hericium erinaceus Improves Recognition Memory and Induces Hippocampal and Cerebellar Neurogenesis in Frail Mice during Aging. Nutrients 2019, 11, 715. https://doi.org/10.3390/nu11040715
Ratto D, Corana F, Mannucci B, Priori EC, Cobelli F, Roda E, Ferrari B, Occhinegro A, Di Iorio C, De Luca F, et al. Hericium erinaceus Improves Recognition Memory and Induces Hippocampal and Cerebellar Neurogenesis in Frail Mice during Aging. Nutrients. 2019; 11(4):715. https://doi.org/10.3390/nu11040715
Chicago/Turabian StyleRatto, Daniela, Federica Corana, Barbara Mannucci, Erica Cecilia Priori, Filippo Cobelli, Elisa Roda, Beatrice Ferrari, Alessandra Occhinegro, Carmine Di Iorio, Fabrizio De Luca, and et al. 2019. "Hericium erinaceus Improves Recognition Memory and Induces Hippocampal and Cerebellar Neurogenesis in Frail Mice during Aging" Nutrients 11, no. 4: 715. https://doi.org/10.3390/nu11040715
APA StyleRatto, D., Corana, F., Mannucci, B., Priori, E. C., Cobelli, F., Roda, E., Ferrari, B., Occhinegro, A., Di Iorio, C., De Luca, F., Cesaroni, V., Girometta, C., Bottone, M. G., Savino, E., Kawagishi, H., & Rossi, P. (2019). Hericium erinaceus Improves Recognition Memory and Induces Hippocampal and Cerebellar Neurogenesis in Frail Mice during Aging. Nutrients, 11(4), 715. https://doi.org/10.3390/nu11040715