Nutrition Risk is Associated with Leukocyte Telomere Length in Middle-Aged Men and Women with at Least One Risk Factor for Cardiovascular Disease


Abstract
1. Introduction
2. Materials and Methods
2.1. Study Design and Participants
2.2. Diet Quality and Nutrition Risk Assessment
2.3. Relative Leukocyte Telomere Length
2.4. Potential Confounding Variables
2.4.1. Sociodemographic and Lifestyle Factors
2.4.2. Health-Related Factors
2.5. Statistical Analyses
3. Results
3.1. Sociodemographic, Lifestyle and Health-related Characteristics
3.2. Diet Quality and Nutrition Risk
4. Discussion
5. Conclusions
Author Contributions
Acknowledgments
Conflicts of Interest
References
- Sanders, J.L.; Newman, A.B. Telomere length in epidemiology: A biomarker of aging, age-related disease, both, or neither? Epidemiol. Rev. 2013, 35, 112–131. [Google Scholar] [CrossRef] [PubMed]
- Demissie, S.; Levy, D.; Benjamin, E.J.; Cupples, L.A.; Gardner, J.P.; Herbert, A.; Kimura, M.; Larson, M.G.; Meigs, J.B.; Keaney, J.F.; et al. Insulin resistance, oxidative stress, hypertension, and leukocyte telomere length in men from the Framingham Heart Study. Aging Cell 2006, 5, 325–330. [Google Scholar] [CrossRef] [PubMed]
- Reichert, S.; Stier, A. Does oxidative stress shorten telomeres in vivo? A review. Biol. Lett. 2017, 13. [Google Scholar] [CrossRef] [PubMed]
- Blackburn, E.H.; Epel, E.S.; Lin, J. Human telomere biology: A contributory and interactive factor in aging, disease risks, and protection. Science 2015, 350, 1193–1198. [Google Scholar] [CrossRef] [PubMed]
- Childs, B.G.; Durik, M.; Baker, D.J.; van Deursen, J.M. Cellular senescence in aging and age-related disease: From mechanisms to therapy. Nat. Med. 2015, 21, 1424–1435. [Google Scholar] [CrossRef] [PubMed]
- Peng, H.; Mete, M.; Desale, S.; Fretts, A.M.; Cole, S.A.; Best, L.G.; Lin, J.; Blackburn, E.; Lee, E.T.; Howard, B.V.; et al. Leukocyte telomere length and ideal cardiovascular health in American Indians: The Strong Heart Family Study. Eur. J. Epidemiol. 2017, 32, 67–75. [Google Scholar] [CrossRef] [PubMed]
- Gebreab, S.Y.; Manna, Z.G.; Khan, R.J.; Riestra, P.; Xu, R.; Davis, S.K. Less Than Ideal Cardiovascular Health Is Associated with Shorter Leukocyte Telomere Length: The National Health and Nutrition Examination Surveys, 1999–2002. J. Am. Heart Assoc. 2017, 6, e004105. [Google Scholar] [CrossRef] [PubMed]
- Mundstock, E.; Sarria, E.E.; Zatti, H.; Mattos Louzada, F.; Kich Grun, L.; Herbert Jones, M.; Guma, F.T.C.R.; Mazzola In Memoriam, J.; Epifanio, M.; Stein, R.T.; et al. Effect of obesity on telomere length: Systematic review and meta-analysis. Obesity 2015, 23, 2165–2174. [Google Scholar] [CrossRef] [PubMed]
- Gardner, J.P.; Li, S.; Srinivasan, S.R.; Chen, W.; Kimura, M.; Lu, X.; Berenson, G.S.; Aviv, A. Rise in insulin resistance is associated with escalated telomere attrition. Circulation 2005, 111, 2171–2177. [Google Scholar] [CrossRef] [PubMed]
- Tamura, Y.; Takubo, K.; Aida, J.; Araki, A.; Ito, H. Telomere attrition and diabetes mellitus. Geriatr. Gerontol. Int. 2016, 16 (Suppl. 1), 66–74. [Google Scholar] [CrossRef] [PubMed]
- Bär, C.; Blasco, M.A. Telomeres and telomerase as therapeutic targets to prevent and treat age-related diseases. F1000Research 2016, 5. [Google Scholar] [CrossRef] [PubMed]
- Slagboom, P.E.; Droog, S.; Boomsma, D.I. Genetic determination of telomere size in humans: A twin study of three age groups. Am. J. Hum. Genet. 1994, 55, 876–882. [Google Scholar] [PubMed]
- Crous-Bou, M.; Fung, T.T.; Prescott, J.; Julin, B.; Du, M.; Sun, Q.; Rexrode, K.M.; Hu, F.B.; De Vivo, I. Mediterranean diet and telomere length in Nurses’ Health Study: Population based cohort study. BMJ 2014, 349, g6674. [Google Scholar] [CrossRef] [PubMed]
- Tucker, L.A. Dietary Fiber and Telomere Length in 5674 U.S. Adults: An NHANES Study of Biological Aging. Nutrients 2018, 10, 400. [Google Scholar]
- Tucker, L.A. Consumption of Nuts and Seeds and Telomere Length in 5582 Men and Women of the National Health and Nutrition Examination Survey (NHANES). J. Nutr. Health Aging 2017, 21, 233–240. [Google Scholar] [CrossRef] [PubMed]
- Rafie, N.; Golpour Hamedani, S.; Barak, F.; Safavi, S.M.; Miraghajani, M. Dietary patterns, food groups and telomere length: A systematic review of current studies. Eur. J. Clin. Nutr. 2017, 71, 151–158. [Google Scholar] [CrossRef] [PubMed]
- Song, Y.; You, N.-C.Y.; Song, Y.; Kang, M.K.; Hou, L.; Wallace, R.; Eaton, C.B.; Tinker, L.F.; Liu, S. Intake of small-to-medium-chain saturated fatty acids is associated with peripheral leukocyte telomere length in postmenopausal women. J. Nutr. 2013, 143, 907–914. [Google Scholar] [CrossRef] [PubMed]
- Leung, C.W.; Laraia, B.A.; Needham, B.L.; Rehkopf, D.H.; Adler, N.E.; Lin, J.; Blackburn, E.H.; Epel, E.S. Soda and cell aging: Associations between sugar-sweetened beverage consumption and leukocyte telomere length in healthy adults from the National Health and Nutrition Examination Surveys. Am. J. Public Health 2014, 104, 2425–2431. [Google Scholar] [CrossRef] [PubMed]
- Fretts, A.M.; Howard, B.V.; Siscovick, D.S.; Best, L.G.; Beresford, S.A.; Mete, M.; Eilat-Adar, S.; Sotoodehnia, N.; Zhao, J. Processed Meat, But Not Unprocessed Red Meat, Is Inversely Associated with Leukocyte Telomere Length in the Strong Heart Family Study. J. Nutr. 2016, 146, 2013–2018. [Google Scholar] [CrossRef] [PubMed]
- Leung, C.W.; Fung, T.T.; McEvoy, C.T.; Lin, J.; Epel, E.S. Diet Quality Indices and Leukocyte Telomere Length among Healthy US Adults: Data from the National Health and Nutrition Examination Surveys (NHANES) 1999–2002. Am. J. Epidemiol. 2018, 187, 2192–2201. [Google Scholar] [CrossRef] [PubMed]
- Reedy, J.; Krebs-Smith, S.M.; Miller, P.E.; Liese, A.D.; Kahle, L.L.; Park, Y.; Subar, A.F. Higher diet quality is associated with decreased risk of all-cause, cardiovascular disease, and cancer mortality among older adults. J. Nutr. 2014, 144, 881–889. [Google Scholar] [CrossRef] [PubMed]
- Segal, L.M.; Rayburn, J.; Beck, S.E. The State of Obesity: Better Policies for a Healthier America 2017; Robert Wood Johnson Foundation: Princeton, NJ, USA, 2017; p. 108. [Google Scholar]
- Lee-Kwan, S.H.; Moore, L.V.; Blanck, H.M.; Harris, D.M.; Galuska, D. Disparities in State-Specific Adult Fruit and Vegetable Consumption—United States, 2015. MMWR Morb. Mortal. Wkly. Rep. 2017, 66, 1241–1247. [Google Scholar] [CrossRef] [PubMed]
- Nutrition Coordination Center (NCC), University of Minnesota. Guide to Creating Variables, Needed to Calculate Scores for Each Component of the Healthy Eating Index-2015 (HEI-2015). Available online: http://www.ncc.umn.edu/ndsrsupport/hei2015.pdf (accessed on 16 August 2017).
- National Cancer Institute Division of Cancer Control and Population Sciences. The Healthy Eating Index Research Uses: Overview of the Methods & Calculations. Available online: https://epi.grants.cancer.gov/hei/hei-methods-and-calculations.html (accessed on 2 July 2018).
- Developing the Healthy Eating Index. Available online: https://epi.grants.cancer.gov/hei/developing.html (accessed on 20 November 2018).
- Fung, T.T.; Rexrode, K.M.; Mantzoros, C.S.; Manson, J.E.; Willett, W.C.; Hu, F.B. Mediterranean diet and incidence of and mortality from coronary heart disease and stroke in women. Circulation 2009, 119, 1093–1100. [Google Scholar] [CrossRef] [PubMed]
- Fung, T.T.; McCullough, M.L.; Newby, P.K.; Manson, J.E.; Meigs, J.B.; Rifai, N.; Willett, W.C.; Hu, F.B. Diet-quality scores and plasma concentrations of markers of inflammation and endothelial dysfunction. Am. J. Clin. Nutr. 2005, 82, 163–173. [Google Scholar] [CrossRef] [PubMed]
- Bailey, R.L.; Miller, P.E.; Mitchell, D.C.; Hartman, T.J.; Lawrence, F.R.; Sempos, C.T.; Smiciklas-Wright, H. Dietary screening tool identifies nutritional risk in older adults123. Am. J. Clin. Nutr. 2009, 90, 177–183. [Google Scholar] [CrossRef] [PubMed]
- Ventura Marra, M.; Thuppal, S.V.; Johnson, E.J.; Bailey, R.L. Validation of a Dietary Screening Tool in a Middle-Aged Appalachian Population. Nutrients 2018, 10, 345. [Google Scholar] [CrossRef] [PubMed]
- Cawthon, R.M. Telomere measurement by quantitative PCR. Nucleic Acids Res. 2002, 30, e47. [Google Scholar] [CrossRef] [PubMed]
- Harris, P.A.; Taylor, R.; Thielke, R.; Payne, J.; Gonzalez, N.; Conde, J.G. Research electronic data capture (REDCap)—A metadata-driven methodology and workflow process for providing translational research informatics support. J. Biomed. Inform. 2009, 42, 377–381. [Google Scholar] [CrossRef] [PubMed]
- Craig, C.L.; Marshall, A.L.; Sjöström, M.; Bauman, A.E.; Booth, M.L.; Ainsworth, B.E.; Pratt, M.; Ekelund, U.; Yngve, A.; Sallis, J.F.; et al. International physical activity questionnaire: 12-country reliability and validity. Med. Sci. Sports Exerc. 2003, 35, 1381–1395. [Google Scholar] [CrossRef] [PubMed]
- International Physical Activity Questionnaire. IPAQ (2005) Guidelines for Data Processing and Analysis of the International Physical Activity Questionnaire (IPAQ)—Short and Long Forms, Revised on November 2005. Available online: https://sites.google.com/site/theipaq/scoring-protocol (accessed on 14 December 2017).
- Buysse, D.J.; Reynolds, C.F.; Monk, T.H.; Berman, S.R.; Kupfer, D.J. The Pittsburgh Sleep Quality Index: A new instrument for psychiatric practice and research. Psychiatry Res. 1989, 28, 193–213. [Google Scholar] [CrossRef]
- Bosy-Westphal, A.; Jensen, B.; Braun, W.; Pourhassan, M.; Gallagher, D.; Müller, M.J. Quantification of whole-body and segmental skeletal muscle mass using phase-sensitive 8-electrode medical bioelectrical impedance devices. Eur. J. Clin. Nutr. 2017, 71, 1061. [Google Scholar] [CrossRef] [PubMed]
- National Heart, Lung, and Blood Institute. Classification of Overweight and Obesity by BMI, Waist Circumference, and Associated Disease Risks. Available online: https://www.nhlbi.nih.gov/health/educational/lose_wt/BMI/bmi_dis.htm (accessed on 16 August 2017).
- Rebholz, C.M.; Anderson, C.A.M.; Grams, M.E.; Bazzano, L.A.; Crews, D.C.; Chang, A.R.; Coresh, J.; Appel, L.J. Relationship of the American Heart Association’s Impact Goals (Life’s Simple 7) with Risk of Chronic Kidney Disease: Results from the Atherosclerosis Risk in Communities (ARIC) Cohort Study. J. Am. Heart Assoc. Cardiovasc. Cerebrovasc. Dis. 2016, 5, e003192. [Google Scholar] [CrossRef] [PubMed]
- Akaike, H. A new look at the statistical model identification. IEEE Trans. Autom. Control 1974, 19, 716–723. [Google Scholar] [CrossRef]
- Hurvich, C.M.; Tsai, C.-L. Regression and time series model selection in small samples. Biometrika 1989, 76, 297–307. [Google Scholar] [CrossRef]
- Åsgård, R.; Rytter, E.; Basu, S.; Abramsson-Zetterberg, L.; Möller, L.; Vessby, B. High intake of fruit and vegetables is related to low oxidative stress and inflammation in a group of patients with Type 2 Diabetes. Scand. J. Food Nutr. 2007, 51, 149–158. [Google Scholar] [CrossRef]
- D’Adda Di Fagagna, F.; Reaper, P.M.; Clay-Farrace, L.; Fiegler, H.; Carr, P.; Von Zglinicki, T.; Saretzki, G.; Carter, N.P.; Jackson, S.P. A DNA damage checkpoint response in telomere-initiated senescence. Nature 2003, 426, 194–198. [Google Scholar] [CrossRef] [PubMed]
- Sen, A.; Marsche, G.; Freudenberger, P.; Schallert, M.; Toeglhofer, A.M.; Nagl, C.; Schmidt, R.; Launer, L.J.; Schmidt, H. Association Between Higher Plasma Lutein, Zeaxanthin, and Vitamin C Concentrations and Longer Telomere Length: Results of the Austrian Stroke Prevention Study. J. Am. Geriatr. Soc. 2014, 62, 222–229. [Google Scholar] [CrossRef] [PubMed]
- Nomura, S.J.; Robien, K.; Zota, A.R. Serum Folate, Vitamin B-12, Vitamin A, γ-Tocopherol, α-Tocopherol, and Carotenoids Do Not Modify Associations between Cadmium Exposure and Leukocyte Telomere Length in the General US Adult Population. J. Nutr. 2017, 147, 538–548. [Google Scholar] [CrossRef] [PubMed]
- Milte, C.M.; Russell, A.P.; Ball, K.; Crawford, D.; Salmon, J.; McNaughton, S.A. Diet quality and telomere length in older Australian men and women. Eur. J. Nutr. 2018, 57, 363–372. [Google Scholar] [CrossRef] [PubMed]
- Gu, Y.; Honig, L.S.; Schupf, N.; Lee, J.H.; Luchsinger, J.A.; Stern, Y.; Scarmeas, N. Mediterranean diet and leukocyte telomere length in a multi-ethnic elderly population. AGE 2015, 37, 24. [Google Scholar] [CrossRef] [PubMed]
- Boccardi, V.; Esposito, A.; Rizzo, M.R.; Marfella, R.; Barbieri, M.; Paolisso, G. Mediterranean Diet, Telomere Maintenance and Health Status among Elderly. PLoS ONE 2013, 8, e62781. [Google Scholar] [CrossRef] [PubMed]
- García-Calzón, S.; Martínez-González, M.A.; Razquin, C.; Arós, F.; Lapetra, J.; Martínez, J.A.; Zalba, G.; Marti, A. Mediterranean diet and telomere length in high cardiovascular risk subjects from the PREDIMED-NAVARRA study. Clin. Nutr. 2016, 35, 1399–1405. [Google Scholar] [CrossRef] [PubMed]
- Tucker, L.A. Physical activity and telomere length in U.S. men and women: An NHANES investigation. Prev. Med. 2017, 100, 145–151. [Google Scholar] [PubMed]
- Mirabello, L.; Huang, W.-Y.; Wong, J.Y.Y.; Chatterjee, N.; Reding, D.; Crawford, E.D.; De Vivo, I.; Hayes, R.B.; Savage, S.A. The association between leukocyte telomere length and cigarette smoking, dietary and physical variables, and risk of prostate cancer. Aging Cell 2009, 8, 405–413. [Google Scholar] [CrossRef] [PubMed]
- Shiels, P.G.; McGlynn, L.M.; MacIntyre, A.; Johnson, P.C.D.; Batty, G.D.; Burns, H.; Cavanagh, J.; Deans, K.A.; Ford, I.; McConnachie, A.; et al. Accelerated Telomere Attrition Is Associated with Relative Household Income, Diet and Inflammation in the pSoBid Cohort. PLoS ONE 2011, 6, e22521. [Google Scholar] [CrossRef] [PubMed]
- Astuti, Y.; Wardhana, A.; Watkins, J.; Wulaningsih, W. Cigarette smoking and telomere length: A systematic review of 84 studies and meta-analysis. Environ. Res. 2017, 158, 480–489. [Google Scholar] [CrossRef] [PubMed]
- Gardner, M.; Bann, D.; Wiley, L.; Cooper, R.; Hardy, R.; Nitsch, D.; Martin-Ruiz, C.; Shiels, P.; Sayer, A.A.; Barbieri, M.; et al. Gender and telomere length: Systematic review and meta-analysis. Exp. Gerontol. 2014, 51, 15–27. [Google Scholar] [CrossRef] [PubMed]
- Glasgow, R.E.; Ory, M.G.; Klesges, L.M.; Cifuentes, M.; Fernald, D.H.; Green, L.A. Practical and Relevant Self-Report Measures of Patient Health Behaviors for Primary Care Research. Ann. Fam. Med. 2005, 3, 73–81. [Google Scholar] [CrossRef] [PubMed]


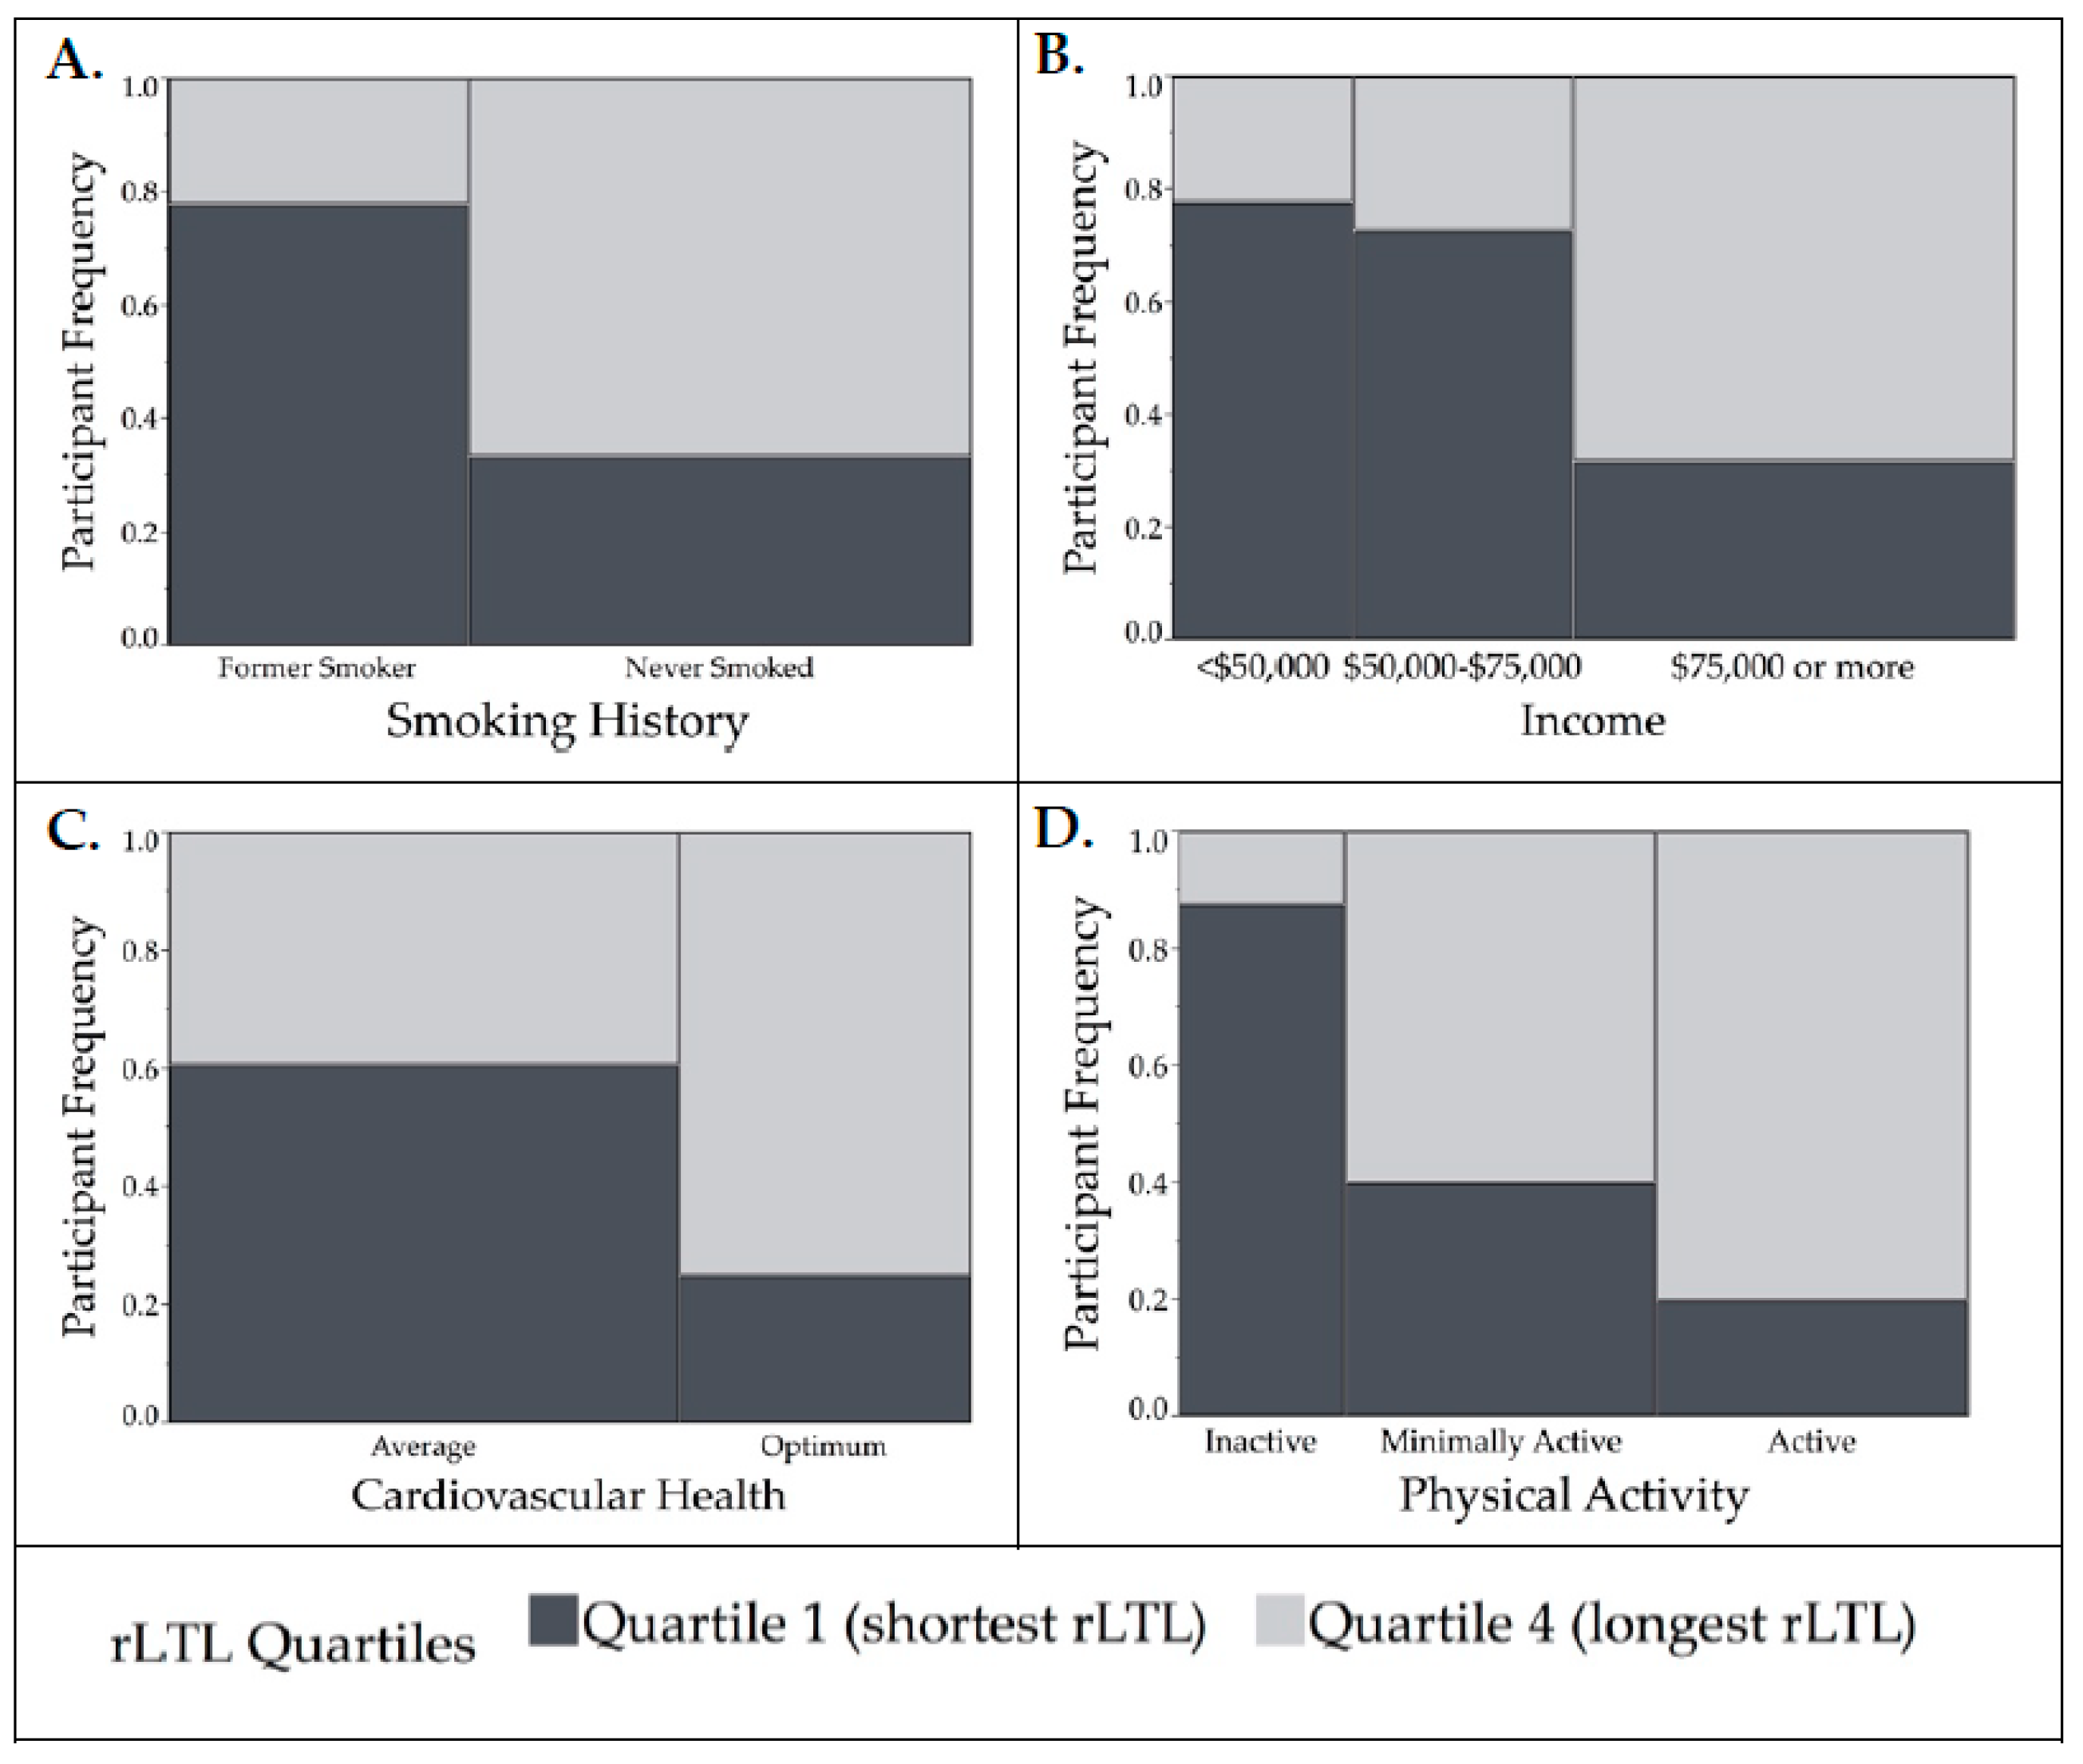
| Total | Q1 (Shortest rLTL) | Q4 (Longest rLTL) | p-value 1 | |
|---|---|---|---|---|
| rLTL, mean ± SD | 1.02 ± 0.18 | 0.81 ± 0.09 | 1.25 ± 0.10 | |
| rLTL, range | 0.46–1.49 | 0.46–0.91 | 1.13–1.49 | <0.0001 |
| Sociodemographic Factors | ||||
| Sex, women | 55 (57.3%) | 13 (54.2%) | 16 (66.7%) | 0.38 |
| Yearly income | 0.02 | |||
| <$50,000 | 22 (23.2%) | 7 (29.2%) | 2 (8.7%) | |
| $50,000–$74,999 | 20 (21.0%) | 8 (33.3%) | 3 (13.1%) | |
| ≥$75,000 | 44 (46.3%) | 7 (29.2%) | 15 (65.2%) | |
| No response | 9 (9.5%) | 2 (8.3%) | 3 (13.0%) | |
| Education | 0.46 | |||
| Grade 9–12 or GED | 17 (17.7%) | 4 (16.7%) | 5 (20.8%) | |
| College 1–3 years | 24 (25.0%) | 8 (33.3%) | 4 (16.7%) | |
| College ≥ 4 years | 55 (57.3%) | 12 (50.0%) | 15 (62.5%) | |
| Lifestyle Factors | ||||
| Smoking history, never smoked | 48 (50.0%) | 10 (41.2%) | 20 (83.3%) | 0.01 |
| Alcohol Consumption | 0.32 | |||
| 0 drinks/week | 33 (34.4%) | 11 (45.8%) | 7 (29.2%) | |
| 1–2 drinks/week | 38 (39.6%) | 7 (29.2%) | 12 (50.0%) | |
| ≥3 drinks/week | 25 (26.0%) | 6 (25.0%) | 5 (20.8%) | |
| Physical Activity Category 2 | 0.01 | |||
| Active | 22 (31.4%) | 3 (18.8%) | 12 (54.6%) | |
| Minimally active | 29 (41.4%) | 6 (37.5%) | 9 (40.9%) | |
| Inactive | 19 (27.1%) | 7 (43.8%) | 1 (4.6%) | |
| Sleep quality Category 3 | 0.30 | |||
| Poor sleep quality (>5) | 48 (52.2%) | 14 (60.9%) | 10 (45.5%) | |
| Good sleep quality (≤5) | 44 (47.8%) | 9 (39.1%) | 12 (54.5%) | |
| Health Related Factors | ||||
| Elevated waist circumference 4 | 70 (72.9%) | 20 (83.3%) | 15 (62.5%) | 0.10 |
| BMI Category | 0.22 | |||
| Normal (18.5–24.9 kg/m2) | 22 (22.9%) | 4 (16.7%) | 7 (29.2%) | |
| Overweight (25.0–29.9 kg/m2) | 25 (26.0%) | 6 (25.0%) | 9 (37.5%) | |
| Obese (≥30 kg/m2) | 49 (51.1%) | 14 (58.3%) | 8 (33.3%) | |
| Diabetes/prediabetes | 34 (35.4%) | 11 (45.8%) | 7 (29.2%) | 0.38 |
| Hypertension | 37 (38.5%) | 9 (37.5%) | 9 (37.5%) | 1.00 |
| Dyslipidemia | 88 (91.7%) | 23 (95.8%) | 21 (87.5%) | 0.30 |
| “Average” cardiovascular health 5 | 48 (52.2%) | 17 (80.9%) | 11 (48%) | 0.02 |
| Continuous Factors (Q1 = reference) | β (SE) | Odds Ratio (95% Wald Confidence Limits) | p-value | |
| Age, year | 0.1011 (0.066) | 1.106 (0.97–1.26) | 0.12 | |
| C-reactive protein (CRP), mg/L | 0.000625 (0.029) | 1.001 (0.95–1.06) | 0.98 | |
| Fibrinogen, mg/dL | 0.00101 (0.003) | 1.001 (0.99–1.01) | 0.76 | |
| TNF-alpha, pg/mL | 0.00102 (0.08) | 1.001 (0.86–1.17) | 0.99 | |
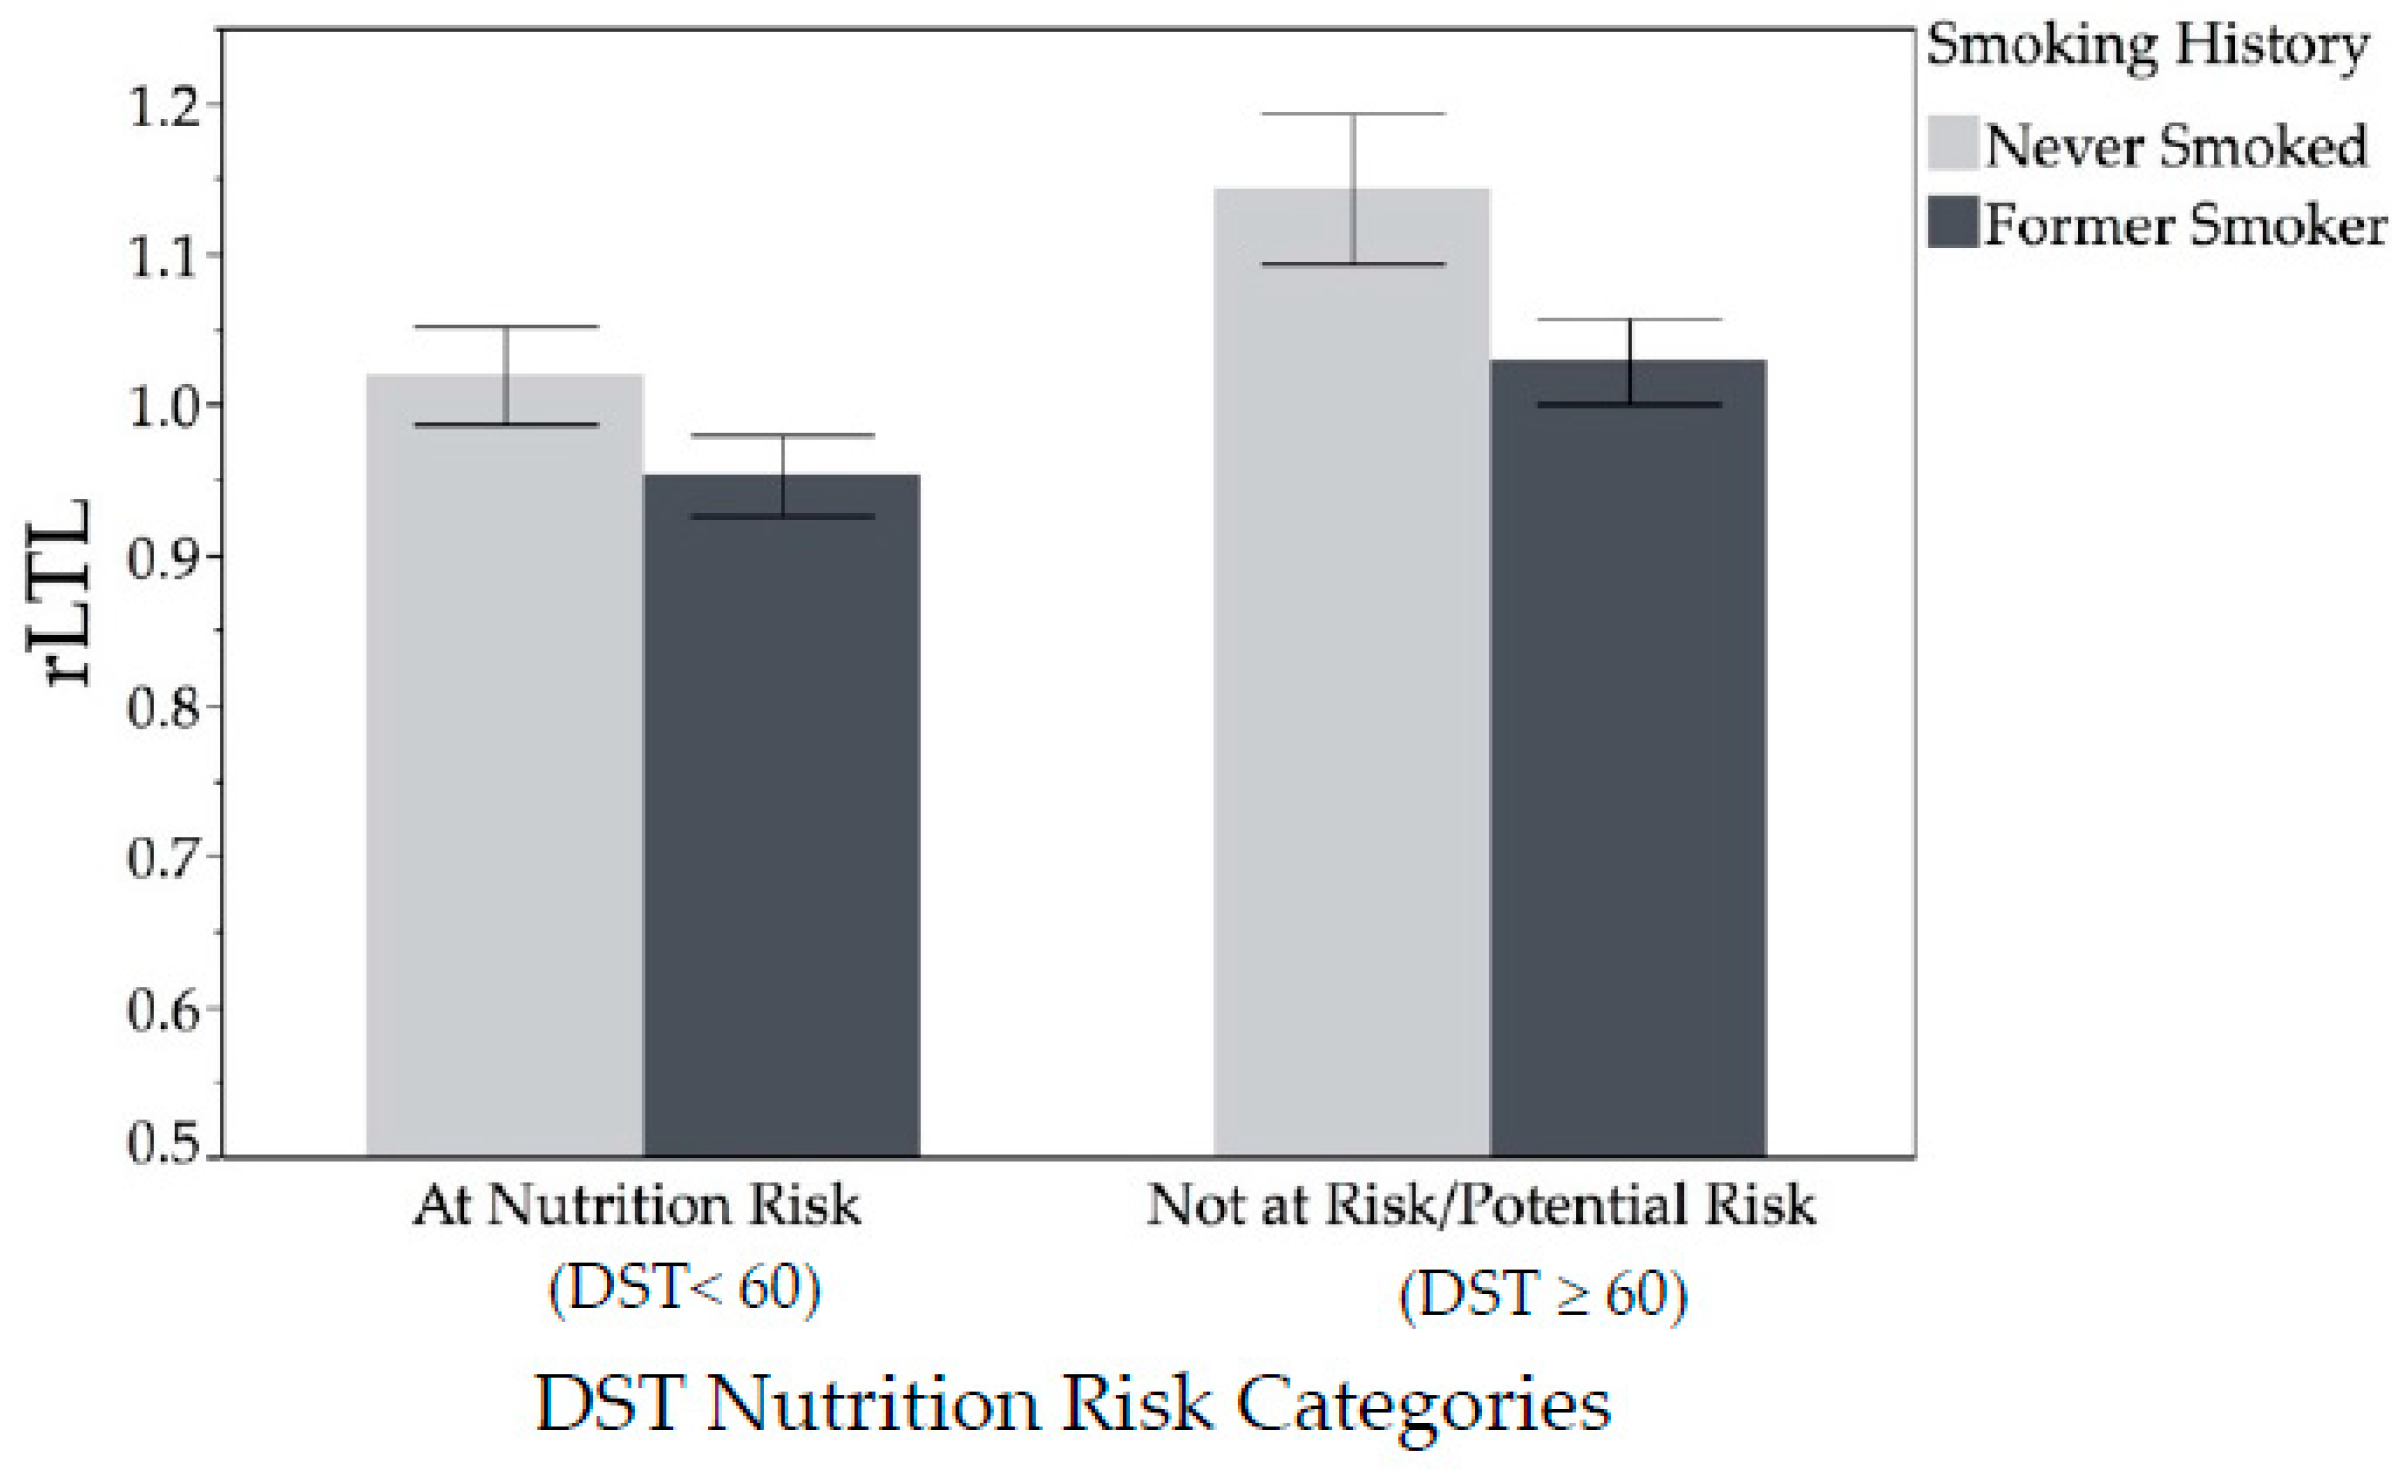
| All | Q1 (Shorter rLTL) | Q4 (Longer rLTL) | ||
|---|---|---|---|---|
| n = 96 | n = 24 | n = 24 | ||
| rLTL | ||||
| rLTL, mean ± SD | 1.02 ± 0.18 | 0.81 ± 0.09 | 1.25 ± 0.10 | |
| rLTL, range | 0.46–1.49 | 0.46–0.91 | 1.13–1.49 | |
| Nutrition Risk (categorical) | p-value1 | |||
| At risk (DST < 60) | 62 (64.6%) | 19 (79.2%) | 11 (45.8%) | 0.02 |
| Not at-risk/potential risk (DST ≥ 60) | 34 (35.4%) | 5 (20.8%) | 13 (54.2%) | |
| Diet Quality Scores (continuous) | β (SE) | Odds Ratio (95% Wald Confidence Limits) | p-value2 | |
| aMed (0–9) (Q1 = reference) | 0.1141 (0.15) | 1.121 (0.82–1.51) | 0.45 | |
| HEI-2015 (0–100) (Q1 = reference) | 0.0254 (0.02) | 1.026 (0.983–1.07) | 0.24 | |
| DST (0–100) (Q1 = reference) | 0.064 (0.024) | 1.037 (0.99–1.09) | 0.12 | |
| Explanatory Variable | n | β (SE) 2 | t-value 3 | p-value 4 | AICC 5 | |
|---|---|---|---|---|---|---|
| aMed (energy adjusted, Continuous) | ||||||
| Model 1 | aMed | 94 | 0.008 (0.01) | 0.87 | 0.39 | −57.6 |
| Model 2 | aMed | 88 | 0.006 (0.01) | 0.54 | 0.59 | −55.8 |
| LS7 | 0.014 (0.01) | 1.54 | 0.13 | |||
| Smoking (never smoked) | 0.081 (0.04) | 2.26 | 0.03 | |||
| Model 3 | aMed | 94 | 0.012 (0.01) | 0.89 | 0.37 | −58.4 |
| Smoking (never smoked) | 0.077 (0.08) | 0.98 | 0.33 | |||
| aMed x Smoking (never smoked) | 0.011 (0.02) | 0.56 | 0.57 | |||
| Model 4 | aMed | 79 | 0.010 (0.01) | 0.92 | 0.36 | −38.8 |
| LS7 | 0.005 (0.01) | 0.52 | 0.60 | |||
| Smoking (never smoked) | 0.083 (0.04) | 2.19 | 0.03 | |||
| Income (<50 K/year) | −0.046 (0.04) | −1.04 | 0.30 | |||
| Income (50–75 K/year) | −0.039 (0.04) | −0.86 | 0.40 | |||
| Healthy Eating Index–2015 (Continuous) | ||||||
| Model 1 | HEI-2015 | 91 | 0.001 (0.001) | 0.88 | 0.38 | −65.4 |
| Model 2 | HEI-2015 | 85 | −0.0004 (0.001) | −0.35 | 0.73 | −65.5 |
| LS7 | 0.018 (0.01) | 2.22 | 0.03 | |||
| Smoking (never smoked) | 0.062 (0.03) | 1.98 | 0.05 | |||
| Model 3 | HEI-2015 | 91 | 0.0003 (0.001) | 0.23 | 0.82 | −61.1 |
| Smoking (never smoked) | −0.056 (0.13) | −0.45 | 0.66 | |||
| HEI-2015 × smoking | 0.003 (0.002) | 1.27 | 0.21 | |||
| Model 4 | HEI-2015 | 76 | 0.0003 (0.001) | 0.23 | 0.82 | −48.2 |
| LS7 | 0.009 (0.009) | 0.97 | 0.33 | |||
| Smoking (never smoked) | 0.061 (0.03) | 1.84 | 0.07 | |||
| Income (<50 K/year) | −0.066 (0.04) | −1.39 | 0.10 | |||
| Income (50–75 K/year) | −0.057 (0.04) | 1.81 | 0.17 | |||
| Dietary Screening Tool (Continuous) | ||||||
| Model 1 | DST | 92 | 0.002 (0.001) | 1.35 | 0.18 | −60.7 |
| Model 2 | DST | 86 | 0.00008 (0.001) | 0.06 | 0.95 | −59.3 |
| LS7 | 0.016 (0.008) | 1.84 | 0.07 | |||
| Smoking (never smoked) | 0.074 (0.03) | 2.36 | 0.02 | |||
| Model 3 | DST | 92 | 0.003 (0.002) | 1.51 | 0.14 | −55.9 |
| Smoking (never smoked) | 0.196 (0.14) | 1.4 | 0.16 | |||
| DST × smoking | −0.002 (0.003) | −0.7 | 0.49 | |||
| Model 4 | DST | 77 | 0.003 (0.001) | 0.22 | 0.83 | −41.2 |
| LS7 | 0.009 (0.01) | 0.92 | 0.36 | |||
| Smoking (never smoked) | 0.072 (0.03) | 2.14 | 0.04 | |||
| Income (<50 K/year) | −0.043 (0.04) | −1.04 | 0.30 | |||
| Income (50–75 K/year) | −0.057 (0.04) | −1.32 | 0.19 | |||
| Dietary Screening Tool (Categorical) | ||||||
| Model 1 | DST Category (At risk, <60) | 92 | −0.091 (0.03) | −2.76 | 0.007 | −74.4 |
| Model 2 | DST Category (At risk, <60) | 86 | −0.059 (0.03) | 3.07 | 0.08 | −70.6 |
| LS7 | 0.011 (0.01) | 1.35 | 0.18 | |||
| Smoking (never smoked) | 0.079 (0.03) | 2.58 | 0.01 | |||
| Model 3 | DST Category (At risk, <60) | 92 | −0.068 (0.04) | −1.55 | 0.12 | −76.8 |
| Smoking (never smoked) | 0.133 (0.05) | 2.65 | 0.01 | |||
| DST Category × smoking | −0.051 (0.06) | −0.81 | 0.42 | |||
| Model 4 | DST Category (At risk, <60) | 77 | −0.088 (0.04) | −2.49 | 0.02 | −57.6 |
| LS7 | −0.001 (0.01) | −0.11 | 0.92 | |||
| Smoking (never smoked) | 0.072 (0.03) | 2.28 | 0.03 | |||
| Income (<50 K/year) | −0.093 (0.04) | −2.34 | 0.02 | |||
| Income (50–75 K/year) | −0.067 (0.04) | −1.67 | 0.1 | |||
© 2019 by the authors. Licensee MDPI, Basel, Switzerland. This article is an open access article distributed under the terms and conditions of the Creative Commons Attribution (CC BY) license (http://creativecommons.org/licenses/by/4.0/).
Share and Cite
Ventura Marra, M.; Drazba, M.A.; Holásková, I.; Belden, W.J. Nutrition Risk is Associated with Leukocyte Telomere Length in Middle-Aged Men and Women with at Least One Risk Factor for Cardiovascular Disease. Nutrients 2019, 11, 508. https://doi.org/10.3390/nu11030508
Ventura Marra M, Drazba MA, Holásková I, Belden WJ. Nutrition Risk is Associated with Leukocyte Telomere Length in Middle-Aged Men and Women with at Least One Risk Factor for Cardiovascular Disease. Nutrients. 2019; 11(3):508. https://doi.org/10.3390/nu11030508
Chicago/Turabian StyleVentura Marra, Melissa, Margaret A. Drazba, Ida Holásková, and William J. Belden. 2019. "Nutrition Risk is Associated with Leukocyte Telomere Length in Middle-Aged Men and Women with at Least One Risk Factor for Cardiovascular Disease" Nutrients 11, no. 3: 508. https://doi.org/10.3390/nu11030508
APA StyleVentura Marra, M., Drazba, M. A., Holásková, I., & Belden, W. J. (2019). Nutrition Risk is Associated with Leukocyte Telomere Length in Middle-Aged Men and Women with at Least One Risk Factor for Cardiovascular Disease. Nutrients, 11(3), 508. https://doi.org/10.3390/nu11030508