Childhood Disability and Nutrition: Findings from a Population-Based Case Control Study in Rural Bangladesh

Abstract
:1. Introduction
2. Materials and Methods
2.1. Study Participants
2.2. Identification of Children with Disability
2.3. Selection of Controls
2.4. Data Collection
2.5. Anthropometric Measurement
2.5.1. Weight Measurement
2.5.2. Height Measurement
3. Statistical Analysis
Ethical Consideration
4. Results
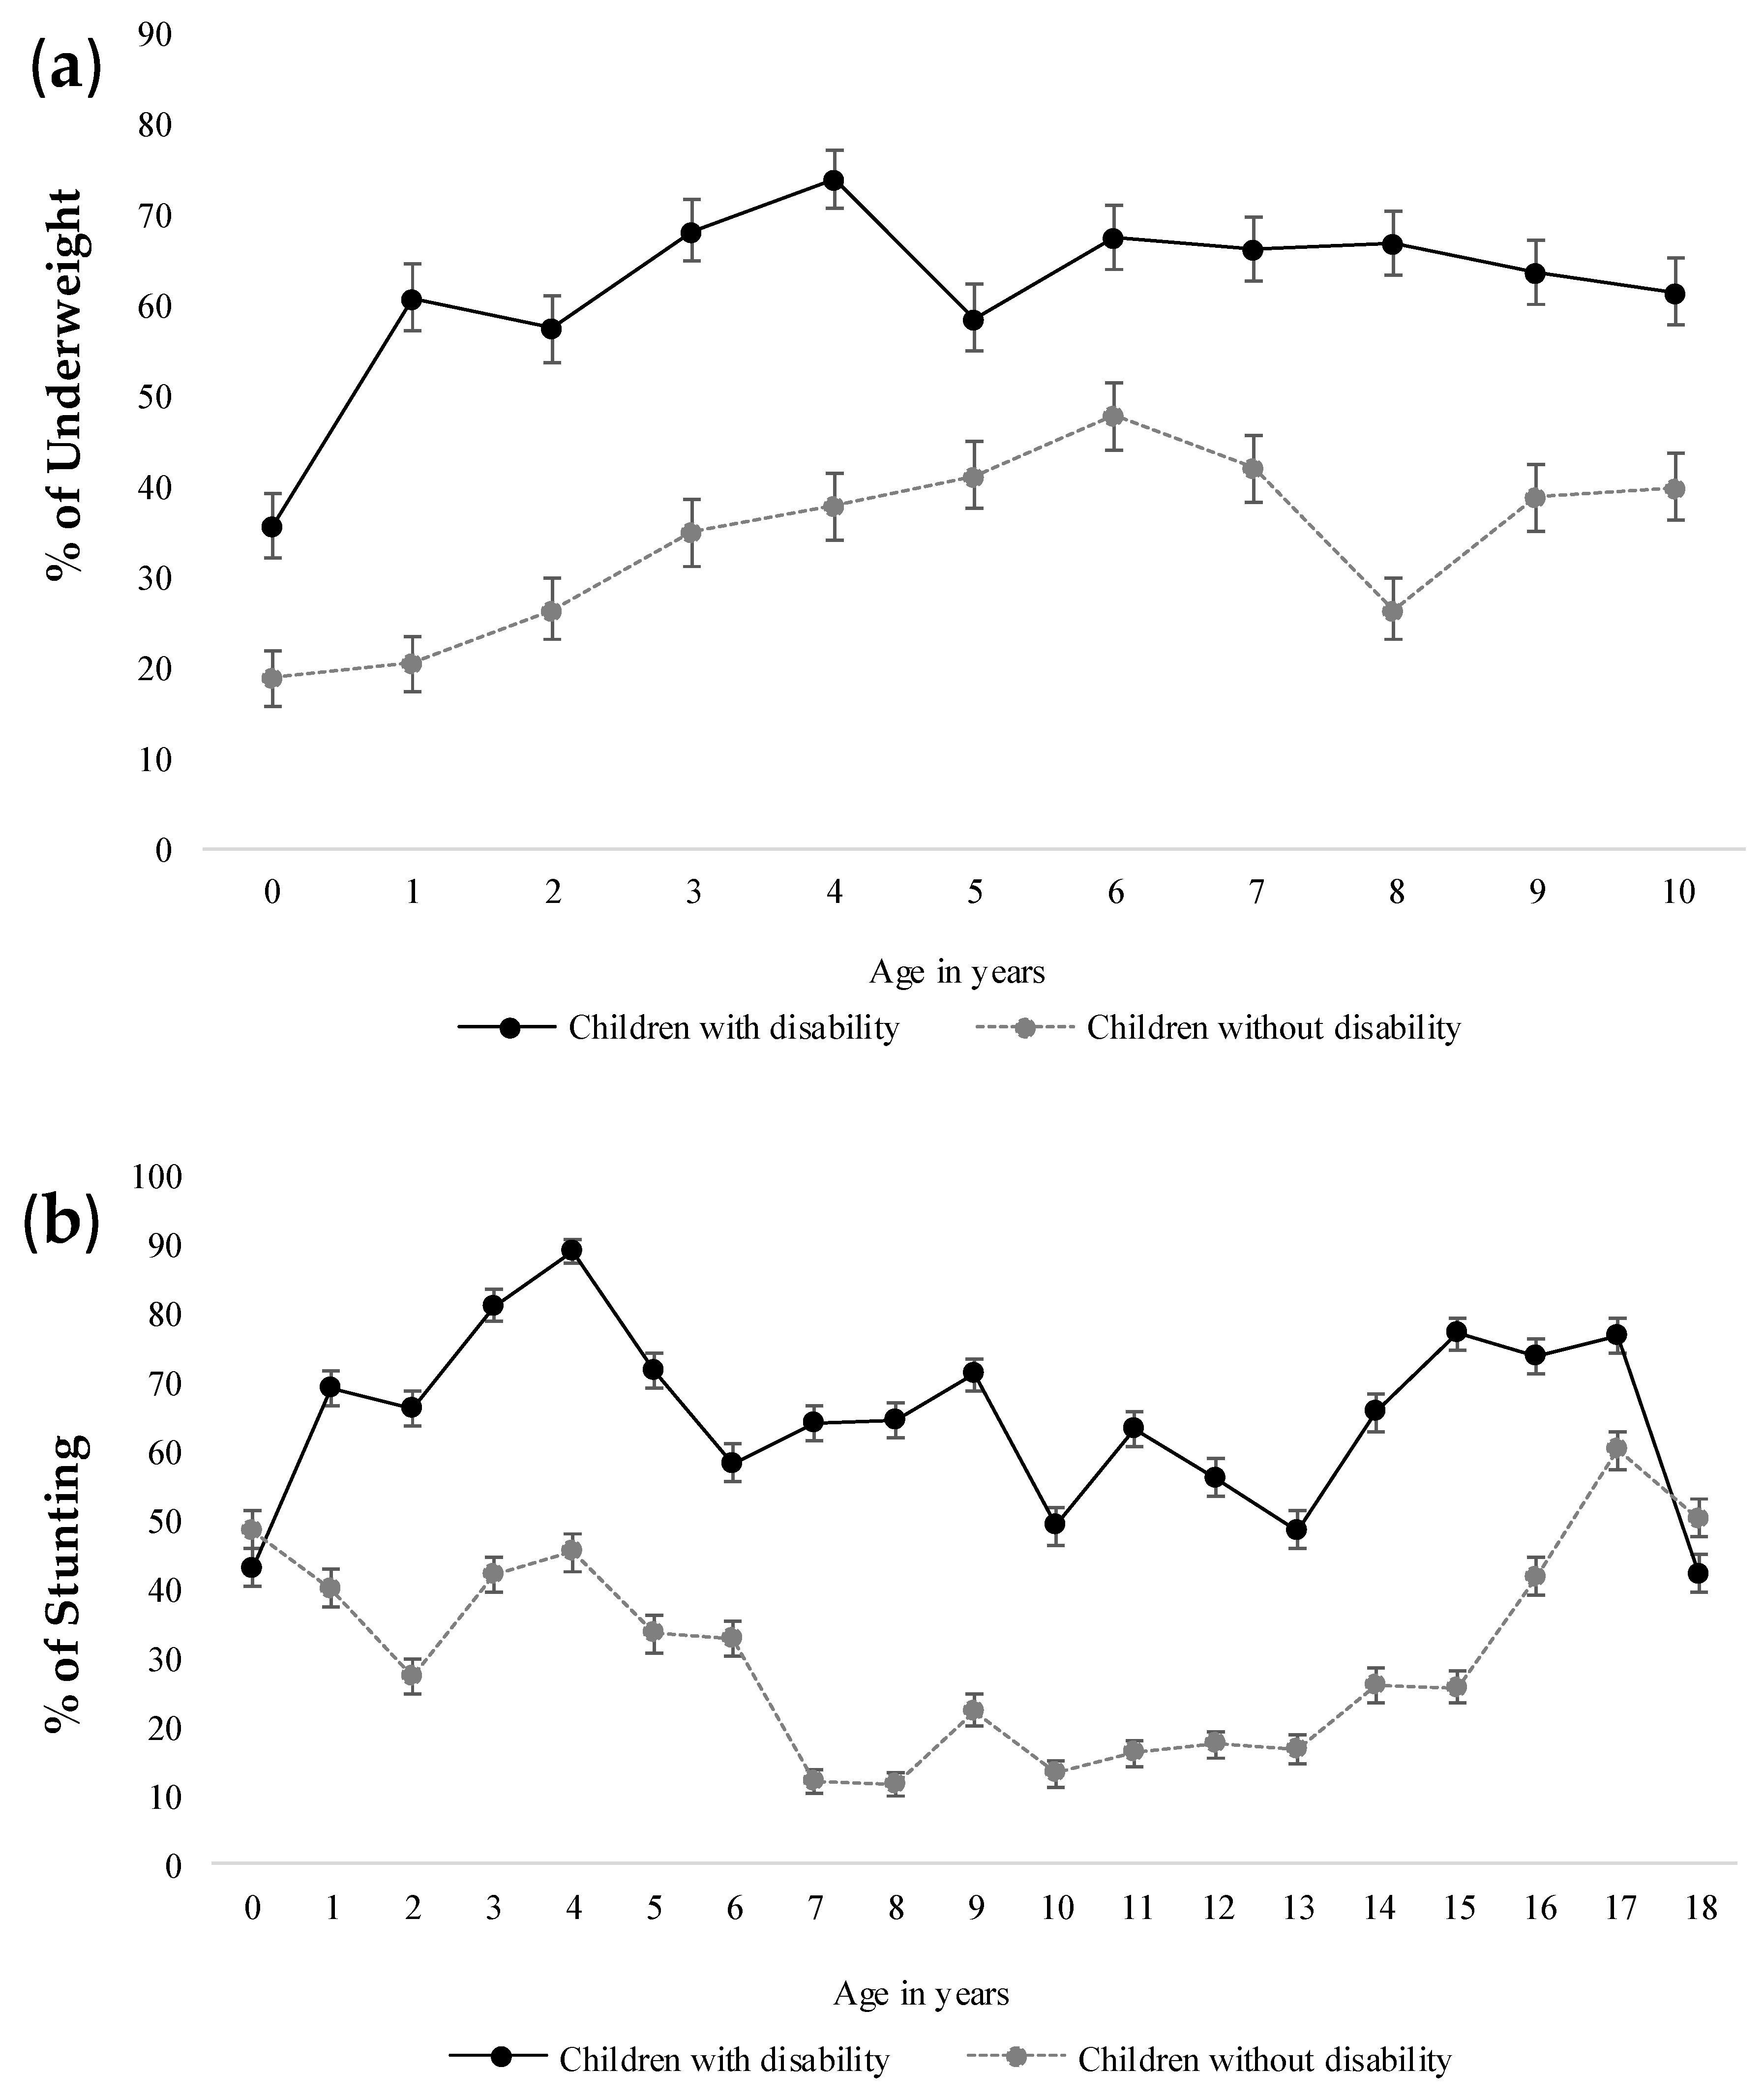
4.1. Nutritional Status of Children with Disability
4.2. Relationship between Socioeconomic Characteristics and Malnutrition (i.e., Underweight and/or Stunting)
5. Discussion
6. Conclusions
Author Contributions
Funding
Acknowledgments
Conflicts of Interest
References
- World Health Organization. WHO Global Disability Action Plan 2014–2021: Better Health for All People with Disability; World Health Organization: Geneva, Switzerland, 2015; Available online: http://apps.who.int/iris/bitstream/handle/10665/199544/9789241509619_eng.pdf;jsessionid=0FFF56B40B7E8F5A577AF5EF46E7CD34?sequence¼1 (accessed on 29 September 2019).
- UNICEF. Children and Young People with Disabilities Fact Sheet; Unicef: Dhaka, Bangladesh, 2013; Available online: https://www.unicef.org/disabilities/files/Factsheet_A5__Web_REVISED.pdf (accessed on 29 September 2019).
- World Health Organization. Global Nutrition Report: Shining a Light to Spur Action on Nutrition, Executive Summary; World Health Organization: Geneva, Switzerland, 2018; Available online: https://www.who.int/nutrition/globalnutritionreport/2018_Global_Nutrition_Report.pdf?ua=1 (accessed on 29 September 2019).
- Groce, N.; Challenger, E.; Kerac, M. Stronger Together: Nutrition-Disability Links and Synergies-Briefing Note; Nutrition Working Group, Global Partnership for Children with Disabilities, Unicef: New York, NY, USA, 2013; Available online: https://www.unicef.org/disabilities/files/Stronger-Together_Nutrition_Disability_Groce_Challenger_Kerac.pdf (accessed on 29 September 2019).
- Groce, N.; Challenger, E.; Berman-Bieler, R.; Farkas, A.; Yilmaz, N.; Schultink, W.; Clark, D.; Kaplan, C.; Kerac, M. Malnutrition and disability: Unexplored opportunities for collaboration. Paediatr. Int. Child Health 2014, 34, 308–314. [Google Scholar] [CrossRef] [PubMed]
- Hume-Nixon, M.; Kuper, H. The association between malnutrition and childhood disability in low-and middle-income countries: Systematic review and meta-analysis of observational studies. Trop. Med. Int. Health 2018, 23, 1158–1175. [Google Scholar] [CrossRef] [PubMed]
- Kuper, H.; Nyapera, V.; Evans, J.; Munyendo, D.; Zuurmond, M.; Frison, S.; Mwenda, V.; Otieno, D.; Kisia, J. Malnutrition and childhood disability in Turkana, Kenya: Results from a case-control study. PLoS ONE 2015, 10, 0144926. [Google Scholar] [CrossRef] [PubMed]
- Gottlieb, C.A.; Maenner, M.J.; Cappa, C.; Durkin, M.S. Child disability screening, nutrition, and early learning in 18 countries with low and middle incomes: Data from the third round of UNICEF’s Multiple Indicator Cluster Survey (2005–06). Lancet 2009, 374, 1831–1839. [Google Scholar] [CrossRef]
- Bangladesh Bureau of Statistics. Population and Housing Census 2011: National Volume 2-Union Statistics. Bangladesh; Statistics and Informatics Division, Ministry of Planning: Dhaka, Bangladesh, 2014. Available online: http://203.112.218.65:8008/WebTestApplication/userfiles/Image/National%20Reports/Union%20Statistics.pdf (accessed on 29 September 2019).
- World Health Organization. Towards a Common Language for Functioning, Disability and Health ICF; World Health Organization: Geneva, Switzerland, 2002; Available online: https://www.who.int/classifications/icf/icfbeginnersguide.pdf (accessed on 29 September 2019).
- Muhit, M.A.; Shah, S.P.; Gilbert, C.E.; Hartley, S.D.; Foster, A. The key informant method: A novel means of ascertaining blind children in Bangladesh. Br. J. Ophthalmol. 2007, 91, 995–999. [Google Scholar] [CrossRef] [PubMed]
- Mackey, S.; Murthy, G.V.; Muhit, M.A.; Islam, J.J.; Foster, A. Validation of the key informant method to identify children with disabilities: Methods and results from a pilot study in Bangladesh. J. Trop. Pediatr. 2011, 58, 269–274. [Google Scholar] [CrossRef] [PubMed]
- Khandaker, G.; Muhit, M.; Rashid, H.; Khan, A.; Islam, J.; Jones, C.; Booy, R. Infectious causes of childhood disability: Results from a pilot study in rural Bangladesh. J. Trop. Pediatr. 2014, 60, 363–369. [Google Scholar] [CrossRef] [PubMed]
- Khandaker, G.; Smithers-Sheedy, H.; Islam, J.; Alam, M.; Jung, J.; Novak, I.; Booy, R.; Jones, C.; Badawi, N.; Muhit, M. Bangladesh Cerebral Palsy Register (BCPR): A pilot study to develop a national cerebral palsy (CP) register with surveillance of children for CP. BMC Neurol. 2015, 15, 173. [Google Scholar] [CrossRef] [PubMed]
- Khandaker, G.; Muhit, M.; Karim, T.; Smithers-Sheedy, H.; Novak, I.; Jones, C.; Badawi, N. Epidemiology of cerebral palsy in Bangladesh: A population-based surveillance study. Dev. Med. Child Neurol. 2019, 61, 601–609. [Google Scholar] [CrossRef] [PubMed]
- World Health Organization. WHO Global Database on Child Growth and Malnutrition; World Health Organization: Geneva, Switzerland, 1997; Available online: http://apps.who.int/iris/bitstream/10665/63750/1/WHO_NUT_97.4.pdf (accessed on 29 September 2019).
- Stevenson, RD. Use of segmental measures to estimate stature in children with cerebral palsy. Arch. Pediatr. Adolesc. Med. 1995, 149, 658–662. [Google Scholar] [CrossRef] [PubMed]
- National Institute of Population Research and Training (NIPORT), Mitra and Associates, ICF International. Bangladesh Demographic and Health Survey 2014; NIPORT, Mitra and Associates: Dhaka, Bangladesh; ICF International: Rockville, MD, USA, 2016; Available online: https://dhsprogram.com/pubs/pdf/FR311/FR311.pdf (accessed on 29 September 2019).
- Prüss-Ustün, A.; Wolf, J.; Bartram, J.; Clasen, T.; Cumming, O.; Freeman, M.C.; Gordon, B.; Hunter, P.R.; Medlicott, K.; Johnston, R. Burden of disease from inadequate water, sanitation and hygiene for selected adverse health outcomes: An updated analysis with a focus on low-and middle-income countries. Int. J. Hyg. Environ. Health 2019, 222, 765–777. [Google Scholar] [CrossRef] [PubMed]
- Neyestani, T.R.; Dadkhah-Piraghaj, M.; Haydari, H.; Zowghi, T.; Nikooyeh, B.; Houshyar-Rad, A.; Nematy, M.; Maddah, M. Nutritional status of the Iranian children with physical disability: A cross-sectional study. Asia Pac. J. Clin. Nutr. 2010, 19, 223–230. [Google Scholar] [PubMed]
- Rosenbaum, P.; Paneth, N.; Leviton, A.; Goldstein, M.; Bax, M.; Damiano, D.; Dan, B.; Jacobsson, B. A report: The definition and classification of cerebral palsy April 2006. Dev. Med. Child Neurol. Suppl. 2007, 109, 8–14. [Google Scholar] [PubMed]
- Jahan, I.; Muhit, M.; Karim, T.; Smithers-Sheedy, H.; Novak, I.; Jones, C.; Badawi, N.; Khandaker, G. What makes children with cerebral palsy vulnerable to malnutrition? Findings from the Bangladesh cerebral palsy register (BCPR). Disabil. Rehabil. 2018, 13, 1–8. [Google Scholar] [CrossRef] [PubMed]
- Kakooza-Mwesige, A.; Tumwine, J.K.; Eliasson, A.C.; Namusoke, H.K.; Forssberg, H. Malnutrition is common in Ugandan children with cerebral palsy, particularly those over the age of five and those who had neonatal complications. Acta Paediatr. 2015, 104, 1259–1268. [Google Scholar] [CrossRef] [PubMed]
- Herrera-Anaya, E.; Angarita-Fonseca, A.; Herrera-Galindo, V.M.; Martinez-Marin, R.D.P.; Rodriguez-Bayona, C.N. Association between gross motor function and nutritional status in children with cerebral palsy: A cross sectional study from Colombia. Dev. Med. Child Neurol. 2016, 58, 936–941. [Google Scholar] [CrossRef] [PubMed]
- Dahlseng, M.O.; Finbraten, A.K.; Juliusson, P.B.; Skranes, J.; Andersen, G.; Vik, T. Feeding problems, growth and nutritional status in children with cerebral palsy. Acta Paediatr. 2012, 101, 92–98. [Google Scholar] [CrossRef] [PubMed]
- Crepin, S.; Godet, B.; Chassain, B.; Preux, P.M.; Desport, J.C. Malnutrition and epilepsy: A two-way relationship. Clin. Nutr. 2009, 28, 219–225. [Google Scholar] [CrossRef] [PubMed]
- Murthy, G.V.; Mactaggart, I.; Mohammad, M.; Islam, J.; Noe, C.; Khan, A.I.; Foster, A. Assessing the prevalence of sensory and motor impairments in childhood in Bangladesh using key informants. Arch. Dis. Child 2014, 99, 1103–1108. [Google Scholar] [CrossRef] [PubMed] [Green Version]

| Characteristics | Children with Disability, n (%) | Children without Disability, n (%) | General Population (%) |
|---|---|---|---|
| n = 1274 | n = 1303 | ||
| Age Group (Years) | |||
| 0–4 | 250 (19.6) | 286 (21.9) | 26.4 1 |
| 5–9 | 413 (32.4) | 389 (29.9) | 31.8 1 |
| 10–14 | 408 (32.0) | 538 (41.3) | 29.1 1 |
| 15–18 | 203 (15.9) | 90 (6.9) | 12.7 1 |
| Sex | |||
| Male | 718 (56.4) | 608 (46.7) | 51.8 1 |
| Female | 556 (43.6) | 695 (53.3) | 48.2 1 |
| Household Income and Expenditure | |||
| Median (interquartile range) monthly household income, BDT ~ USD | 7000 (6000,10,000) ~ 83 (71,119) | 8000 (6000,12,000) ~ 95 (71,142) | 13,353 2 ~ 159 |
| Median (interquartile range) monthly household expenditure, BDT ~ USD | 7000 (5500,10,000) ~ 83 (65,119) | 7500 (6000,10,000) ~ 89 (71,119) | 14,156 2 ~ 168 |
| Types of Disability | |||
| Physical impairment | 915 (71.8) | N/A | 36.4 3 |
| Cerebral palsy (CP) | 796 (87.0) | N/A | N/A |
| Birth defect | 68 (7.4) | N/A | N/A |
| Genetic disease-related physical impairment | 32 (3.5) | N/A | N/A |
| Trauma/injury-related physical impairment | 12 (1.3) | N/A | N/A |
| Musculoskeletal dystrophy/atrophy | 7 (0.8) | N/A | N/A |
| Visual | 154 (12.1) | N/A | 10.8 3 |
| Hearing | 390 (30.6) | N/A | 6.4 3 |
| Epilepsy | 179 (14.1) | N/A | N/A |
| Speech | 853 (66.9) | N/A | 21.93 |
| Characteristics | Children with Disability, n (%) | Children without Disability, n (%) | General Population, % | p Value 1 | p Value 2 | Adjusted Odds Ratio 7 (95% CI) |
|---|---|---|---|---|---|---|
| n = 1274 | n = 1303 | |||||
| Source of Drinking Water | ||||||
| Improved source 4 | 1272 (99.8) | 1300 (100.0) | 98.2 3 | 0.364 | <0.001 | N/A |
| Unimproved source 4 | 2 (0.2) | 0 (0.0) | 0.8 3 | 0.364 | <0.001 | N/A |
| Water Treatment Method (n = 1274) | ||||||
| Appropriate 5 | 163 (12.8) | 156 (12.0) | 9.7 3 | 0.202 | <0.001 | Ref |
| Inappropriate | 1111 (87.2) | 1144 (88.0) | N/A- | 0.202 | N/A | 1.1 (0.8, 1.4) |
| Access to Sanitation | ||||||
| Flush/pour flush to proper disposal system | 488 (38.3) | 566 (43.6) | 15.8 3 | <0.001 | <0.001 | Ref |
| Pit latrine with slab | 430 (33.8) | 465 (35.8) | 53.1 3 | 0.07 | <0.001 | 1.1 (0.9, 1.3) |
| Open pit latrine | 333 (26.1) | 258 (19.9) | 21.8 3 | <0.001 | <0.001 | 1.5 (1.2, 1.8) |
| Hanging toilet | 20 (1.6) | 6 (0.5) | 3.1 3 | <0.001 | <0.001 | 4.1 (1.6, 10.4) |
| No facility | 3 (0.2) | 3 (0.2) | 3.7 3 | 0.47 | <0.001 | 1.3 (0.2, 6.5) |
| Educational Level of Mother (Total Years of Schooling) | ||||||
| 0 | 523 (41.1) | 499 (38.4) | 24.9 3 | 0.028 | <0.001 | Ref |
| 1–4 | 185 (14.5) | 204 (15.7) | 18.0 3 | 0.131 | 0.001 | 0.9 (0.7, 1.1) |
| 5 | 331 (26.0) | 382 (29.4) | 11.1 3 | 0.004 | <0.001 | 0.9 (0.7, 1.1) |
| 6–9 | 143 (11.2) | 140 (10.8) | 31.5 3 | 0.325 | <0.001 | 1.0 (0.8, 1.3) |
| ≥10 | 92 (7.2) | 76 (5.8) | 14.4 3 | 0.02 | <0.001 | 1.2 (0.9, 1.7) |
| Educational Level of Father (Total Years of Schooling) | ||||||
| 0 | 608 (47.9) | 587 (45.2) | 19.2 3 | 0.03 | <0.001 | Ref |
| 1–4 | 135 (10.6) | 155 (11.9) | 16.0 3 | 0.086 | <0.001 | 0.8 (0.7, 1.1) |
| 5 | 231 (18.2) | 282 (21.7) | 11.3 3 | 0.001 | <0.001 | 0.8 (0.7, 1.0) |
| 6–9 | 131 (10.3) | 129 (9.9) | 28.1 3 | 0.323 | <0.001 | 1.0 (0.8, 1.3) |
| ≥10 | 165 (13.0) | 145 (11.2) | 24.4 3 | 0.026 | <0.001 | 1.1 (0.9, 1.5) |
| Occupation of Mother | ||||||
| Desk job | 15 (1.2) | 12 (0.9) | 6.2 3 | <0.001 | <0.001 | Ref |
| Blue-collar job | 75 (5.9) | 51 (3.9) | 25.4 3 | <0.001 | <0.001 | 1.3 (0.5, 3.0) |
| Business | 13 (1.0) | 7 (0.5) | 14.7 3 | <0.001 | <0.001 | 1.5 (0.4, 5.1) |
| Agricultural/farming | 7 (0.5) | 5 (0.4) | 5.3 3 | 0.002 | <0.001 | 1.2 (0.3, 4.8) |
| Homemaker | 1161 (91.1) | 945 (72.5) | N/A | <0.001 | N/A | 1.1 (0.5, 2.4) |
| Others | 3 (0.2) | 283 (21.7) | 0.4 3 | <0.001 | 0.251 | 0.01 (0.002, 0.034) |
| Occupation of Father | ||||||
| Desk job | 68 (5.3) | 82 (6.3) | N/A | 0.085 | N/A | Ref |
| Blue-collar job | 474 (37.2) | 441 (33.8) | N/A | 0.006 | N/A | 1.3 (0.9, 1.9) |
| Business | 234 (18.4) | 213 (16.3) | N/A | 0.026 | N/A | 1.4 (0.9, 2.0) |
| Agricultural/farming | 310 (24.3) | 365 (28.0) | N/A | 0.002 | N/A | 1.1 (0.7, 1.5) |
| Unemployed | 17 (1.3) | 4 (0.3) | N/A | <0.001 | N/A | 4.4 (1.4, 14.0) |
| Others | 171 (13.4) | 198 (15.2) | N/A | 0.04 | N/A | 1.0 (0.7, 1.5) |
| Socioeconomic Status (SES) | ||||||
| Poor SES | 273 (21.4) | 225 (17.3) | N/A | <0.001 | N/A | 1.6 (1.3, 2.0) |
| Moderate SES | 518 (40.7) | 481 (36.9) | N/A | 0.003 | N/A | 1.4 (1.1, 1.6) |
| High SES | 483 (37.9) | 597 (45.8) | N/A | <0.001 | N/A | Ref |
| Monthly Income-Expenditure Balance | ||||||
| Negative balance | 72 (5.7) | 45 (3.5) | N/A | <0.001 | N/A | 1.7 (1.1, 2.6) |
| Equal balance | 927 (73.0) | 930 (72.1) | N/A | 0.236 | N/A | 1.1 (0.9, 1.4) |
| Positive balance | 270 (21.3) | 315 (24.4) | N/A | 0.005 | N/A | Ref |
| Mainstream School Attendance | ||||||
| Primary | 268 (21.2) | 460 (35.9) | 86.7 3,6 | <0.001 | <0.001 | Ref |
| Secondary | 67 (5.3) | 427 (33.3) | <0.001 | |||
| Others | 28 (2.2) | 26 (2.0) | 0.32 | |||
| No | 588 (46.5) | 33 (2.6) | N/A | <0.001 | N/A | 42.2 (29.0, 61.3) |
| Not applicable | 313 (24.8) | 336 (26.2) | N/A | N/A | N/A | N/A |
| Indicator | Children with Disability | Children without Disability | p Value | Adjusted Odds Ratio 6 (95% CI) |
|---|---|---|---|---|
| Weight for Age z Score (WAZ) (n = 1344) | ||||
| n 1 | 676 | 668 | ||
| Median (IQR) | −2.7 (−4.0, −1.4) | −1.52 (−2.4, −0.6) | <0.001 4 | |
| Normal | 239 (35.4) | 434 (65.0) | <0.001 5 | Ref |
| Underweight | 144 (21.3) | 153 (22.9) | 1.7 (1.3, 2.2) | |
| Severely underweight | 293 (43.3) | 81 (12.1) | 6.6 (4.9, 8.9) | |
| Height for Age z Score (HAZ) (n = 2518) | ||||
| n 2 | 1249 | 1269 | ||
| Median (IQR) | −2.9 (−5.0, −1.5) | −1.1 (−2.0, −0.0) | <0.001 4 | |
| Normal | 429 (34.3) | 953 (75.1) | <0.001 5 | Ref |
| Stunted | 221 (17.7) | 201 (15.8) | 2.3 (1.8, 2.9) | |
| Severely stunted | 599 (48.0) | 115 (9.1) | 11.8 (9.3, 14.9) | |
| Weight for Height z Score (WHZ) (n = 510) | ||||
| n 3 | 241 | 259 | ||
| Median (IQR) | −0.74 (−1.7, 0.5) | −0.85 (−1.5, 0.2) | 0.261 4 | |
| Normal | 189 (78.4) | 211 (81.5) | 0.001 5 | Ref |
| Wasted | 27 (11.2) | 41 (15.8) | 0.7 (0.4, 1.3) | |
| Severely wasted | 25 (10.4) | 7 (2.7) | 4.0 (1.7, 9.5) | |
| Type of Impairment 1 | Weight for Age 2 | Prevalence of Underweight (%) (95% CI) | Adjusted OR 4 | Height for Age 3 | Prevalence of Stunting (%) (95% CI) | Adjusted OR 4 | ||
|---|---|---|---|---|---|---|---|---|
| Normal | Underweight | Normal | Stunted | |||||
| Physical impairment | 157 | 363 | 69.8 (66.0–74.0) | 2.7 (1.8–3.9) | 236 | 662 | 73.7 (71.0–76.0) | 3.4 (2.6–4.4) |
| Cerebral palsy (CP) | 134 | 331 | 71.2 (67.0–75.0) | 195 | 585 | 75.0 (72.0–78.0) | ||
| Birth defect | 14 | 19 | 57.6 (41.0–73.0) | 7 | 5 | 41.7 (19.0-68.0) | ||
| Genetic disease related physical impairment | 7 | 10 | 58.8 (36.0–78.0) | 26 | 41 | 61.2 (49.0–72.0) | ||
| Trauma/Injury related physical impairment | 0 | 2 | 100.0 (34.0–100.0) | 5 | 27 | 84.4 (68.0–93.0) | ||
| Musculoskeletal dystrophy/atrophy | 2 | 1 | 33.3 (6.0–79.0) | 3 | 4 | 57.1 (25.0–84.0) | ||
| Visual | 23 | 54 | 70.1 (59.0–79.0) | 1.3 (0.8–2.2) | 41 | 113 | 73.4 (66.0–80.0) | 1.5 (1.0–2.2) |
| Hearing | 66 | 135 | 67.2 (60.0–73.0) | 1.2 (0.8–1.7) | 121 | 261 | 68.3 (63.0–73.0) | 1.2 (0.9–1.5) |
| Epilepsy | 26 | 82 | 75.9 (67.0–83.0) | 1.9 (1.2–3.0) | 36 | 139 | 79.4 (73.0–85.0) | 2.2 (1.5–3.2) |
| Speech | 176 | 264 | 60.0 (55.0–64.0) | 0.6 (0.4–0.8) | 311 | 527 | 62.9 (60.0–66.0) | 0.7 (0.5–0.9) |
| Clinical Characteristics | Nutritional Status of Children | |||||
|---|---|---|---|---|---|---|
| Weight for Age 1 | p Value 3 | Height for Age 2 | p Value 3 | |||
| Normal | Underweight | Normal | Stunted | |||
| Predominant Type of CP | ||||||
| Monoplegia | 61 (47.7) | 67 (52.3) | <0.001 | 115 (49.4) | 118 (50.6) | <0.001 |
| Diplegia | 29 (33.0) | 59 (67.0) | 25 (18.5) | 110 (81.5) | ||
| Tri/Quadriplegia | 26 (15.5) | 142 (84.5) | 34 (11.2) | 270 (88.8) | ||
| Dyskinesia | 8 (25.0) | 24 (75.0) | 12 (24.5) | 37 (75.5) | ||
| Hypotonia | 10 (23.3) | 33 (76.7) | 7 (14.0) | 43 (86.0) | ||
| Ataxia | 0 (0.0) | 0 (0.0) | 0 (0.0) | 1 (100.0) | ||
| Gross Motor Function Classification System (GMFCS) Level | ||||||
| I–II | 60 (45.8) | 71 (54.2) | <0.001 | 131 (52.8) | 117 (47.2) | <0.001 |
| III–V | 72 (22.0) | 256 (78.0) | 61 (11.6) | 464 (88.4) | ||
| Age of CP Diagnosis (Years) | ||||||
| Less than 2 | 24 (21.6) | 87 (78.4) | 0.093 | 23 (18.1) | 104 (81.9) | 0.028 |
| 2–3 | 47 (30.5) | 107 (69.5) | 47 (23.3) | 155 (76.7) | ||
| 4–5 | 25 (29.1) | 61 (70.9) | 26 (20.8) | 99 (79.2) | ||
| 6 and above | 30 (38.5) | 48 (61.5) | 82 (30.5) | 187 (69.5) | ||
| Associated Impairments | ||||||
| Visual | 15 (25.9) | 43 (74.1) | 0.595 | 18 (18.6) | 79 (81.4) | 0.117 |
| Hearing | 30 (22.1) | 106 (77.9) | 0.039 | 36 (15.9) | 191 (84.1) | <0.001 |
| Epilepsy | 23 (23.0) | 77 (77.0) | 0.147 | 26 (16.7) | 130 (83.3) | 0.007 |
| Speech | 105 (34.4) | 300 (65.6) | <0.001 | 166 (30.9) | 372 (69.1) | <0.001 |
| Characteristics | Underweight among Children with Disability n (%) 1, 6 | Adjusted Odds Ratio 2 (95% CI) | Underweight among Children without Disability n (%) 1, 7 | Adjusted Odds Ratio 2 (95% CI) |
|---|---|---|---|---|
| n = 437 | n = 234 | |||
| Source of Drinking Water | ||||
| Improved source 3 | 437 (64.6) | Ref | 233 (100.0) | Ref |
| Unimproved source 3 | 0 (0.0) | N/A | 0 (0.0) | N/A |
| Water Treatment Method | ||||
| Proper treatment 4 | 50 (59.5) | Ref | 21 (25.6) | Ref |
| Improper treatment | 387 (65.4) | 1.3 (0.8–2.0) | 212 (36.4) | 1.6 (1.0–2.7) |
| Access to Sanitation | ||||
| Improved facility 5 | 314 (61.9) | Ref | 166 (32.6) | Ref |
| Not-improved facility 5 | 123 (72.8) | 1.6 (1.1–2.4) | 67 (43.2) | 1.5 (1.0–2.2) |
| Educational Level of Mother (Total Years of Schooling) | ||||
| 0 | 147 (68.4) | 2.0 (1.1–3.7) | 82 (38.3) | 2.5 (1.0–6.3) |
| 1–4 | 71 (73.2) | 2.5 (1.3–5.1) | 45 (40.5) | 2.8 (1.1–7.4) |
| 5 | 129 (62.0) | 1.5 (0.8–2.7) | 71 (34.3) | 2.2 (0.8–5.6) |
| 6–9 | 61 (61.0) | 1.5 (0.7–2.8) | 30 (29.7) | 1.8 (0.7–4.8) |
| ≥10 | 29 (51.8) | Ref | 6 (18.2) | Ref |
| Educational Level of Father (Total Years of Schooling) | ||||
| 0 | 193 (66.1) | 1.7 (1.0–2.7) | 99 (36.4) | 2.2 (1.1–4.1) |
| 1–4 | 45 (66.2) | 1.7 (0.9–3.2) | 39 (41.5) | 2.9 (1.4–5.9) |
| 5 | 89 (65.9) | 1.7 (1.0–2.9) | 53 (35.8) | 2.2 (1.1–4.4) |
| 6–9 | 54 (69.2) | 2.0 (1.0–3.7) | 29 (36.7) | 2.3 (1.1–5.0) |
| ≥10 | 53 (53.5) | Ref | 14 (19.4) | Ref |
| Occupation of Mother | ||||
| Desk job | 3 (50.0) | Ref | 0 (0.0) | 0 (0.0) |
| Blue-collar job | 23 (63.9) | 1.7 (0.3–10.3) | 9 (30.0) | 1.4 (0.4–5.2) |
| Business | 3 (100.0) | N/A | 1 (25.0) | 1.0 (0.1–12.1) |
| Agricultural/farming | 2 (100.0) | N/A | 1 (50.0) | 3.5 (0.2–69.1) |
| Homemaker | 405 (64.7) | 1.8 (0.3–9.4) | 218 (35.9) | 1.9 (0.7–5.4) |
| Others | 1 (33.3) | 0.5 (0.03–8.9) | 5 (25.0) | Ref |
| Occupation of Father | ||||
| Desk job | 24 (51.1) | Ref | 7 (18.9) | Ref |
| Blue-collar job | 191 (70.5) | 2.3 (1.2–4.3) | 93 (34.1) | 2.0 (0.8–4.8) |
| Business | 78 (60.5) | 1.5 (0.7–2.9) | 43 (37.7) | 2.4 (1.0–6.0) |
| Agricultural/farming | 86 (63.7) | 1.7 (0.8–3.3) | 52 (41.6) | 2.7 (1.1–6.7) |
| Unemployed | 2 (50.0) | 0.9 (0.1–7.3) | 0 (0.0) | 0 (0.0) |
| Others | 56 (62.2) | 1.6 (0.8–3.2) | 39 (33.3) | 2.0 (0.8–4.9) |
| Socioeconomic Status (SES) | ||||
| Poor SES | 108 (70.6) | 2.0 (1.3–3.1) | 59 (41.8) | 1.7 (1.1–2.6) |
| Moderate SES | 206 (69.1) | 1.9 (1.3–2.7) | 99 (37.1) | 1.4 (1.0–2.1) |
| High SES | 123 (54.7) | Ref | 76 (29.2) | Ref |
| Monthly Income-Expenditure Balance | ||||
| Negative balance | 22 (62.9) | 1.1 (0.5–2.3) | 12 (40.0) | 1.5 (0.7–3.4) |
| Equal balance | 316 (66.2) | 1.2 (0.8–1.8) | 161 (37.1) | 1.4 (1.0–2.0) |
| Positive balance | 99 (61.5) | Ref | 57 (29.7) | Ref |
| Mainstream School Attendance | ||||
| No | 173 (76.5) | 3.8 (2.4–6.1) | 12 (60.0) | 2.8 (1.1–7.2) |
| Yes | 60 (45.5) | Ref | 110 (34.6) | Ref |
| Characteristics | Stunting among Children with Disability, n (%) 1, 6 | Adjusted Odds Ratio2 (95% CI) | Stunting among Children without Disability, n (%) 1, 7 | Adjusted Odds Ratio 2 (95% CI) |
|---|---|---|---|---|
| n = 820 | n = 316 | |||
| Source of Drinking Water | ||||
| Improved source 3 | 820 (65.8) | Ref | 315 (100.0) | Ref |
| Unimproved source 3 | 0 (0.0) | N/A | 0 (0.0) | N/A |
| Water Treatment Method | ||||
| Proper treatment 4 | 101 (62.7) | Ref | 31 (20.5) | Ref |
| Improper treatment 4 | 719 (66.1) | 1.1 (0.8–1.6) | 284 (25.5) | 1.4 (0.9–2.2) |
| Access to Sanitation | ||||
| Improved facility 5 | 571 (63.7) | Ref | 241 (24.1) | Ref |
| Not-improved facility 5 | 249 (70.7) | 1.4 (1.1–1.9) | 73 (27.9) | 1.3 (0.9–1.7) |
| Educational Level of Mother (Total Years of Schooling) | ||||
| 0 | 335 (65.4) | 2.2 (1.4–3.5) | 120 (24.4) | 1.8 (0.9–3.4) |
| 1–4 | 128 (71.1) | 2.7 (1.6–4.6) | 47 (23.4) | 1.5 (0.7–3.0) |
| 5 | 214 (65.6) | 2.0 (1.6–4.6) | 98 (26.6) | 1.8 (0.9–3.4) |
| 6–9 | 99 (70.2) | 2.5 (1.4–4.4) | 38 (28.4) | 1.7 (0.8–3.5) |
| ≥10 | 44 (48.9) | Ref | 13 (18.1) | Ref |
| Educational Level of Father (Total Years of Schooling) | ||||
| 0 | 396 (66.6) | 1.5 (1.0–2.1) | 146 (25.3) | 1.6 (1.0–2.6) |
| 1–4 | 90 (66.7) | 1.4 (0.9–2.3) | 37 (24.0) | 1.3 (0.7–2.2) |
| 5 | 150 (66.1) | 1.4 (0.9–2.1) | 65 (24.0) | 1.4 (0.8–2.3) |
| 6–9 | 88 (68.8) | 1.4 (0.9–2.4) | 39 (31.5) | 1.9 (1.0–3.4) |
| ≥10 | 93 (58.1) | Ref | 28 (20.0) | Ref |
| Occupation of Mother | ||||
| Desk job | 8 (57.1) | Ref | 1 (9.1) | Ref |
| Blue-collar job | 48 (65.8) | 1.4 (0.4–4.7) | 15 (30.6) | 5.1 (0.6–44.2) |
| Business | 8 (66.7) | 1.7 (0.3–8.8) | 0 (0.0) | N/A |
| Agricultural/farming | 4 (66.7) | 1.6 (0.2–12.0) | 1 (20.0) | 3.0 (0.1–62.4) |
| Homemaker | 751 (65.8) | 1.4 (0.5–4.1) | 276 (30.2) | 4.7 (0.6–37.6) |
| Others | 1 (33.3) | 0.3 (0.02–4.4) | 23 (8.2) | 1.2 (0.1–9.9) |
| Occupation of Father | ||||
| Desk job | 42 (61.8) | Ref | 14 (18.2) | Ref |
| Blue-collar job | 327 (70.9) | 1.6 (0.9–2.7) | 123 (28.7) | 2.1 (1.1–3.9) |
| Business | 148 (64.3) | 1.2 (0.7–2.1) | 53 (25.4) | 1.8 (0.9–3.6) |
| Agricultural/farming | 188 (62.3) | 1.2 (0.7–2.0) | 69 (19.2) | 1.4 (0.7–2.7) |
| Unemployed | 10 (58.8) | 1.0 (0.3–3.0) | 1 (25.0) | 1.3 (0.1–13.9) |
| Others | 105 (61.4) | 1.1 (0.6–2.0) | 56 (29.3) | 2.1 (1.1–4.1) |
| Socioeconomic Status (SES) | ||||
| Poor SES | 200 (73.8) | 2.1 (1.5–2.9) | 69 (31.1) | 1.9 (1.3–2.7) |
| Moderate SES | 339 (67.5) | 1.5 (1.1–1.9) | 131 (28.2) | 1.5 (1.1–2.1) |
| High SES | 281 (59.0) | Ref | 116 (19.9) | Ref |
| Monthly Income-Expenditure Balance | ||||
| Negative balance | 45 (63.4) | 1.0 (0.6–1.8) | 10 (22.7) | 1.0 (0.5–2.2) |
| Equal balance | 610 (67.3) | 1.3 (1.0–1.7) | 234 (25.7) | 1.3 (0.9–1.7) |
| Positive balance | 162 (60.9) | Ref | 69 (23.0) | Ref |
| Mainstream School Attendance | ||||
| No | 430 (75.0) | 4.1 (3.0–5.4) | 12 (36.4) | 2.1 (1.0–4.4) |
| Yes | 146 (41.0) | Ref | 166 (18.3) | Ref |
© 2019 by the authors. Licensee MDPI, Basel, Switzerland. This article is an open access article distributed under the terms and conditions of the Creative Commons Attribution (CC BY) license (http://creativecommons.org/licenses/by/4.0/).
Share and Cite
Jahan, I.; Karim, T.; Al Imam, M.H.; Das, M.C.; Ali, K.M.; Muhit, M.; Khandaker, G. Childhood Disability and Nutrition: Findings from a Population-Based Case Control Study in Rural Bangladesh. Nutrients 2019, 11, 2728. https://doi.org/10.3390/nu11112728
Jahan I, Karim T, Al Imam MH, Das MC, Ali KM, Muhit M, Khandaker G. Childhood Disability and Nutrition: Findings from a Population-Based Case Control Study in Rural Bangladesh. Nutrients. 2019; 11(11):2728. https://doi.org/10.3390/nu11112728
Chicago/Turabian StyleJahan, Israt, Tasneem Karim, Mahmudul Hassan Al Imam, Manik Chandra Das, Khaled Mohammad Ali, Mohammad Muhit, and Gulam Khandaker. 2019. "Childhood Disability and Nutrition: Findings from a Population-Based Case Control Study in Rural Bangladesh" Nutrients 11, no. 11: 2728. https://doi.org/10.3390/nu11112728
APA StyleJahan, I., Karim, T., Al Imam, M. H., Das, M. C., Ali, K. M., Muhit, M., & Khandaker, G. (2019). Childhood Disability and Nutrition: Findings from a Population-Based Case Control Study in Rural Bangladesh. Nutrients, 11(11), 2728. https://doi.org/10.3390/nu11112728