Association between Nutrients and Visceral Fat in Healthy Japanese Adults: A 2-Year Longitudinal Study Brief Title: Micronutrients Associated with Visceral Fat Accumulation

 , ,
, ,
Abstract
:1. Introduction
2. Materials and Methods
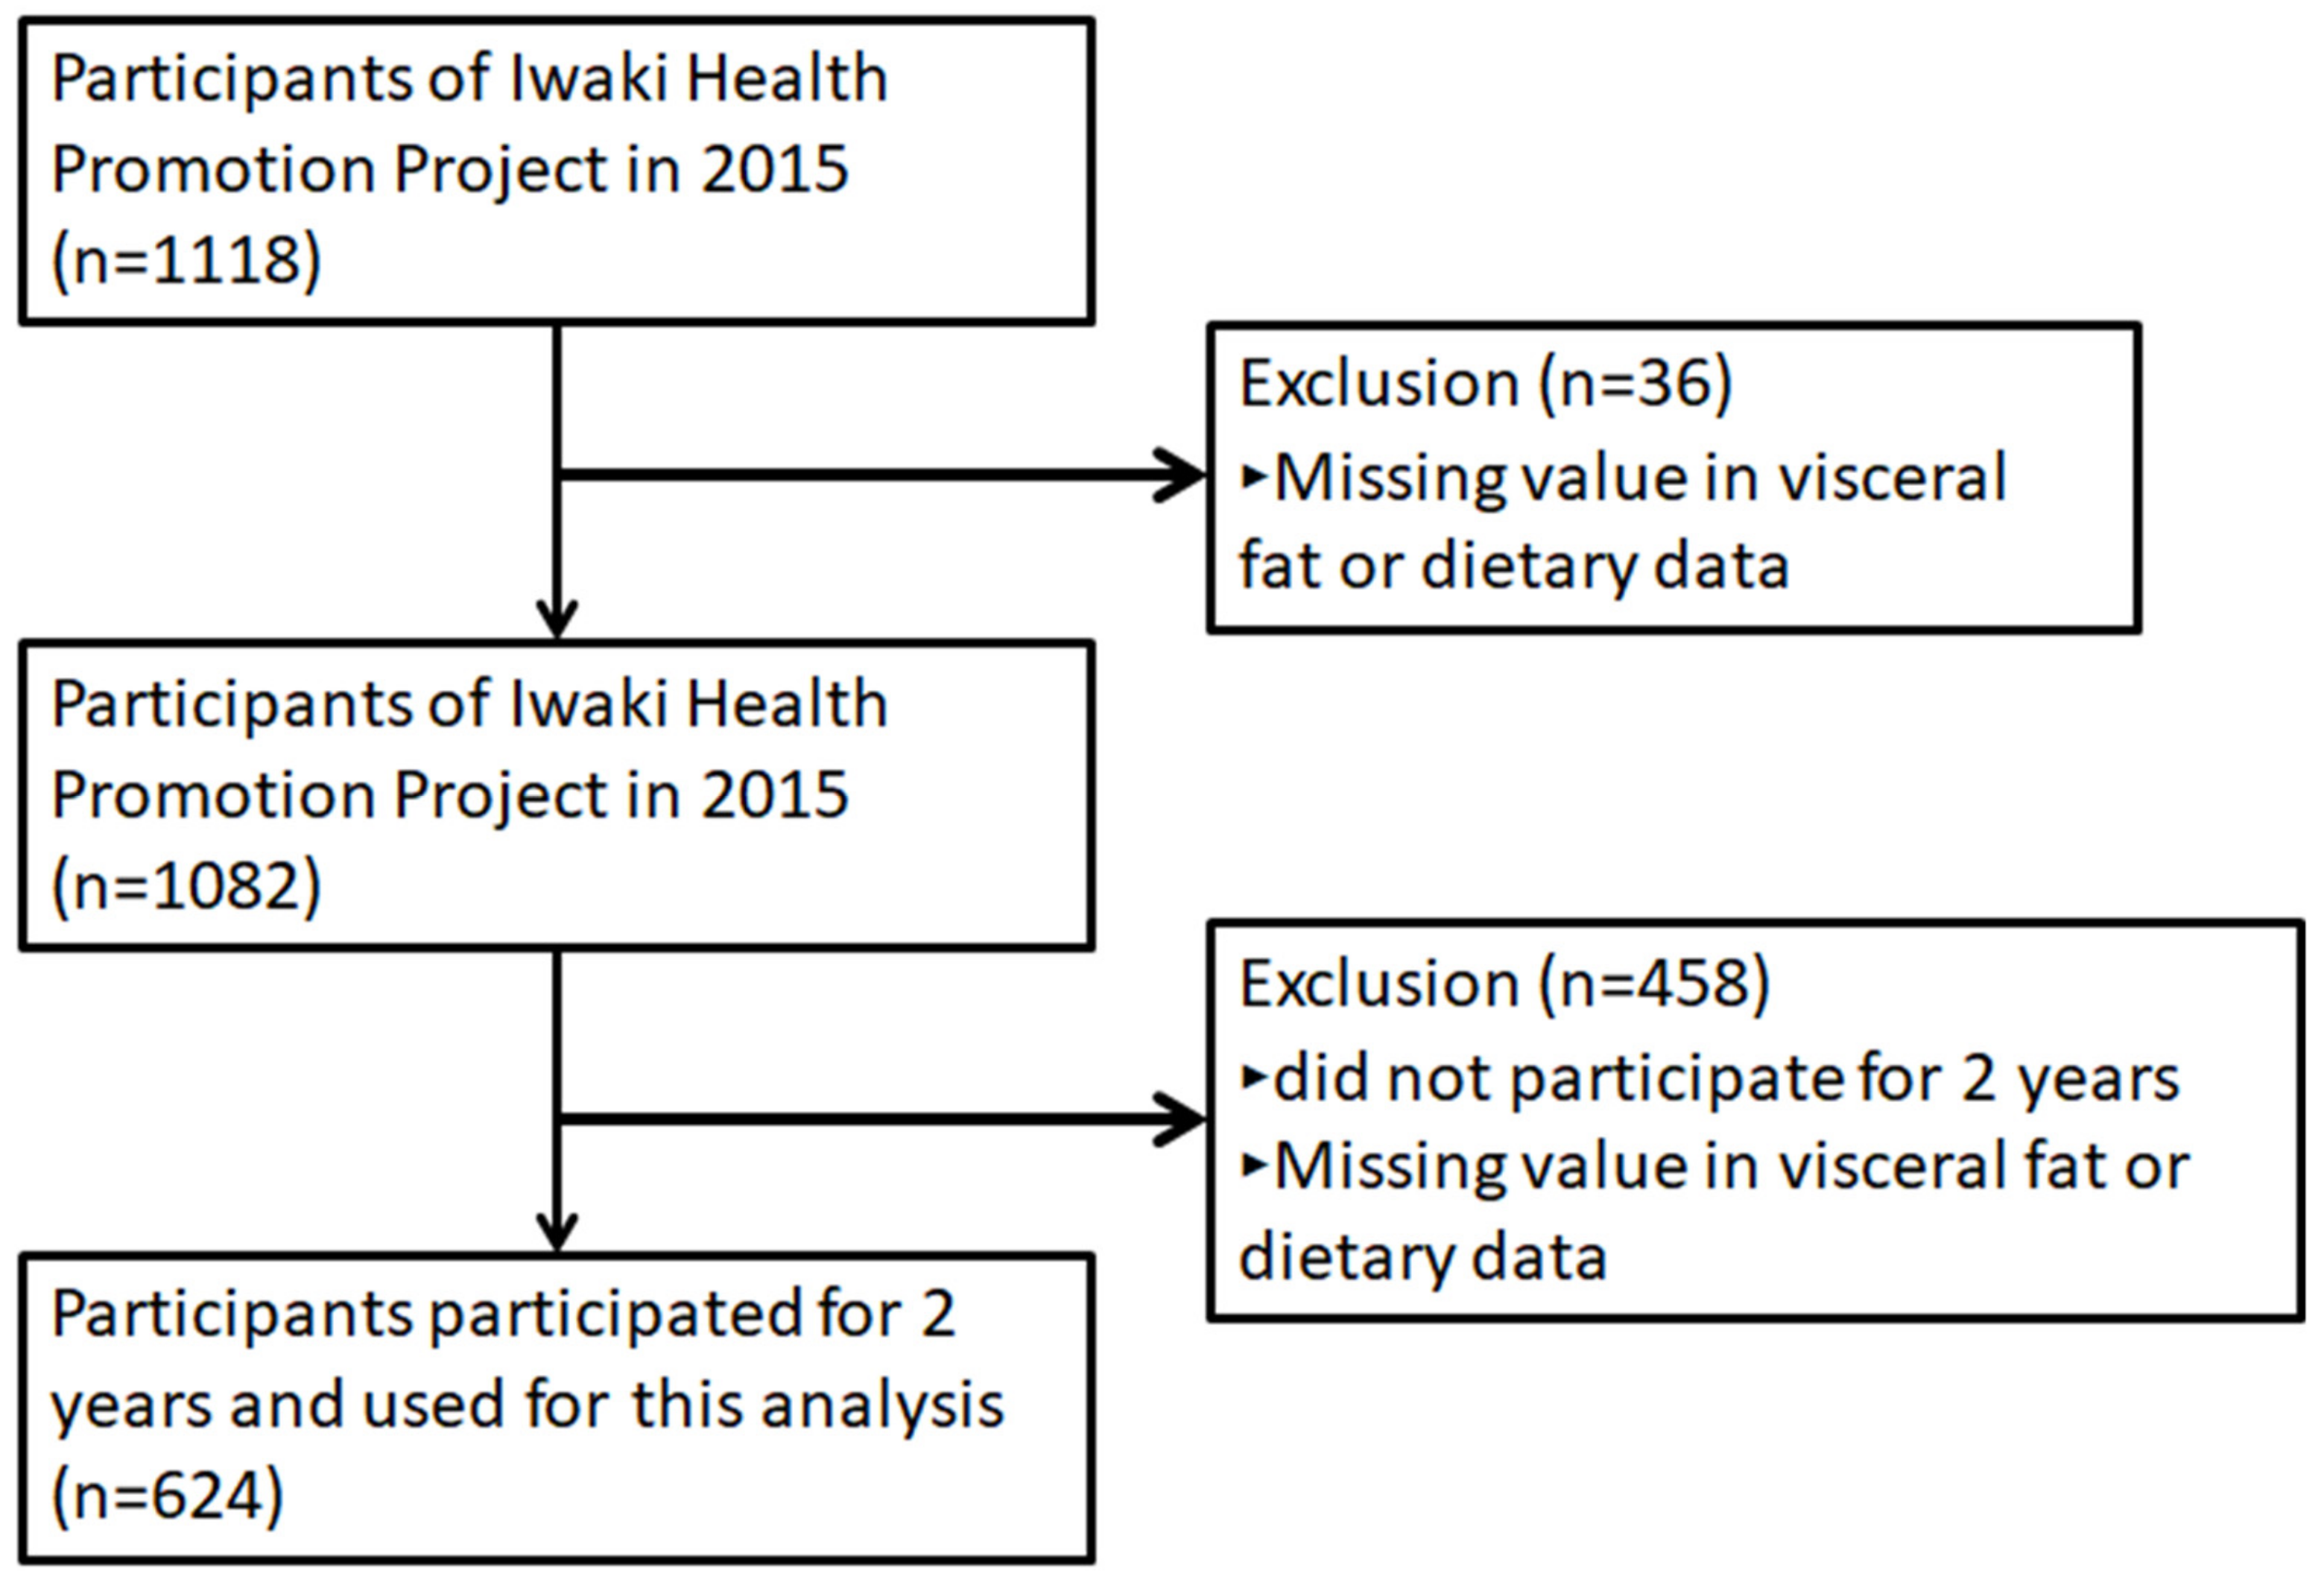
2.1. Study Subjects
2.2. Dietary Exposure
2.3. Measurements of Other Items
2.4. Statistical Analysis
2.5. Ethics Statement
3. Results
3.1. Baseline Characteristics Based on the Cut-Off Point for Visceral Obesity
3.2. Association Between Changes in VFA and Macronutrient Intake Over 2 Years
3.3. Association Between Macronutrients and Micronutrients
3.4. Macronutrients Associated with Change in VFA or BMI
4. Discussion
5. Conclusions
Author Contributions
Funding
Acknowledgments
Conflicts of Interest
References
- World Health Organization. Obesity: preventing and managing the global epidemic. In World Health Organization Technical Report Series 894; World Health Organization: Geneva, Switzerland, 2000; Volume 1–12, pp. 1–253. [Google Scholar]
- Beunza, J.J.; Toledo, E.; Hu, F.B.; Bes-Rastrollo, M.; Serrano-Martinez, M.; Sanchez-Villegas, A.; Martinez, J.A.; Martinez-Gonzalez, M.A. Adherence to the Mediterranean diet, long-term weight change, and incident overweight or obesity: The Seguimiento Universidad de Navarra (SUN) cohort. Am. J. Clin. Nutr. 2010, 92, 1484–1493. [Google Scholar] [CrossRef] [PubMed]
- GBD 2017 Diet Collaborators. Health effects of dietary risks in 195 countries, 1990–2017: A systematic analysis for the Global Burden of Disease Study 2017. Lancet 2019, 393, 1958–1972. [Google Scholar] [CrossRef]
- Tchernof, A.; Despres, J.P. Pathophysiology of human visceral obesity: An update. Physiol. Rev. 2013, 93, 359–404. [Google Scholar] [CrossRef] [PubMed]
- Kuk, J.L.; Katzmarzyk, P.T.; Nichaman, M.Z.; Church, T.S.; Blair, S.N.; Ross, R. Visceral fat is an independent predictor of all-cause mortality in men. Obesity 2006, 14, 336–341. [Google Scholar] [CrossRef]
- McNeely, M.J.; Shofer, J.B.; Leonetti, D.L.; Fujimoto, W.Y.; Boyko, E.J. Associations among visceral fat, all-cause mortality, and obesity-related mortality in Japanese Americans. Diabetes Care 2012, 35, 296–298. [Google Scholar]
- Koster, A.; Murphy, R.A.; Eiriksdottir, G.; Aspelund, T.; Sigurdsson, S.; Lang, T.F.; Gudnason, V.; Launer, L.J.; Harris, T.B. Fat distribution and mortality: The AGES-Reykjavik Study. Obesity 2015, 23, 893–897. [Google Scholar] [CrossRef]
- Matsushita, Y.; Nakagawa, T.; Yamamoto, S.; Takahashi, Y.; Yokoyama, T.; Noda, M.; Mizoue, T. Associations of visceral and subcutaneous fat areas with the prevalence of metabolic risk factor clustering in 6,292 Japanese individuals: The Hitachi Health Study. Diabetes Care 2010, 33, 2117–2119. [Google Scholar] [CrossRef]
- Shah, R.V.; Murthy, V.L.; Abbasi, S.A.; Blankstein, R.; Kwong, R.Y.; Goldfine, A.B.; Jerosch-Herold, M.; Lima, J.A.; Ding, J.; Allison, M.A. Visceral adiposity and the risk of metabolic syndrome across body mass index: The MESA Study. JACC Cardiovasc. Imaging 2014, 7, 1221–1235. [Google Scholar] [CrossRef]
- Kim, K.H.; Oh, S.W.; Kwon, H.; Park, J.H.; Choi, H.; Cho, B. Alcohol consumption and its relation to visceral and subcutaneous adipose tissues in healthy male Koreans. Ann. Nutr. Metab. 2012, 60, 52–61. [Google Scholar] [CrossRef]
- Mure, K.; Maeda, S.; Mukoubayashi, C.; Mugitani, K.; Iwane, M.; Kinoshita, F.; Mohara, O.; Takeshita, T. Habitual coffee consumption inversely associated with metabolic syndrome-related biomarkers involving adiponectin. Nutrition 2013, 29, 982–987. [Google Scholar]
- Kondoh, T.; Takase, H.; Yamaguchi, T.F.; Ochiai, R.; Katashima, M.; Katsuragi, Y.; Sakane, N. Association of dietary factors with abdominal subcutaneous and visceral adiposity in Japanese men. Obes. Res. Clin. Pract. 2014, 8, e16–e25. [Google Scholar] [CrossRef] [PubMed]
- Ruttgers, D.; Fischer, K.; Koch, M.; Lieb, W.; Muller, H.P.; Jacobs, G.; Kassubek, J.; Nothlings, U. Association of food consumption with total volumes of visceral and subcutaneous abdominal adipose tissue in a Northern German population. Br. J. Nutr. 2015, 114, 1929–1940. [Google Scholar] [CrossRef] [PubMed] [Green Version]
- Doubelt, I.; Totosy de Zepetnek, J.; MacDonald, M.J.; Atkinson, S.A. Influences of nutrition and adiposity on bone mineral density in individuals with chronic spinal cord injury: A cross-sectional, observational study. Bone Rep. 2015, 2, 26–31. [Google Scholar] [CrossRef] [PubMed] [Green Version]
- Sluijs, I.; Beulens, J.W.; Grobbee, D.E.; van der Schouw, Y.T. Dietary carotenoid intake is associated with lower prevalence of metabolic syndrome in middle-aged and elderly men. J. Nutr. 2009, 139, 987–992. [Google Scholar] [CrossRef] [PubMed]
- Loos, R.J.; Rankinen, T.; Leon, A.S.; Skinner, J.S.; Wilmore, J.H.; Rao, D.C.; Bouchard, C. Calcium intake is associated with adiposity in Black and White men and White women of the HERITAGE Family Study. J. Nutr. 2004, 134, 1772–1778. [Google Scholar] [CrossRef]
- Parikh, S.; Pollock, N.K.; Bhagatwala, J.; Guo, D.H.; Gutin, B.; Zhu, H.; Dong, Y. Adolescent fiber consumption is associated with visceral fat and inflammatory markers. J. Clin. Endocrinol. Metab. 2012, 97, E1451–E1457. [Google Scholar] [CrossRef]
- Pollock, N.K.; Bundy, V.; Kanto, W.; Davis, C.L.; Bernard, P.J.; Zhu, H.; Gutin, B.; Dong, Y. Greater fructose consumption is associated with cardiometabolic risk markers and visceral adiposity in adolescents. J. Nutr. 2012, 142, 251–257. [Google Scholar] [CrossRef]
- Takase, H.; Sakane, N.; Morimoto, T.; Uchida, T.; Mori, K.; Katashima, M.; Katsuragi, Y. Development of a Dietary Factor Assessment Tool for Evaluating Associations between Visceral Fat Accumulation and Major Nutrients in Japanese Adults. J. Obes. 2019, 2019, 9497861. [Google Scholar] [CrossRef]
- Bautista-Castano, I.; Sanchez-Villegas, A.; Estruch, R.; Martinez-Gonzalez, M.A.; Corella, D.; Salas-Salvado, J.; Covas, M.I.; Schroder, H.; Alvarez-Perez, J.; Quilez, J.; et al. Changes in bread consumption and 4-year changes in adiposity in Spanish subjects at high cardiovascular risk. Br. J. Nutr. 2013, 110, 337–346. [Google Scholar] [CrossRef]
- Hairston, K.G.; Vitolins, M.Z.; Norris, J.M.; Anderson, A.M.; Hanley, A.J.; Wagenknecht, L.E. Lifestyle factors and 5-year abdominal fat accumulation in a minority cohort: The IRAS Family Study. Obesity 2012, 20, 421–427. [Google Scholar] [CrossRef]
- Bush, N.C.; Alvarez, J.A.; Choquette, S.S.; Hunter, G.R.; Oster, R.A.; Darnell, B.E.; Gower, B.A. Dietary calcium intake is associated with less gain in intra-abdominal adipose tissue over 1 year. Obesity 2010, 18, 2101–2104. [Google Scholar] [CrossRef] [PubMed]
- Davis, J.N.; Alexander, K.E.; Ventura, E.E.; Toledo-Corral, C.M.; Goran, M.I. Inverse relation between dietary fiber intake and visceral adiposity in overweight Latino youth. Am. J. Clin. Nutr. 2009, 90, 1160–1166. [Google Scholar] [CrossRef] [PubMed] [Green Version]
- Koga, R.; Tanaka, M.; Tsuda, H.; Imai, K.; Abe, S.; Masuda, T.; Iwamoto, M.; Nakazono, E.; Kamohara, T.; Sakata, T. Daily exercise fluctuations and dietary patterns during training predict visceral fat regain in obese women. Am. J. Med. Sci. 2008, 336, 450–457. [Google Scholar] [CrossRef] [PubMed]
- Tanaka, S.; Horimai, C.; Katsukawa, F. Ethnic differences in abdominal visceral fat accumulation between Japanese, African-Americans, and Caucasians: A meta-analysis. Acta Diabetol. 2003, 40 (Suppl. 1), S302–S304. [Google Scholar] [CrossRef]
- Daimon, M.; Kamba, A.; Murakami, H.; Mizushiri, S.; Osonoi, S.; Matsuki, K.; Sato, E.; Tanabe, J.; Takayasu, S.; Matsuhashi, Y.; et al. Dominance of the hypothalamus-pituitary-adrenal axis over the renin-angiotensin-aldosterone system is a risk factor for decreased insulin secretion. Sci. Rep. 2017, 7, 11360. [Google Scholar] [CrossRef]
- Iino, C.; Shimoyama, T.; Chinda, D.; Arai, T.; Chiba, D.; Nakaji, S.; Fukuda, S. Infection of Helicobacter pylori and Atrophic Gastritis Influence Lactobacillus in Gut Microbiota in a Japanese Population. Front. Immunol. 2018, 9, 712. [Google Scholar] [CrossRef] [Green Version]
- Iino, C.; Shimoyama, T.; Iino, K.; Yokoyama, Y.; Chinda, D.; Sakuraba, H.; Fukuda, S.; Nakaji, S. Daidzein Intake Is Associated with Equol Producing Status through an Increase in the Intestinal Bacteria Responsible for Equol Production. Nutrients 2019, 11, 433. [Google Scholar] [CrossRef]
- Kumagai, G.; Wada, K.; Kudo, H.; Asari, T.; Chiba, D.; Ota, S.; Takeda, O.; Koyama, K.; Nakaji, S.; Ishibashi, Y. Associations between cervical disc degeneration and muscle strength in a cross-sectional population-based study. PLoS ONE 2019, 14, e0210802. [Google Scholar] [CrossRef]
- Sasaki, S.; Yanagibori, R.; Amano, K. Self-Administered diet history questionnaire developed for health education: A relative validation of the test-version by comparison with 3-day diet record in women. J. Epidemiol. 1998, 8, 203–215. [Google Scholar] [CrossRef]
- Sasaki, S.; Ushio, F.; Amano, K.; Morihara, M.; Todoriki, O.; Uehara, Y.; Toyooka, E. Serum biomarker-based validation of a self-administered diet history questionnaire for Japanese subjects. J. Nutr. Sci. Vitaminol. 2000, 46, 285–296. [Google Scholar] [CrossRef]
- Kobayashi, S.; Honda, S.; Murakami, K.; Sasaki, S.; Okubo, H.; Hirota, N.; Notsu, A.; Fukui, M.; Date, C. Both comprehensive and brief self-administered diet history questionnaires satisfactorily rank nutrient intakes in Japanese adults. J. Epidemiol. 2012, 22, 151–159. [Google Scholar] [CrossRef] [PubMed]
- Kobayashi, S.; Murakami, K.; Sasaki, S.; Okubo, H.; Hirota, N.; Notsu, A.; Fukui, M.; Date, C. Comparison of relative validity of food group intakes estimated by comprehensive and brief-type self-administered diet history questionnaires against 16 d dietary records in Japanese adults. Public Health Nutr. 2011, 14, 1200–1211. [Google Scholar] [CrossRef] [PubMed]
- Sukenobe, Y.; Terauchi, M.; Hirose, A.; Hirano, M.; Akiyoshi, M.; Kato, K.; Miyasaka, N. Normal/high-fat milk consumption is associated with higher lean body and muscle mass in Japanese women aged between 40 and 60 years: A cross-sectional study. BMC Womens Health 2018, 18, 32. [Google Scholar] [CrossRef] [PubMed]
- Tsuruya, K.; Fukuma, S.; Wakita, T.; Ninomiya, T.; Nagata, M.; Yoshida, H.; Fujimi, S.; Kiyohara, Y.; Kitazono, T.; Uchida, K.; et al. Dietary patterns and clinical outcomes in hemodialysis patients in Japan: A cohort study. PLoS ONE 2015, 10, e0116677. [Google Scholar] [CrossRef]
- Ryo, M.; Maeda, K.; Onda, T.; Katashima, M.; Okumiya, A.; Nishida, M.; Yamaguchi, T.; Funahashi, T.; Matsuzawa, Y.; Nakamura, T.; et al. A new simple method for the measurement of visceral fat accumulation by bioelectrical impedance. Diabetes Care 2005, 28, 451–453. [Google Scholar] [CrossRef]
- Ainsworth, B.E.; Haskell, W.L.; Herrmann, S.D.; Meckes, N.; Bassett, D.R., Jr.; Tudor-Locke, C.; Greer, J.L.; Vezina, J.; Whitt-Glover, M.C.; Leon, A.S. 2011 Compendium of Physical Activities: A second update of codes and MET values. Med. Sci. Sports Exerc. 2011, 43, 1575–1581. [Google Scholar] [CrossRef]
- Examination Committee of Criteria for ’Obesity Disease’ in Japan. Japan Society for the Study of Obesity: New criteria for ’obesity disease’ in Japan. Circ. J. 2002, 66, 987–992. [Google Scholar] [CrossRef]
- Ventura, E.; Davis, J.; Byrd-Williams, C.; Alexander, K.; McClain, A.; Lane, C.J.; Spruijt-Metz, D.; Weigensberg, M.; Goran, M. Reduction in risk factors for type 2 diabetes mellitus in response to a low-sugar, high-fiber dietary intervention in overweight Latino adolescents. Arch. Pediatr. Adolesc. Med. 2009, 163, 320–327. [Google Scholar] [CrossRef]
- Aoe, S.; Ichinose, Y.; Kohyama, N.; Komae, K.; Takahashi, A.; Abe, D.; Yoshioka, T.; Yanagisawa, T. Effects of high beta-glucan barley on visceral fat obesity in Japanese individuals: A randomized, double-blind study. Nutrition 2017, 42, 1–6. [Google Scholar] [CrossRef]
- Bailey, B.W.; Sullivan, D.K.; Kirk, E.P.; Donnelly, J.E. Dietary predictors of visceral adiposity in overweight young adults. Br. J. Nutr. 2010, 103, 1702–1705. [Google Scholar] [CrossRef] [Green Version]
- Buettner, R.; Bettermann, I.; Hechtl, C.; Gabele, E.; Hellerbrand, C.; Scholmerich, J.; Bollheimer, L.C. Dietary folic acid activates AMPK and improves insulin resistance and hepatic inflammation in dietary rodent models of the metabolic syndrome. Horm. Metab. Res. 2010, 42, 769–774. [Google Scholar] [CrossRef] [PubMed]
- Rayssiguier, Y.; Gueux, E.; Nowacki, W.; Rock, E.; Mazur, A. High fructose consumption combined with low dietary magnesium intake may increase the incidence of the metabolic syndrome by inducing inflammation. Magnes. Res. 2006, 19, 237–243. [Google Scholar] [PubMed]
- Zhou, B.; Su, X.; Su, D.; Zeng, F.; Wang, M.H.; Huang, L.; Huang, E.; Zhu, Y.; Zhao, D.; He, D.; et al. Dietary intake of manganese and the risk of the metabolic syndrome in a Chinese population. Br. J. Nutr. 2016, 116, 853–863. [Google Scholar] [CrossRef] [PubMed] [Green Version]
- Knapen, M.H.J.; Jardon, K.M.; Vermeer, C. Vitamin K-induced effects on body fat and weight: Results from a 3-year vitamin K2 intervention study. Eur. J. Clin. Nutr. 2018, 72, 136–141. [Google Scholar] [CrossRef] [PubMed]
- Larson, D.E.; Hunter, G.R.; Williams, M.J.; Kekes-Szabo, T.; Nyikos, I.; Goran, M.I. Dietary fat in relation to body fat and intraabdominal adipose tissue: A cross-sectional analysis. Am. J. Clin. Nutr. 1996, 64, 677–684. [Google Scholar] [CrossRef] [PubMed]
- Moslehi, N.; Ehsani, B.; Mirmiran, P.; Hojjat, P.; Azizi, F. Association of Dietary Proportions of Macronutrients with Visceral Adiposity Index: Non-Substitution and Iso-Energetic Substitution Models in a Prospective Study. Nutrients 2015, 7, 8859–8870. [Google Scholar] [CrossRef] [PubMed] [Green Version]
- Zhu, W.; Cai, D.; Wang, Y.; Lin, N.; Hu, Q.; Qi, Y.; Ma, S.; Amarasekara, S. Calcium plus vitamin D3 supplementation facilitated fat loss in overweight and obese college students with very-low calcium consumption: A randomized controlled trial. Nutr. J. 2013, 12, 8. [Google Scholar] [CrossRef]
- Rosenblum, J.L.; Castro, V.M.; Moore, C.E.; Kaplan, L.M. Calcium and vitamin D supplementation is associated with decreased abdominal visceral adipose tissue in overweight and obese adults. Am. J. Clin. Nutr. 2012, 95, 101–108. [Google Scholar] [CrossRef]
- Molenaar, E.A.; Massaro, J.M.; Jacques, P.F.; Pou, K.M.; Ellison, R.C.; Hoffmann, U.; Pencina, K.; Shadwick, S.D.; Vasan, R.S.; O’Donnell, C.J.; et al. Association of lifestyle factors with abdominal subcutaneous and visceral adiposity: The Framingham Heart Study. Diabetes Care 2009, 32, 505–510. [Google Scholar] [CrossRef]
- Sumi, M.; Hisamatsu, T.; Fujiyoshi, A.; Kadota, A.; Miyagawa, N.; Kondo, K.; Kadowaki, S.; Suzuki, S.; Torii, S.; Zaid, M.; et al. Association of alcohol consumption with fat deposition in a community-based sample of Japanese men: The Shiga Epidemiological Study of Subclinical Atherosclerosis (SESSA). J. Epidemiol. 2018, 29. [Google Scholar] [CrossRef]
- Beulens, J.W.; van Beers, R.M.; Stolk, R.P.; Schaafsma, G.; Hendriks, H.F. The effect of moderate alcohol consumption on fat distribution and adipocytokines. Obesity 2006, 14, 60–66. [Google Scholar] [CrossRef] [PubMed]
- Zhan, J.; Liu, Y.J.; Cai, L.B.; Xu, F.R.; Xie, T.; He, Q.Q. Fruit and vegetable consumption and risk of cardiovascular disease: A meta-analysis of prospective cohort studies. Crit. Rev. Food Sci. Nutr. 2017, 57, 1650–1663. [Google Scholar] [CrossRef] [PubMed]
- Lampe, J.W. Health effects of vegetables and fruit: Assessing mechanisms of action in human experimental studies. Am. J. Clin. Nutr. 1999, 70 (Suppl. 3), 475S–490S. [Google Scholar] [CrossRef] [PubMed]
- Kant, A.K.; Schatzkin, A.; Graubard, B.I.; Schairer, C. A prospective study of diet quality and mortality in women. JAMA 2000, 283, 2109–2115. [Google Scholar] [CrossRef] [PubMed]
- Osler, M.; Heitmann, B.L.; Gerdes, L.U.; Jorgensen, L.M.; Schroll, M. Dietary patterns and mortality in Danish men and women: A prospective observational study. Br. J. Nutr. 2001, 85, 219–225. [Google Scholar] [CrossRef] [PubMed]


| MEN | WOMEN | |||||
|---|---|---|---|---|---|---|
| Characteristics | VFA < 100 | 100 ≤VFA | pa | VFA < 100 | 100 ≤ VFA | pa |
| Number of participants | 116 | 144 | 319 | 45 | ||
| Age (yr) | 52.1 ± 14.5 | 55.5 ± 13.8 | 54.5 ± 13.7 | 59.5 ± 11.6 | - | |
| Metabolic risk factors: | ||||||
| Body mass index (kg/m2) | 21.7 ± 2.0 | 25.2 ± 2.7 | - | 21.4 ± 2.7 | 27.1 ± 3.6 | - |
| Waist circumference (cm) | 76.9 ± 5.1 | 87.7 ± 6.6 | - | 71.8 ± 7.3 | 87.1 ± 7.7 | - |
| Visceral fat mass (cm2) | 6.9 ± 17.5 | 137.1 ± 28.8 | - | 57.9 ± 22.8 | 125.8 ± 24.6 | - |
| Glucose (mmol/l) | 4.5 ± 0.6 | 5.0 ± 1.1 | <0.001 *** | 4.4 ± 0.7 | 4.8 ± 0.7 | <0.001 *** |
| HbA1c (%) | 5.6 ± 0.4 | 5.9 ± 0.8 | <0.001 *** | 5.7 ± 0.5 | 6.0 ± 0.7 | <0.001 *** |
| SBP (mmHg) | 122.5 ± 18.1 | 128.2 ± 16.6 | <0.001 *** | 117.3 ± 16.4 | 130.2 ± 16.9 | <0.001 *** |
| DBP (mmHg) | 77.4 ± 12.6 | 79.2 ± 10.2 | 0.021 * | 71.8 ± 10.3 | 76.3 ± 10.4 | <0.001 *** |
| TG (mmol/l) | 1.1 ± 0.7 | 1.7 ± 1.4 | <0.001 *** | 0.9 ± 0.4 | 1.2 ± 0.5 | <0.001 *** |
| HDL-cholesterol (mmol/l) | 1.7 ± 0.4 | 1.5 ± 0.5 | <0.001 *** | 1.9 ± 0.4 | 1.6 ± 0.3 | <0.001 *** |
| LDL-cholesterol (mmol/l) | 2.9 ± 0.7 | 3.1 ± 0.7 | 0.001 ** | 3.0 ± 0.8 | 3.2 ± 0.7 | 0.001 ** |
| Lifestyle habits: | ||||||
| Smoking habits (stick/d) | 12.8 ± 17.8 | 11.5 ± 11.9 | - | 2.3 ± 5.3 | 2.1 ± 4.9 | - |
| Sleep time (h/d) | 7.0 ± 1.2 | 7.3 ± 1.2 | - | 6.7 ± 1.0 | 7.1 ± 0.9 | - |
| Amount of exercise (Mets/d) | 6.9 ± 17.5 | 8.4 ± 18.4 | - | 4.3 ± 10.7 | 6.0 ± 10.8 | - |
| Dietary habits: | ||||||
| Energy (kcal/d) | 2189.1 ± 667.7 | 2107.3 ± 543.7 | 0.331 | 1655 ± 439 | 1752 ± 503 | 0.517 |
| Macronutrient: | ||||||
| Protein (g/d) | 76.1 ± 29.6 | 74.5 ± 24.5 | 0.422 | 64.0 ± 22.1 | 67.8 ± 25.8 | 0.489 |
| Fat (g/d) | 55.2 ± 22.0 | 54.5 ± 18.3 | 0.645 | 49.3 ± 17.3 | 50.0 ± 20.6 | 0.473 |
| Carbohydrate (g/d) | 303.1 ± 101.9 | 281.8 ± 82.4 | 0.115 | 225.8 ± 63.0 | 242.8 ± 64.9 | 0.130 |
| Micronutrient: | ||||||
| Ash (g/d) | 19.6 ± 6.7 | 19.6 ± 5.7 | 0.647 | 16.5 ± 5.0 | 17.8 ± 6.0 | 0.184 |
| Sodium (mg/d) | 4864 ± 1672 | 4824 ± 1331 | 0.421 | 3845 ± 1145 | 4332 ± 1445 | 0.033 * |
| Potassium (mg/d) | 2394 ± 976 | 2416 ± 929 | 0.860 | 2224 ± 823 | 2208 ± 846 | 0.977 |
| Calcium (mg/d) | 483 ± 209 | 519 ± 236 | 0.539 | 480 ± 196 | 490 ± 210 | 0.666 |
| Magnesium (mg/d) | 269 ± 99 | 267 ± 89 | 0.692 | 232 ± 78 | 237 ± 85 | 0.633 |
| Phosphorus (mg/d) | 1109 ± 420 | 1105 ± 373 | 0.614 | 957 ± 331 | 1005 ± 387 | 0.481 |
| Iron (mg/d) | 8.0 ± 3.6 | 7.8 ± 2.8 | 0.495 | 7.1 ± 2.6 | 7.2 ± 2.9 | 0.839 |
| Zinc (mg/d) | 9.0 ± 3.2 | 8.8 ± 2.5 | 0.601 | 7.5 ± 2.3 | 7.9 ± 2.6 | 0.522 |
| Copper (mg/d) | 1.3 ± 0.5 | 1.3 ± 0.4 | 0.503 | 1.1 ± 0.3 | 1.1 ± 0.3 | 0.410 |
| Manganese (mg/d) | 3.3 ± 1.2 | 3.2 ± 1.1 | 0.408 | 2.7 ± 0.9 | 2.9 ± 1.0 | 0.367 |
| Vitamin A (retinol equivalent) (µg/d) | 732 ± 861 | 626 ± 333 | 0.076 | 584 ± 321 | 559 ± 343 | 0.406 |
| Retinol (µg/d) | 503 ± 779 | 397 ± 263 | 0.048* | 321 ± 230 | 345 ± 272 | 0.804 |
| β-carotene equivalent (µg/d) | 2706 ± 2060 | 2710 ± 2012 | 0.239 | 3122 ± 2111 | 2536 ± 1811 | 0.978 |
| Vitamin D (µg/d) | 15.1 ± 10.7 | 14.3 ± 9.8 | 0.155 | 13.4 ± 9.2 | 14.3 ± 11.9 | 0.310 |
| α-tocopherol (mg/d) | 7.1 ± 3.3 | 6.9 ± 2.5 | 0.676 | 6.5 ± 2.5 | 6.5 ± 2.7 | 0.544 |
| Vitamin K (µg/d) | 320.3 ± 172.0 | 322.0 ± 167.1 | 0.633 | 303 ± 161 | 282 ± 143 | 0.484 |
| Thiamin (mg/d) | 0.7 ± 0.3 | 0.7 ± 0.3 | 0.798 | 0.7 ± 0.2 | 0.7 ± 0.3 | 0.797 |
| Riboflavin (mg/d) | 1.3 ± 0.6 | 1.3 ± 0.5 | 0.694 | 1.2 ± 0.4 | 1.2 ± 0.4 | 0.839 |
| Niacin (mg/d) | 19.2 ± 8.2 | 18.2 ± 7.7 | 0.219 | 15.6 ± 6.2 | 15.6 ± 6.8 | 0.812 |
| Vitamin B6 (mg/d) | 1.3 ± 0.6 | 1.3 ± 0.5 | 0.582 | 1.1 ± 0.4 | 1.1 ± 0.5 | 0.805 |
| Vitamin B12 (µg/d) | 11.5 ± 8.3 | 10.4 ± 6.1 | 0.091 | 9.1 ± 5.5 | 9.7 ± 6.4 | 0.324 |
| Folate (µg/d) | 317.1 ± 158.7 | 306.3 ± 130.2 | 0.616 | 282 ± 126 | 274 ± 117 | 0.659 |
| Pantothenic acid (mg/d) | 6.8 ± 2.6 | 6.8 ± 2.2 | 0.848 | 5.9 ± 2.0 | 6.1 ± 2.1 | 0.658 |
| Vitamin C (mg/d) | 83.6 ± 52.2 | 86.0 ± 53.2 | 0.584 | 85.9 ± 47.6 | 87.9 ± 49.0 | 0.804 |
| Saturated fat (g/d) | 14.4 ± 6.1 | 14.3 ± 5.6 | 0.584 | 13.1 ± 5.2 | 13.4 ± 6.1 | 0.822 |
| Monounsaturated fat (g/d) | 19.6 ± 8.0 | 19.3 ± 6.8 | 0.706 | 17.3 ± 6.2 | 17.5 ± 7.7 | 0.326 |
| Polyunsaturated fat (g/d) | 14.0 ± 5.7 | 14.0 ± 4.4 | 0.840 | 12.4 ± 4.2 | 12.4 ± 4.6 | 0.296 |
| n-3 polyunsaturated fat (g/d) | 2.9 ± 1.4 | 2.8 ± 1.1 | 0.315 | 2.6 ± 1.1 | 2.6 ± 1.2 | 0.755 |
| n-6 polyunsaturated fat (g/d) | 11.1 ± 4.4 | 11.1 ± 3.5 | 0.941 | 9.8 ± 3.3 | 9.8 ± 3.6 | 0.218 |
| Cholesterol (mg/d) | 382.7 ± 189.1 | 381.5 ± 156.4 | 0.790 | 331 ± 148 | 342 ± 181 | 0.766 |
| Total dietary fiber (g/d) | 11.8 ± 5.4 | 11.7 ± 4.7 | 0.977 | 10.8 ± 4.2 | 11.0 ± 4.2 | 0.705 |
| Soluble dietary fiber (g/d) | 2.9 ± 1.5 | 2.9 ± 1.3 | 0.950 | 2.7 ± 1.1 | 2.7 ± 1.1 | 0.942 |
| Insoluble dietary fiber (g/d) | 8.5 ± 3.7 | 8.4 ± 3.2 | 0.990 | 7.8 ± 2.9 | 7.9 ± 2.9 | 0.682 |
| Alcohol (g/d) | 19.5 ± 21.2 | 22.1 ± 22.6 | 0.236 | 4.2 ± 10.6 | 5.0 ± 11.6 | 0.517 |
| Daidzein (mg/d) | 15.8 ± 10.3 | 16.7 ± 10.0 | 0.714 | 15.3 ± 9.2 | 15.8 ± 8.4 | 0.700 |
| Genistein (mg/d) | 26.7 ± 17.3 | 28.3 ± 17.0 | 0.720 | 25.9 ± 15.5 | 26.8 ± 14.2 | 0.684 |
| Change in VFA | Adjusted by Model 1 a | Adjusted by Model 2 b | |||||||
|---|---|---|---|---|---|---|---|---|---|
| Characteristics | Q1 | Q2 | Q3 | β (s.e.) | p | β (s.e.) | p | ||
| Number of participants | 203(79/124) | 213(67/146) | 208(114/94) | ||||||
| Baseline age (y) | 55.0 ± 13.6 | 54.7 ± 14.6 | 54.2 ± 13.3 | ||||||
| Visceral fat mass (Δcm2) | −9.1 ± 5.2 | 0.6 ± 2.2 | 10.9 ± 6.7 | ||||||
| Energy (Δkcal/d) | −1.5 ± 226.4 | 15.0 ± 199.7 | 21.2 ± 224.3 | 0.002 | (0.002) | 0.239 | - | - | - |
| Macronutrient: | |||||||||
| Protein (Δg/d) | 0.72 ± 10.80 | 2.29 ± 10.26 | 0.99 ± 11.17 | 0.043 | (0.033) | 0.193 | 0.033 | (0.055) | 0.548 |
| Fat (Δg/d) | 0.62 ± 8.78 | 0.97 ± 7.78 | 0.82 ± 8.56 | 0.057 | (0.043) | 0.186 | 0.042 | (0.066) | 0.527 |
| Carbohydrate (Δg/d) | −2.83 ± 31.90 | −1.10 ± 29.38 | 0.99 ± 34.22 | 0.005 | (0.011) | 0.632 | −0.035 | (0.022) | 0.108 |
| Macronutrient | |||
|---|---|---|---|
| Protein | Fat | Carbohydrate | |
| Characteristics | Correlation Coefficient (r)a | ||
| Micronutrient: | |||
| Ash (Δg/d) | 0.88 *** | 0.71 *** | 0.54 *** |
| Sodium (Δmg/d) | 0.78 *** | 0.61 *** | 0.50 *** |
| Potassium (Δmg/d) | 0.79 *** | 0.70 *** | 0.49 *** |
| Calcium (Δmg/d) | 0.69 *** | 0.60 *** | 0.39 *** |
| Magnesium (Δmg/d) | 0.85 *** | 0.70 *** | 0.56 *** |
| Phosphorus (Δmg/d) | 0.96 *** | 0.81 *** | 0.53 *** |
| Iron (Δmg/d) | 0.84 *** | 0.72 *** | 0.48 *** |
| Zinc (Δmg/d) | 0.92 *** | 0.79 *** | 0.63 *** |
| Copper (Δmg/d) | 0.80 *** | 0.61 *** | 0.72 *** |
| Manganese (Δmg/d) | 0.43 *** | 0.32 *** | 0.60 *** |
| Vitamin A (retinol equivalent) (Δµg/d) | 0.45 *** | 0.45 *** | 0.21 *** |
| Retinol (Δµg/d) | 0.47 *** | 0.46 *** | 0.19 *** |
| β-carotene equivalente (Δµg/d) | 0.37 *** | 0.32 *** | 0.21 *** |
| Vitamin D (Δµg/d) | 0.70 *** | 0.51 *** | 0.21 *** |
| α-tocopherol (Δmg/d)) | 0.79 *** | 0.84 *** | 0.41 *** |
| Vitamin K (Δµg/d) | 0.50 *** | 0.47 *** | 0.25 *** |
| Thiamin (Δmg/d) | 0.85 *** | 0.80 *** | 0.52 *** |
| Riboflavin (Δmg/d) | 0.82 *** | 0.77 *** | 0.41 *** |
| Niacin (Δmg/d) | 0.85 *** | 0.73 *** | 0.36 *** |
| Vitamin B6 (Δmg/d) | 0.87 *** | 0.76 *** | 0.46 *** |
| Vitamin B12 (Δmg/d) | 0.71 *** | 0.53 *** | 0.19 *** |
| Folate (Δµg/d) | 0.58 *** | 0.52 *** | 0.37 *** |
| Pantothenic acid (Δmg/d) | 0.90 *** | 0.80 *** | 0.58 *** |
| Vitamin C (Δmg/d) | 0.44 *** | 0.41 *** | 0.35 *** |
| Saturated fat (Δg/d) | 0.74 *** | 0.91 *** | 0.42 *** |
| Monounsaturated fat (Δg/d) | 0.79 *** | 0.98 *** | 0.38 *** |
| Polyunsaturated fat (Δg/d) | 0.77 *** | 0.90 *** | 0.38 *** |
| n-3 polyunsaturated fat (Δg/d) | 0.78 *** | 0.81 *** | 0.30 *** |
| n-6 polyunsaturated fat (Δg/d) | 0.72 *** | 0.87 *** | 0.39 *** |
| Cholesterol (Δmg/d) | 0.80 *** | 0.72 *** | 0.32 *** |
| Total dietary fiber (Δg/d) | 0.59 *** | 0.49 *** | 0.56 *** |
| Soluble dietary fiber (Δg/d) | 0.54 *** | 0.46 *** | 0.47 *** |
| Insoluble dietary fiber (Δg/d) | 0.59 *** | 0.49 *** | 0.59 *** |
| Alcohol (Δg/d) | 0.02 | 0.07 | 0.06 |
| Daidzein (Δmg/d) | 0.42 *** | 0.35 *** | 0.21 *** |
| Genistein (Δmg/d) | 0.42 *** | 0.35 *** | 0.21 *** |
| Change in VFA | Change in BMI | |||||||||||
|---|---|---|---|---|---|---|---|---|---|---|---|---|
| Characteristics | Adjusted by Model 1 | Adjusted by Model 2 | Adjusted by Model 3 | Adjusted by Model 4 | ||||||||
| Micronutrient: | β (s.e.) | p | β (s.e.) | p | β (s.e.) | p | β (s.e.) | p | ||||
| Ash (Δg/d) | −0.03 | (0.24) | 0.904 | −0.32 | (0.36) | 0.369 | −0.001 | (0.011) | 0.956 | −0.005 | (0.016) | 0.727 |
| Sodium (Δmg/d) | 0.00 | (0.00) | 0.694 | 0.00 | (0.00) | 0.949 | 0.000 | (0.000) | 0.957 | 0.000 | (0.000) | 0.965 |
| Potassium (Δmg/d) | −0.00 | (0.00) | 0.250 | −0.01 | (0.00) | 0.039 * | 0.000 | (0.000) | 0.682 | 0.000 | (0.000) | 0.455 |
| Calcium (Δmg/d) | 0.00 | (0.00) | 0.372 | −0.01 | (0.01) | 0.134 | 0.000 | (0.000) | 0.524 | 0.000 | (0.000) | 0.605 |
| Magnesium (Δmg/d) | −0.02 | (0.02) | 0.209 | −0.06 | (0.02) | 0.018 * | 0.000 | (0.001) | 0.565 | −0.001 | (0.001) | 0.272 |
| Phosphorus (Δmg/d) | 0.00 | (0.00) | 0.951 | −0.01 | (0.01) | 0.111 | 0.000 | (0.000) | 0.797 | 0.000 | (0.000) | 0.724 |
| Iron (Δmg/d) | −0.34 | (0.44) | 0.445 | −1.06 | (0.61) | 0.084 | −0.004 | (0.019) | 0.673 | −0.019 | (0.027) | 0.471 |
| Zinc (Δmg/d) | 0.26 | (0.65) | 0.684 | −0.20 | (1.00) | 0.844 | 0.082 | (0.044) | 0.062 | 0.082 | (0.044) | 0.062 |
| Copper (Δmg/d) | −7.34 | (4.45) | 0.100 | −10.4 | (5.39) | 0.055 | −0.089 | (0.197) | 0.650 | −0.133 | (0.239) | 0.578 |
| Manganese (Δmg/d) | −2.43 | (1.02) | 0.018 | −2.19 | (1.07) | 0.042 * | 0.000 | (0.001) | 0.565 | −0.001 | (0.001) | 0.272 |
| Vitamin A (retinol equivalent) (Δµg/d) | 0.00 | (0.00) | 0.582 | 0.00 | (0.00) | 0.436 | 0.000 | (0.000) | 0.980 | 0.000 | (0.000) | 0.938 |
| Retinol (Δµg/d) | 0.00 | (0.00) | 0.618 | 0.00 | (0.00) | 0.501 | 0.000 | (0.000) | 0.940 | 0.000 | (0.000) | 0.898 |
| β-carotene equivalente (Δµg/d) | 0.00 | (0.00) | 0.885 | 0.00 | (0.00) | 0.726 | 0.000 | (0.000) | 0.992 | 0.000 | (0.000) | 0.944 |
| Vitamin D (Δµg/d) | 0.07 | (0.08) | 0.423 | 0.09 | (0.12) | 0.452 | −0.003 | (0.004) | 0.375 | −0.010 | (0.005) | 0.063 |
| β-tocopherol (Δmg/d) | 0.44 | (0.43) | 0.307 | 0.34 | (0.62) | 0.578 | −0.023 | (0.019) | 0.219 | −0.061 | (0.027) | 0.023 * |
| Vitamin K (Δµg/d) | −0.01 | (0.01) | 0.131 | −0.01 | (5.85) | 0.050 * | 0.000 | (0.000) | 0.360 | 0.000 | (0.000) | 0.395 |
| Thiamin (Δmg/d) | −2.58 | (5.27) | 0.625 | −11.9 | (7.48) | 0.111 | 0.112 | (0.232) | 0.629 | 0.085 | (0.330) | 0.797 |
| Riboflavin (Δmg/d) | 0.12 | (0.12) | 0.339 | 0.19 | (0.18) | 0.294 | 0.134 | (0.112) | 0.230 | 0.184 | (0.151) | 0.224 |
| Niacin (Δmg/d) | 0.12 | (0.15) | 0.417 | 0.18 | (0.27) | 0.522 | −0.001 | (0.007) | 0.930 | −0.010 | (0.012) | 0.426 |
| Vitamin B6 (Δmg/d) | 0.54 | (2.61) | 0.837 | −2.14 | (4.48) | 0.632 | −0.117 | (0.114) | 0.307 | −0.474 | (0.195) | 0.015 * |
| Vitamin B12 (Δmg/d) | 0.12 | (0.12) | 0.339 | 0.19 | (0.18) | 0.294 | −0.006 | (0.005) | 0.260 | −0.020 | (0.008) | 0.015 * |
| Folate (Δµg/d) | −0.01 | (0.01) | 0.116 | −0.02 | (0.01) | 0.045 * | 0.000 | (0.000) | 0.783 | 0.000 | (0.000) | 0.655 |
| Pantothenic acid (Δmg/d) | −1.16 | (0.70) | 0.099 | −3.43 | (1.02) | 0.001 ** | 0.049 | (0.031) | 0.115 | 0.089 | (0.046) | 0.051 |
| Vitamin C (Δmg/d) | −0.02 | (0.02) | 0.448 | −0.02 | (0.02) | 0.341 | −0.002 | (0.001) | 0.068 | −0.002 | (0.001) | 0.057 |
| Saturated fat (Δg/d) | −0.06 | (0.21) | 0.781 | −0.48 | (0.35) | 0.170 | 0.013 | (0.009) | 0.165 | 0.025 | (0.015) | 0.105 |
| Monounsaturated fat (Δg/d) | 0.16 | (0.17) | 0.325 | 1.34 | (0.68) | 0.050 * | 0.006 | (0.007) | 0.431 | 0.016 | (0.030) | 0.605 |
| Polyunsaturated fat (Δg/d) | 0.16 | (0.24) | 0.497 | 0.03 | (0.42) | 0.938 | −0.001 | (0.011) | 0.900 | −0.019 | (0.018) | 0.287 |
| n-3 polyunsaturated fat (Δg/d) | 0.71 | (0.82) | 0.389 | 0.57 | (1.22) | 0.640 | −0.034 | (0.036) | 0.347 | −0.115 | (0.053) | 0.031 |
| n-6 polyunsaturated fat (Δg/d) | 0.14 | (0.30) | 0.642 | −0.10 | (0.48) | 0.836 | 0.004 | (0.013) | 0.770 | −0.004 | (0.021) | 0.864 |
| Cholesterol (Δmg/d) | 0.00 | (0.01) | 0.772 | 0.00 | (0.01) | 0.850 | 0.000 | (0.000) | 0.318 | 0.000 | (0.000) | 0.438 |
| Total dietary fiber (Δg/d) | −0.64 | (0.28) | 0.022 | −0.73 | (0.29) | 0.013 * | −0.012 | (0.012) | 0.320 | −0.014 | (0.013) | 0.298 |
| Soluble dietary fiber (Δg/d) | −2.31 | (0.94) | 0.014 | −2.59 | (0.97) | 0.007 ** | −0.046 | (0.041) | 0.264 | −0.050 | (0.043) | 0.245 |
| Insoluble dietary fiber (Δg/d) | −0.74 | (0.41) | 0.070 | −0.82 | (0.43) | 0.055 | −0.017 | (0.018) | 0.333 | −0.019 | (0.019) | 0.313 |
| Alcohol (Δg/d) | −0.03 | (0.05) | 0.584 | −0.01 | (0.05) | 0.908 | 0.001 | (0.002) | 0.541 | 0.001 | (0.002) | 0.497 |
| Daidzein (Δmg/d) | −0.11 | (0.09) | 0.205 | −0.14 | (0.09) | 0.126 | 0.003 | (0.004) | 0.405 | 0.003 | (0.004) | 0.428 |
| Genistein (Δmg/d) | −0.07 | (0.05) | 0.213 | −0.08 | (0.05) | 0.132 | 0.002 | (0.002) | 0.414 | 0.002 | (0.002) | 0.438 |
© 2019 by the authors. Licensee MDPI, Basel, Switzerland. This article is an open access article distributed under the terms and conditions of the Creative Commons Attribution (CC BY) license (http://creativecommons.org/licenses/by/4.0/).
Share and Cite
Ozato, N.; Saito, S.; Yamaguchi, T.; Katashima, M.; Tokuda, I.; Sawada, K.; Katsuragi, Y.; Imoto, S.; Ihara, K.; Nakaji, S. Association between Nutrients and Visceral Fat in Healthy Japanese Adults: A 2-Year Longitudinal Study Brief Title: Micronutrients Associated with Visceral Fat Accumulation. Nutrients 2019, 11, 2698. https://doi.org/10.3390/nu11112698
Ozato N, Saito S, Yamaguchi T, Katashima M, Tokuda I, Sawada K, Katsuragi Y, Imoto S, Ihara K, Nakaji S. Association between Nutrients and Visceral Fat in Healthy Japanese Adults: A 2-Year Longitudinal Study Brief Title: Micronutrients Associated with Visceral Fat Accumulation. Nutrients. 2019; 11(11):2698. https://doi.org/10.3390/nu11112698
Chicago/Turabian StyleOzato, Naoki, Shinichiro Saito, Tohru Yamaguchi, Mitsuhiro Katashima, Itoyo Tokuda, Kaori Sawada, Yoshihisa Katsuragi, Seiya Imoto, Kazushige Ihara, and Shigeyuki Nakaji. 2019. "Association between Nutrients and Visceral Fat in Healthy Japanese Adults: A 2-Year Longitudinal Study Brief Title: Micronutrients Associated with Visceral Fat Accumulation" Nutrients 11, no. 11: 2698. https://doi.org/10.3390/nu11112698