Appetite and Gastrointestinal Hormone Response to a Gluten-Free Meal in Patients with Coeliac Disease


Abstract
:1. Introduction
2. Material & Methods
2.1. Subjects
2.2. Study Design
2.3. Blood Sample Collection and Preparation
2.4. Statistical Analysis
3. Results
3.1. Subjects
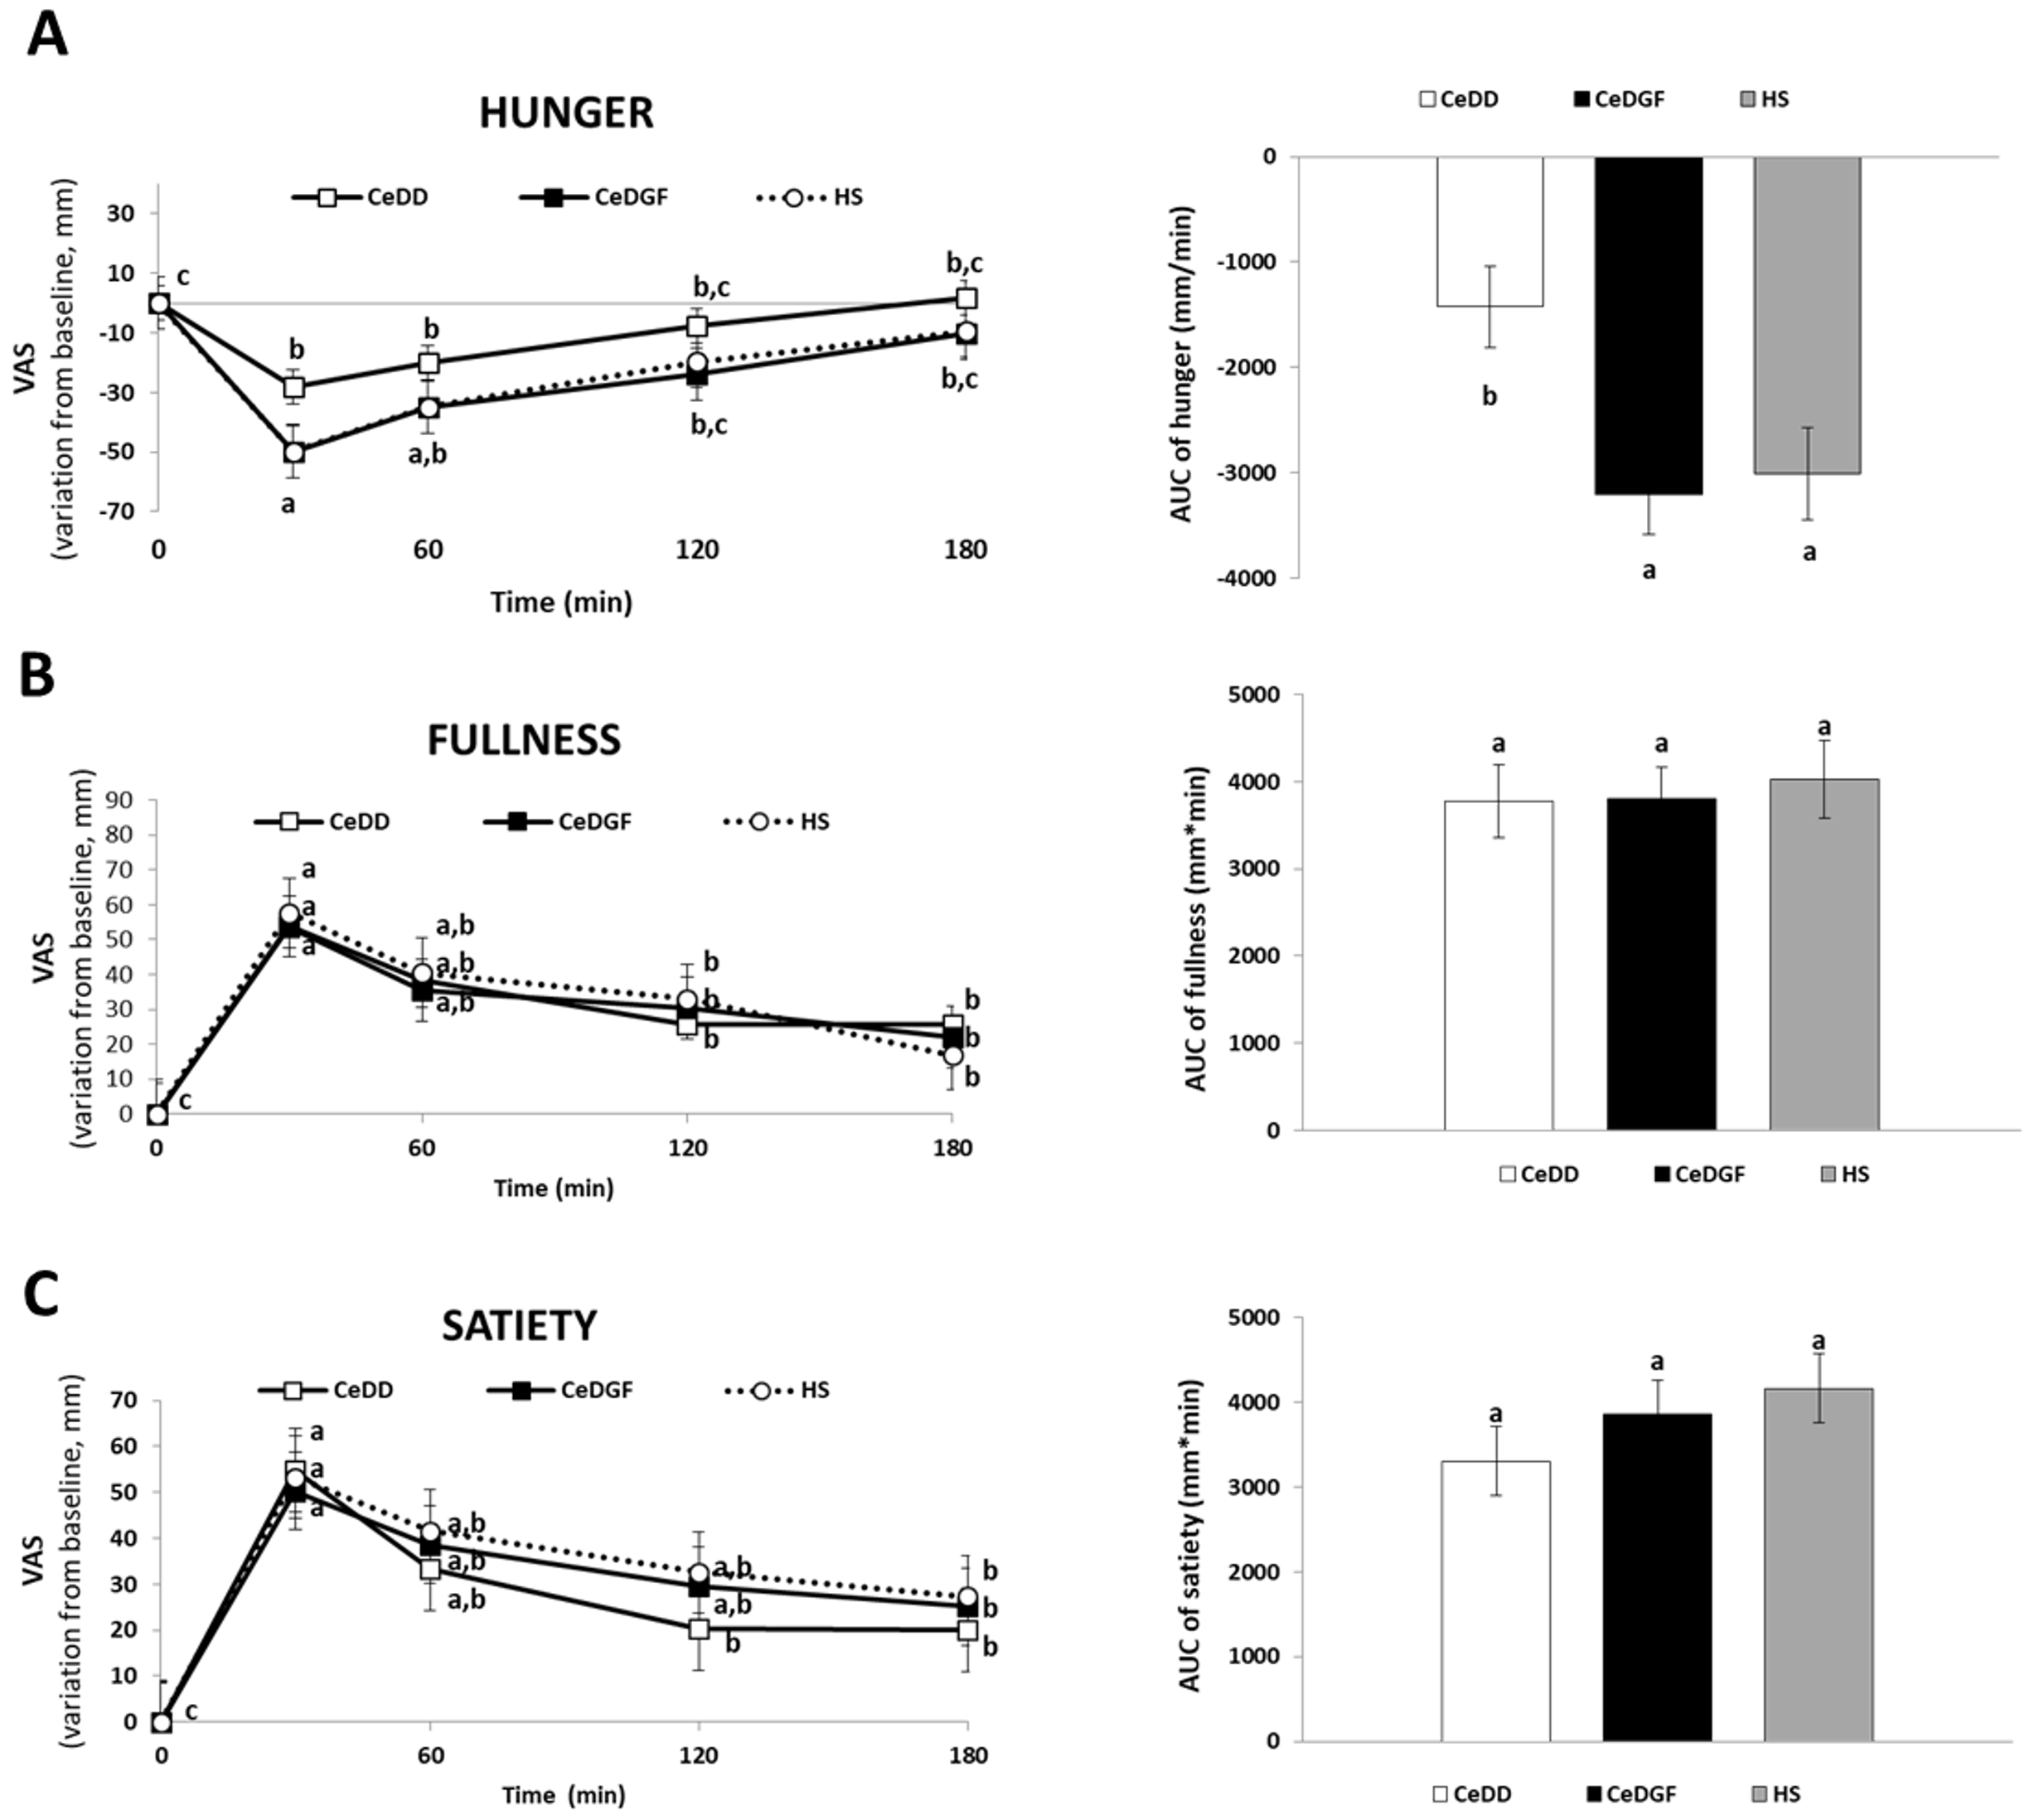
3.2. Appetite
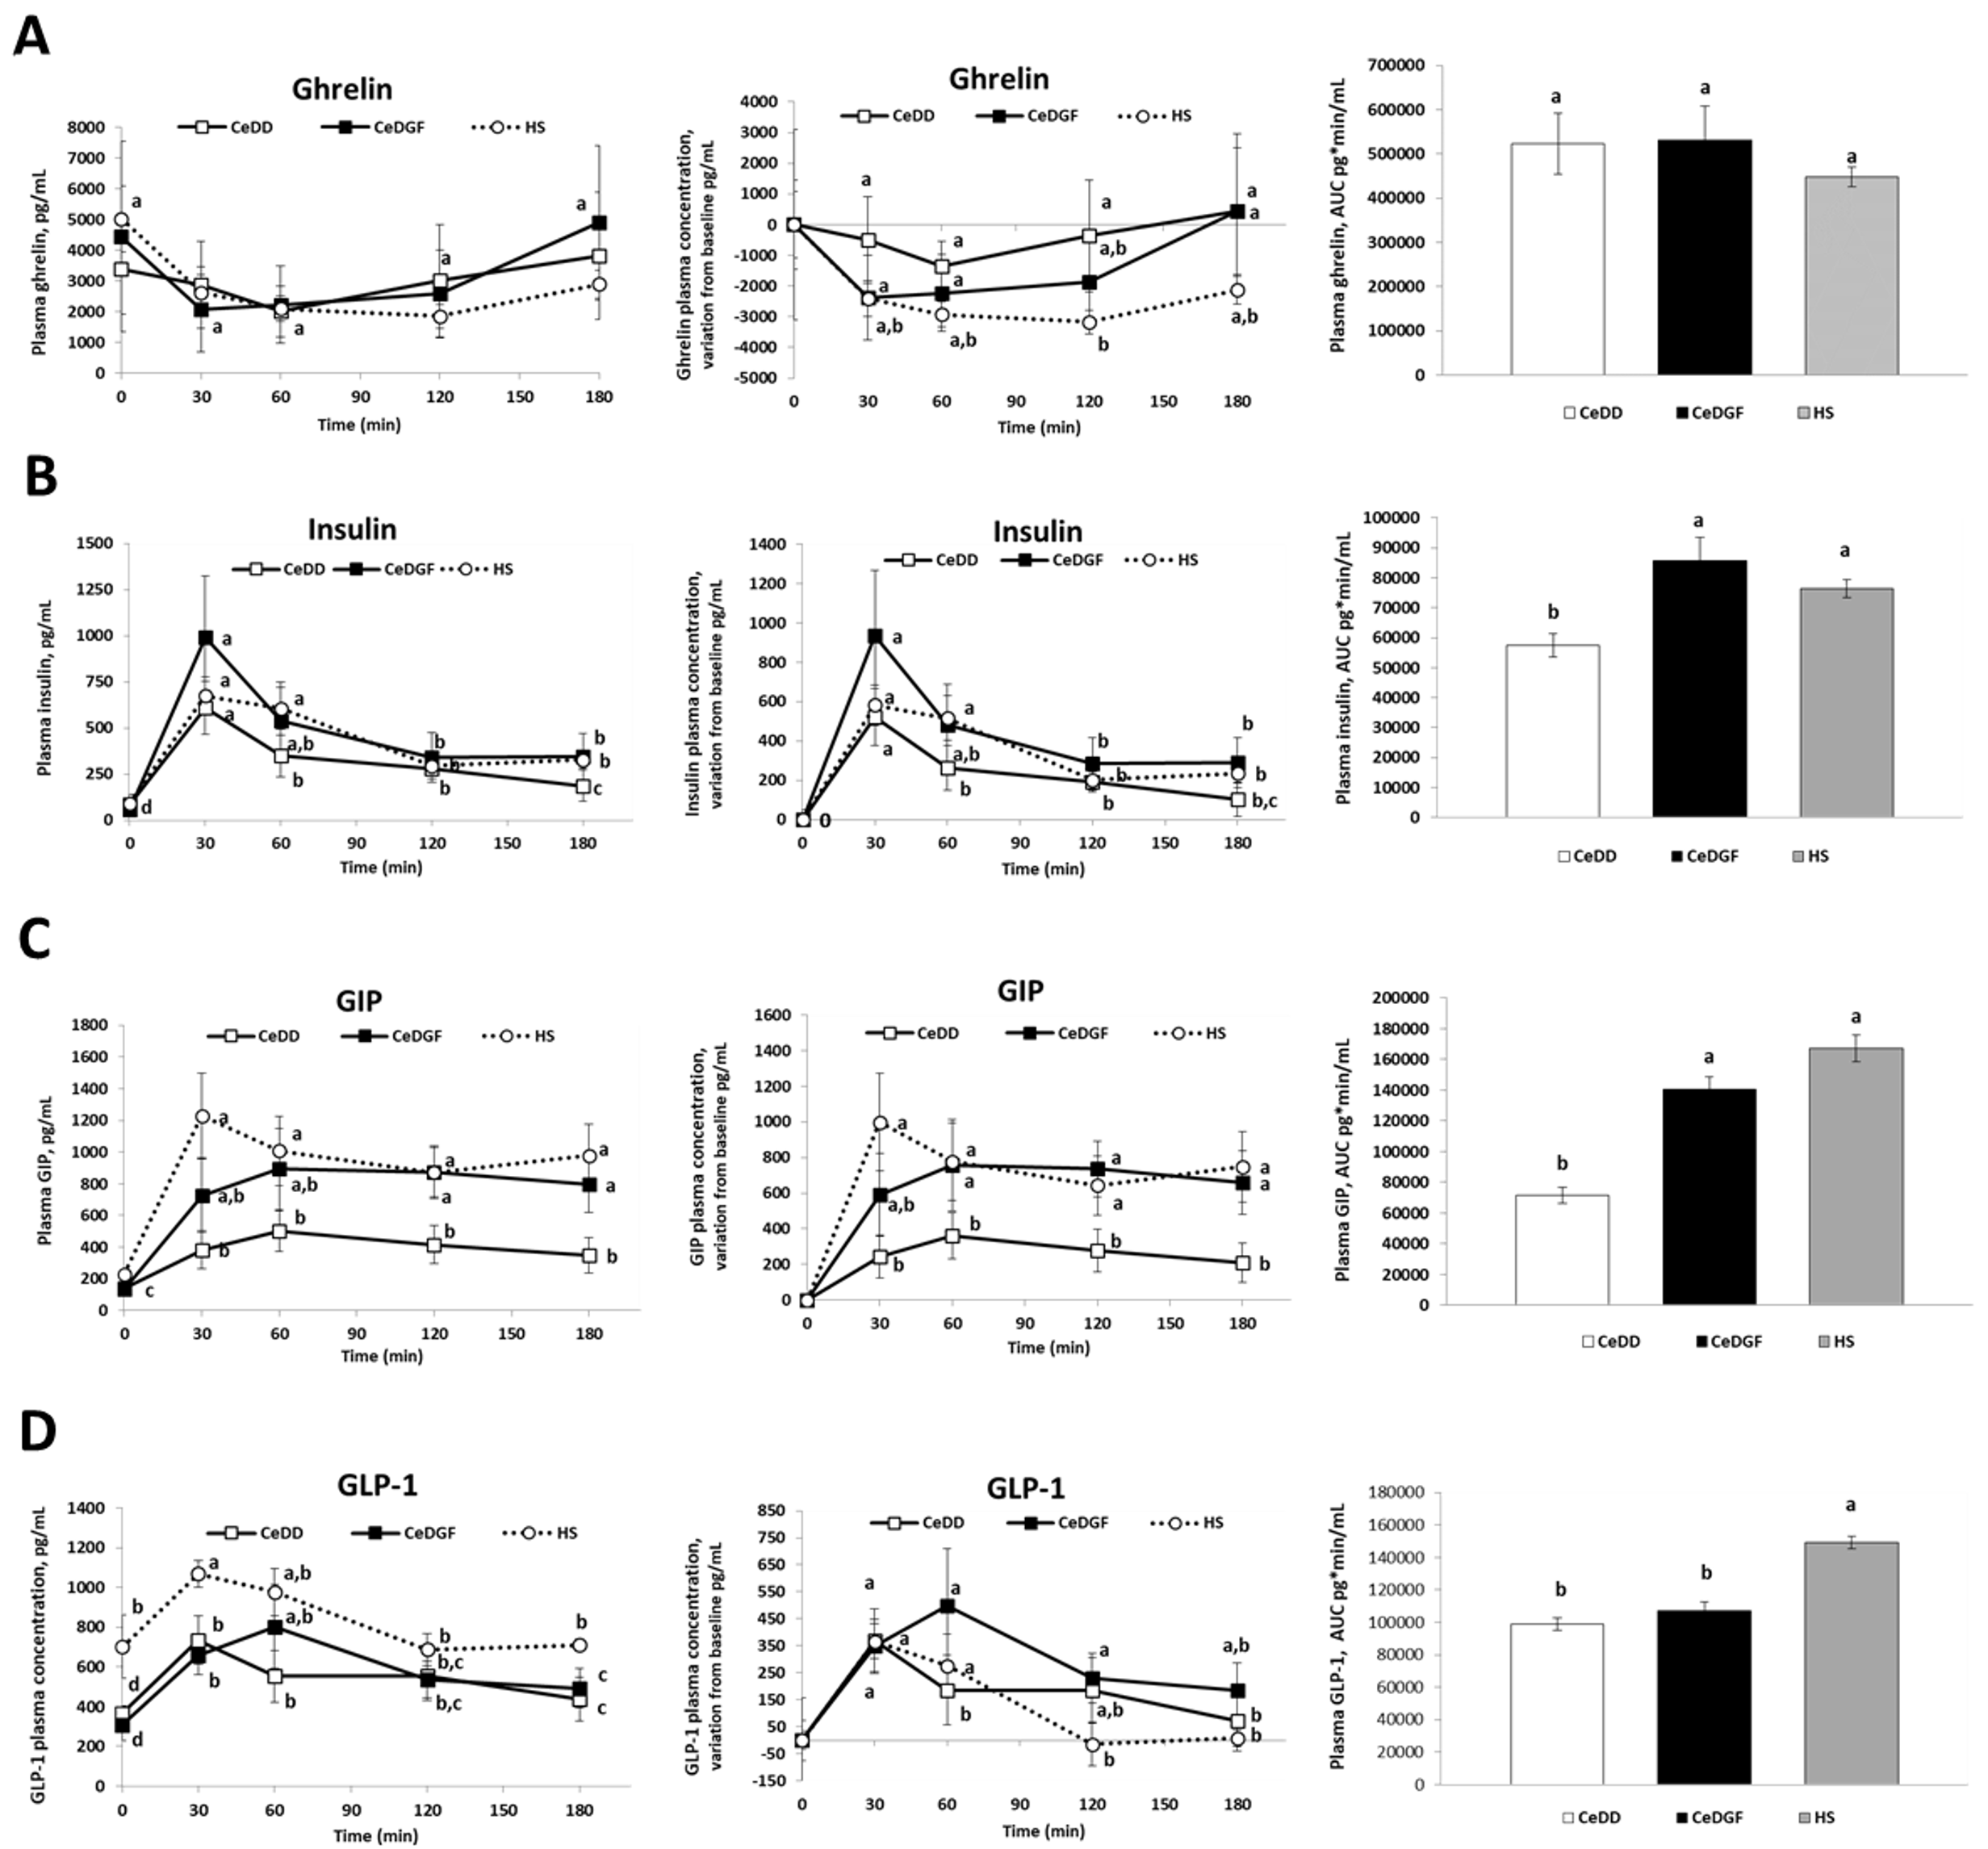
3.3. Hormone Responses
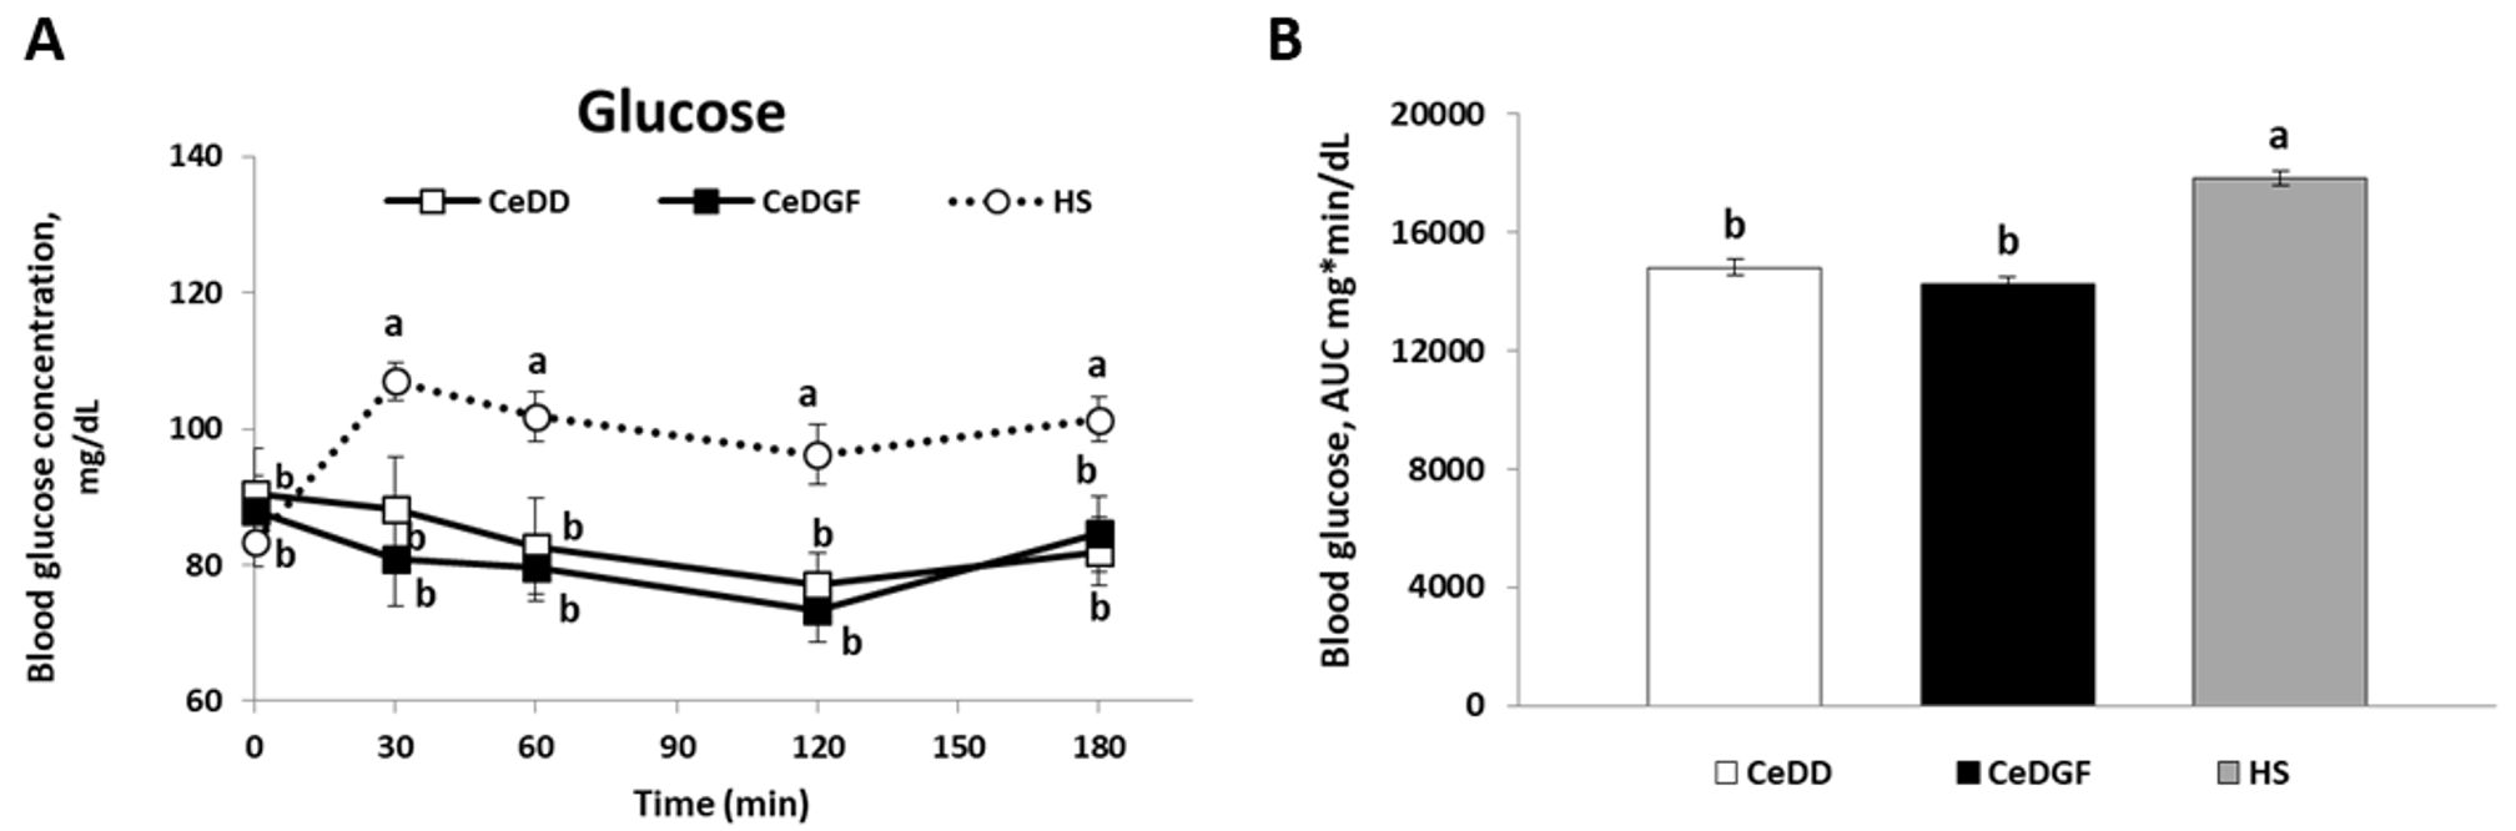
3.4. Blood Glucose
4. Discussion
5. Conclusions
Author Contributions
Funding
Acknowledgments
Conflicts of Interest
References
- Ludvigsson, J.F.; Bai, J.C.; Biagi, F.; Card, T.R.; Ciacci, C.; Ciclitira, P.J.; Green, P.H.R.; Hadjivassiliou, M.; Holdoway, A.; Van Heel, D.A.; et al. Diagnosis and management of adult coeliac disease: Guidelines from the British society of gastroenterology. Gut 2014, 63, 1210–1228. [Google Scholar] [CrossRef] [PubMed]
- Iovino, P.; Ciacci, C.; Sabbatini, F.; Acioli, D.M.; D’Argenio, G.; Mazzacca, G. Esophageal impairment in adult celiac disease with steatorrhea. Am. J. Gastroenterol. 1998, 93, 1243–1249. [Google Scholar] [CrossRef] [PubMed]
- Bai, J.C.; Ciacci, C.; Melberg, J. World Gastroenterology Organisation Global Guidelines: Celiac Disease February 2017. J. Clin. Gastroenterol. 2017, 51, 755–768. [Google Scholar]
- Passananti, V.; Siniscalchi, M.; Zingone, F.; Bucci, C.; Tortora, R.; Iovino, P.; Ciacci, C. Prevalence of eating disorders in adults with celiac disease. Gastroenterol. Res. Pract. 2013, 2013, 491657. [Google Scholar] [CrossRef] [PubMed]
- Smyth, D.J.; Plagnol, V.; Walker, N.M.; Cooper, J.D.; Downes, K.; Yang, J.H.M.; Howson, J.M.M.; Stevens, H.; McManus, R.; Wijmenga, C.; et al. Shared and Distinct Genetic Variants in Type 1 Diabetes and Celiac Disease. N. Engl. J. Med. 2008, 359, 2767–2777. [Google Scholar] [CrossRef] [PubMed] [Green Version]
- Ciacci, C.; Cirillo, M.; Giorgetti, G.; Alfinito, F.; Franchi, A.; Di Pietralata, M.M.; Mazzacca, G. Low plasma cholesterol: A correlate of nondiagnosed celiac disease in adults with hypochromic anemia. Am. J. Gastroenterol. 1999, 94, 1888–1891. [Google Scholar] [CrossRef]
- Ciacci, C.; Ciclitira, P.; Hadjivassiliou, M.; Kaukinen, K.; Ludvigsson, J.F.; McGough, N.; Sanders, D.S.; Woodward, J.; Leonard, J.N.; Swift, G.L. The gluten-Free diet and its current application in coeliac disease and dermatitis Herpetiformis. United Eur. Gastroenterol. J. 2015, 3, 121–135. [Google Scholar] [CrossRef]
- Stein, A.C.; Liao, C.; Paski, S.; Polonsky, T.; Semrad, C.E.; Kupfer, S.S. Obesity and Cardiovascular Risk in Adults with Celiac Disease. J. Clin. Gastroenterol. 2016, 50, 545–550. [Google Scholar] [CrossRef]
- Assa, A.; Frenkel-Nir, Y.; Tzur, D.; Katz, L.H.; Shamir, R. Cardiovascular Risk Factors in Adolescents with Celiac Disease: A Cross-sectional Population-Based Study. J. Pediatr. Gastroenterol. Nutr. 2017, 65, 190–194. [Google Scholar] [CrossRef]
- Tortora, R.; Capone, P.; De Stefano, G.; Imperatore, N.; Gerbino, N.; Donetto, S.; Monaco, V.; Caporaso, N.; Rispo, A. Metabolic syndrome in patients with coeliac disease on a gluten-free diet. Aliment. Pharmacol. Ther. 2015, 41, 352–359. [Google Scholar] [CrossRef] [Green Version]
- Emilsson, L.; Semrad, C.E. Obesity, Metabolic Syndrome, and Cardiac Risk Factors: Going Gluten-Free, for Better or Worse? Dig. Dis. Sci. 2017, 62, 2215–2216. [Google Scholar] [CrossRef] [PubMed] [Green Version]
- Mariani, P.; Viti, M.G.; Montuori, M.; La Vecchia, A.; Cipolletta, E.; Calvani, L.; Bonamico, M. The gluten-free diet: A nutritional risk factor for adolescents with celiac disease? J. Pediatr. Gastroenterol. Nutr. 1998, 27, 519–523. [Google Scholar] [CrossRef] [PubMed]
- Dickey, W.; Kearney, N. Overweight in celiac disease: Prevalence, clinical characteristics, and effect of a gluten-free diet. Am. J. Gastroenterol. 2006, 101, 2356–2359. [Google Scholar] [CrossRef] [PubMed]
- Valletta, E.; Fornaro, M.; Cipolli, M.; Conte, S.; Bissolo, F.; Danchielli, C. Celiac disease and obesity: Need for nutritional follow-up after diagnosis. Eur. J. Clin. Nutr. 2010, 64, 1371–1372. [Google Scholar] [CrossRef] [PubMed]
- Ferrara, P.; Cicala, M.; Tiberi, E.; Spadaccio, C.; Marcella, L.; Gatto, A.; Calzolari, P.; Castellucci, G. High fat consumption in children with celiac disease. Acta Gastroenterol. Belg. 2009, 72, 296–300. [Google Scholar] [PubMed]
- Miranda, J.; Lasa, A.; Bustamante, M.A.; Churruca, I.; Simon, E. Nutritional Differences Between a Gluten-free Diet and a Diet Containing Equivalent Products with Gluten. Plant Foods Hum. Nutr. 2014, 69, 182–187. [Google Scholar] [CrossRef] [PubMed]
- Kabbani, T.A.; Goldberg, A.; Kelly, C.P.; Pallav, K.; Tariq, S.; Peer, A.; Hansen, J.; Dennis, M.; Leffler, D.A. Body mass index and the risk of obesity in coeliac disease treated with the gluten-free diet. Aliment. Pharmacol. Ther. 2012, 35, 723–729. [Google Scholar] [CrossRef] [Green Version]
- Pellegrini, N.; Agostoni, C. Nutritional aspects of gluten-free products. J. Sci. Food Agric. 2015, 95, 2380–2385. [Google Scholar] [CrossRef]
- Potter, M.D.E.; Brienesse, S.C.; Walker, M.M.; Boyle, A.; Talley, N.J. Effect of the gluten-free diet on cardiovascular risk factors in patients with coeliac disease: A systematic review. J. Gastroenterol. Hepatol. 2018, 33, 781–791. [Google Scholar] [CrossRef]
- Berthoud, H.R.; Münzberg, H.; Morrison, C.D. Blaming the Brain for Obesity: Integration of Hedonic and Homeostatic Mechanisms. Gastroenterology 2017, 152, 1728–1738. [Google Scholar] [CrossRef]
- Chaput, J.P.; Tremblay, A. The glucostatic theory of appetite control and the risk of obesity and diabetes. Int. J. Obes. 2009, 33, 46–53. [Google Scholar] [CrossRef] [PubMed]
- Mayer, J. Glucostatic mechanism of regulation of food intake. N. Engl. J. Med. 1953, 249, 13–16. [Google Scholar] [CrossRef]
- Edholm, T.; Degerblad, M.; Grybäck, P.; Hilsted, L.; Holst, J.J.; Jacobsson, H.; Efendic, S.; Schmidt, P.T.; Hellström, P.M. Differential incretin effects of GIP and GLP-1 on gastric emptying, appetite, and insulin-glucose homeostasis. Neurogastroenterol. Motil. 2010, 22, 1191-e315. [Google Scholar] [CrossRef] [PubMed]
- Gutzwiller, J.P.; Göke, B.; Drewe, J.; Hildebrand, P.; Ketterer, S.; Handschin, D.; Winterhalder, R.; Conen, D.; Beglinger, C. Glucagon-like peptide-1: A potent regulator of food intake in humans. Gut 1999, 44, 81–86. [Google Scholar] [CrossRef] [PubMed]
- Levin, F.; Edholm, T.; Schmidt, P.T.; Grybäck, P.; Jacobsson, H.; Degerblad, M.; Höybye, C.; Holst, J.J.; Rehfeld, J.F.; Hellström, P.M.; et al. Ghrelin stimulates gastric emptying and hunger in normal-weight humans. J. Clin. Endocrinol. Metab. 2006, 91, 3296–3302. [Google Scholar] [CrossRef] [PubMed]
- Schwartz, M.M.W.; Woods, S.S.C.; Porte, D.; Seeley, R.J.; Baskin, D.G.; Porte, D., Jr.; Seeley, R.J.; Baskin, D.G.; Porte, D. Central nervous system control of food intake. Nature 2000, 404, 661–671. [Google Scholar] [CrossRef] [PubMed]
- Le Roux, C.W.; Aylwin, S.J.B.; Batterham, R.L.; Borg, C.M.; Coyle, F.; Prasad, V.; Shurey, S.; Ghatei, M.A.; Patel, A.G.; Bloom, S.R. Gut hormone profiles following bariatric surgery favor an anorectic state, facilitate weight loss, and improve metabolic parameters. Ann. Surg. 2006, 243, 108–114. [Google Scholar] [CrossRef]
- Jarocka-Cyrta, E.; Kasacka, I.; Kaczmarski, M. The ghrelin-positive cells number is increased in duodenum in children with celiac disease. J. Endocrinol. Investig. 2010, 33, 165–170. [Google Scholar] [CrossRef]
- Rocco, A.; Sarnelli, G.; Compare, D.; De Colibus, P.; Micheli, P.; Somma, P.; Marotti, B.; Cuomo, R.; Nardone, G. Tissue ghrelin level and gastric emptying rate in adult patients with celiac disease. Neurogastroenterol. Motil. 2008, 20, 884–890. [Google Scholar] [CrossRef]
- Lanzini, A.; Magni, P.; Petroni, M.L.; Motta, M.; Lanzarotto, F.; Villanacci, V.; Amato, M.; Mora, A.; Bertolazzi, S.; Benini, F.; et al. Circulating ghrelin level is increased in coeliac disease as in functional dyspepsia and reverts to normal during gluten-free diet. Aliment. Pharmacol. Ther. 2006, 23, 907–913. [Google Scholar] [CrossRef] [Green Version]
- Malandrino, N.; Capristo, E.; Farnetti, S.; Leggio, L.; Abenavoli, L.; Addolorato, G.; Gasbarrini, G. Metabolic and nutritional features in adult celiac patients. Dig. Dis. 2008, 26, 128–133. [Google Scholar] [CrossRef] [PubMed]
- Stunkard, A.J.; Messick, S. The three-factor eating questionnaire to measure dietary restraint, disinhibition and hunger. J. Psychosom. Res. 1985, 29, 71–83. [Google Scholar] [CrossRef]
- Depner, C.M.; Melanson, E.L.; McHill, A.W.; Wright, K.P. Mistimed food intake and sleep alters 24-hour time-of-day patterns of the human plasma proteome. Proc. Natl. Acad. Sci. USA 2018, 115, E5390–E5399. [Google Scholar] [CrossRef] [PubMed]
- Patterson, R.E.; Sears, D.D. Metabolic Effects of Intermittent Fasting. Annu. Rev. Nutr. 2017, 37, 371–393. [Google Scholar] [CrossRef] [PubMed] [Green Version]
- Nilsson, A.C.; Östman, E.M.; Holst, J.J.; Björck, I.M.E. Including Indigestible Carbohydrates in the Evening Meal of Healthy Subjects Improves Glucose Tolerance, Lowers Inflammatory Markers, and Increases Satiety after a Subsequent Standardized Breakfast. J. Nutr. 2008, 138, 732–739. [Google Scholar] [CrossRef] [PubMed] [Green Version]
- Marathe, C.S.; Rayner, C.K.; Jones, K.L.; Horowitz, M. Relationships between gastric emptying, postprandial glycemia, and incretin hormones. Diabetes Care 2013, 36, 1396–1405. [Google Scholar] [CrossRef] [PubMed]
- Read, N.W.; Levin, R.J.; Holdsworth, C.D. Electrogenic glucose absorption in untreated and treated coeliac disease. Gut 1976, 17, 444–449. [Google Scholar] [CrossRef]
- Laforenza, U.; Miceli, E.; Gastaldi, G.; Scaffino, M.F.; Ventura, U.; Fontana, J.M.; Orsenigo, M.N.; Corazza, G.R. Solute transporters and aquaporins are impaired in celiac disease. Biol. Cell 2010, 102, 457–467. [Google Scholar] [CrossRef] [Green Version]
- Asmar, M.; Arngrim, N.; Simonsen, L.; Asmar, A.; Nordby, P.; Holst, J.J.; Bülow, J. The blunted effect of glucose-dependent insulinotropic polypeptide in subcutaneous abdominal adipose tissue in obese subjects is partly reversed by weight loss. Nutr. Diabetes 2016, 6, e208. [Google Scholar] [CrossRef]
- Papastamataki, M.; Papassotiriou, I.; Bartzeliotou, A.; Vazeou, A.; Roma, E.; Chrousos, G.P.; Kanaka-Gantenbein, C. Incretins, amylin and other gut-brain axis hormones in children with coeliac disease. Eur. J. Clin. Investig. 2014, 44, 74–82. [Google Scholar] [CrossRef]
- Oguma, T.; Nakayama, K.; Kuriyama, C.; Matsushita, Y.; Yoshida, K.; Hikida, K.; Obokata, N.; Tsuda-Tsukimoto, M.; Saito, A.; Arakawa, K.; et al. Intestinal Sodium Glucose Cotransporter 1 Inhibition Enhances Glucagon-Like Peptide-1 Secretion in Normal and Diabetic Rodents. J. Pharmacol. Exp. Ther. 2015, 354, 279–289. [Google Scholar] [CrossRef] [PubMed] [Green Version]
- Fry, L.; Madden, A.M.; Fallaize, R. An investigation into the nutritional composition and cost of gluten-free versus regular food products in the UK. J. Hum. Nutr. Diet. 2018, 31, 108–120. [Google Scholar] [CrossRef] [PubMed]
- Theethira, T.G.; Dennis, M. Celiac disease and the gluten-free diet: Consequences and recommendations for improvement. Dig. Dis. 2015, 33, 175–182. [Google Scholar] [CrossRef] [PubMed]


| Meal Test | Protein (g) | Fat (g) | SFA (g) | MUFA (g) | PUFA (g) | CHO (g) | Fiber (g) | Energy (kcal) |
|---|---|---|---|---|---|---|---|---|
| Gluten free bread 100 g | 3.2 | 2.5 | 0.4 | 0 | 0 | 45.3 | 6.3 | 229 |
| Ham 50 g | 13.4 | 1.6 | 0.5 | 0.1 | 0.1 | 0 | 0 | 68 |
| Cheese 30 g | 5.6 | 7.5 | 4.7 | 2.4 | 0.3 | 0 | 0 | 90 |
| Butter 10 g | 0.1 | 8.3 | 4.9 | 2.4 | 0.3 | 0.1 | 0 | 75.8 |
| Yogurt 125 g | 4.8 | 4.9 | 2.6 | 1.1 | 0.2 | 5.4 | 0 | 82.5 |
| Apple 150 g | 0.5 | 0.2 | 0 | 0 | 0 | 20.6 | 3 | 79.5 |
| Total | 27.4 | 25.0 | 13.1 | 5.99 | 0.78 | 71.3 | 9.30 | 624.8 |
| CeDD | CeDGF | HS | p Value | |
|---|---|---|---|---|
| Age (years) | 29.4 ± 2.3 | 30.6 ± 3.6 | 31.6 ± 4.0 | 0.1 |
| BMI (kg/m2) | 21.9 ± 20.1 | 22.2 ± 1.9 | 22.0 ± 1.9 | 0.3 |
| a-tTG (U/mL) | 142.8 ± 28.2 | 2.84 ± 0.02 | − | <0.001 |
© 2019 by the authors. Licensee MDPI, Basel, Switzerland. This article is an open access article distributed under the terms and conditions of the Creative Commons Attribution (CC BY) license (http://creativecommons.org/licenses/by/4.0/).
Share and Cite
Vitaglione, P.; Zingone, F.; Virgilio, N.; Ciacci, C. Appetite and Gastrointestinal Hormone Response to a Gluten-Free Meal in Patients with Coeliac Disease. Nutrients 2019, 11, 82. https://doi.org/10.3390/nu11010082
Vitaglione P, Zingone F, Virgilio N, Ciacci C. Appetite and Gastrointestinal Hormone Response to a Gluten-Free Meal in Patients with Coeliac Disease. Nutrients. 2019; 11(1):82. https://doi.org/10.3390/nu11010082
Chicago/Turabian StyleVitaglione, Paola, Fabiana Zingone, Nicolina Virgilio, and Carolina Ciacci. 2019. "Appetite and Gastrointestinal Hormone Response to a Gluten-Free Meal in Patients with Coeliac Disease" Nutrients 11, no. 1: 82. https://doi.org/10.3390/nu11010082
APA StyleVitaglione, P., Zingone, F., Virgilio, N., & Ciacci, C. (2019). Appetite and Gastrointestinal Hormone Response to a Gluten-Free Meal in Patients with Coeliac Disease. Nutrients, 11(1), 82. https://doi.org/10.3390/nu11010082