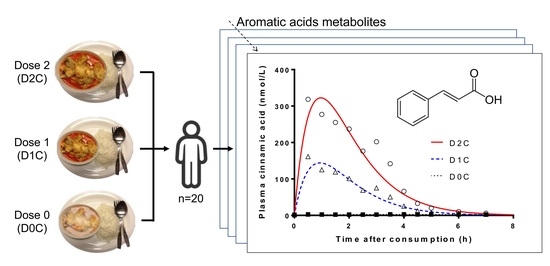
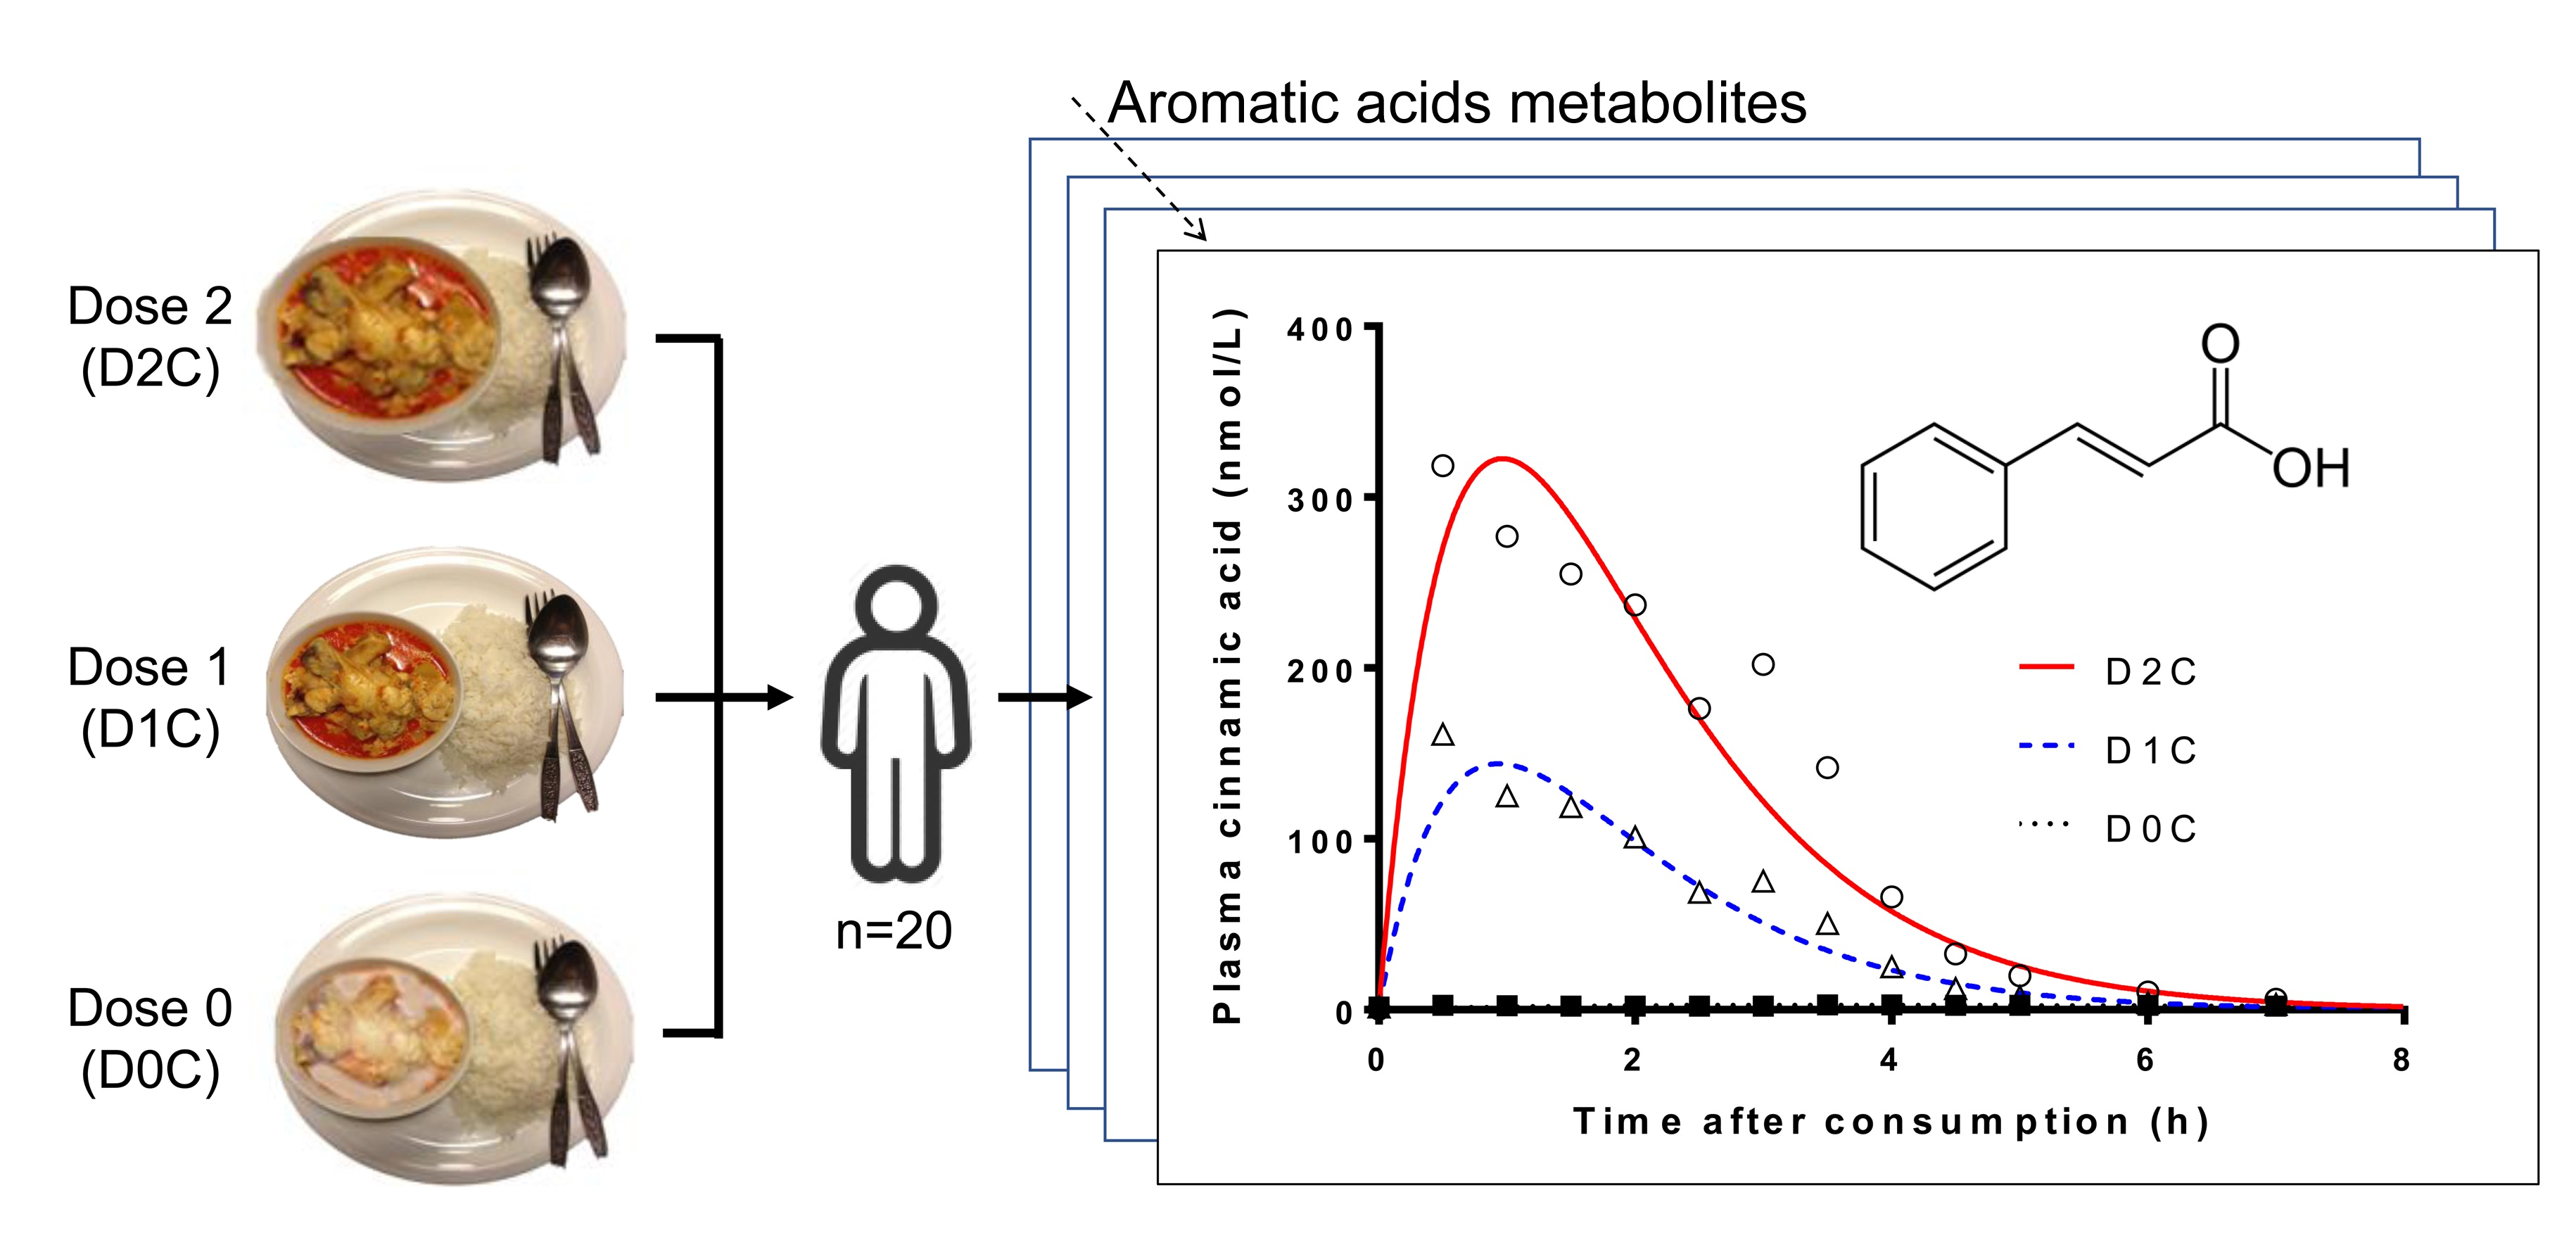
Dose-Dependent Increase in Unconjugated Cinnamic Acid Concentration in Plasma Following Acute Consumption of Polyphenol Rich Curry in the Polyspice Study

 , , and
Abstract
1. Introduction
2. Materials and Methods
2.1. Study Design
2.2. Total Polyphenol Content (TPC) of Test Meals
2.3. Blood Sample Collection
2.4. Plasma Phenolic/Aromatic Acids Analyses
2.5. UHPLC-MS/MS Analysis
2.6. Statistical Analyses
3. Results
4. Discussion
Supplementary Materials
Author Contributions
Funding
Acknowledgments
Conflicts of Interest
References
- Tapsell, L.C.; Hemphill, I.; Cobiac, L.; Patch, C.S.; Sullivan, D.R.; Fenech, M.; Roodenrys, S.; Keogh, J.B.; Clifton, P.M.; Williams, P.G.; et al. Health benefits of herbs and spices: The past, the present, the future. Med. J. Aust. 2006, 185, S4–S24. [Google Scholar] [PubMed]
- Rothwell, J.A.; Perez-Jimenez, J.; Neveu, V.; Medina-Remón, A.; M’Hiri, N.; García-Lobato, P.; Manach, C.; Knox, C.; Eisner, R.; Wishart, D.S.; et al. Phenol-Explorer 3.0: A major update of the Phenol-Explorer database to incorporate data on the effects of food processing on polyphenol content. Database 2013, 2013, 1–8. [Google Scholar] [CrossRef] [PubMed]
- Marín, L.; Miguélez, E.M.; Villar, C.J.; Lombó, F. Bioavailability of dietary polyphenols and gut microbiota metabolism: Antimicrobial properties. Biomed. Res. Int. 2015, 2015. [Google Scholar] [CrossRef] [PubMed]
- Cassidy, A.; Minihane, A.M. The role of metabolism (and the microbiome) in defining the clinical efficacy of dietary flavonoids. Am. J. Clin. Nutr. 2017, 105, 10–22. [Google Scholar] [CrossRef] [PubMed]
- Van Duynhoven, J.; van Velzen, E.J.J.; Westerhuis, J.A.; Foltz, M.; Jacobs, D.M.; Smilde, A.K. Nutrikinetics: Concept, technologies, applications, perspectives. Trends Food Sci. Technol. 2012, 26, 4–13. [Google Scholar] [CrossRef]
- Crozier, A.; Jaganath, I.B.; Clifford, M.N. Dietary phenolics: Chemistry, bioavailability and effects on health. Nat. Prod. Rep. 2009, 26, 1001. [Google Scholar] [CrossRef] [PubMed]
- Del Rio, D.; Rodriguez-Mateos, A.; Spencer, J.P.E.; Tognolini, M.; Borges, G.; Crozier, A. Dietary (Poly)phenolics in Human Health: Structures, Bioavailability, and Evidence of Protective Effects Against Chronic Diseases. Antioxid. Redox Signal. 2013, 18, 1818–1892. [Google Scholar] [CrossRef] [PubMed]
- Van Duynhoven, J.; Vaughan, E.E.; Jacobs, D.M.; Kemperman, R.A.; van Velzen, E.J.J.; Gross, G.; Roger, L.C.; Possemiers, S.; Smilde, A.K.; Dore, J.; et al. Metabolic fate of polyphenols in the human superorganism. Proc. Natl. Acad. Sci. USA 2011, 108, 4531–4538. [Google Scholar] [CrossRef] [PubMed]
- Henning, S.M.; Wang, P.; Abgaryan, N.; Vicinanza, R.; de Oliveira, D.M.; Zhang, Y.; Lee, R.P.; Carpenter, C.L.; Aronson, W.J.; Heber, D. Phenolic acid concentrations in plasma and urine from men consuming green or black tea and potential chemopreventive properties for colon cancer. Mol. Nutr. Food Res. 2013, 57, 483–493. [Google Scholar] [CrossRef] [PubMed]
- De Ferrars, R.M.; Czank, C.; Zhang, Q.; Botting, N.P.; Kroon, P.A.; Cassidy, A.; Kay, C.D. The pharmacokinetics of anthocyanins and their metabolites in humans. Br. J. Pharmacol. 2014, 171, 3268–3282. [Google Scholar] [CrossRef] [PubMed]
- Borges, G.; Mullen, W.; Mullan, A.; Lean, M.E.J.; Roberts, S.A.; Crozier, A. Bioavailability of multiple components following acute ingestion of a polyphenol-rich juice drink. Mol. Nutr. Food Res. 2010, 54, 268–277. [Google Scholar] [CrossRef] [PubMed]
- Clifford, M.; van der Hooft, J.; Crozier, A. Human studies on the absorption, distribution, metabolism, and excretion of tea polyphenols. Am. J. Clin. Nutr. 2013, 98. [Google Scholar] [CrossRef] [PubMed]
- Zamora-Ros, R.; Rothwell, J.A.; Scalbert, A.; Knaze, V.; Romieu, I.; Slimani, N.; Fagherazzi, G.; Perquier, F.; Touillaud, M.; Molina-Montes, E.; et al. Dietary intakes and food sources of phenolic acids in the European Prospective Investigation into Cancer and Nutrition (EPIC) study. Br. J. Nutr. 2013, 110. [Google Scholar] [CrossRef] [PubMed]
- Lafay, S.; Gil-Izquierdo, A. Bioavailability of phenolic acids. Phytochem. Rev. 2008, 7, 301–311. [Google Scholar] [CrossRef]
- Srinivasan, K. Role of spices beyond food flavoring: Nutraceuticals with multiple health effects. Food Rev. Int. 2005, 21, 167–188. [Google Scholar] [CrossRef]
- Yashin, A.; Yashin, Y.; Xia, X.; Nemzer, B. Antioxidant Activity of Spices and Their Impact on Human Health: A Review. Antioxidants 2017, 6, 70. [Google Scholar] [CrossRef] [PubMed]
- Haldar, S.; Chia, S.C.; Lee, S.H.; Lim, J.; Leow, M.K.-S.; Chan, E.C.Y.; Henry, C.J. Polyphenol-rich curry made with mixed spices and vegetables benefits glucose homeostasis in Chinese males (Polyspice Study): A dose–response randomized controlled crossover trial. Eur. J. Nutr. 2017. [Google Scholar] [CrossRef] [PubMed]
- Haldar, S.; Chia, S.C.; Henry, C.J. Polyphenol-rich curry made with mixed spices and vegetables increases postprandial plasma GLP-1 concentration in a dose-dependent manner. Eur. J. Clin. Nutr. 2017, 1. [Google Scholar] [CrossRef] [PubMed]
- Adisakwattana, S. Cinnamic acid and its derivatives: Mechanisms for prevention and management of diabetes and its complications. Nutrients 2017, 9, 163. [Google Scholar] [CrossRef] [PubMed]
- Johnston, K.L.; Clifford, M.N.; Morgan, L.M. Coffee acutely modifies gastrointestinal hormone secretion and glucose tolerance in humans: Glycemic effects of chlorogenic acid and caffeine. Am. J. Clin. Nutr. 2003, 78, 728–733. [Google Scholar] [CrossRef] [PubMed]
- Crozier, A.; Del Rio, D.; Clifford, M.N. Bioavailability of dietary flavonoids and phenolic compounds. Mol. Asp. Med. 2010, 31, 446–467. [Google Scholar] [CrossRef] [PubMed]
- Thakare, R.; Chhonker, Y.S.; Gautam, N.; Alamoudi, J.A.; Alnouti, Y. Quantitative analysis of endogenous compounds. J. Pharm. Biomed. Anal. 2016, 128, 426–437. [Google Scholar] [CrossRef] [PubMed]
- Bresciani, L.; Scazzina, F.; Leonardi, R.; Dall’Aglio, E.; Newell, M.; Dall’Asta, M.; Melegari, C.; Ray, S.; Brighenti, F.; Del Rio, D. Bioavailability and metabolism of phenolic compounds from wholegrain wheat and aleurone-rich wheat bread. Mol. Nutr. Food Res. 2016, 60, 2343–2354. [Google Scholar] [CrossRef] [PubMed]
- Renouf, M.; Marmet, C.; Giuffrida, F.; Lepage, M.; Barron, D.; Beaumont, M.; Williamson, G.; Dionisi, F. Dose-response plasma appearance of coffee chlorogenic and phenolic acids in adults. Mol. Nutr. Food Res. 2014, 58, 301–309. [Google Scholar] [CrossRef] [PubMed]
- McKay, D.L.; Chen, C.Y.O.; Zampariello, C.A.; Blumberg, J.B. Flavonoids and phenolic acids from cranberry juice are bioavailable and bioactive in healthy older adults. Food Chem. 2015, 168, 233–240. [Google Scholar] [CrossRef] [PubMed]
- Sinclair, K.A.; Caldwell, J. The formation of β-glucuronidase resistant glucuronides by the intramolecular rearrangement of glucuronic acid conjugates at mild alkaline pH. Biochem. Pharmacol. 1982, 31, 953–957. [Google Scholar] [CrossRef]
- Faed, E.M. Properties of acyl glucuronides: Implications for studies of the pharmacokinetics and metabolism of acidic drugs. Drug Metab. Rev. 1984, 15, 1213–1249. [Google Scholar] [CrossRef] [PubMed]
- Langguth, H.S.; Benet, L.Z. Acyl Glucuronides Revisited: Is the Glucuronidation Proces a Toxification as Well as a Detoxification Mechanism? Drug Metab. Rev. 1992, 24, 5–47. [Google Scholar] [CrossRef] [PubMed]
- Piazzon, A.; Vrhovsek, U.; Masuero, D.; Mattivi, F.; Mandoj, F.; Nardini, M. Antioxidant activity of phenolic acids and their metabolites: Synthesis and antioxidant properties of the sulfate derivatives of ferulic and caffeic acids and of the acyl glucuronide of ferulic acid. J. Agric. Food Chem. 2012, 60, 12312–12323. [Google Scholar] [CrossRef] [PubMed]
- Cren-Olivé, C.; Teissier, E.; Duriez, P.; Rolando, C. Effect of catechin O-methylated metabolites and analogues on human LDL oxidation. Free Radic. Biol. Med. 2003, 34, 850–855. [Google Scholar] [CrossRef]
- Cerdá, B.; Tomás-Barberán, F.A.; Espín, J.C. Metabolism of antioxidant and chemopreventive ellagitannins from strawberries, raspberries, walnuts, and oak-aged wine in humans: Identification of biomarkers and individual variability. J. Agric. Food Chem. 2005, 53, 227–235. [Google Scholar] [CrossRef] [PubMed]
- Feliciano, R.P.; Boeres, A.; Massacessi, L.; Istas, G.; Ventura, M.R.; Nunes Dos Santos, C.; Heiss, C.; Rodriguez-Mateos, A. Identification and quantification of novel cranberry-derived plasma and urinary (poly)phenols. Arch. Biochem. Biophys. 2016, 599, 31–41. [Google Scholar] [CrossRef] [PubMed]
- Yip, L.Y.; Aw, C.C.; Lee, S.H.; Hong, Y.S.; Ku, H.C.; Xu, H.; Mei, J.; Chan, X.; Jing, E.; Cheong, Y.; et al. The Liver-Gut Microbiota Axis Modulates Hepatotoxicity of Tacrine in the Rat. Hepatology 2017, 1–34. [Google Scholar] [CrossRef] [PubMed]
- Van Duynhoven, J.; van Der Hooft, J.J.J.; van Dorsten, F.A.; Peters, S.; Foltz, M.; Gomez-Roldan, V.; Vervoort, J.; De Vos, R.C.H.; Jacobs, D.M. Rapid and sustained systemic circulation of conjugated gut microbial catabolites after single-dose black tea extract consumption. J. Proteome Res. 2014, 13, 2668–2678. [Google Scholar] [CrossRef] [PubMed]
- Czank, C.; Cassidy, A.; Zhang, Q.; Morrison, D.J.; Preston, T.; Kroon, P.A.; Botting, N.P.; Kay, C.D. Human metabolism and elimination of the anthocyanin, cyanidin-3-glucoside: A 13 C-tracer study 1–3. Am. J. Clin. Nutr. 2013, 97, 995–1003. [Google Scholar] [CrossRef] [PubMed]
- Pallister, T.; Jackson, M.A.; Martin, T.C.; Zierer, J.; Jennings, A.; Mohney, R.P.; MacGregor, A.; Steves, C.J.; Cassidy, A.; Spector, T.D.; et al. Hippurate as a metabolomic marker of gut microbiome diversity: Modulation by diet and relationship to metabolic syndrome. Sci. Rep. 2017, 7, 1–9. [Google Scholar] [CrossRef] [PubMed]
- Williamson, G.; Clifford, M.N. Colonic metabolites of berry polyphenols: The missing link to biological activity? Br. J. Nutr. 2010, 104, 48–66. [Google Scholar] [CrossRef] [PubMed]
- Goodwin, B.L.; Ruthven, C.R.J.; Sandler, M. Gut flora and the origin of some urinary aromatic phenolic compounds. Biochem. Pharmacol. 1994, 47, 2294–2297. [Google Scholar] [CrossRef]
- Vallverdú-Queralt, A.; Regueiro, J.; Martínez-Huélamo, M.; Rinaldi Alvarenga, J.F.; Leal, L.N.; Lamuela-Raventos, R.M. A comprehensive study on the phenolic profile of widely used culinary herbs and spices: Rosemary, thyme, oregano, cinnamon, cumin and bay. Food Chem. 2014, 154, 299–307. [Google Scholar] [CrossRef] [PubMed]
- Tomás-Barberán, F.A.; Clifford, M.N. Dietary hydroxybenzoic acid derivatives-nature, occurrence and dietary burden. J. Sci. Food Agric. 2000, 80, 1024–1032. [Google Scholar] [CrossRef]
- Hoskins, J.A. The occurrence, metabolism and toxicity of cinnamic acid and related compounds. J. Appl. Toxicol. 1984, 4, 283–292. [Google Scholar] [CrossRef] [PubMed]
- Zhu, R.; Liu, H.; Liu, C.; Wang, L.; Ma, R.; Chen, B.; Li, L.; Niu, J.; Fu, M.; Zhang, D.; et al. Cinnamaldehyde in diabetes: A review of pharmacology, pharmacokinetics and safety. Pharmacol. Res. 2017, 122, 78–89. [Google Scholar] [CrossRef] [PubMed]
- Chen, Y.; Ma, Y.; Ma, W. Pharmacokinetics and bioavailability of cinnamic acid after oral administration of Ramulus Cinnamomi in rats. Eur. J. Drug Metab. Pharmacokinet. 2009, 34, 51–56. [Google Scholar] [CrossRef] [PubMed]
- Zhang, J.; Chen, M.; Ju, W.; Liu, S.; Xu, M.; Chu, J.; Wu, T. Liquid chromatograph/tandem mass spectrometry assay for the simultaneous determination of chlorogenic acid and cinnamic acid in plasma and its application to a pharmacokinetic study. J. Pharm. Biomed. Anal. 2010, 51, 685–690. [Google Scholar] [CrossRef] [PubMed]
- Ji, B.; Zhao, Y.; Zhang, Q.; Wang, P.; Guan, J.; Rong, R.; Yu, Z. Simultaneous determination of cinnamaldehyde, cinnamic acid, and 2-methoxy cinnamic acid in rat whole blood after oral administration of volatile oil of Cinnamoni Ramulus by UHPLC-MS/MS: An application for a pharmacokinetic study. J. Chromatogr. B Anal. Technol. Biomed. Life Sci. 2015, 1001, 107–113. [Google Scholar] [CrossRef] [PubMed]
- Garrait, G.; Jarrige, J.F.; Blanquet, S.; Beyssac, E.; Cardot, J.M.; Alric, M. Gastrointestinal absorption and urinary excretion of trans-cinnamic and p-coumaric acids in rats. J. Agric. Food Chem. 2006, 54, 2944–2950. [Google Scholar] [CrossRef] [PubMed]
- Platel, K.; Srinivasan, K. Digestive stimulant action of spices: A myth or reality? Indian J. Med. Res. 2004, 119, 167–179. [Google Scholar] [PubMed]
- Achaintre, D.; Buleté, A.; Cren-Olivé, C.; Li, L.; Rinaldi, S.; Scalbert, A. Differential Isotope Labeling of 38 Dietary Polyphenols and Their Quantification in Urine by Liquid Chromatography Electrospray Ionization Tandem Mass Spectrometry. Anal. Chem. 2016, 88, 2637–2644. [Google Scholar] [CrossRef] [PubMed]


| Nutrikinetic Parameters | Cmax (nM) | Tmax (h) | AUC0–7 h (nM.h) | ||||||
|---|---|---|---|---|---|---|---|---|---|
| Polyphenols Intake | D0C | D1C | D2C | D0C | D1C | D2C | D0C | D1C | D2C |
| Benzoic acids | |||||||||
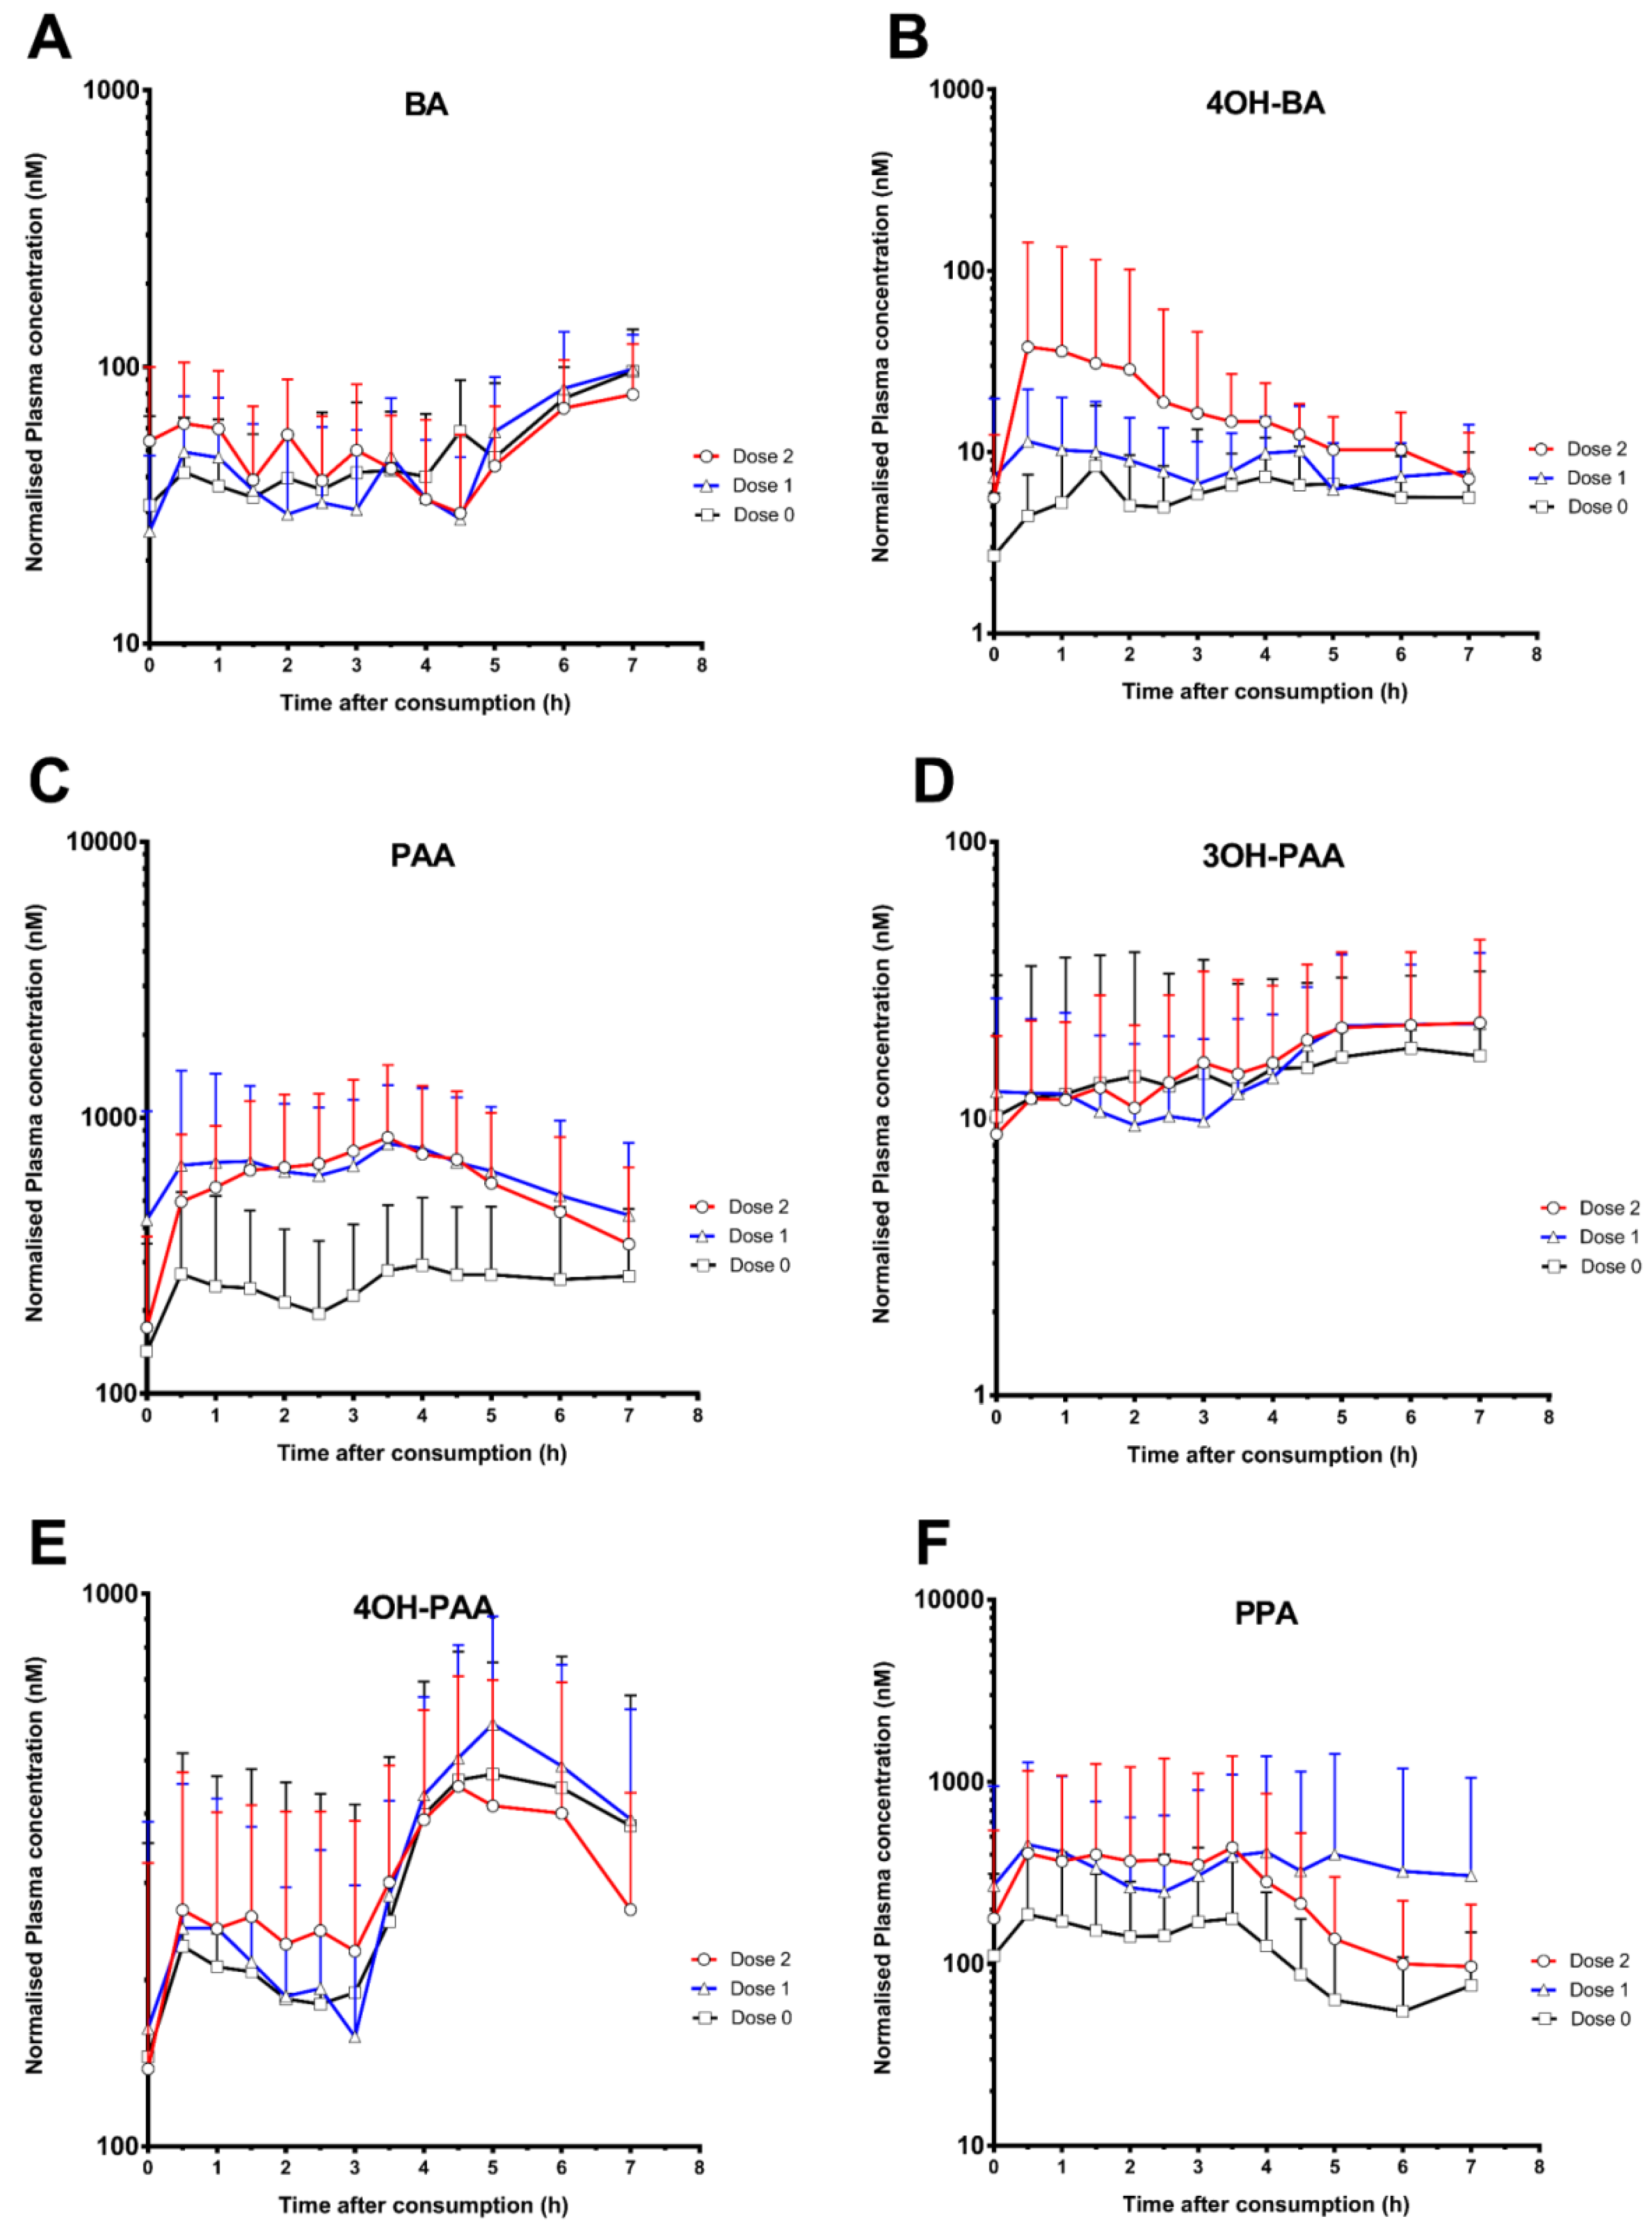
| Benzoic acid (BA) | 114.3 ± 36.7 | 113.3 ± 33.6 | 109.0 ± 34.6 | 5.3 ± 2.2 | 5.7 ± 2.0 | 3.8 ± 2.8 | 347.9 ± 86.8 | 347.0 ± 107.2 | 354.7 ± 122.8 |
| 3-Hydoxybenzoic acid (3OH-BA) | N.D. | N.D. | N.D. | N.D. | N.D. | N.D. | N.D. | N.D. | N.D. |
| 4-Hydroxybenzoic acid (4OH-BA) | 13.7 ± 9.9 | 18.3 ± 12.4 | 41.5 ± 101.2 | 3.1 ± 1.7 | 3.4 ± 2.1 | 3.5 ± 1.5 | 36.0 ± 23.3 | 54.2 ± 34.6 | 114.1 ± 207.0 |
| Phenylacetic acids | |||||||||
| Phenylacetic acid (PAA) | 433.3 ± 286.9 | 1019.1 ± 825.9 | 1001.4 ± 666.2 | 3.4 ± 2.4 | 3.6 ± 1.4 | 3.2 ± 1.3 | 1742.3 ± 1243.4 | 4437.2 ± 2974.3 | 4132.1 ± 2947.1 |
| 3-Hydroxyphenylacetic acid (3OH-PAA) | 28.1 ± 26.2 | 27.2 ± 15.8 | 29.1 ± 20.5 | 4.9 ± 2.0 | 4.7 ± 2.6 | 5.7 ± 1.7 | 101.0 ± 112.2 | 105.7 ± 70.0 | 113.3 ± 90.4 |
| 4-Hydroxyphenylacetic acid (4OH-PAA) | 565.9 ± 322.3 | 667.3 ± 304.9 | 633.4 ± 285.1 | 4.7 ± 2.0 | 4.4 ± 2.0 | 3.8 ± 1.8 | 2070.7 ± 1453.7 | 2378.0 ± 1065.8 | 2166.7 ± 1067.5 |
| Phenylpropanoic acids | |||||||||
| 3-Phenylpropanoate acid (PPA) | 278.7 ± 322.4 | 730.7 ± 1224.0 | 554.4 ± 984.6 | 2.5 ± 1.8 | 2.8 ± 2.3 | 3.0 ±2.2 | 831.1 ± 783.9 | 2390.8 ± 4371.0 | 1859.8 ± 3426.7 |
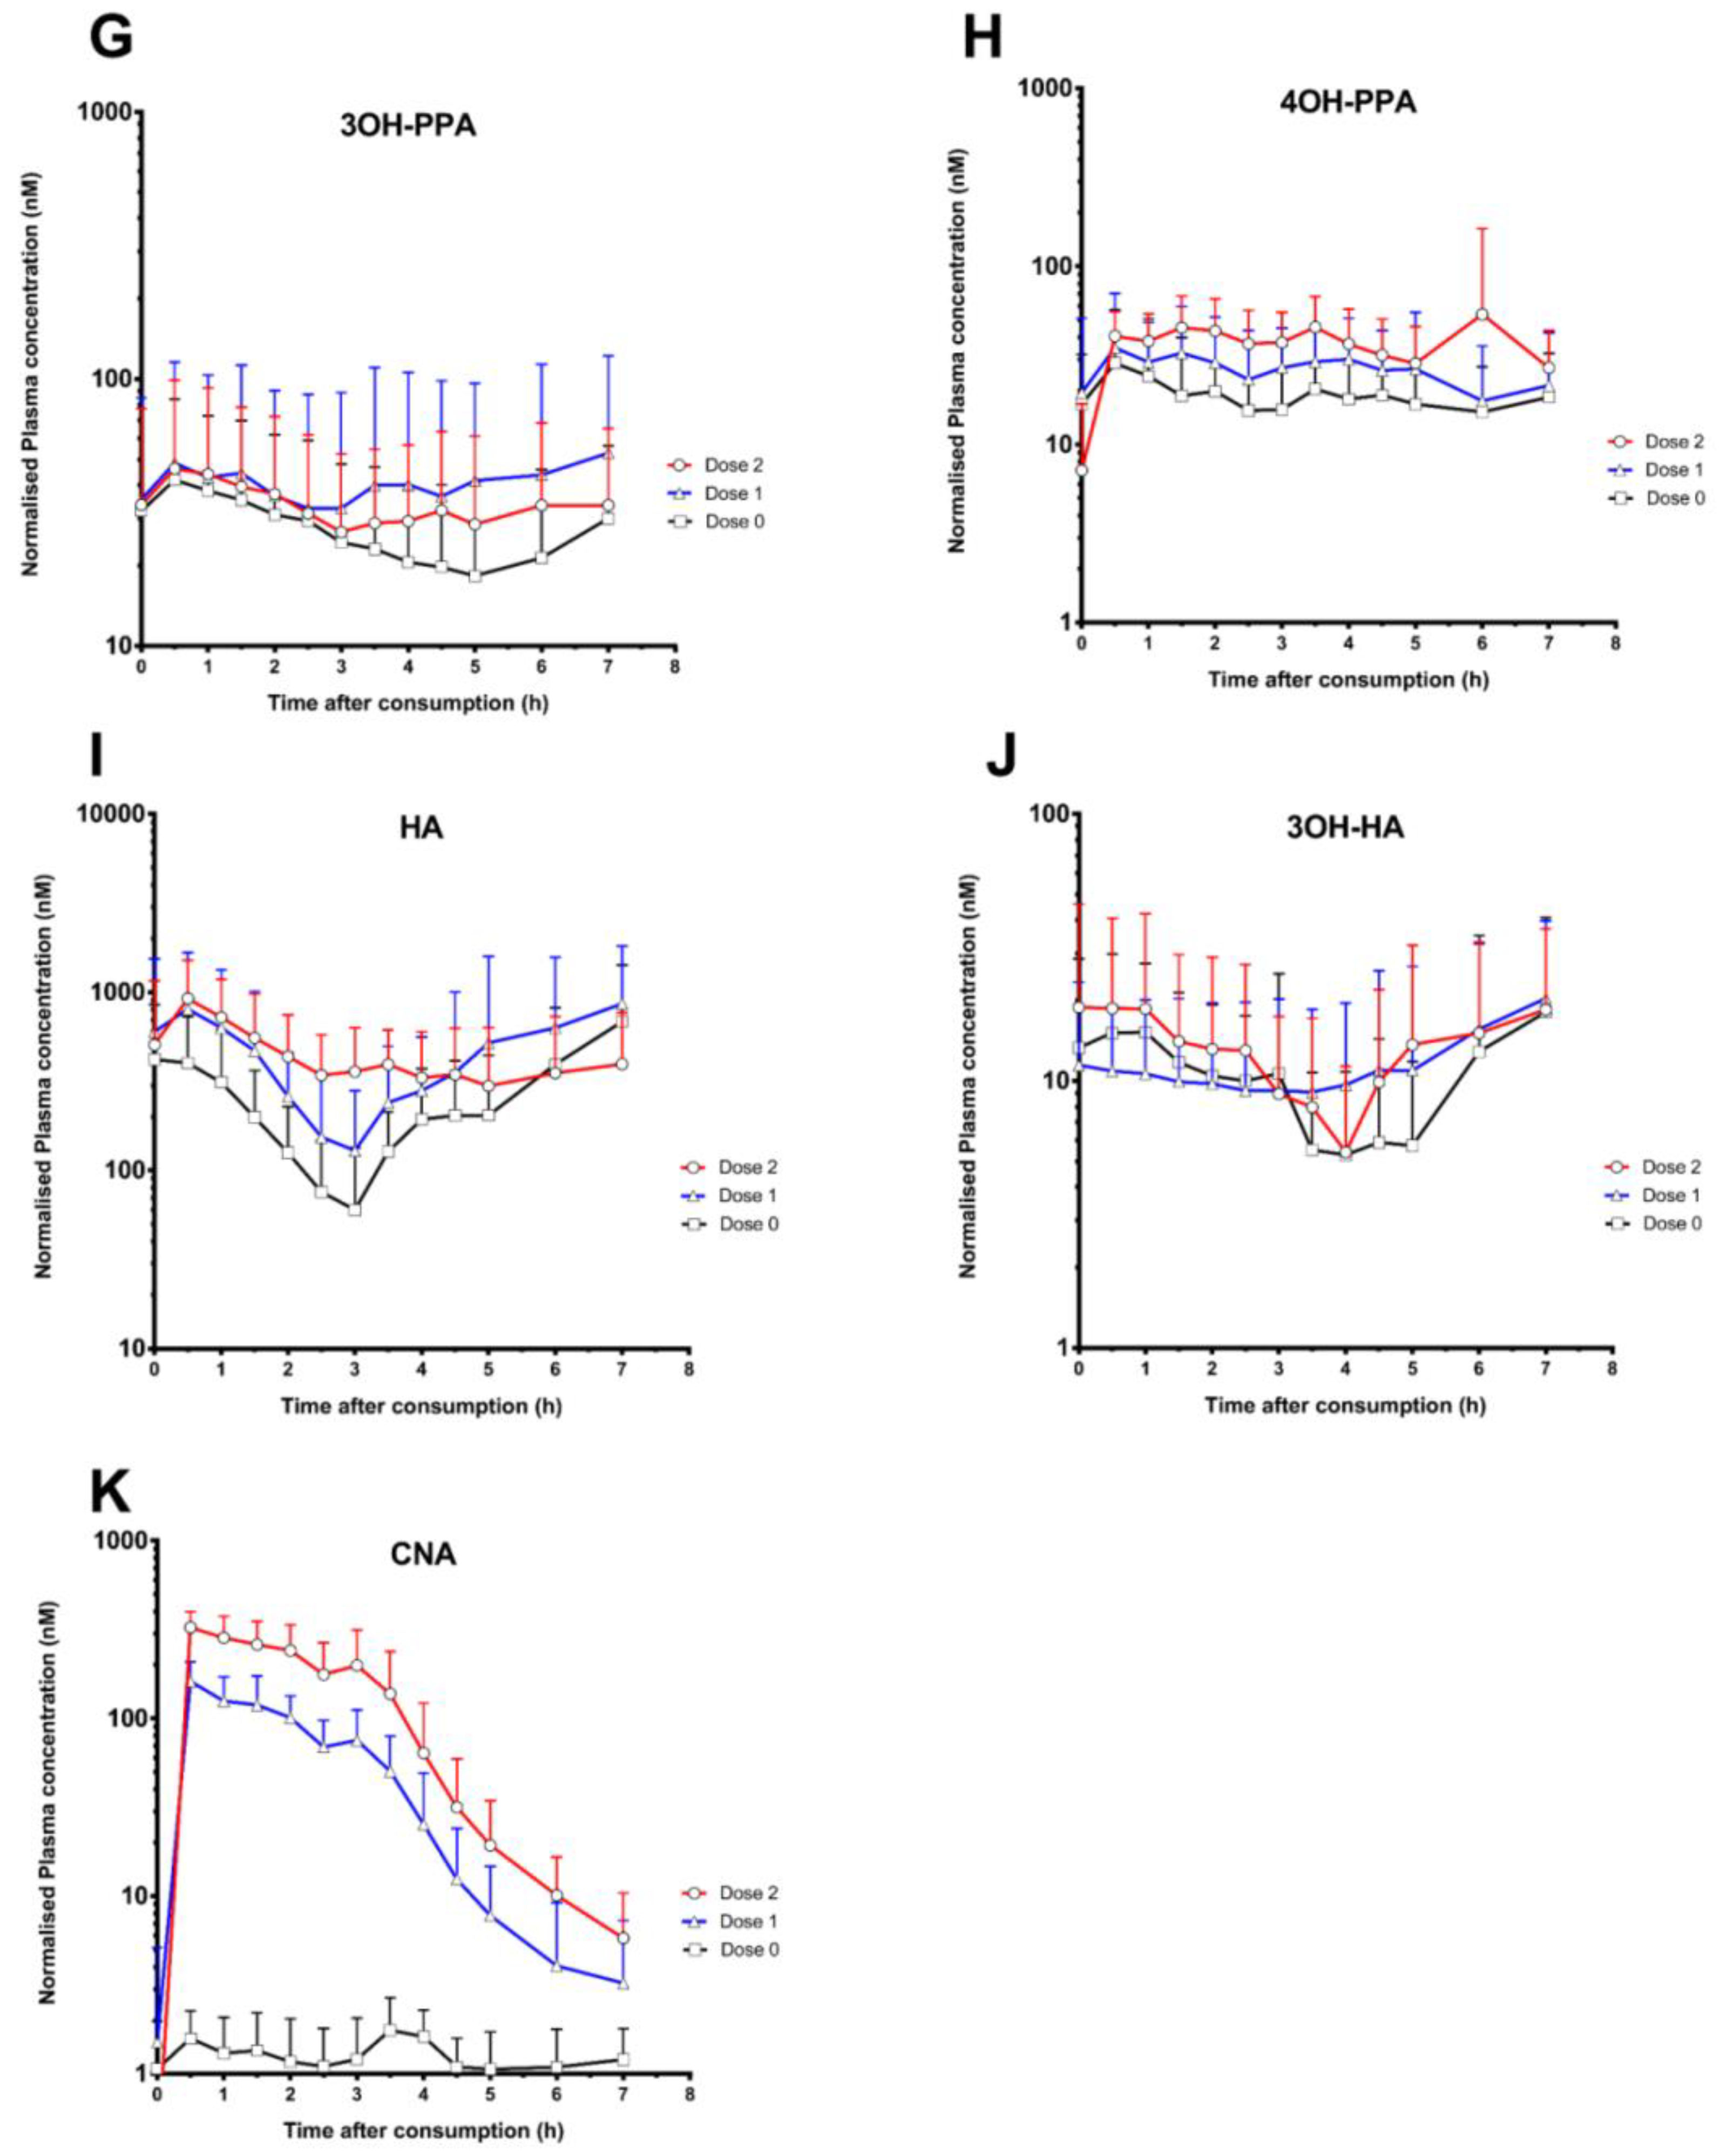
| 3-(3-Hydroxyphenyl)-propanoic acid (3OH- PPA) | 58.9 ± 39.1 | 83.3 ± 79.5 | 72.5 ± 48.6 | 3.6 ± 2.8 | 4.0± 2.8 | 3.5 ± 2.9 | 182.2 ± 126.3 | 283.0 ± 388.2 | 226.3 ± 176.6 |
| 3-(4-Hydroxyphenyl)-propanoic acid (4OH-PPA) | 31.4 ± 25.0 | 48.6 ± 36.6 | 81.7 ± 102.2 | 3.1 ± 2.7 | 2.6 ± 1.7 | 3.3 ± 2.0 | 126.3 ± 115.1 | 178.0 ± 120.3 | 260.6 ± 131.7 |
| Hippuric acids | |||||||||
| Hippuric acid (HA) | 1286.2 ± 706.5 | 1369.2 ± 1167.5 | 1075.8 ± 615.7 | 2.4 ± 3.3 | 3.4 ± 3.2 | 0.5 ± 0.3 | 1832.7 ± 1421.5 | 3224.5 ± 3095.2 | 3063.1 ± 1795.5 |
| 3-Hydroxyhippuric acid (3OH-HA) | 26.3 ± 22.5 | 27.4 ± 19.1 | 31.3 ± 26.5 | 3.3 ± 3.1 | 4.8 ± 2.9 | 3.8 ± 3.2 | 70.7 ± 61.6 | 80.1 ± 68.3 | 88.4 ± 85.4 |
| 4-Hydroxyhippuric acid (4OH-HA) | N.D. | N.D. | N.D. | N.D. | N.D. | N.D. | N.D. | N.D. | N.D. |
| Cinnamic acids | |||||||||
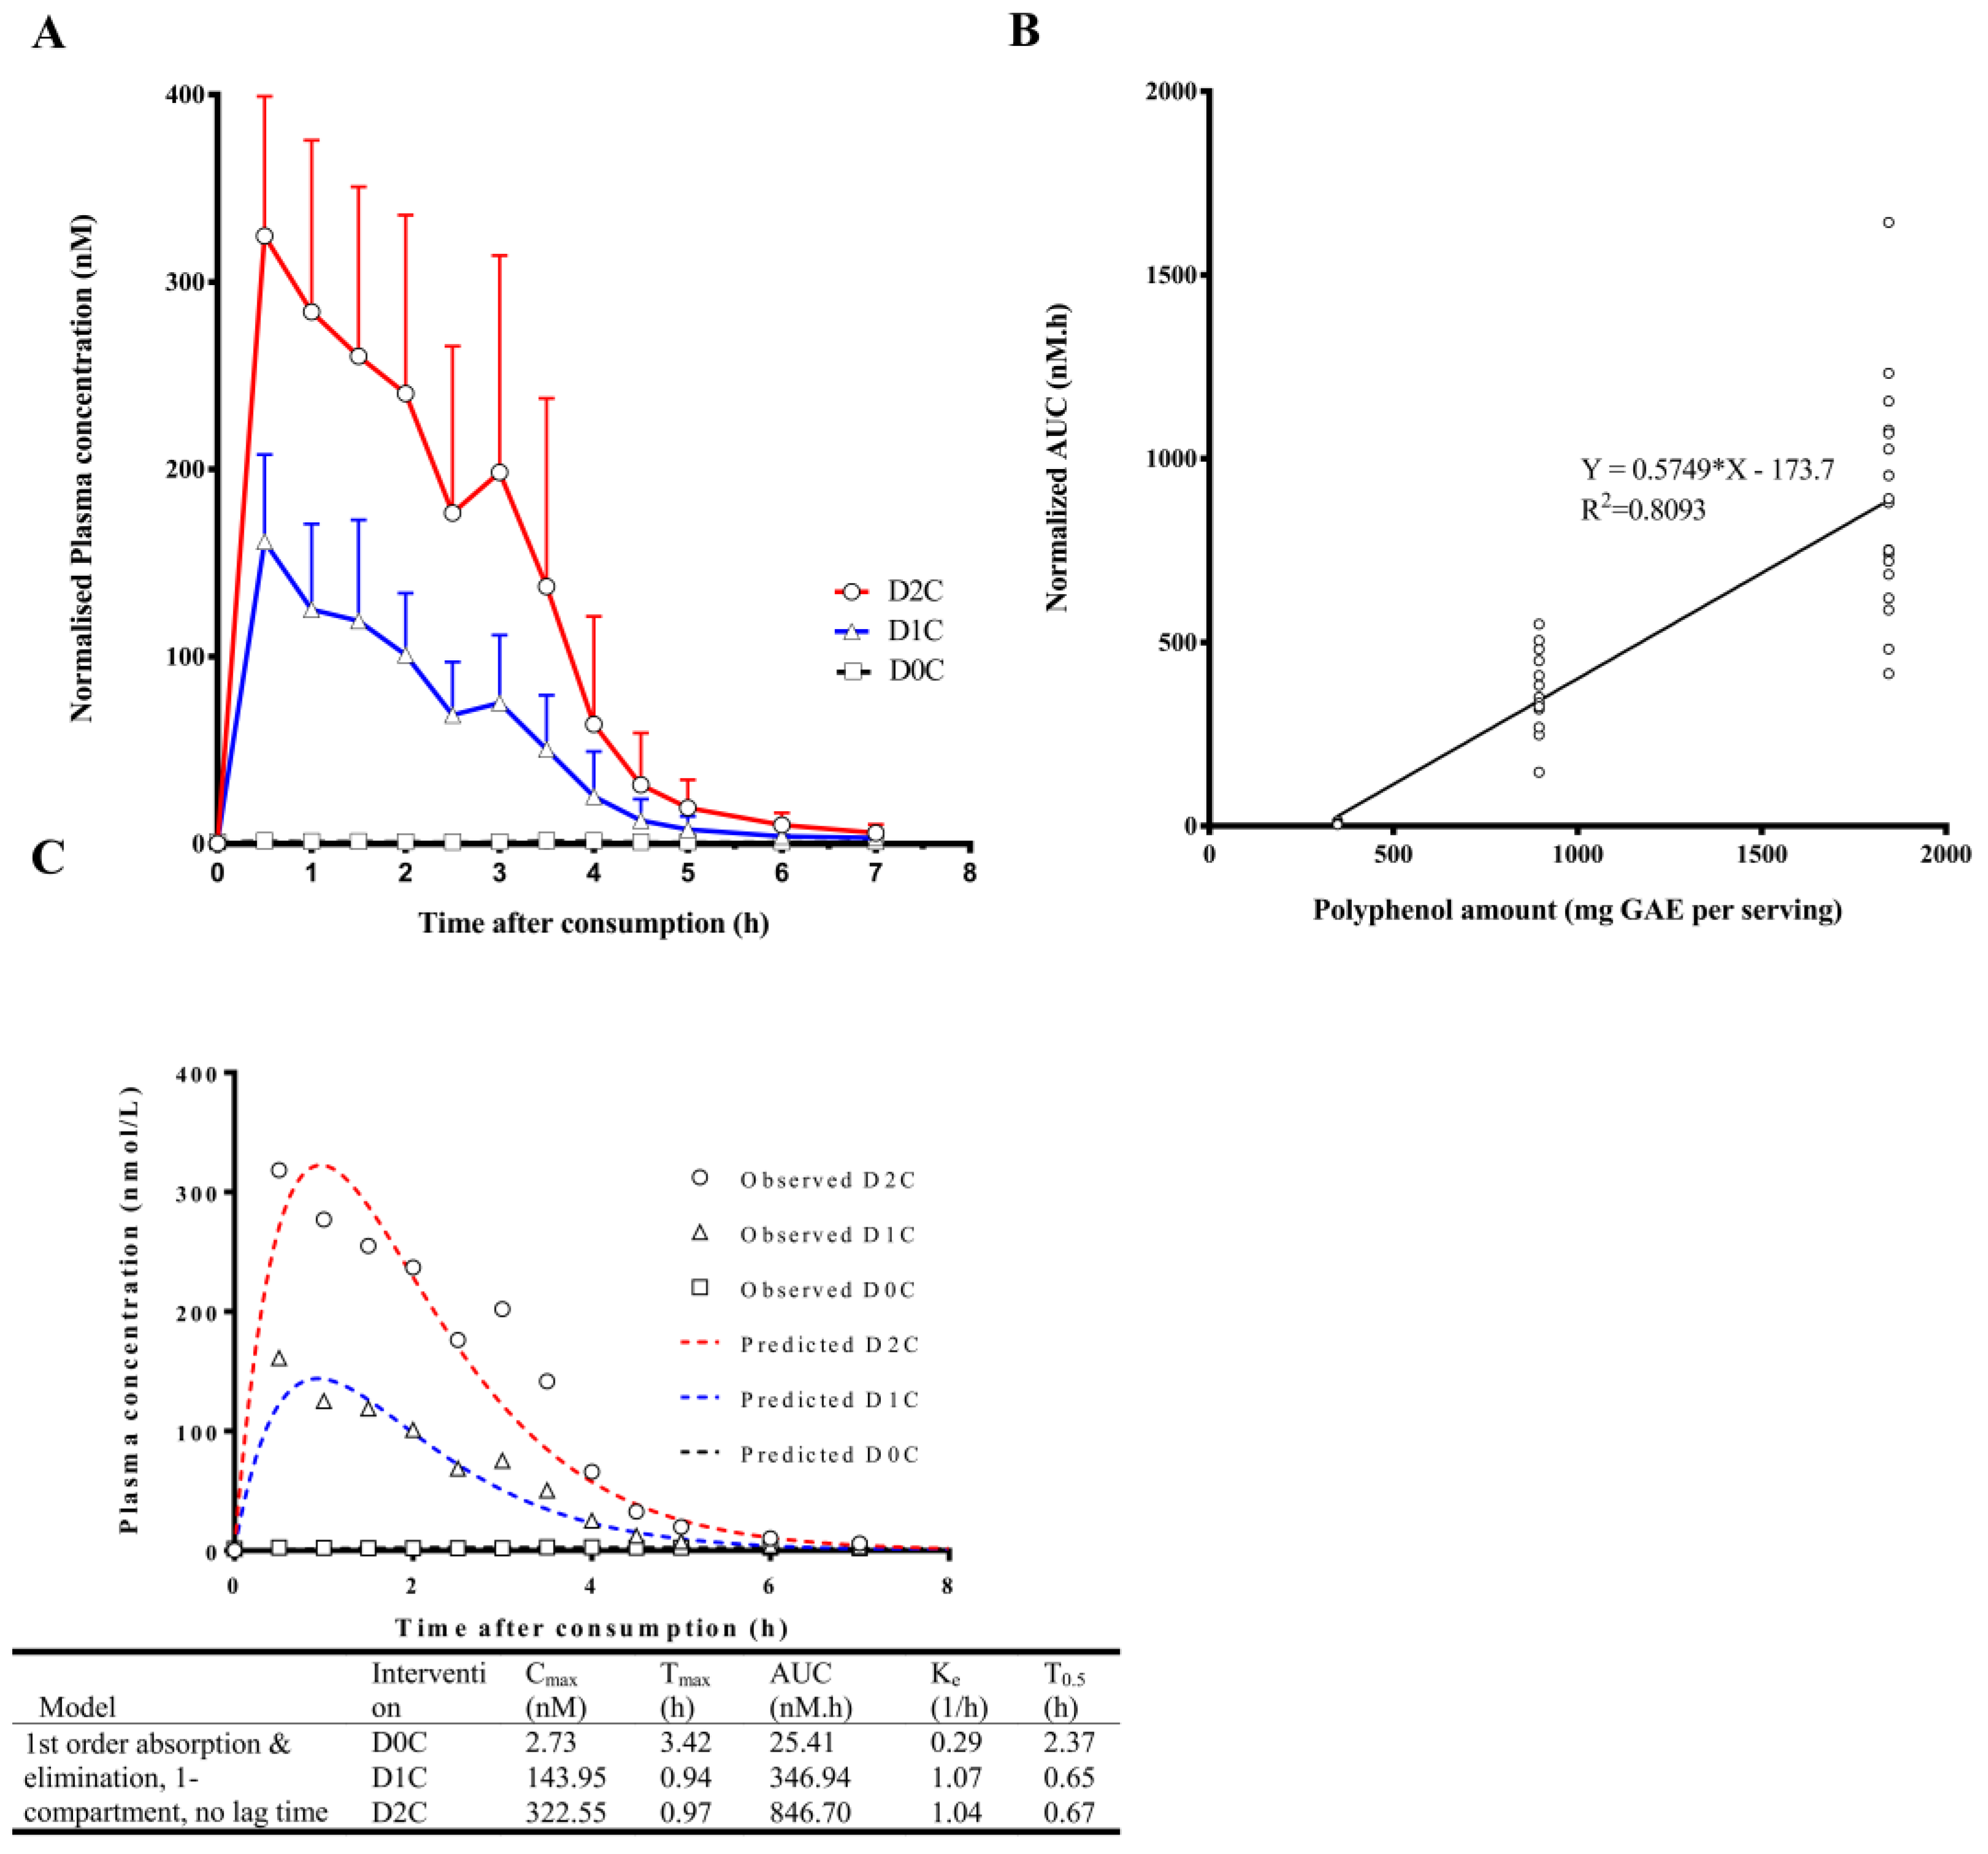
| Cinnamic acid (CNA) * | 2.4 ± 0.7 | 164.4 ± 47.7 | 342.0 ± 83.0 | 2.8 ± 1.9 | 0.7 ± 0.4 | 1.4 ± 1.2 | 8.4 ± 3.4 | 376.1 ± 104.7 | 875.7 ± 291.9 |
© 2018 by the authors. Licensee MDPI, Basel, Switzerland. This article is an open access article distributed under the terms and conditions of the Creative Commons Attribution (CC BY) license (http://creativecommons.org/licenses/by/4.0/).
Share and Cite
Haldar, S.; Lee, S.H.; Tan, J.J.; Chia, S.C.; Henry, C.J.; Chan, E.C.Y. Dose-Dependent Increase in Unconjugated Cinnamic Acid Concentration in Plasma Following Acute Consumption of Polyphenol Rich Curry in the Polyspice Study. Nutrients 2018, 10, 934. https://doi.org/10.3390/nu10070934
Haldar S, Lee SH, Tan JJ, Chia SC, Henry CJ, Chan ECY. Dose-Dependent Increase in Unconjugated Cinnamic Acid Concentration in Plasma Following Acute Consumption of Polyphenol Rich Curry in the Polyspice Study. Nutrients. 2018; 10(7):934. https://doi.org/10.3390/nu10070934
Chicago/Turabian StyleHaldar, Sumanto, Sze Han Lee, Jun Jie Tan, Siok Ching Chia, Christiani Jeyakumar Henry, and Eric Chun Yong Chan. 2018. "Dose-Dependent Increase in Unconjugated Cinnamic Acid Concentration in Plasma Following Acute Consumption of Polyphenol Rich Curry in the Polyspice Study" Nutrients 10, no. 7: 934. https://doi.org/10.3390/nu10070934
APA StyleHaldar, S., Lee, S. H., Tan, J. J., Chia, S. C., Henry, C. J., & Chan, E. C. Y. (2018). Dose-Dependent Increase in Unconjugated Cinnamic Acid Concentration in Plasma Following Acute Consumption of Polyphenol Rich Curry in the Polyspice Study. Nutrients, 10(7), 934. https://doi.org/10.3390/nu10070934